Different Trends in Microbial Contamination between Two Types of Microfiltered Water Dispensers: From Risk Analysis to Consumer Health Preservation


Abstract
:
1. Introduction
2. Methods
2.1. MWD Characteristics and Operating Measures
2.2. Collection of Water Samples
2.3. Microbiological Analyses
2.4. Statistical Analysis
3. Results
4. Discussion
5. Conclusions
Author Contributions
Funding
Acknowledgments
Conflicts of Interest
References
- Liguori, G.; Cavallotti, I.; Arnese, A.; Amiranda, C.; Anastasi, D.; Angelillo, I.F. Microbiological quality of drinking water from dispenser in Italy. BMC Microbiol. 2010, 10, 19. [Google Scholar] [CrossRef] [PubMed]
- Marzano, M.A.; Balzaretti, C.M. Preliminary investigation on the bacteriological quality of microfiltered drinking water dispensers in catering establishments. Ital. J. Food Saf. 2001, 1, 61–65. [Google Scholar] [CrossRef]
- Siddiqi, K.S.; Husen, A.; Rao, R.A.K. A review on biosynthesis of silver nanoparticles and their biocidal properties. J. Nanobiotechnol. 2018, 16, 14. [Google Scholar] [CrossRef] [PubMed] [Green Version]
- Das, R.; Gang, S.; Nath, S.S. Preparation and antibacterial activity of silver nanoparticles. J. Biomater. Nanobiotechnol. 2011, 2, 472–475. [Google Scholar] [CrossRef]
- Ministerial Decree 07.02.2012, n. 25. Technical Provisions Concerning Equipment for the Treatment of Water for Human Consumption. OJ General Series n. 69 of 22.03.2012. (Decreto Ministeriale 07.02.2012, n. 25. Disposizioni Tecniche Concernenti Apparecchiature Finalizzate al Trattamento Dell’acqua Destinata al Consumo Umano. G.U. Serie Generale n. 69 del 22.03.2012). Available online: https://www.physico.eu/pdf/d-m-7-febbraio-2012-n-25.pdf (accessed on 5 November 2018).
- Garvey, M.; Rabbitt, D.; Rowan, A.N. Pulsed ultraviolet light inactivation of Pseudomonas aeruginosa and Staphylococcus aureus biofilms. Water Environ. J. 2015, 29, 36–42. [Google Scholar] [CrossRef]
- Okpara, C.G.; Oparaku, N.F.; Ibeto, C.N. An overview of water disinfection in developing countries and potentials of renewable energy. J. Environ. Sci. Technol. 2001, 4, 18–30. [Google Scholar] [CrossRef]
- Tingpej, P.; Tiengtip, R.; Kondo, S. Decontamination efficacy of ultraviolet radiation against biofilms of common nosocomial bacteria. J. Med. Assoc. 2015, 98, 582–588. [Google Scholar]
- Rutala, W.A.; Weber, D.J. Are room decontamination units needed to prevent transmission of environmental pathogens. Infect. Control Hosp. Epidemiol. 2011, 32, 743–747. [Google Scholar] [CrossRef]
- Walker, J.T.; Marsh, P.D. Microbial biofilm formation in DUWS and their control using disinfectants. J. Dent. 2007, 35, 721–730. [Google Scholar] [CrossRef]
- Douterelo, I.; Jackson, M.; Solomon, C.; Boxall, J. Microbial analysis of in situ biofilm formation in drinking water distribution systems: Implications for monitoring and control of drinking water quality. Appl. Microbiol. Biotechnol. 2016, 100, 3301–3311. [Google Scholar] [CrossRef]
- Momba, M.N.B.; Kfir, R.; Venter, S.N.; Cloete, T.E. An overview of biofilm formation in distribution systems and its impact on the deterioration of water quality. Water SA 2000, 1, 59–66. [Google Scholar]
- Nelson, K.Y.; McMartin, D.W.; Yost, C.K.; Runtz, K.J.; Ono, T. Point of use water disinfection using UV light-emitting diodes to reduce bacterial contamination. Environ. Sci. Pollut. Res. Int. 2013, 20, 5441–5448. [Google Scholar] [CrossRef] [PubMed]
- Szymańska, J. Bacterial decontamination of DUWL biofilm using Oxygenal 6. Ann. Agric. Environ. Med. 2006, 13, 163–167. [Google Scholar] [PubMed]
- Costerton, J.W.; Stewart, P.S.; Greenberg, E.P. Bacterial biofilms: A common cause of persistent infections. Science 1999, 284, 1318–1322. [Google Scholar] [CrossRef] [PubMed]
- Oliveira, N.M.; Martinez-Garcia, E.; Xavier, J.; Durham, W.M.; Kolter, R.; Wook, K.; Foster, K.R. Biofilm Formation as a Response to Ecological Competition. PLoS Biol. 2015, 13, e1002191. [Google Scholar] [CrossRef] [PubMed]
- Stewart, P.S.; Costerton, J.W. Antibiotic resistance of bacteria in biofilms. Lancet 2001, 358, 135–138. [Google Scholar] [CrossRef]
- Roya, R.; Tiwaria, M.; Donelli, G.; Tiwaria, V. Strategies for combating bacterial biofilms: A focus on anti-biofilm agents and their mechanisms of action. Virulence 2018, 9, 522–554. [Google Scholar] [CrossRef] [PubMed]
- Legislative Decree 02.02.2001, n.31. Implementation of the Water Quality Directive 98/83/EC Relative to Water Quality Intended for Human Consumption. OJ. of the Italian Republic n. 52, 3.03.2001. (Decreto Legislativo 02.02.2001, n. 31. Attuazione Della Direttiva 98/83/CE Relativa alla Qualità delle Acque Destinate al Consumo Umano. G.U. della Repubblica Italiana n. 52, 3.03.2001). Available online: http://www.camera.it/parlam/leggi/deleghe/01031dl.htm (accessed on 4 November 2018).
- European Union. Council Directive 98/83/EC of 3 November 1998 on the quality of water intended for human consumption. Off. J. Eur. Communities 1998, 330, 32–54. [Google Scholar]
- Baumgartner, A.; Grand, M. Bacteriological quality of drinking water from dispensers (Coolers) and possible control measure. J. Food Prot. 2006, 69, 3043–3046. [Google Scholar] [CrossRef]
- Guidelines on Water Treatment Devices Spent on Human Consumption under the D.M. 7 February 2012, n. 25. Available online: http://www.salute.gov.it/imgs/C_17_pubblicazioni_1946_allegato.pdf (accessed on 4 November 2018).
- Chaberny, I.F.; Kaiser, P.; Sonntag, H.G. Can soda fountains be recommended in hospitals? Int. J. Hyg. Environ. Health 2006, 209, 471–475. Available online: https://0-www-ncbi-nlm-nih-gov.brum.beds.ac.uk/pubmed/16740412 (accessed on 4 November 2018). [CrossRef]
- Lévesque, B.; Simard, P.; Gauvin, D.; Gingras, S.; Dewailly, E.; Letarte, R. Comparison of the microbiological quality of water coolers and that of municipal water systems. Appl. Environ. Microbiol. 1994, 60, 1174–1178. [Google Scholar] [PubMed]
- Zanetti, F.; De Luca, G.; Sacchetti, R. Control of bacterial contamination in microfiltered water dispensers (MWDs) by disinfection. Int. J. Food Microbiol. 2009, 128, 446–452. [Google Scholar] [CrossRef] [PubMed]
- Regulation (EC) n. 852/2004 of the European Parliament and of the Council 29.04.2004, article 6, on the Hygiene of Foodstuffs (GU l 139 of 30.4.2004, pag 1) (Regolamento (CE) n. 852/2004 del Parlamento Europeo e del Consiglio 29.04.2004, articolo 6, Sull’igiene dei Prodotti Alimentari (GU l 139 del 30.4.2004, pag. 1)). Available online: https://www.certifico.com/chemicals/legislazione-chemicals/264-legislazione-chemicals-food/4288-regolamento-ce-n-852-2004 (accessed on 6 November 2018).
- World Health Organization. Guidelines for Drinking-Water Quality. Available online: http://apps.who.int/iris/bitstream/10665/44584/1/9789241548151_eng.pdf (accessed on 5 November 2018).
- EN ISO 19458:2006—Water Quality—Sampling for Microbiological Analysis. Available online: https://www.iso.org/standard/33845.html (accessed on 29 December 2018).
- UNI EN ISO 6222:2001—Water Quality—Enumeration of Culturable Micro-Organisms—Colony Count by Inoculation in a Nutrient Agar Culture Medium, Geneva: International Organization for Standerdization. Available online: http://store.uni.com/catalogo/index.php/uni-en-iso-6222-2001.html (accessed on 7 November 2018).
- ISO 7899-2:2000 Water Quality—Detection and Enumeration of Intestinal Enterococci—Part 2: Membrane Filtration Method. Available online: https://0-onlinelibrary-wiley-com.brum.beds.ac.uk/doi/full/10.1111/wej.12088 (accessed on 4 November 2018).
- UNI EN ISO 16266:2008—Water Quality—Detection and Enumeration of Pseudomonas aeruginosa—Method by Membrane Filtration. Available online: http://store.uni.com/catalogo/index.php/uni-en-iso-16266-2008.html?josso_back_to=http://store.uni.com/josso-security-check.php&josso_cmd=login_optional&josso_partnerapp_host=store.uni.com (accessed on 6 November 2018).
- UNI EN ISO 9308-1:2017 Water Quality—Enumeration of Escherichia coli and Coliform Bacteria—Part 1: Membrane Filtration Method for Waters with Low Bacterial Background Flora. Available online: http://store.uni.com/catalogo/index.php/uni-en-iso-9308-1-2017.html (accessed on 7 November 2018).
- ISO 16140-2:2016 Microbiology of the Food Chain—Method validation—Part 2: Protocol for the Validation of Alternative (Proprietary) Methods against a Reference Method. Available online: https://www.iso.org/standard/54870.html (accessed on 4 November 2018).
- Wauters, G.; Boel, A.; Voorn, G.P.; Verhaegen, J.; Meunier, F.; Janssens, M.; Verbist, J.L. Evaluation of a new identification system, Crystal Enteric/Non-Fermenter, for gram-negative bacilli. J. Clin. Microbiol. 1995, 33, 845–849. [Google Scholar]
- Ministerial Decree 14.06.2017. Implementation of Directive (EU) 2015/1787 Amending Annexes II and III of Directive 98/83/EC on the Quality of Water Intended for Human Consumption. Amendments to Annexes II and III of Legislative Decree 2 February 2001, n. 31. (17A05618) (GU General Series n.192 of 18-08-2017) (Decreto Ministeriale 14.06.2017 Recepimento Della Direttiva (UE) 2015/1787 che Modifica gli Allegati II e III Della Direttiva 98/83/CE Sulla Qualità Delle Acque Destinate al Consumo Umano. Modifica Degli Allegati II e III del decreto legislativo 2 febbraio 2001, n. 31. (17A05618) (GU Serie Generale n.192 del 18-08-2017). Available online: https://www.google.com/url?sa=t&rct=j&q=&esrc=s&source=web&cd=3&ved=2ahUKEwis_Nm09ZTfAhUKw4sKHRPbAFAQFjACegQIAhAC&url=http%3A%2F%2Fwww.ceirsa.org%2Ffd.php%3Fpath%3D201710%2FDM_14_06_2017Acque_destinate_al_consumo_umano.pdf&usg=AOvVaw3eguX4JKnVJArmnYdE1oVD (accessed on 5 November 2018).
- Commission Directive (EU) 2015/1787 of 06.10.2015 Amending Annexes II and III to Council Directive 98/83/EC on the Quality of Water Intended for Human Consumption. Available online: https://eur-lex.europa.eu/legal-content/EN/TXT/?uri=uriserv%3AOJ.L_.2015.260.01.0006.01.ENG (accessed on 7 November 2018).
- Legislative Decree 09.04.2008, n.81. Implementation of Article 1 of the Law of 3 August 2007, n. 123, Concerning the Protection of Health and Safety in the Workplace. OJ. General Series n.101 of 30-04-2008—Suppl. Ordinary n. 108 (Decreto Legislativo 09.04.2008, n. 81. Attuazione dell’articolo 1 della legge 3 agosto 2007, n. 123, in Materia di Tutela Della Salute e Della Sicurezza nei Luoghi di Lavoro. GU Serie Generale n.101 del 30-04-2008—Suppl. Ordinario n. 108). Available online: https://community.intelex.com/library/peer-resources/italy-legislative-decree-9-april-2008-n-81-1 (accessed on 4 November 2018).
- Zannetti, F.; de Luca, G.; Leoni, E.; Sacchetti, R. Occurrence of non-fermenting gram negative bacteria in drinking water dispensed from point-of-use microfiltration devices. Ann. Agric. Environ. Med. 2014, 21, 29–34. [Google Scholar]
- Lubart, R.; Lipovski, A.; Nitzan, Y.; Friedmann, H. A possible mechanism for the bactericidal effect or visible light. Laser Ther. 2011, 20, 17–22. [Google Scholar] [CrossRef] [PubMed]
- Kuo, J.; Chen, C.; Nellor, M. Standardized Collimated Beam Testing Protocol for Water/Wastewater Ultraviolet Disinfection. J. Environ. Eng. 2003, 129, 774–779. [Google Scholar] [CrossRef]
- Zlatanovic, L.; van der Hoek, J.P.; Vreeburg, J.H.G. An experimental study on the influence of water stagnation and temperature change on water quality in a full-scale domestic drinking water system. Water Res. 2017, 123, 761–772. [Google Scholar] [CrossRef] [PubMed]
- Amanidaz, N.; Zafarzadeh, A.; Mahvi, A.H. The Interaction between Heterotrophic Bacteria and Coliform, Fecal Coliform, Fecal Streptococci Bacteria in the Water Supply Networks. Iran. J. Public Health 2015, 44, 1685–1692. [Google Scholar] [PubMed]
- Lin, S.; Svoboda, K.; Giletto, A.; Seibert, J.; Puttaiah, R. Effects of hydrogen peroxide on dental unit biofilms and treatment water contamination. Eur. J. Dent. 2011, 5, 47–59. [Google Scholar]
- West, A.; Tesla, P.; Lineback, C.; Oliver, H. Strain, disinfectant, concentration and contact time quantitatively impact disinfectant efficacy. Antimicrob. Resist. Infect. Control 2018, 7, 49. [Google Scholar] [CrossRef]


| Sampling Point | Type of Analysis | Positive Samples | Positive Samples (%) | Log cfu/mL ± SD | Log cfu/100 mL ± SD | Reference Value * |
|---|---|---|---|---|---|---|
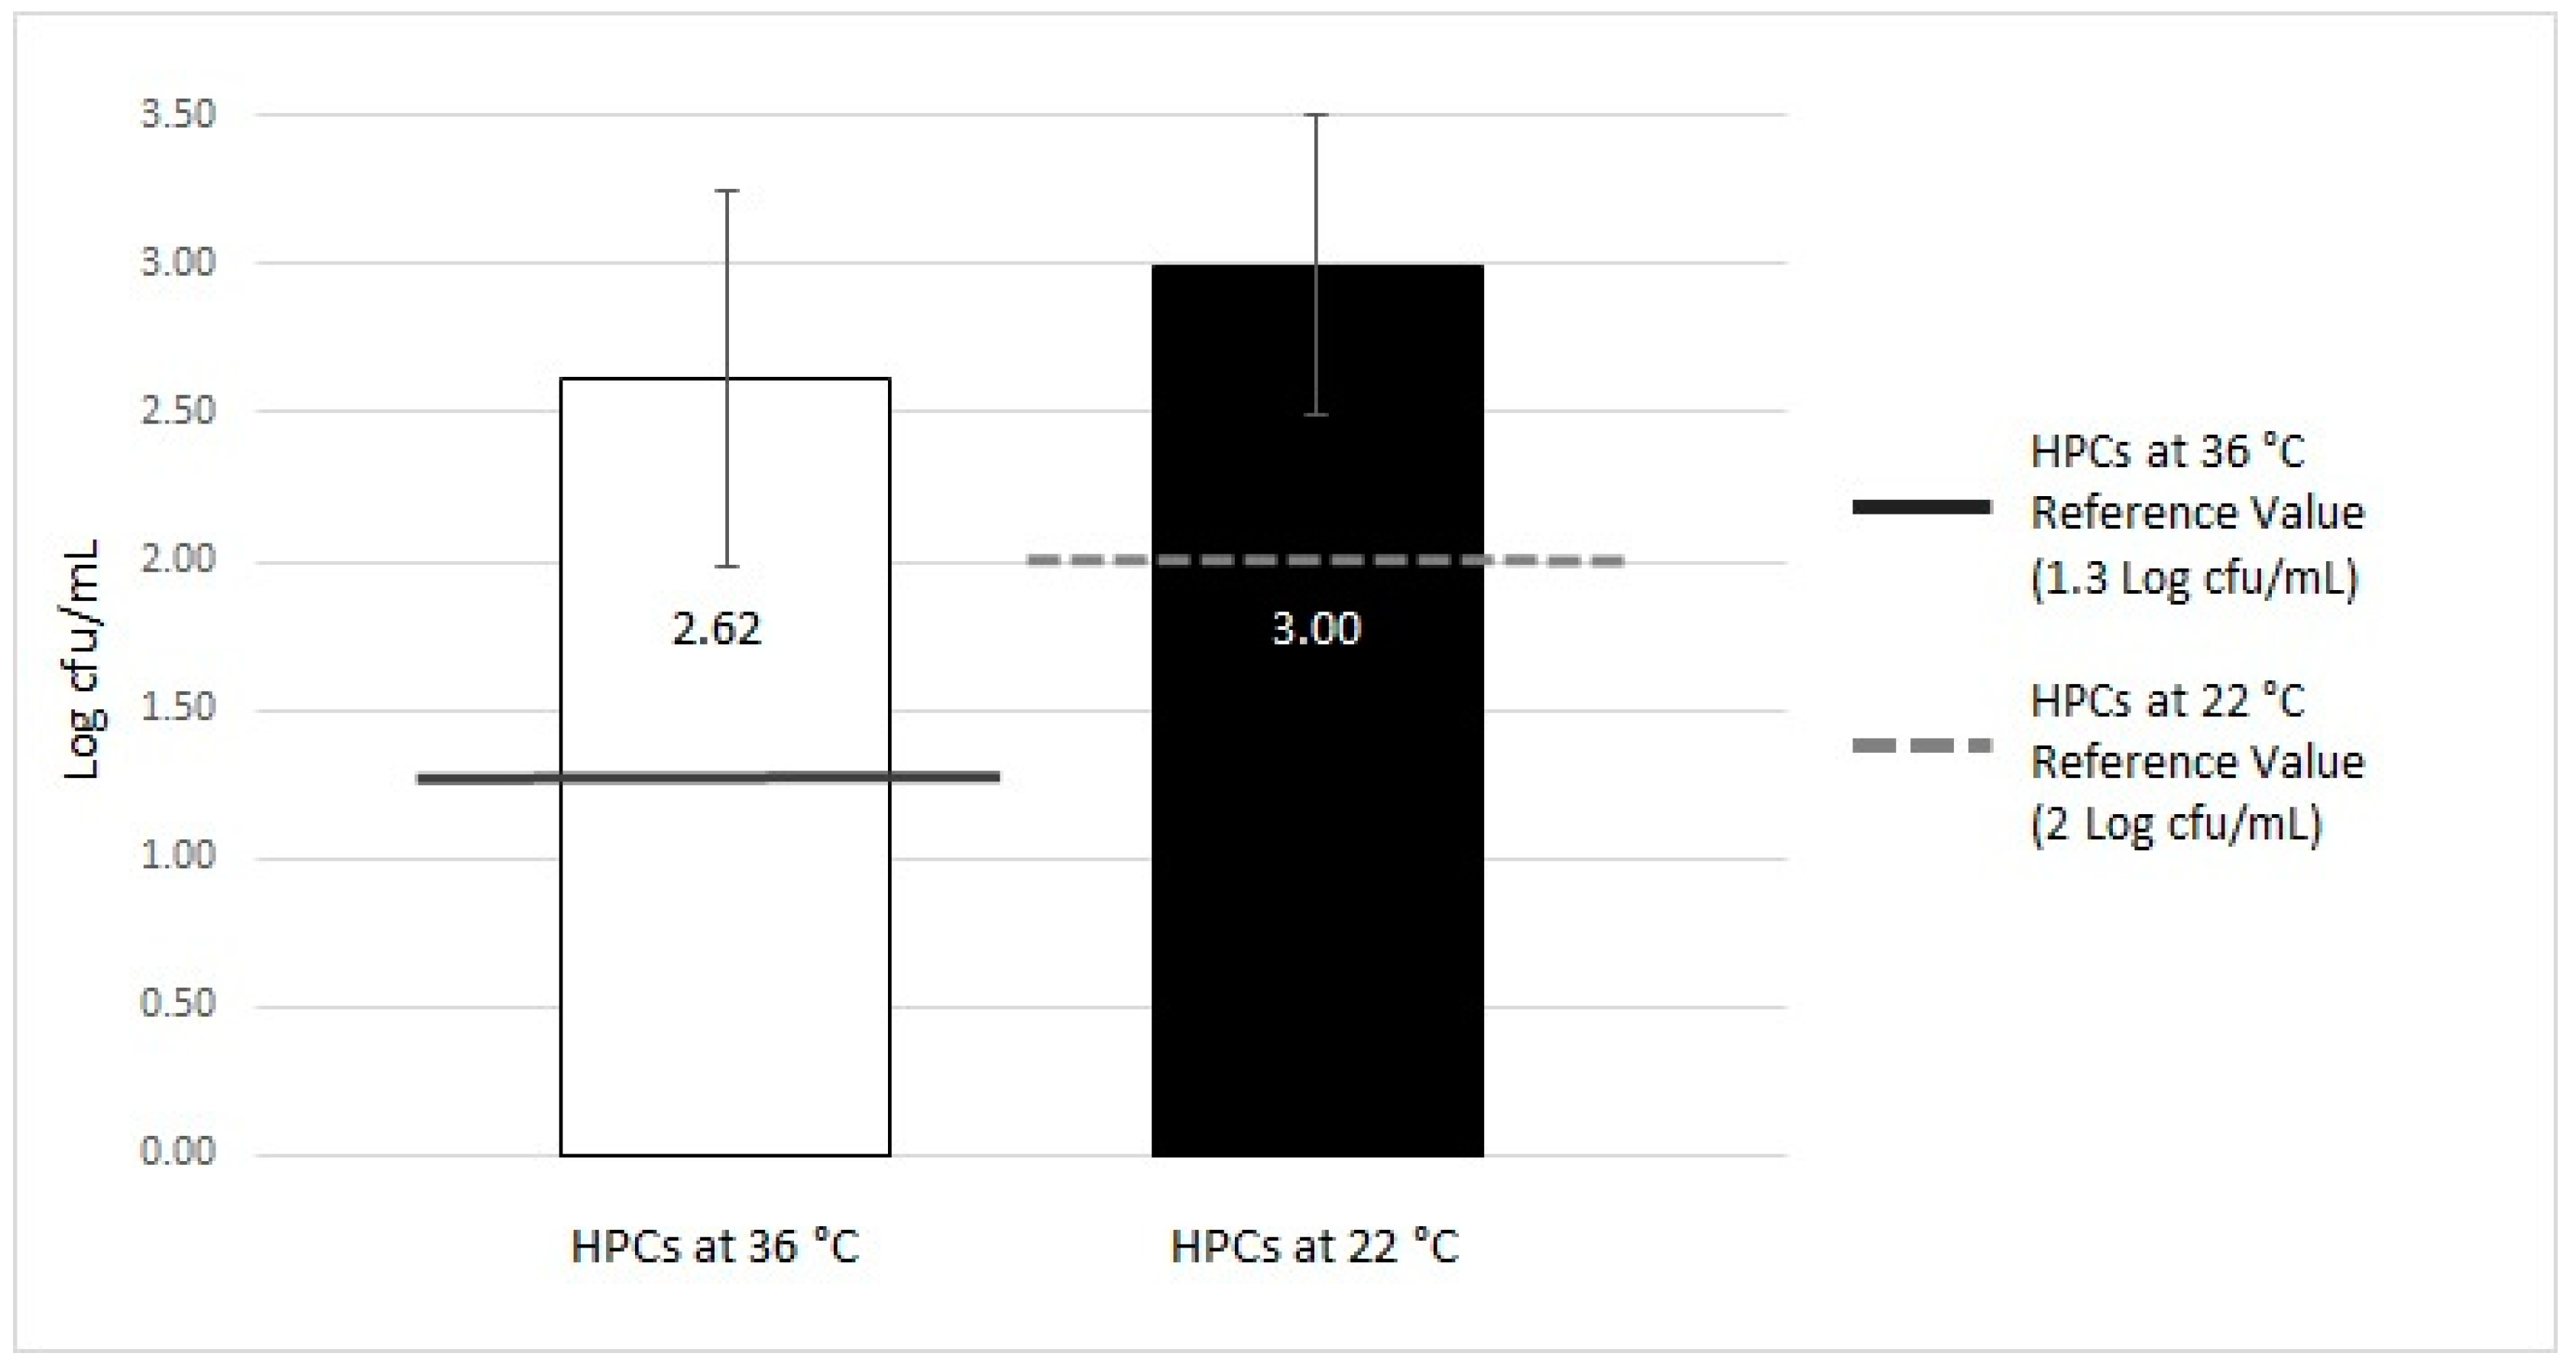
| Positive Samples n = 93 | HPCs at 36 °C | 73/93 | 78.49 | 2.62 ± 0.64 | 1.3 Log cfu/mL | |
| HPCs at 22 °C | 34/93 | 36.56 | 3.00 ± 0.50 | 2 Log cfu/mL | ||
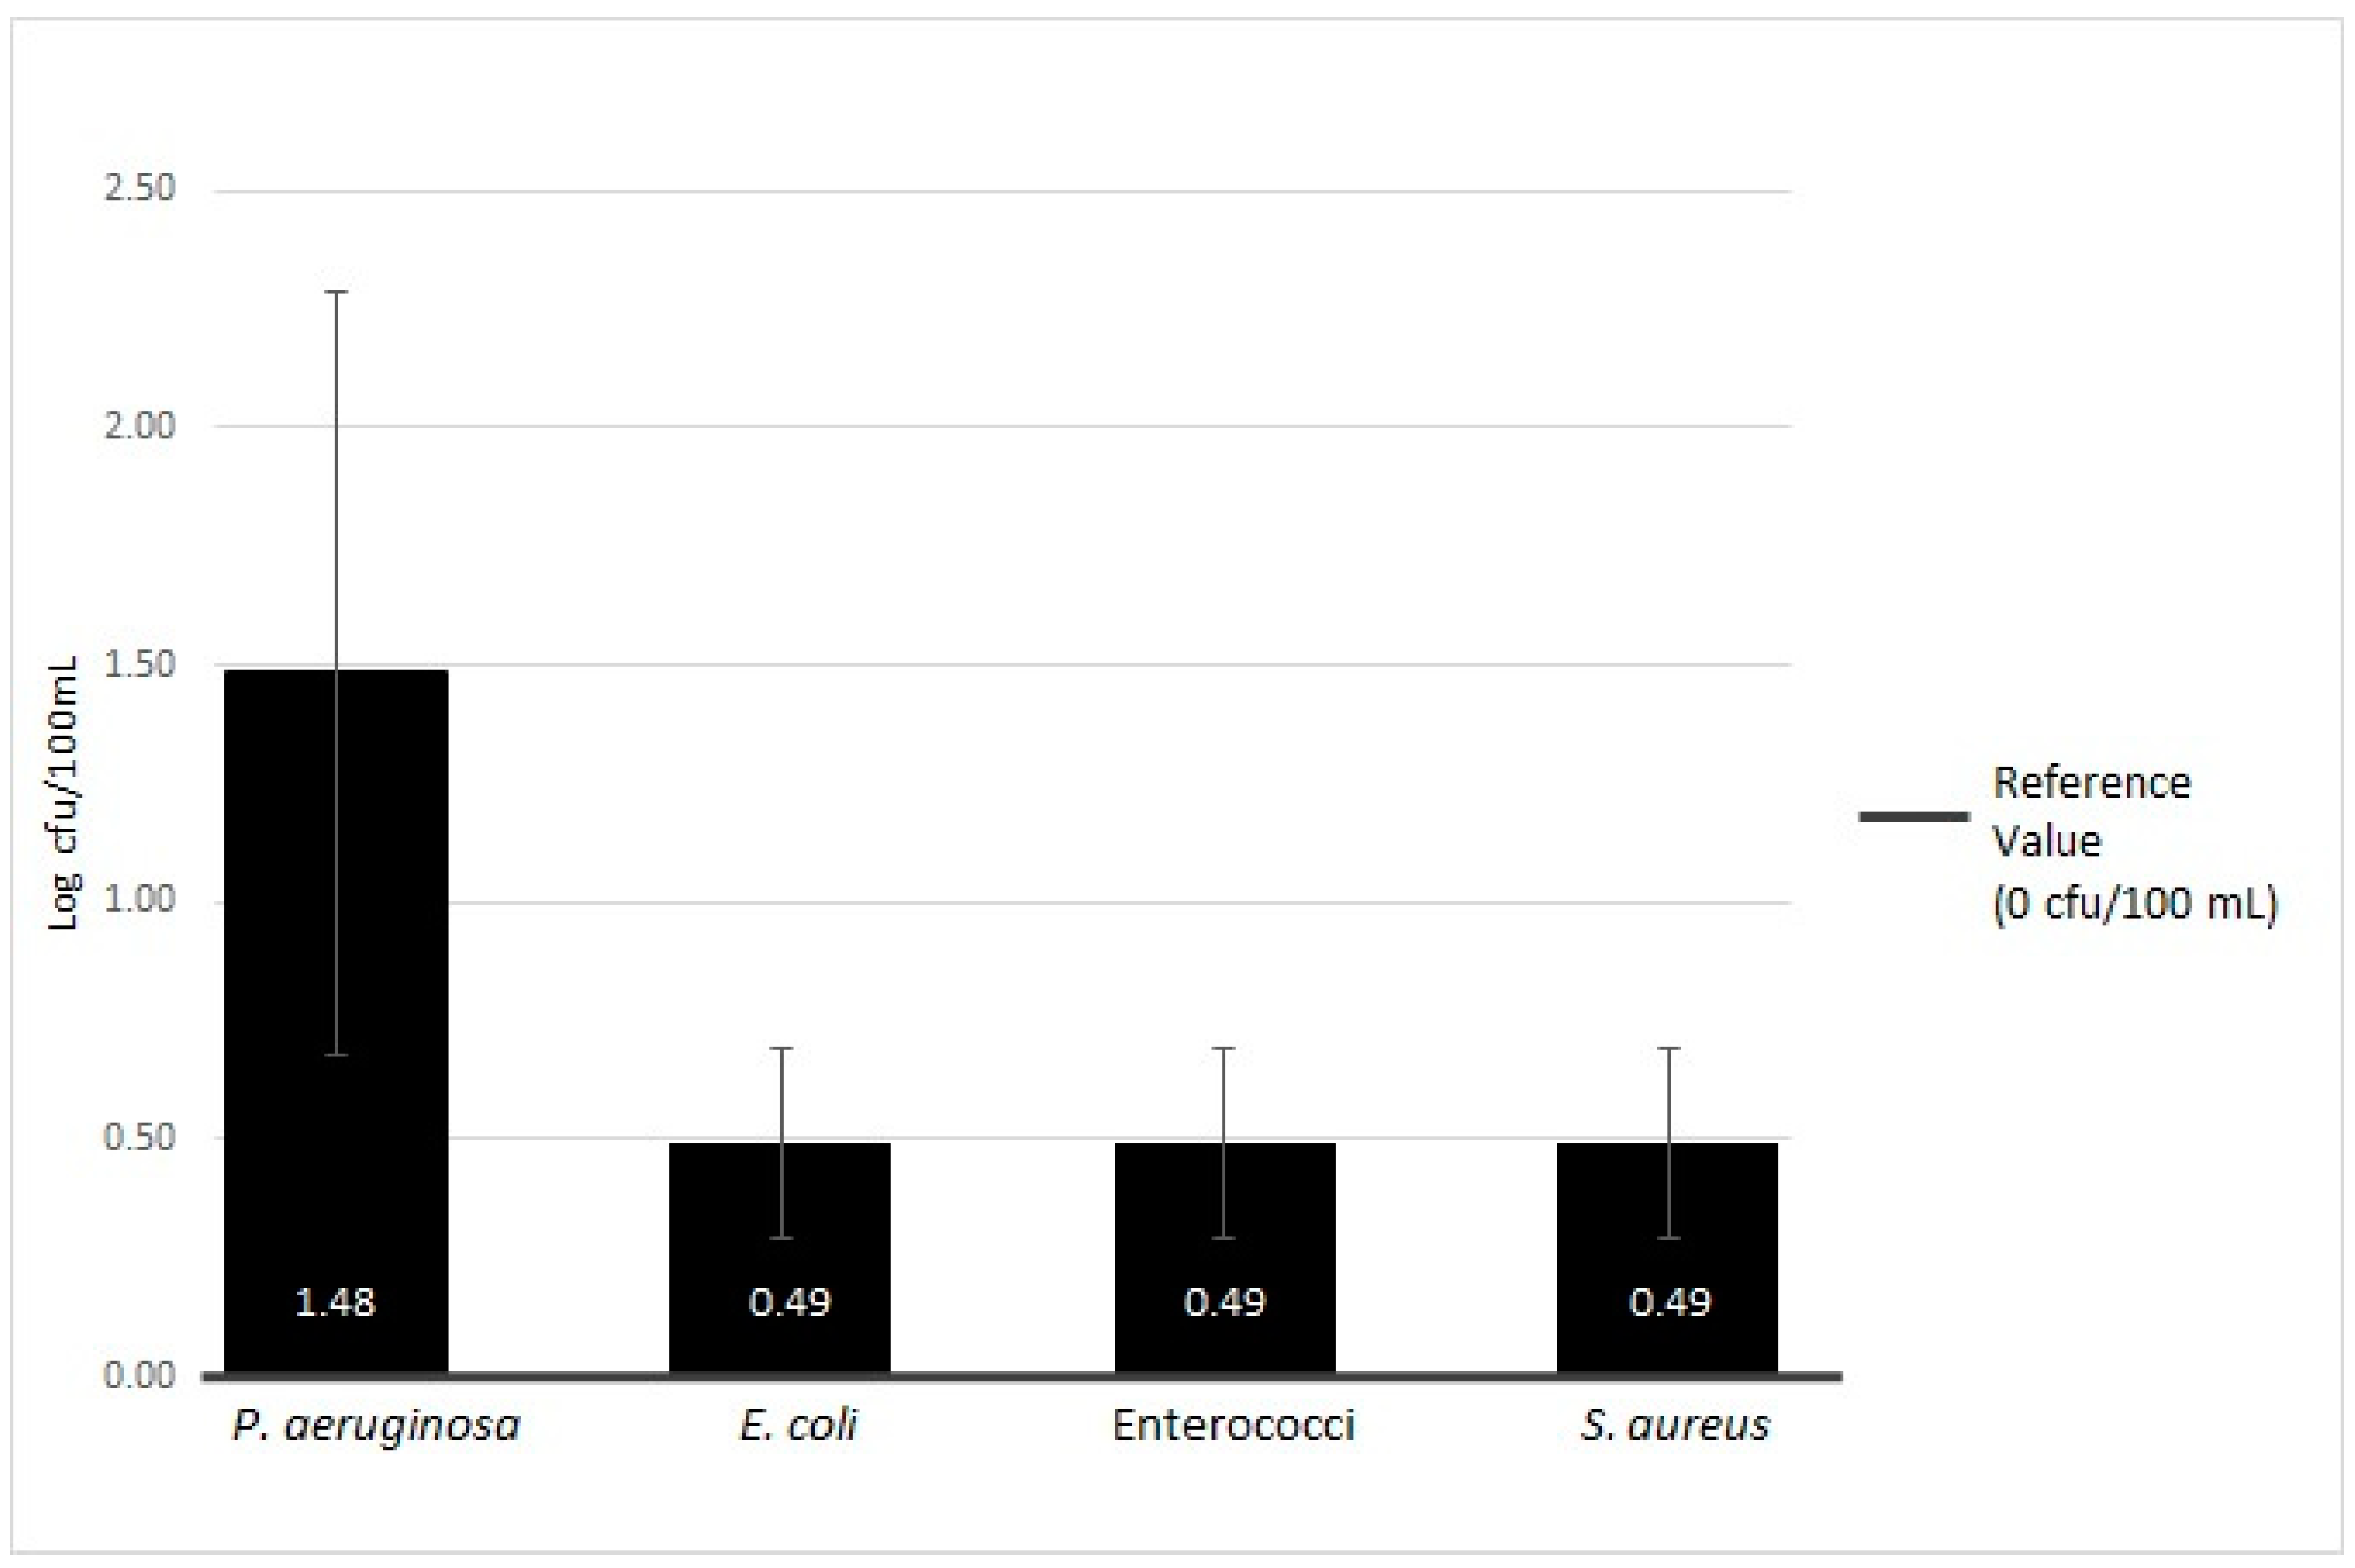
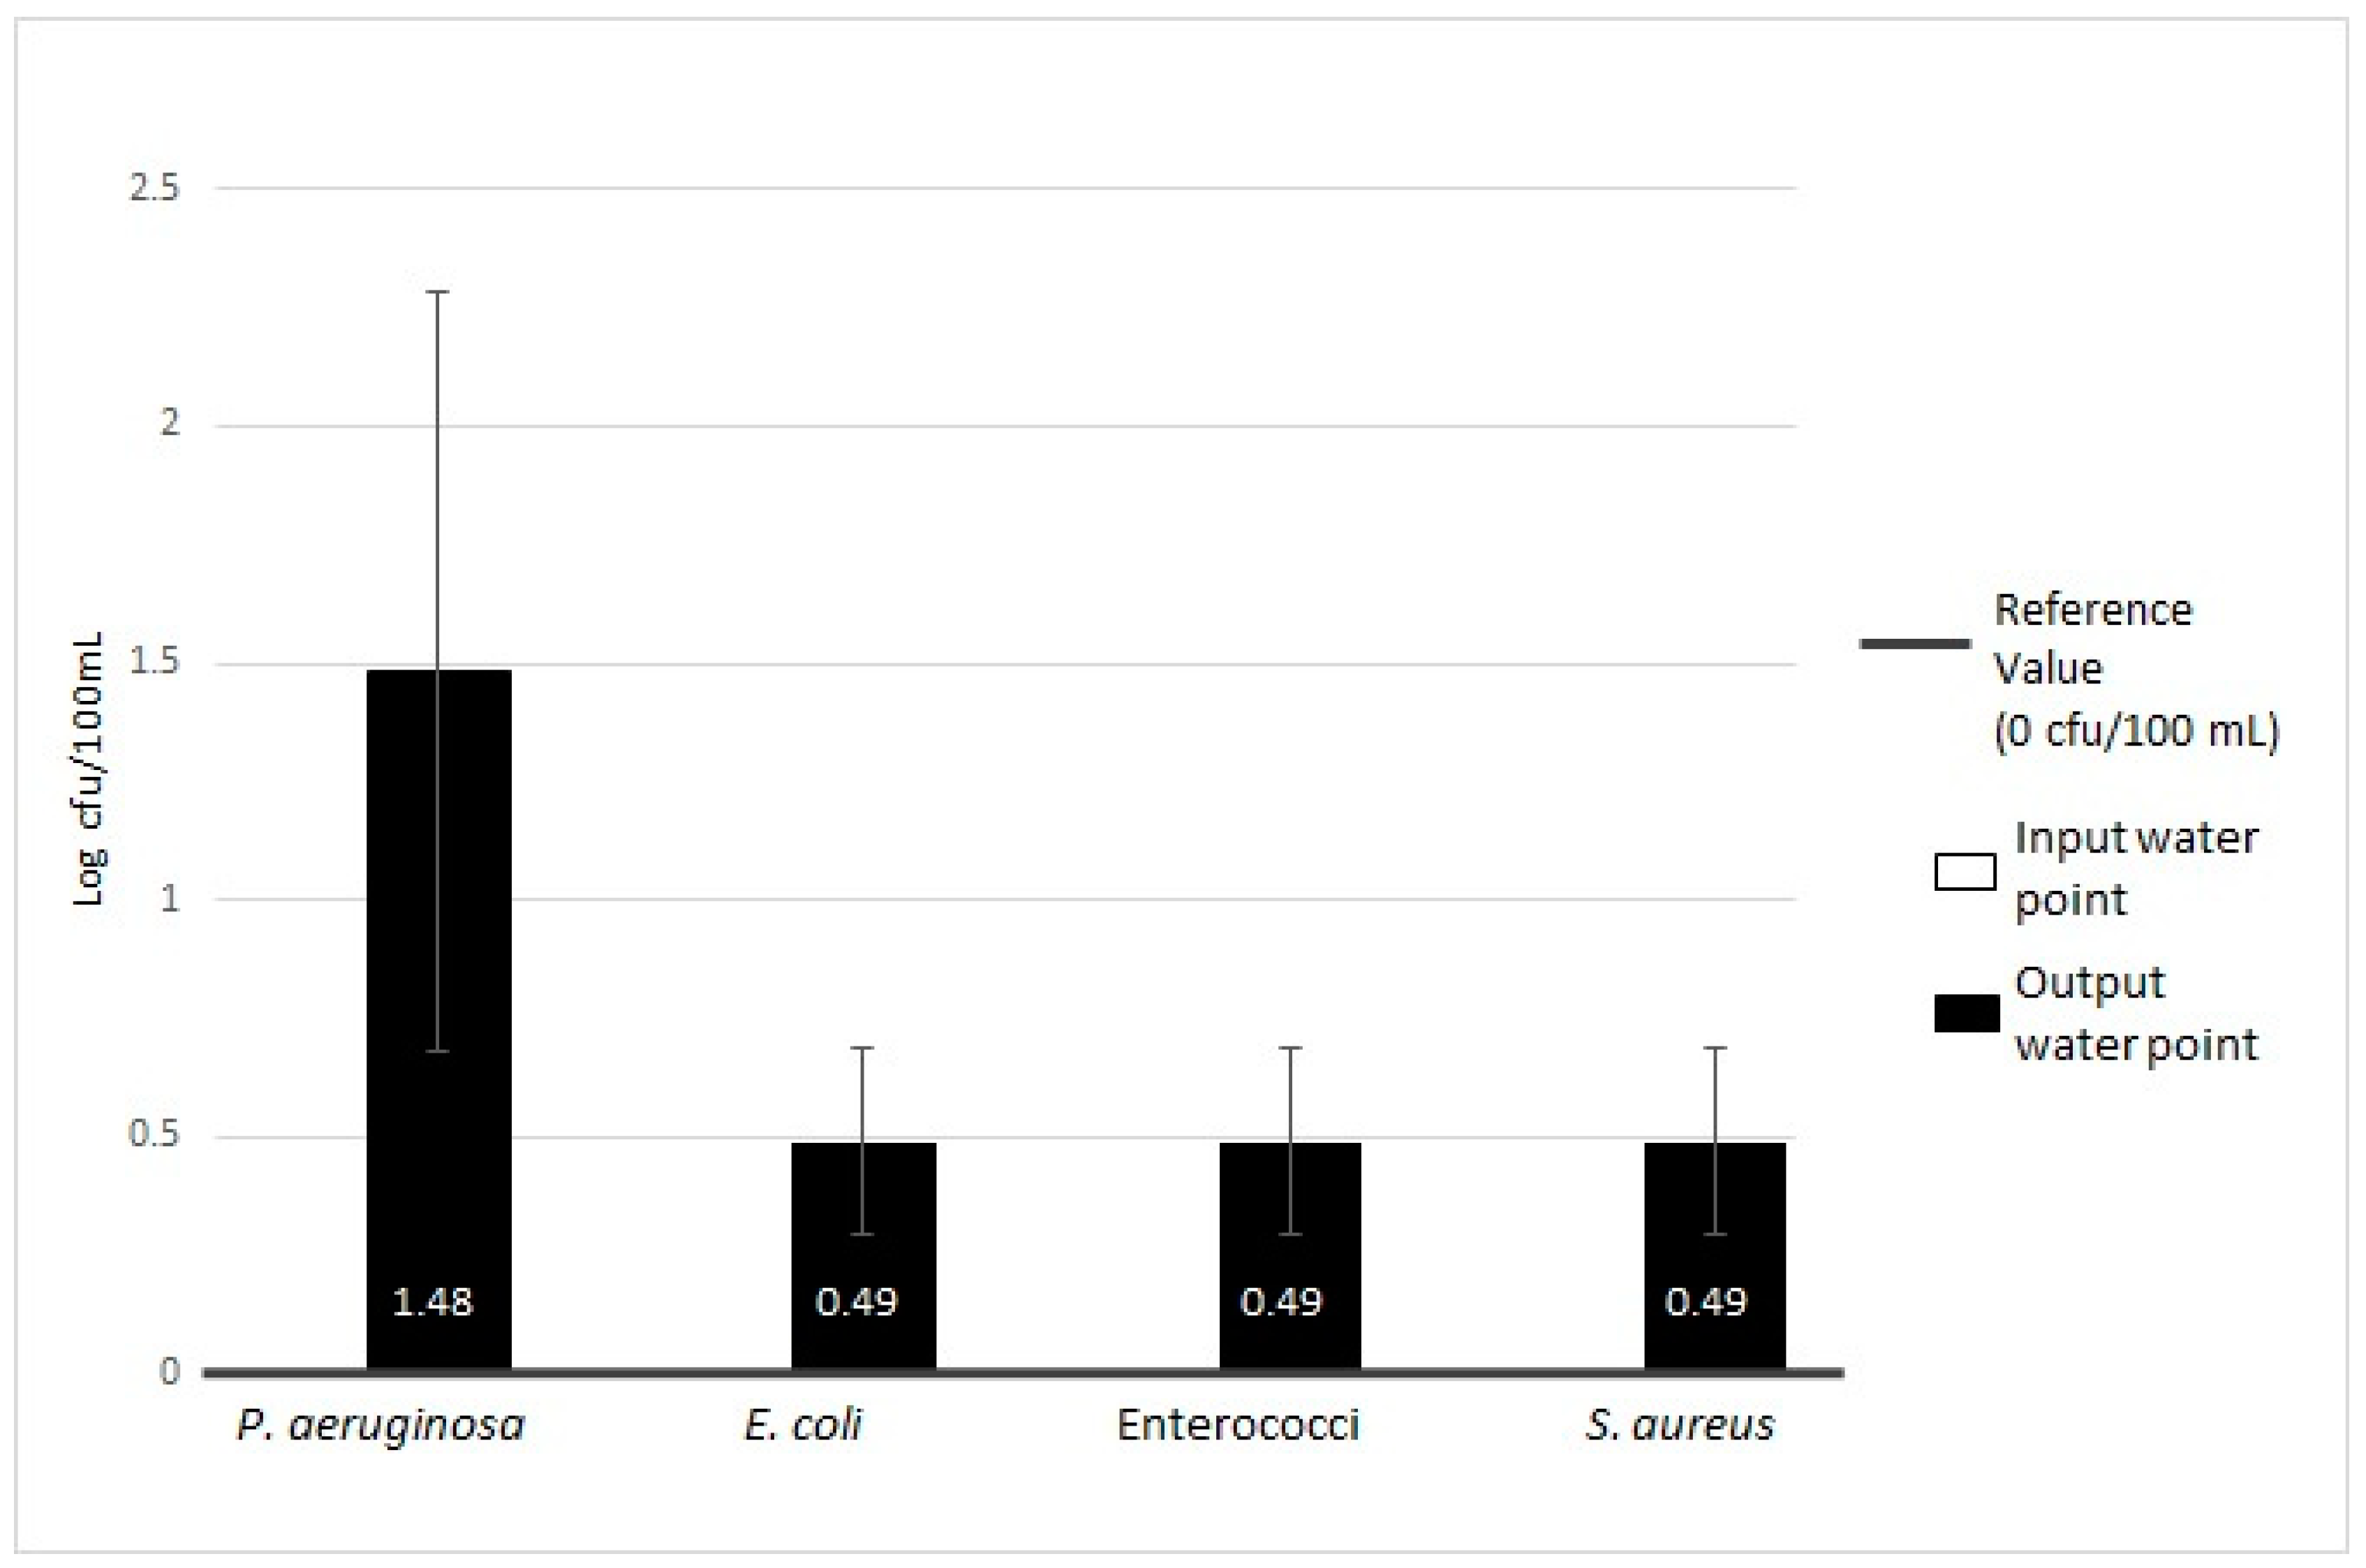
| Pseudomonas aeruginosa | 20/93 | 21.51 | 1.48 ± 0.80 | 0 Log cfu/100 mL | ||
| Other pathogenic microorganisms (Enterococci, Escherichia coli, and Staphylococcus aureus) | 3/93 | 3.23 | 0.49 ± 0.20 | 0 Log cfu/100 mL | ||
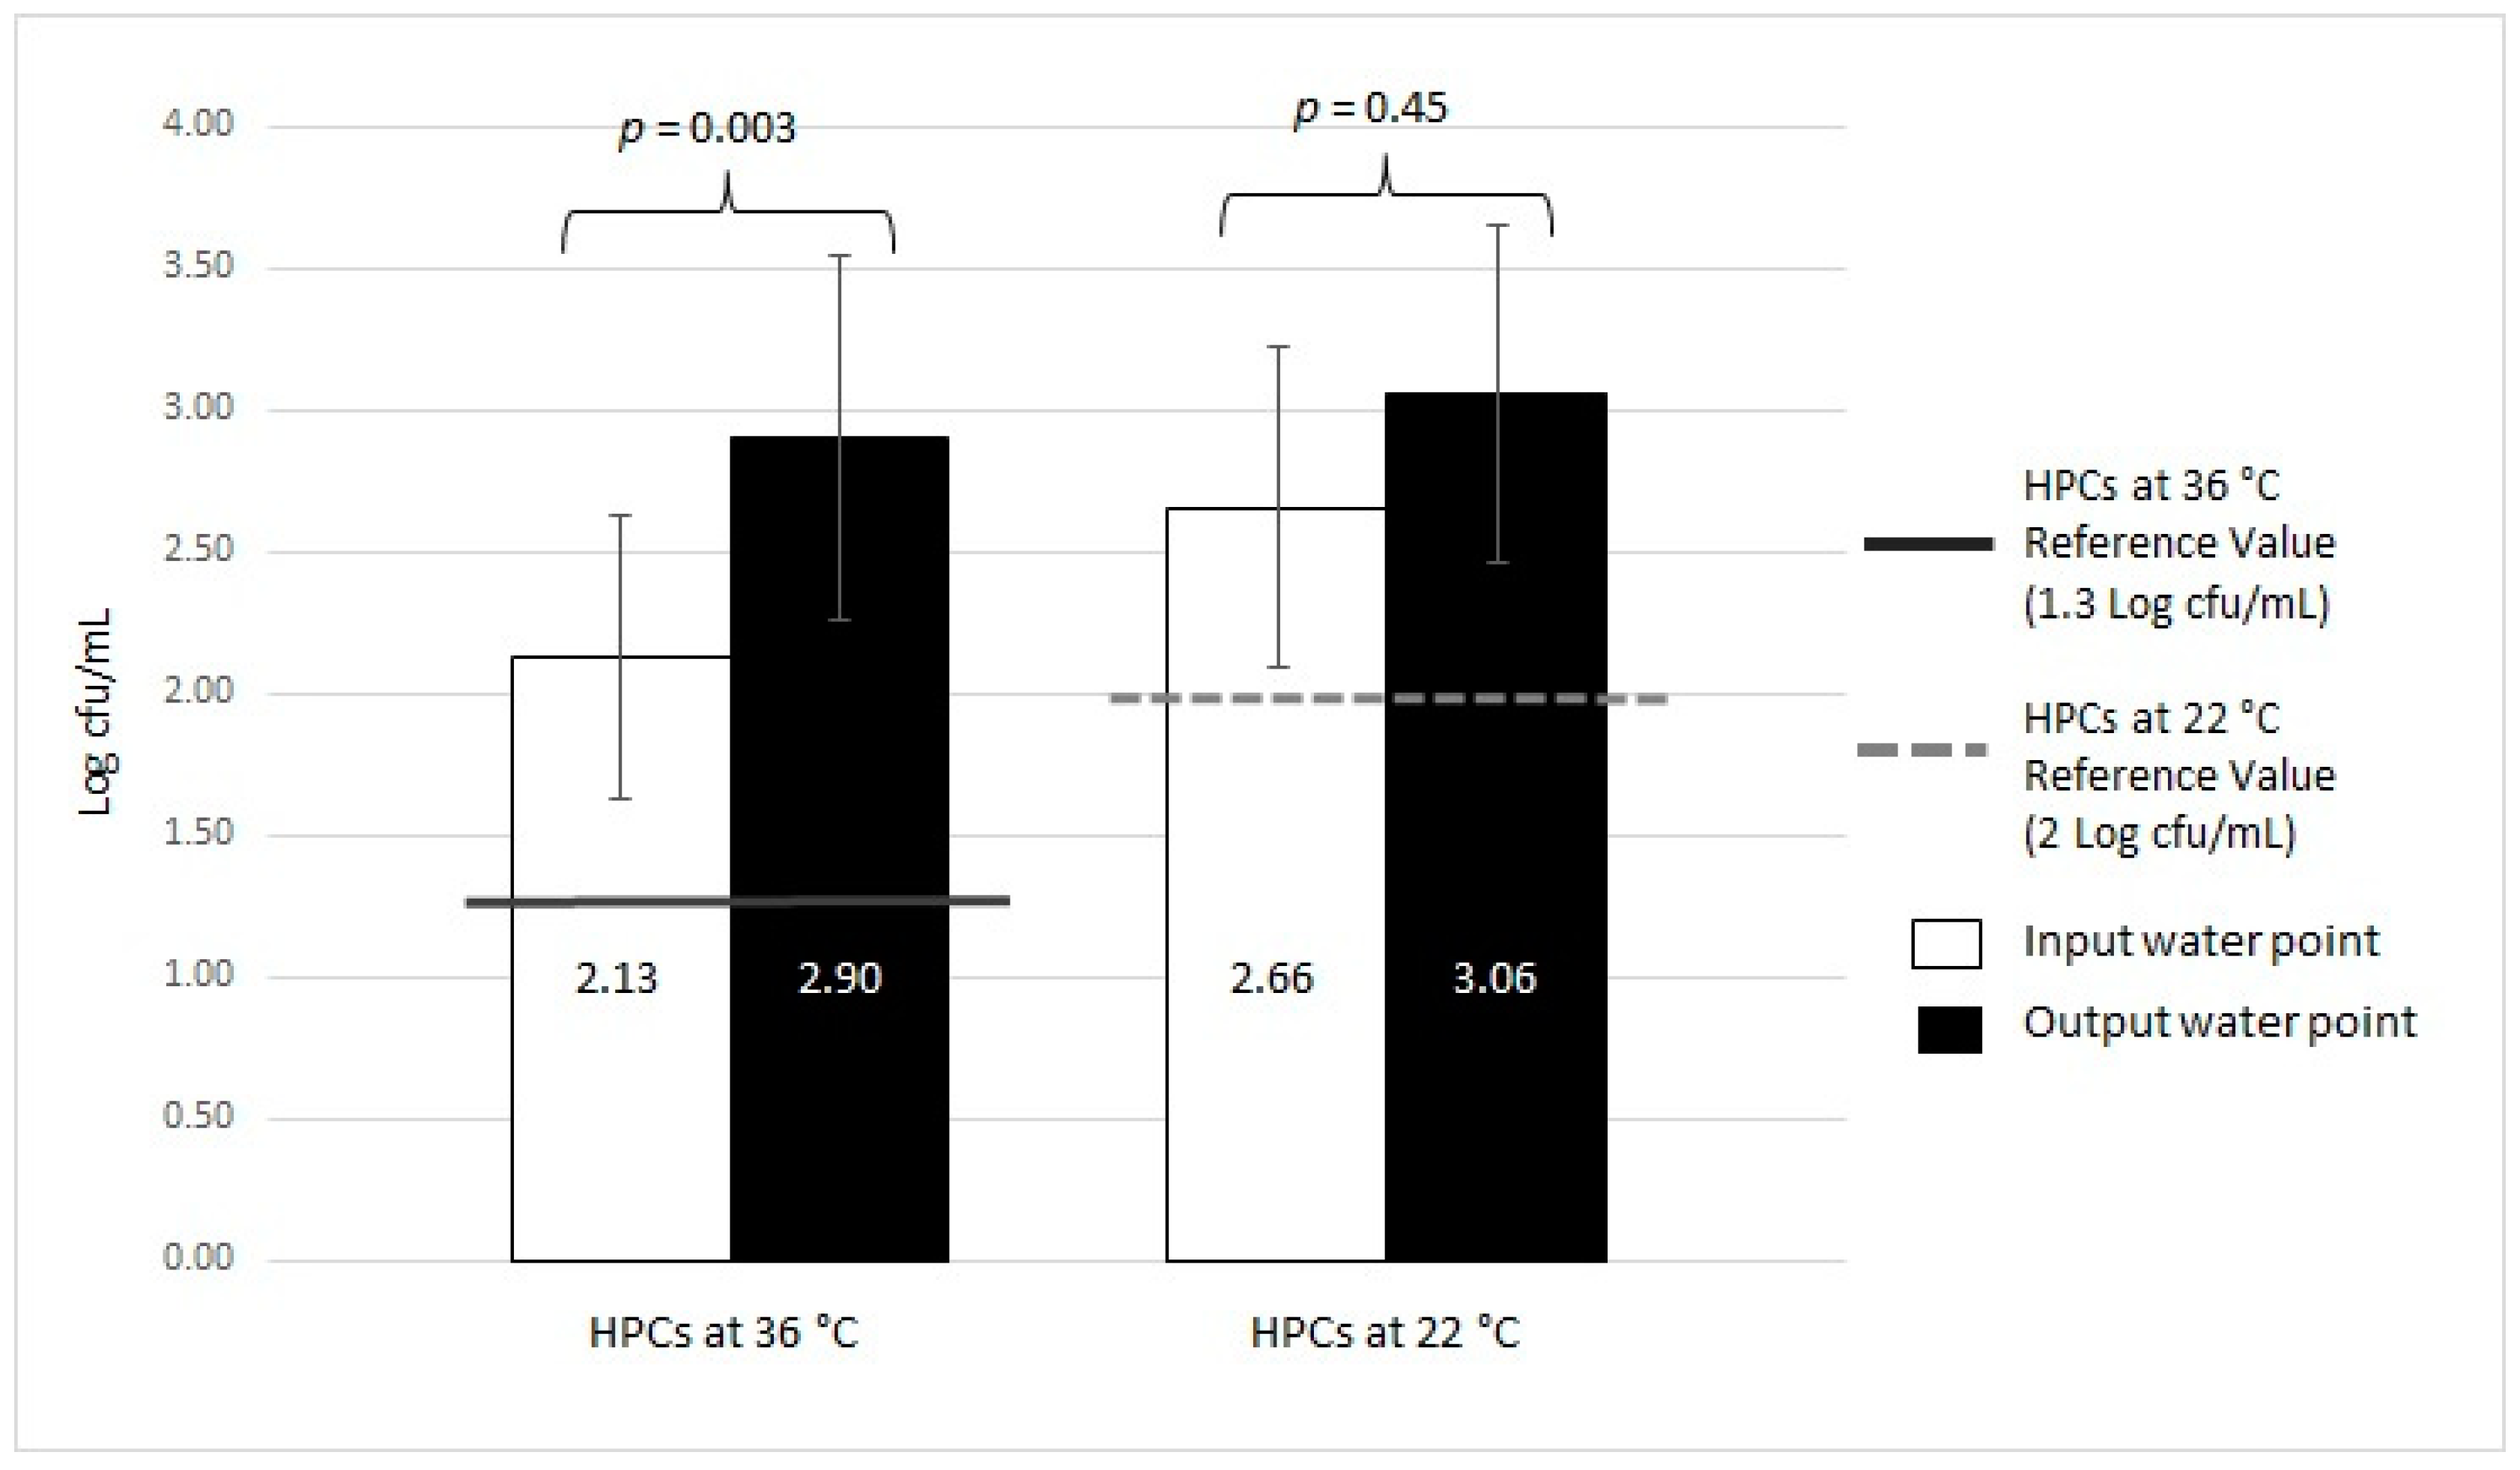
| Input Water n = 93 | HPCs at 36 °C | 41/93 | 44.09 | 2.13 ± 0.50 | 1.3 Log cfu/mL | |
| HPCs at 22 °C | 6/93 | 6.45 | 2.66 ± 0.56 | 2 Log cfu/mL | ||
| Pseudomonas aeruginosa | 0/93 | ND | ND | 0 Log cfu/100 mL | ||
| Others pathogenic microorganisms (Enterococci, Escherichia coli, and Staphylococcus aureus) | 0/93 | ND | ND | 0 Log cfu/100 mL | ||
| Output Water n = 93 | HPCs at 36 °C | 56/93 | 60.22 | 2.90 ± 0.65 | 1.3 Log cfu/mL | |
| HPCs at 22 °C | 33/93 | 35.48 | 3.06 ± 0.60 | 2 Log cfu/mL | ||
| Pseudomonas aeruginosa | 20/93 | 21.51 | 1.48 ± 0.80 | 0 Log cfu/100 mL | ||
| Other pathogenic microorganisms (Enterococci, Escherichia coli, and Staphylococcus aureus) | 3/93 | 3.23 | 0.49 ± 0.20 | 0 Log cfu/100 mL |
| Type of MWDs | Type of Analysis | Contamination of Total of Samples | Contamination of Input Water | Contamination of Output Water | Reference Value * | |||||||||
|---|---|---|---|---|---|---|---|---|---|---|---|---|---|---|
| Positive Samples | Positive Samples (%) | Log cfu/mL ± SD | Log cfu/100 mL | Positive Samples | Positive Samples (%) | Log cfu/mL ± SD | Log cfu/ 100 mL | Positive Samples | Positive Samples (%) | Log cfu/mL ± SD | Log cfu/100 mL | |||
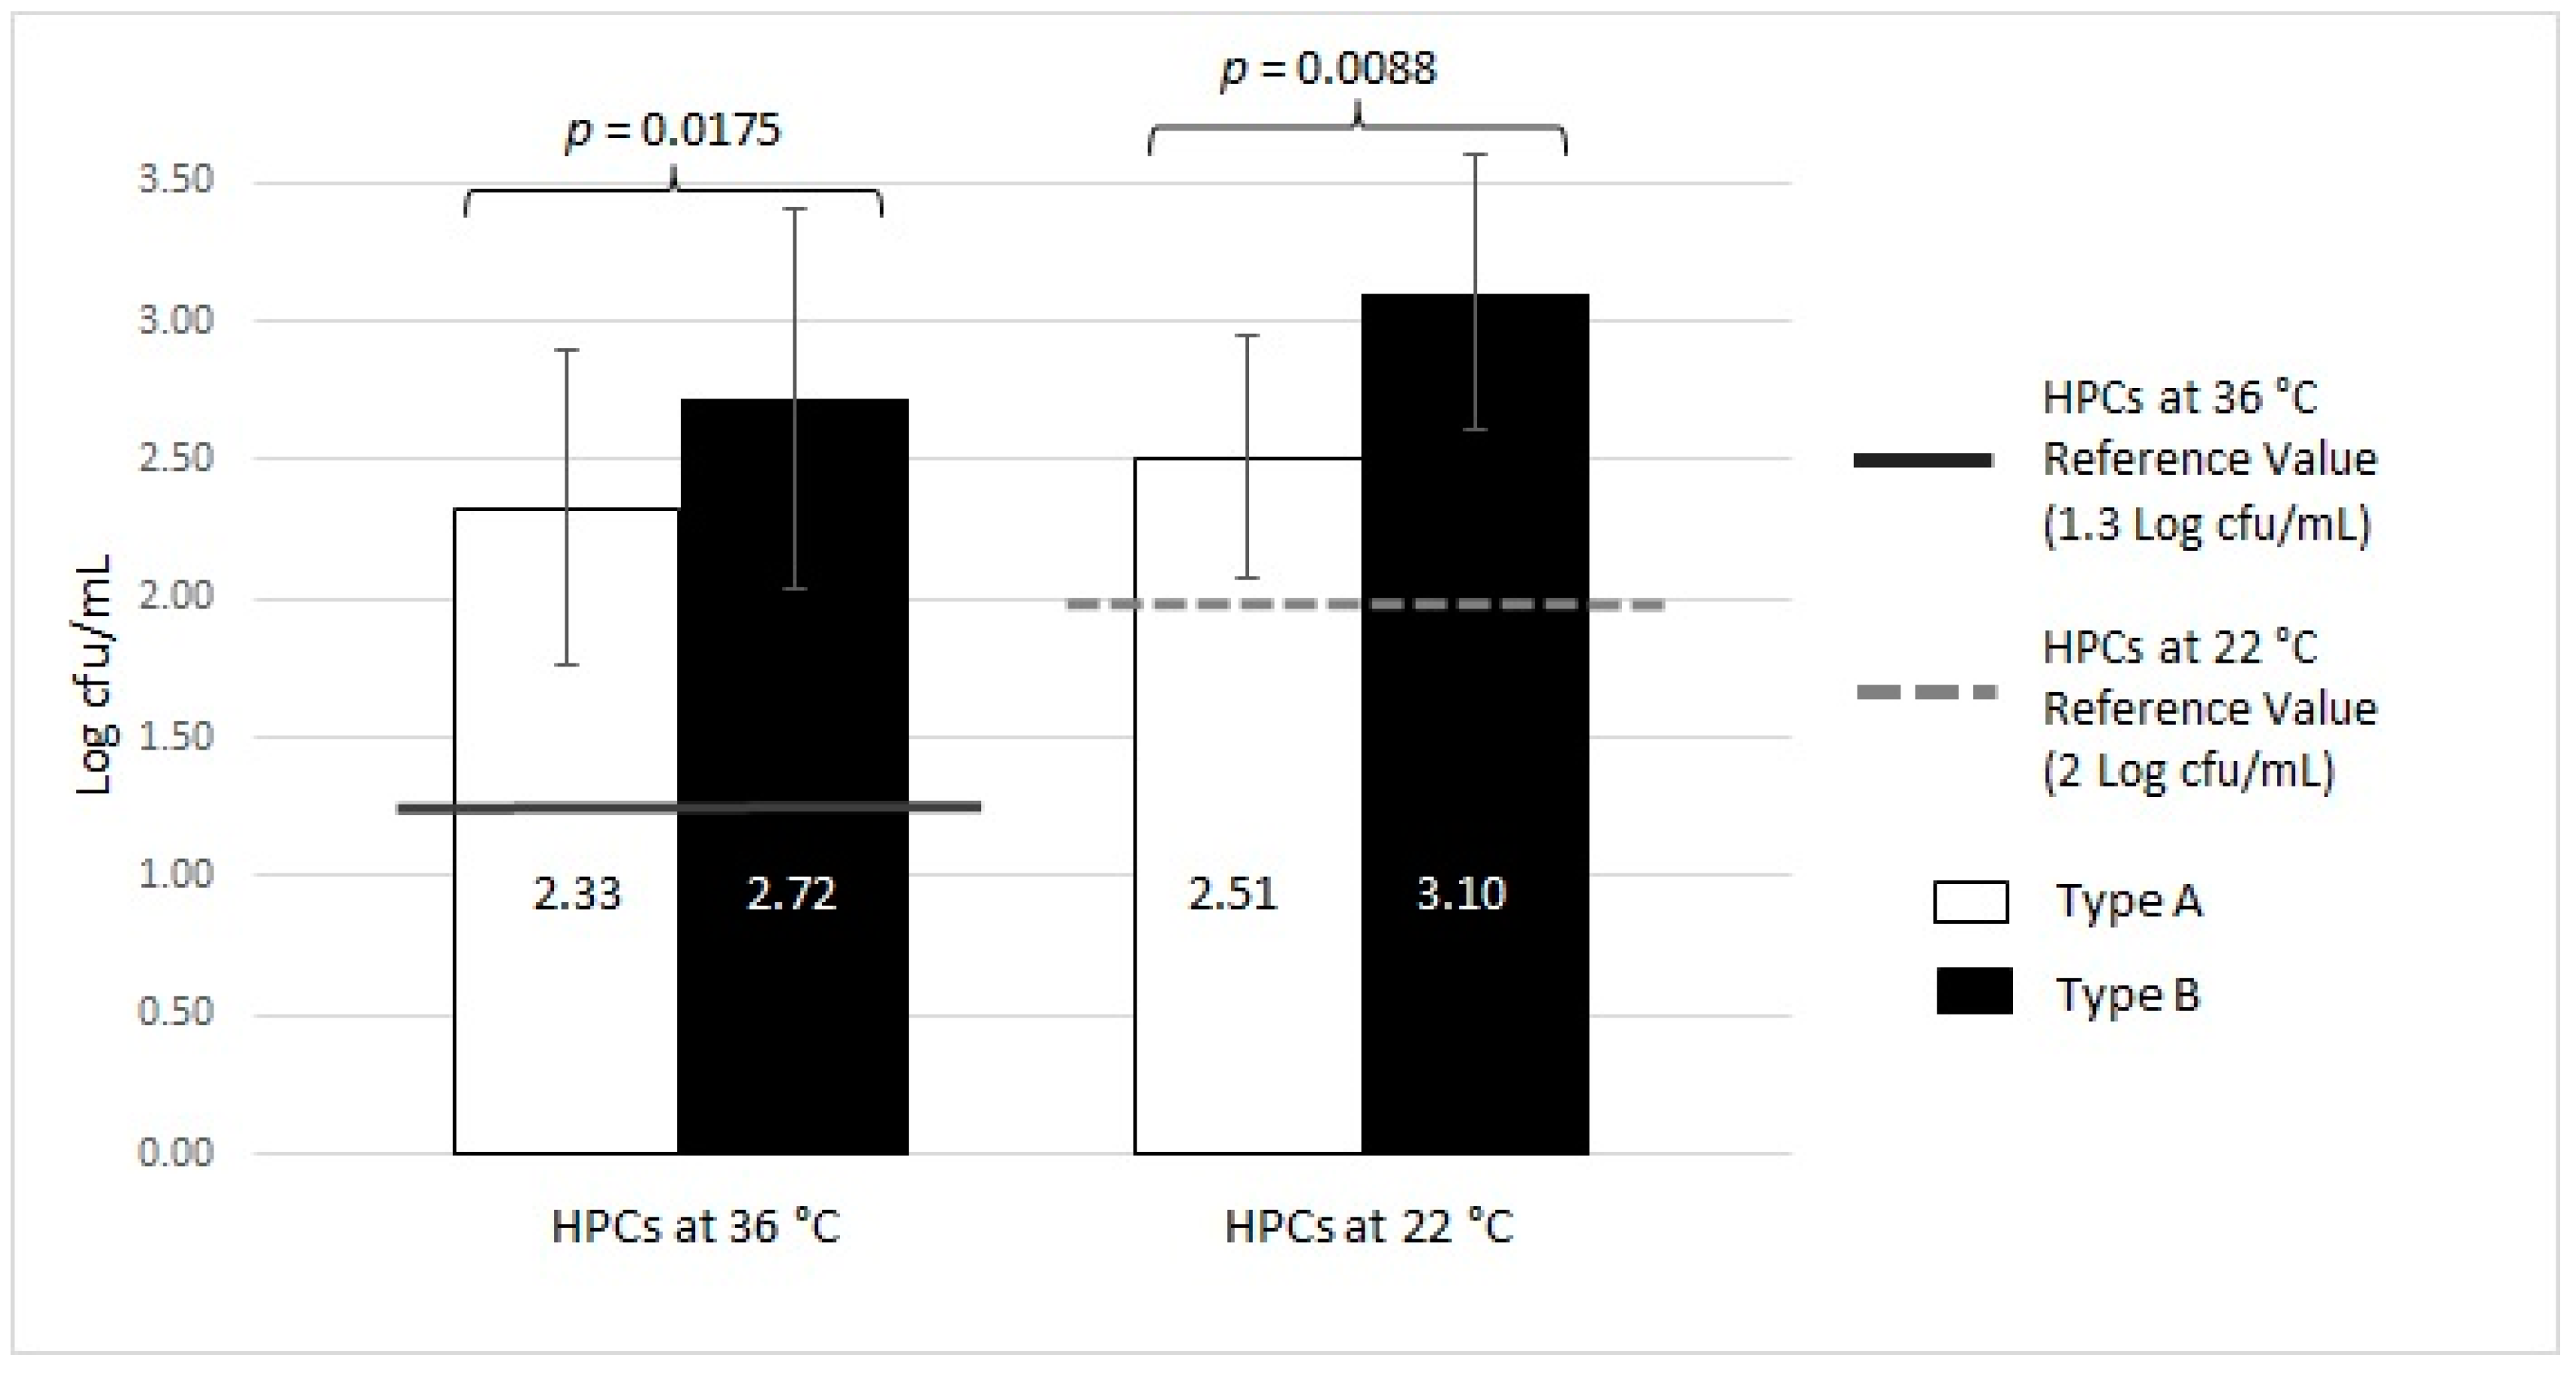
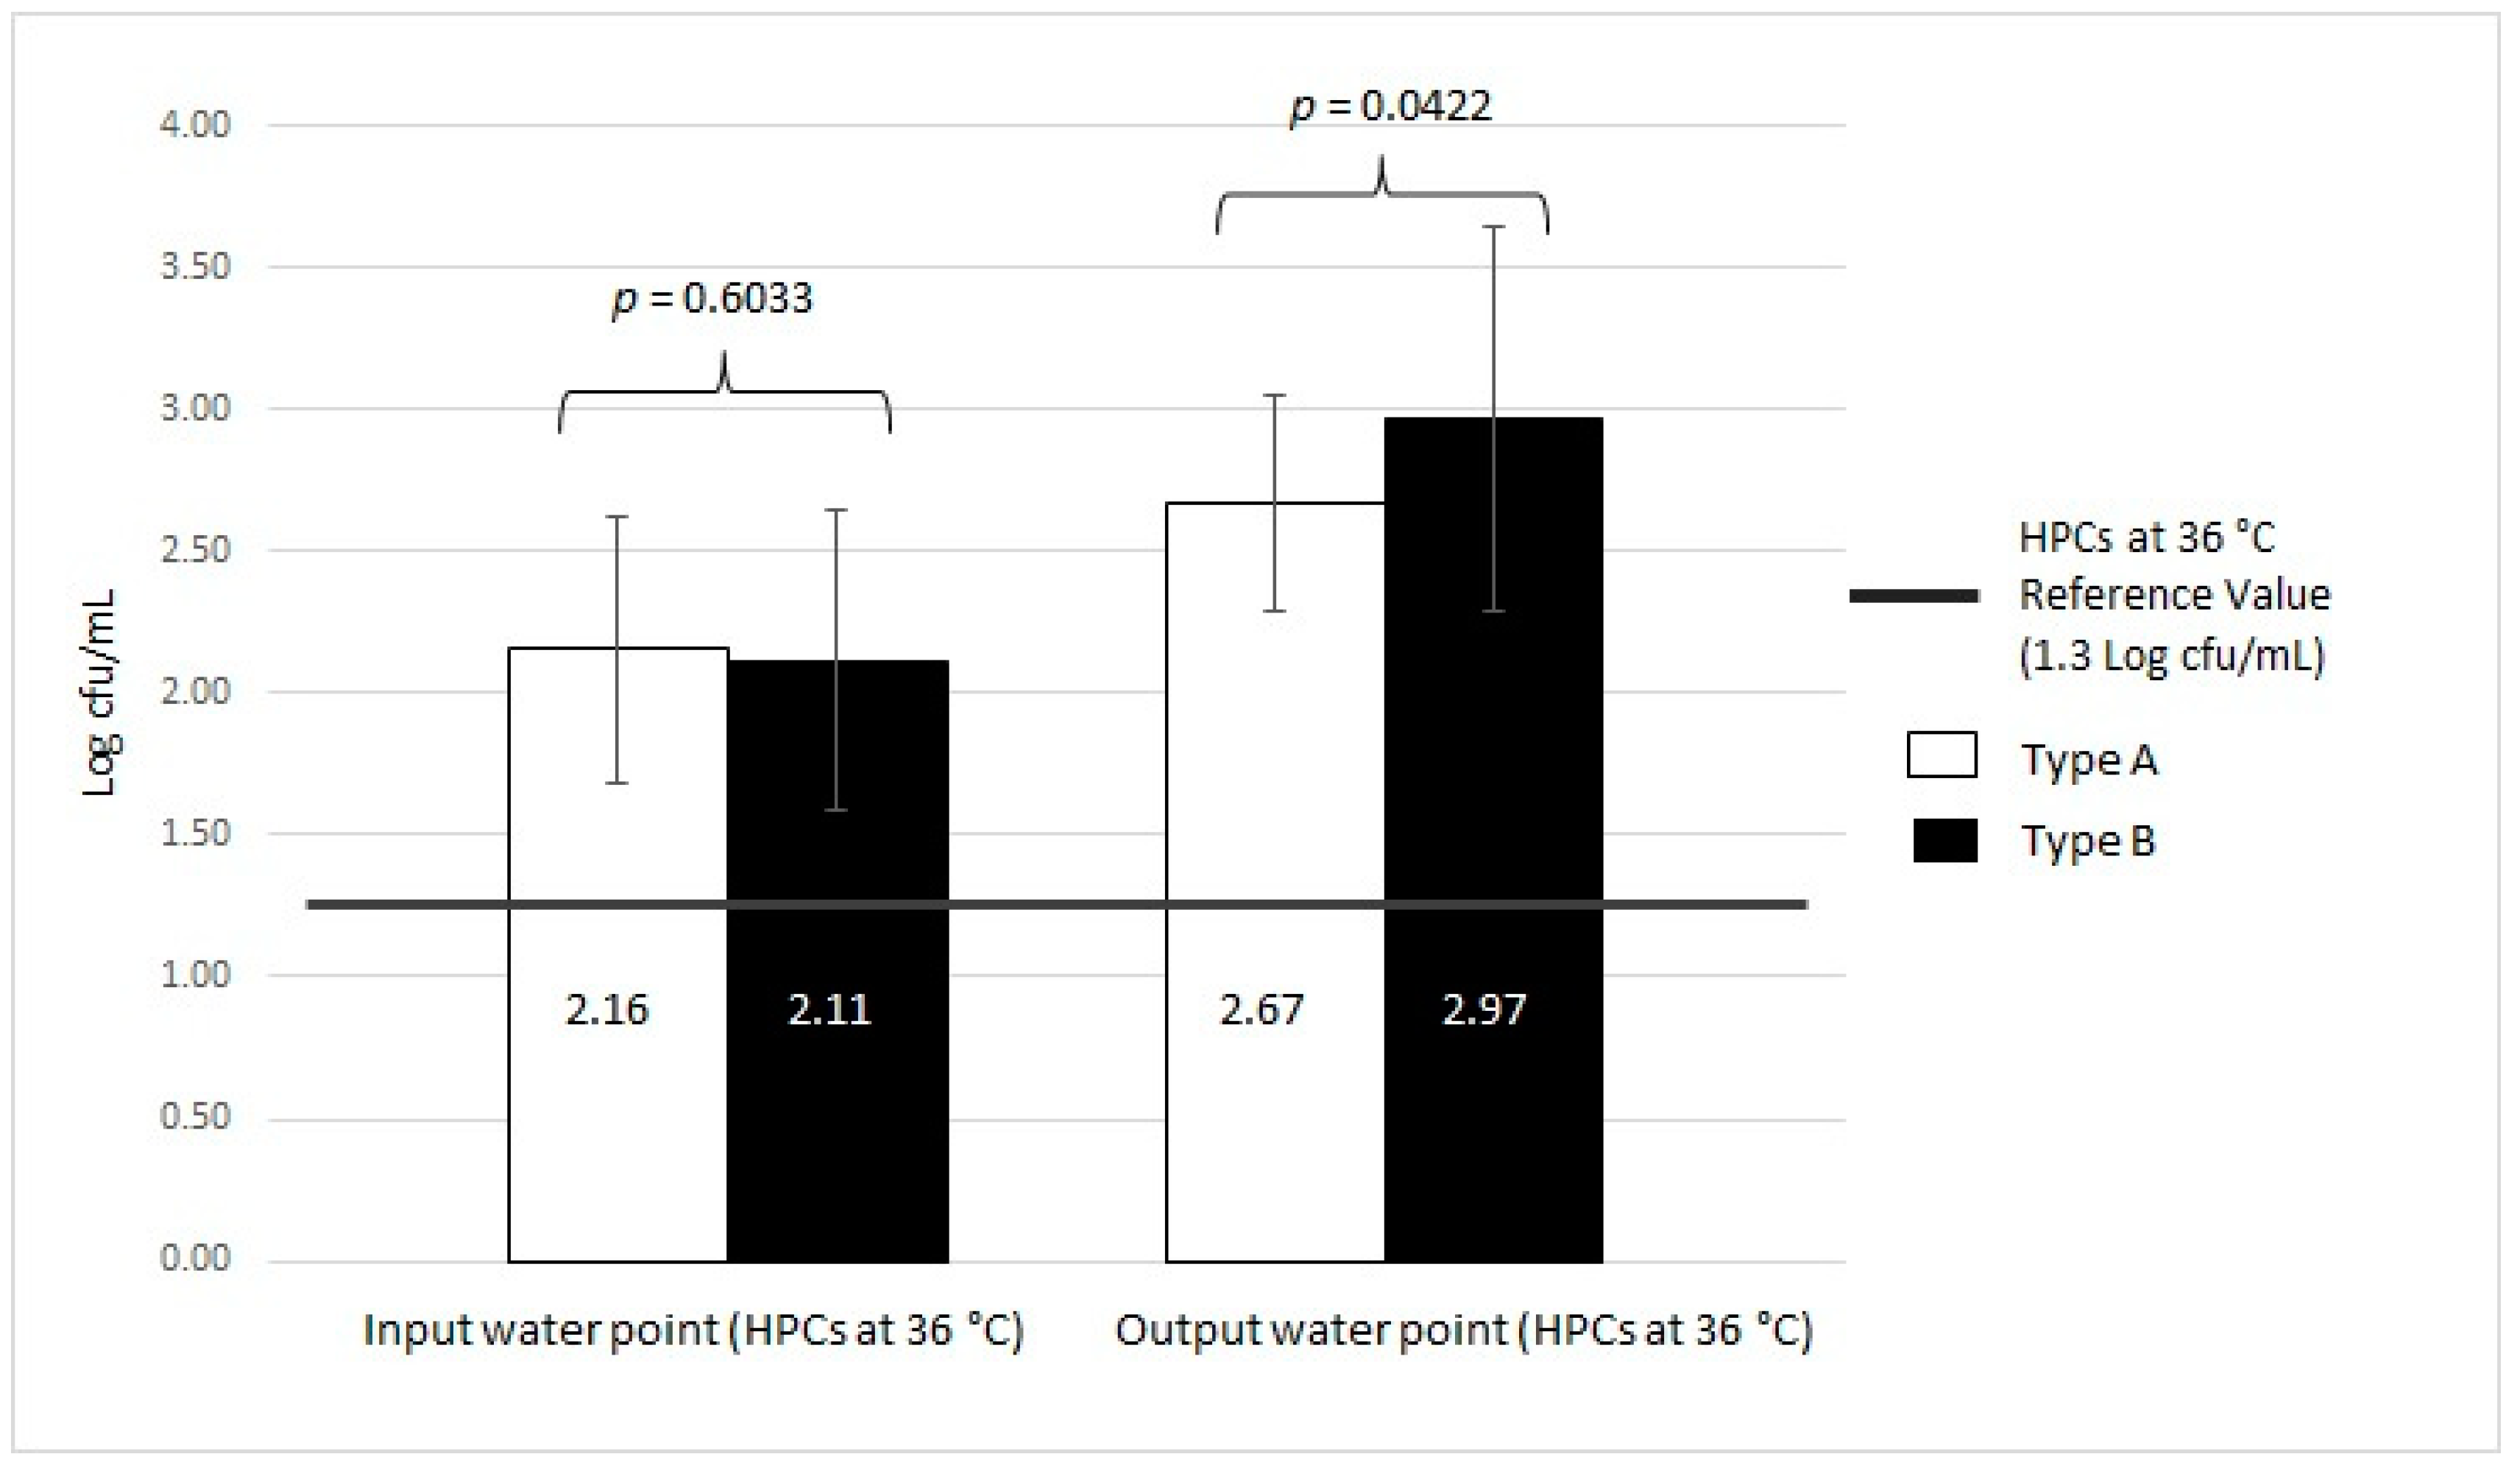
| Type A (n = 11) | HPCs at 36 °C | 20/39 | 51.28 | 2.33 ± 0.56 | 17/39 | 43.59 | 2.16 ± 0.47 | 10/39 | 25.64 | 2.67 ± 0.38 | 1.3 Log cfu/mL | |||
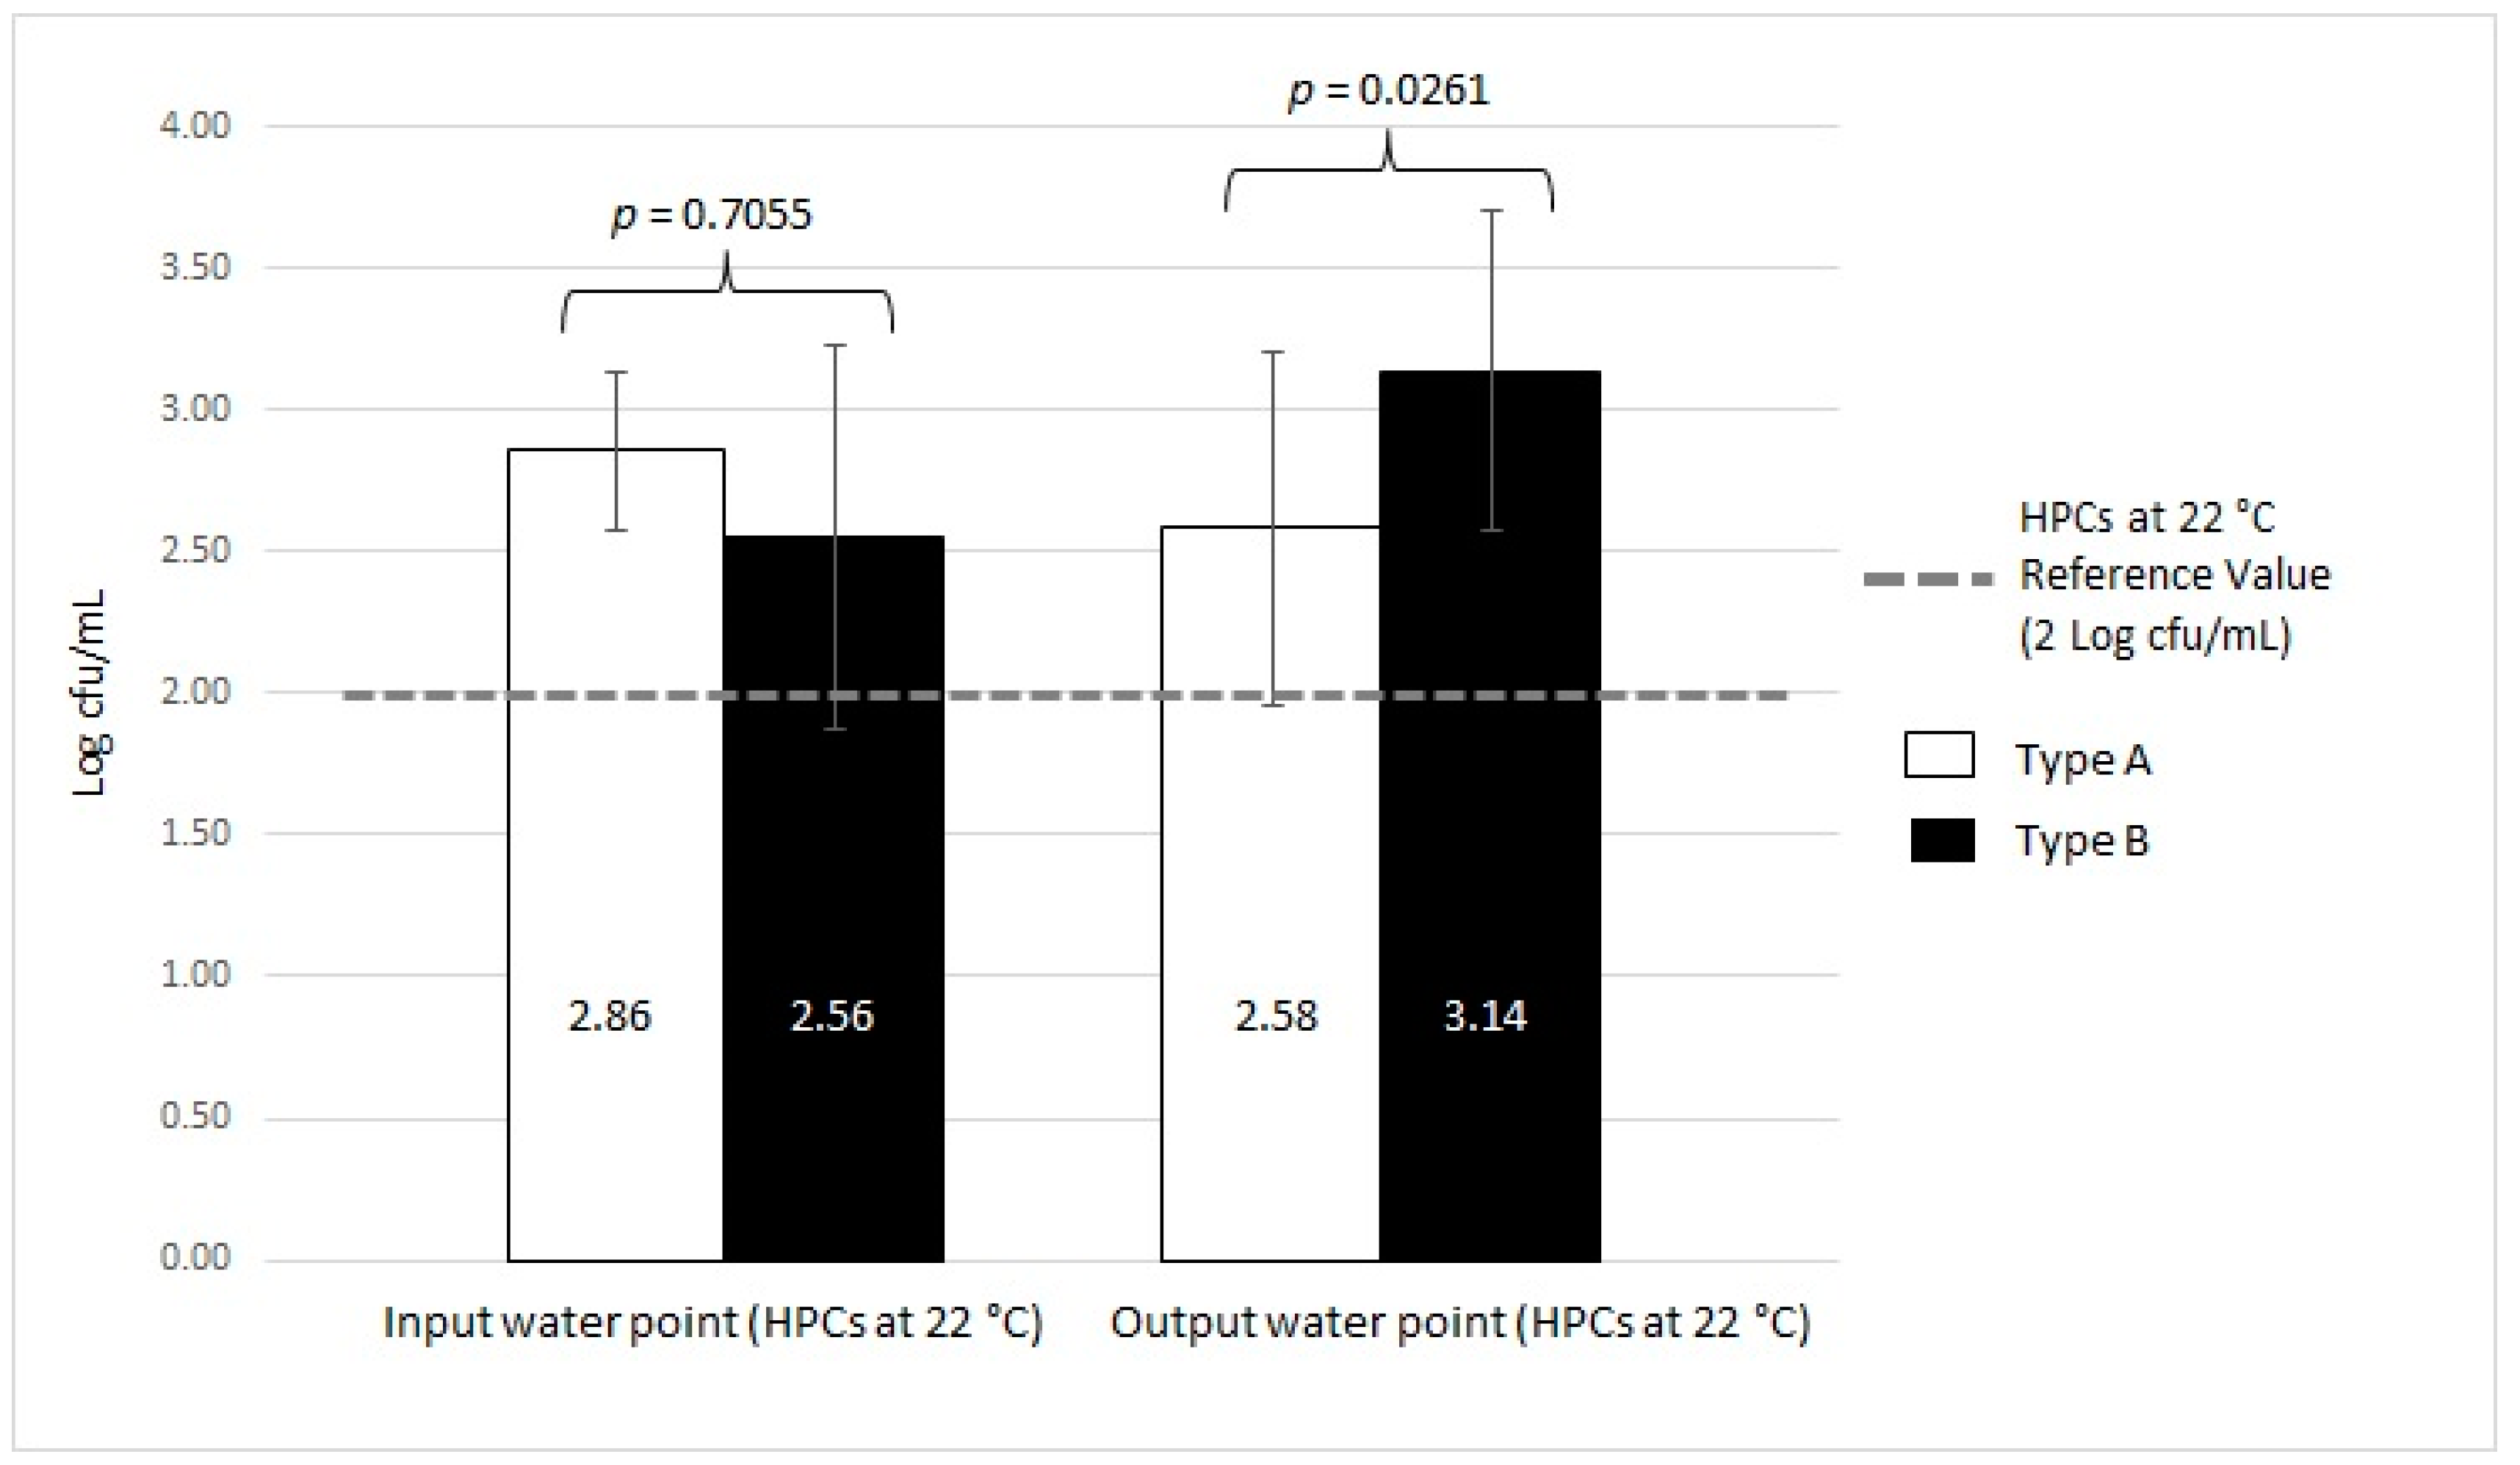
| HPCs at 22 °C | 6/39 | 15.38 | 2.51 ± 0.44 | 2/39 | 5.13 | 2.86 ± 0.28 | 5/39 | 12.82 | 2.58 ± 0.62 | 2 Log cfu/mL | ||||
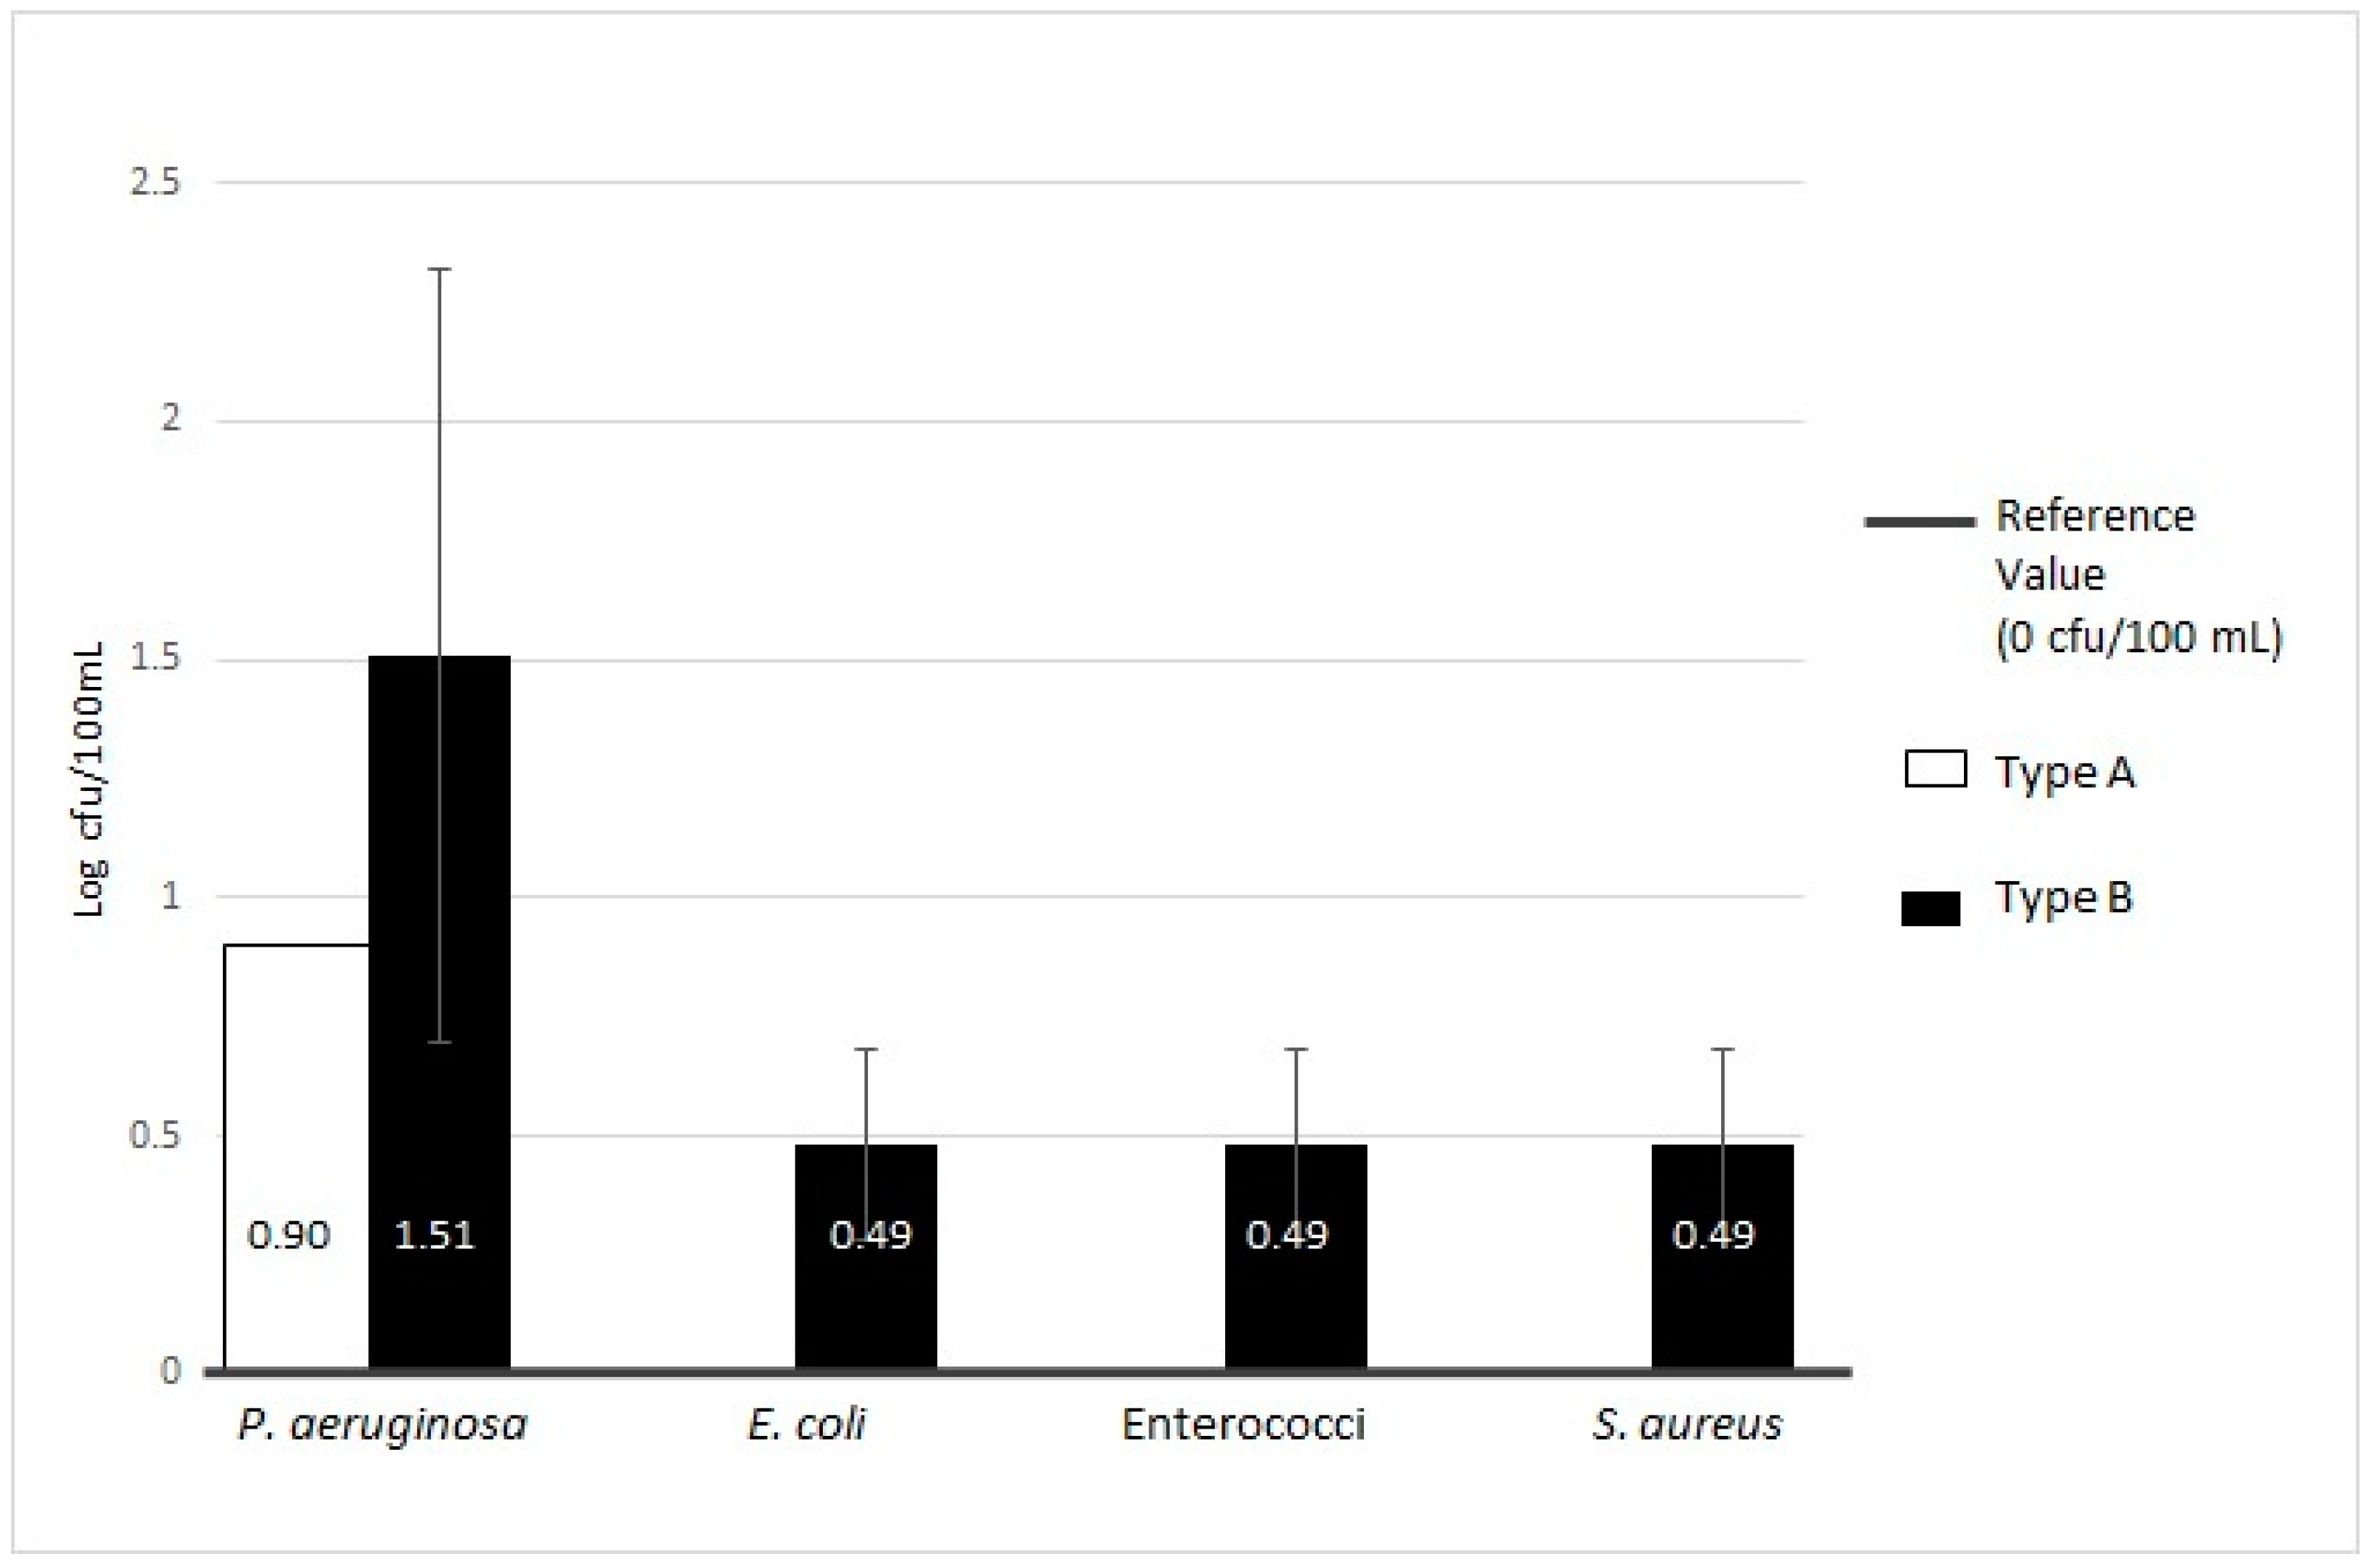
| Pseudomonas aeruginosa | 1/39 | 2.56 | 0.90 | 0/39 | ND | ND | 1/39 | 2.56 | 0.90 | 0 Log cfu/100 mL | ||||
| Others pathogenic microorganisms (Enterococci, Escherichia coli, Staphylococcus aureus) | 0/39 | ND | 0/39 | ND | ND | 0/39 | ND | ND | 0 Log cfu/100 mL | |||||
| Type B (n = 35) | HPCs at 36 °C | 53/54 | 98.15 | 2.72 ± 0.68 | 24/54 | 44.44 | 2.11 ± 0.53 | 46/54 | 85.19 | 2.97 ± 0.67 | 1.3 Log cfu/mL | |||
| HPCs at 22 °C | 28/54 | 51.85 | 3.10 ± 0.49 | 4/54 | 7.41 | 2.56 ± 0.68 | 28/54 | 51.85 | 3.14 ± 0.56 | 2 Log cfu/mL | ||||
| Pseudomonas aeruginosa | 19/54 | 35.19 | 1.51 ± 0.81 | 0/54 | ND | ND | 19/54 | 35.19 | 1.51 ± 0.81 | 0 Log cfu/100 mL | ||||
| Others pathogenic microorganisms (Enterococci, Escherichia coli, Staphylococcus aureus) | 3/54 | 5.56 | 0.49 ± 0.20 | 0/54 | ND | ND | 3/54 | 5.56 | 0.49 ± 0.20 | 0 Log cfu/100 mL | ||||
| Regular Procedures | Implemented Procedures during the Study | |
|---|---|---|
| Type A |
|
|
| Type B |
|
|
© 2019 by the authors. Licensee MDPI, Basel, Switzerland. This article is an open access article distributed under the terms and conditions of the Creative Commons Attribution (CC BY) license (http://creativecommons.org/licenses/by/4.0/).
Share and Cite
Girolamini, L.; Lizzadro, J.; Mazzotta, M.; Iervolino, M.; Dormi, A.; Cristino, S. Different Trends in Microbial Contamination between Two Types of Microfiltered Water Dispensers: From Risk Analysis to Consumer Health Preservation. Int. J. Environ. Res. Public Health 2019, 16, 272. https://0-doi-org.brum.beds.ac.uk/10.3390/ijerph16020272
Girolamini L, Lizzadro J, Mazzotta M, Iervolino M, Dormi A, Cristino S. Different Trends in Microbial Contamination between Two Types of Microfiltered Water Dispensers: From Risk Analysis to Consumer Health Preservation. International Journal of Environmental Research and Public Health. 2019; 16(2):272. https://0-doi-org.brum.beds.ac.uk/10.3390/ijerph16020272
Chicago/Turabian StyleGirolamini, Luna, Jessica Lizzadro, Marta Mazzotta, Matteo Iervolino, Ada Dormi, and Sandra Cristino. 2019. "Different Trends in Microbial Contamination between Two Types of Microfiltered Water Dispensers: From Risk Analysis to Consumer Health Preservation" International Journal of Environmental Research and Public Health 16, no. 2: 272. https://0-doi-org.brum.beds.ac.uk/10.3390/ijerph16020272