Latent Profiles Based on Light Physical Activity, Sedentary Behavior, Perceived Body Shape, and Body Mass Index in Patients with Dyslipidemia Influence Their Quality of Life


Abstract
:1. Introduction
2. Materials and Methods
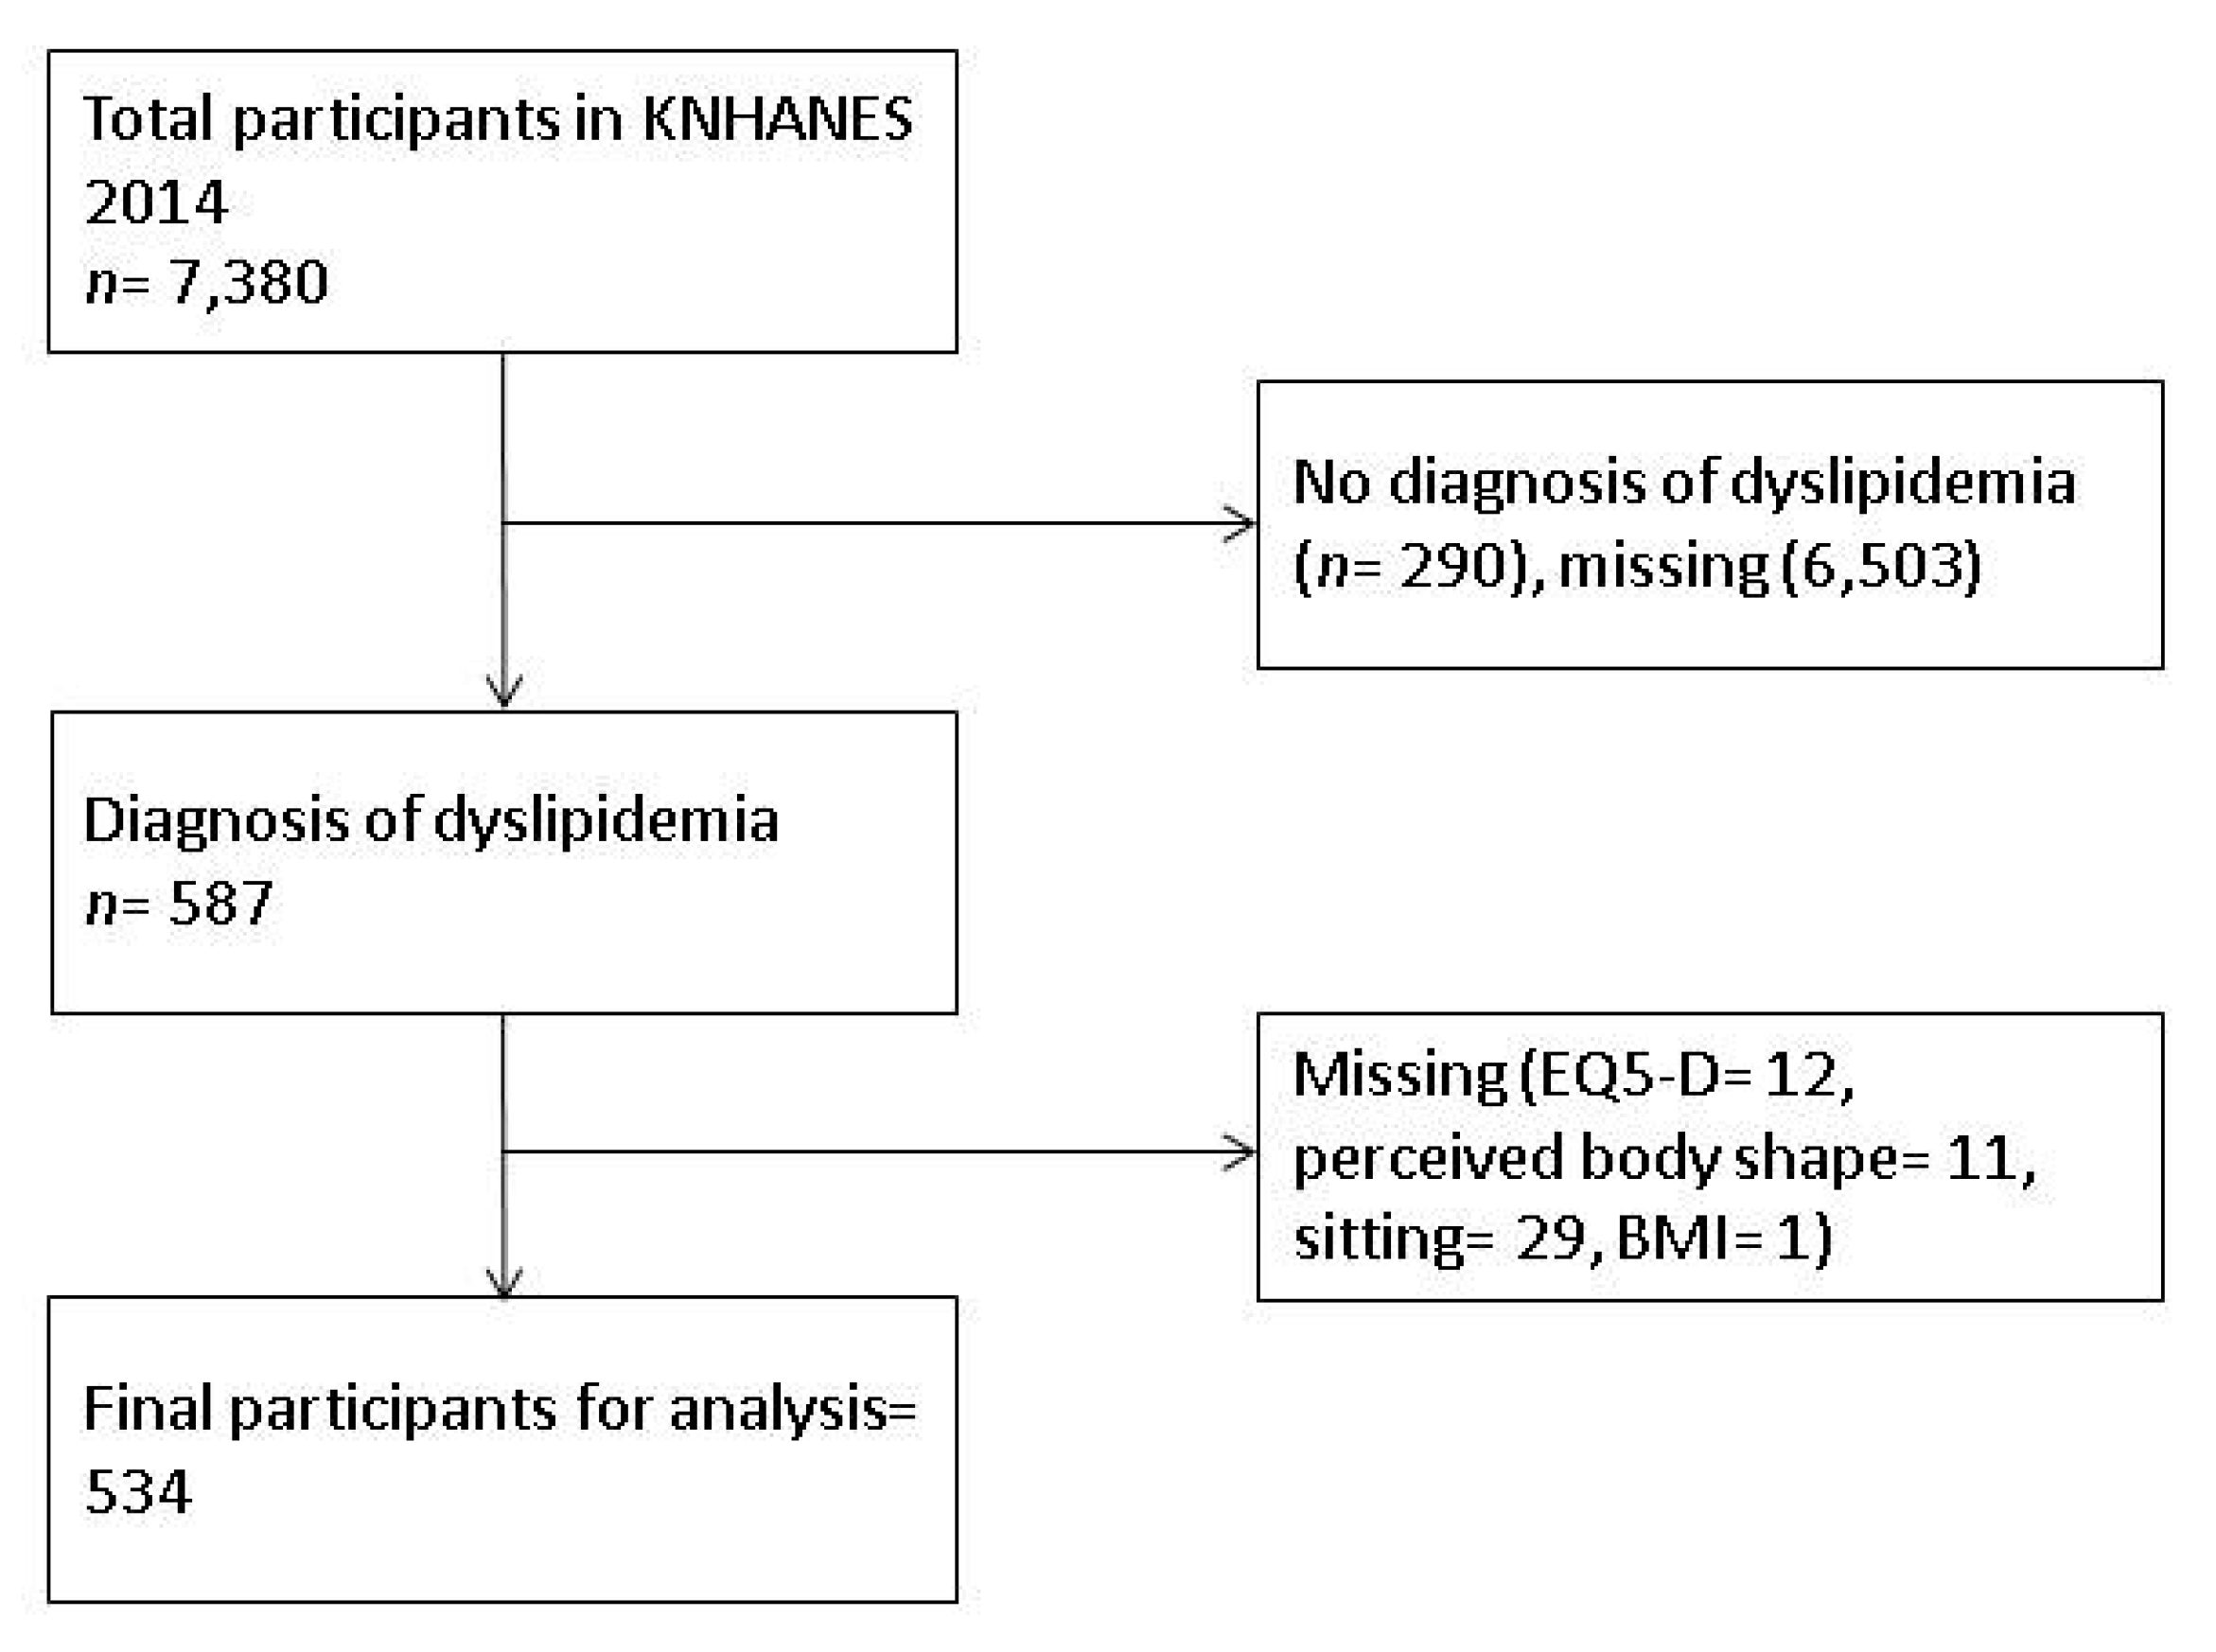
2.1. Participants and Data Collection
2.2. Variables
2.2.1. Light PA
2.2.2. Sedentary Behavior
2.2.3. Perceived Body Shape
2.2.4. Body Mass Index
2.2.5. Quality of Life
2.2.6. Covariate
2.3. Statistical Analysis
3. Results
4. Discussion
5. Conclusions
Author Contributions
Funding
Conflicts of Interest
References
- Cardiovascular Diseases (CVDs) Fact Sheet. Available online: https://www.who.int/en/news-room/fact-sheets/detail/cardiovascular-diseases-(cvds) (accessed on 19 July 2019).
- World Health Organization. Quantifying Selected Major Risks to Health. In The World Health Report 2002—Reducing Risks, Promoting Healthy Life; Chapter 4; World Health Organization: Geneva, Switzerland, 2002; Available online: https://www.who.int/whr/2002/en/ (accessed on 19 July 2019).
- Pandian, A.; Arora, A.; Sperling, L.S.; Khan, B.V. Targeting multiple dyslipidemias with fixed combinations–focus on extended release niacin and simvastatin. Vasc. Health Risk Manag. 2008, 4, 1001–1009. [Google Scholar] [PubMed]
- Global Health Observatory Data Repository 2013. Available online: http://apps.who.int/gho/data/view.main.2570?lang=en (accessed on 19 July 2019).
- Committee for the Korean Guidelines for the Management of Dyslipidemia; Committee for the Korean Guidelines for the Management of 2016. 2015 Korean Guidelines for the Management of Dyslipidemia: Executive Summary (English Translation). Korean Circ. J. 2015, 46, 275–306. [Google Scholar]
- Korean Statistical Information Service. Health Insurance Review and Assessment. Healthcare Bigdata Hub. Available online: http://opendata.hira.or.kr/op/opc/olap4thDsInfo.do (accessed on 23 March 2019).
- Brown, C.D.; Higgins, M.; Donato, K.A.; Rohde, F.C.; Garrison, R.; Obarzanek, E.; Ernst, N.D.; Horan, M. Body mass index and the prevalence of hypertension and dyslipidemia. Obes. Res. 2000, 8, 605–619. [Google Scholar] [CrossRef] [PubMed]
- Montesi, L.; Moscatiello, S.; Malavolti, M.; Marzocchi, R.; Marchesini, G. Physical activity for the prevention and treatment of metabolic disorders. Intern. Emerg. Med. 2013, 8, 655–666. [Google Scholar] [CrossRef] [Green Version]
- Kelley, G.; Kelley, K.S.; Tran, Z.V. Walking, lipids, and lipoproteins: A meta-analysis of randomized controlled trials. Prev. Med. 2004, 38, 651–661. [Google Scholar] [CrossRef]
- Murphy, M.H.; Lahart, I.; Carlin, A.; Murtagh, E. The effects of continuous compared to accumulated exercise on health: A meta-analytic review. Sports Med. 2019, 2, 1–23. [Google Scholar] [CrossRef]
- Henson, J.; Yates, T.; Biddle, S.J.H.; Edwardson, C.L.; Khunti, K.; Wilmot, E.G.; Gray, L.J.; Gorely, T.; Nimmo, M.A.; Davies, M.J. Associations of objectively measured sedentary behaviour and physical activity with markers of cardiometabolic health. Diabetologia 2013, 56, 1012–1020. [Google Scholar] [CrossRef] [Green Version]
- Powell, C.; Herring, M.P.; Dowd, K.P.; Donnelly, A.E.; Carson, B.P. The cross-sectional associations between objectively measured sedentary time and cardiometabolic health markers in adults–a systematic review with meta-analysis component. Obes. Rev. 2018, 19, 381–395. [Google Scholar] [CrossRef]
- Naughton, M.J.; Shumaker, S.A. The case for domains of function in quality of life assessment. Qual. Life Res. 2003, 12, 73–80. [Google Scholar] [CrossRef]
- Oliva-Moreno, J.; Lopez-Bastida, J.; Worbes-Cerezo, M.; Serrano-Aguilar, P. Health related quality of life of Canary Island citizens. BMC Public Health 2010, 10, 675. [Google Scholar] [CrossRef]
- Krumholz, H.M.; Peterson, E.D.; Ayanian, J.Z.; Chin, M.H.; DeBusk, R.F.; Goldman, L.; Kiefe, C.I.; Powe, N.R.; Rumsfeld, J.S.; Spertus, J.A.; et al. Report of the National Heart, Lung, and Blood Institute Working Group on outcomes research in cardiovascular disease. Circulation 2005, 111, 3158–3166. [Google Scholar] [CrossRef] [PubMed]
- Park, B.; Ock, M.; Lee, H.A.; Lee, S.; Han, H.; Jo, M.W.; Park, H. Multimorbidity and health-related quality of life in Koreans aged 50 or older using KNHANES 2013–2014. Health Qual. Life Outcomes 2018, 16, 186. [Google Scholar] [CrossRef] [PubMed]
- Park, H. The impact of dyslipidemia on the health-related quality of life of Korean females aged 50 years and older. Iran. J. Public Health 2019, 48, 556–558. [Google Scholar] [CrossRef]
- Meyer, J.P.; Stanley, L.J.; Vandenberg, R.J. A person-centered approach to the study of commitment. Hum. Resour. Manag. Rev. 2013, 23, 190–202. [Google Scholar] [CrossRef]
- Cheng, C.T.; Ho, S.M.; Liu, W.K.; Hou, Y.C.; Lim, L.C.; Gao, S.Y.; Chang, W.Y.; Wang, G.L. Cancer-coping profile predicts long-term psychological functions and quality of life in cancer survivors. Support. Care Cancer 2013, 27, 933–941. [Google Scholar] [CrossRef]
- Park, S.; Thøgersen-Ntoumani, C.; Ntoumanis, N.; Stenling, A.; Fenton, S.A.; Veldhuijzen van Zanten, J.J. Profiles of physical function, physical activity, and sedentary behavior and their associations with mental health in residents of assisted living facilities. Appl. Psychol. Health Wellbeing 2017, 9, 60–80. [Google Scholar] [CrossRef]
- Dagogo-Jack, S.; Egbuonu, N.; Edeoga, C. Principles and practice of nonpharmacological interventions to reduce cardiometabolic risk. Med. Princ. Pract. 2010, 19, 167–175. [Google Scholar] [CrossRef]
- Kweon, S.; Kim, Y.; Jang, M.J.; Kim, Y.; Kim, K.; Choi, S.; Chun, C.; Khang, Y.H.; Oh, K. Data resource profile: The Korea National Health and Nutrition Examination Survey (KNHANES). Int. J. Epidemiol. 2014, 43, 69–77. [Google Scholar] [CrossRef]
- Kim, S.H.; Kim, T.H.; Hwang, H.J. The relationship of physical activity (PA) and walking with sarcopenia in korean males aged 60 years and older using the Fourth Korean National Health and Nutrition Examination Survey (KNHANES IV-2, 3), 2008–2009. Arch. Gerontol. Geriatr. 2013, 56, 472–477. [Google Scholar] [CrossRef]
- Lee, J.; Lee, C.; Min, J.; Kang, D.W.; Kim, J.Y.; Yang, H.I.; Park, J.; Lee, M.K.; Lee, M.Y.; Park, I.; et al. Development of the Korean Global Physical Activity Questionnaire: Reliability and validity study. Global Health Promot. 2019. [Google Scholar] [CrossRef]
- Bang, I.; Jeong, Y.J.; Park, Y.Y.; Moon, N.Y.; Lee, J.; Jeon, T.H. Secondhand smoking is associated with poor mental health in Korean adolescents. Tohoku J. Exp. Med. 2017, 242, 317–326. [Google Scholar] [CrossRef] [PubMed]
- Nam, H.S.K.K.; Kwon, S.S.; Koh, K.W.; Poul, K. EQ-5D Korean Valuation Study Using Time Trade of Method; Korea Centers for Disease Control and Prevention: Cheongwon, Korea, 2007. [Google Scholar]
- Ki, E.Y.; Do Han, K.; Park, Y.G. Relationship between duration of breast-feeding and obesity in Korean women: The korea national health and nutrition examination survey (KNHANES) 2010–2012. Maturitas 2017, 102, 41–45. [Google Scholar] [CrossRef] [PubMed]
- Lee, B.K.; Kim, Y. Relationship between blood manganese and blood pressure in the Korean general population according to KNHANES 2008. Environ. Res. 2011, 111, 797–803. [Google Scholar] [CrossRef]
- Vermunt, J.K.; Magidson, J. Latent class cluster analysis. In Applied Latent Class Analysis; Hagenaars, J., McCutcheon, A., Eds.; Cambridge University Press: Cambridge, UK, 2002; pp. 89–106. [Google Scholar]
- Lin, T.H.; Dayton, C.M. Model selection information criteria for non-nested latent class models. J. Educ. Behav. Stat. 1997, 22, 249–264. [Google Scholar] [CrossRef]
- Schwarz, G. Estimating the dimension of a model. Ann. Stat. 1978, 6, 461–464. [Google Scholar] [CrossRef]
- Sclove, S.L. Application of model-selection criteria to some problems in multivariate analysis. Psychometrika 1987, 52, 333–343. [Google Scholar] [CrossRef]
- McLachlan, G.; Peel, D. Finite Mixture Models; John Wiley & Sons: New York, NY, USA, 2004. [Google Scholar]
- Bakk, Z.; Vermunt, J.K. Robustness of stepwise latent class modeling with continuous distal outcomes. Struct. Equ. Model. A Multidiscip. J. 2016, 23, 20–31. [Google Scholar] [CrossRef]
- Cohen, J. Statistical Power Analysis for the Behavioral Sciences; Erlbaum: Hillsdale, NJ, USA, 1998. [Google Scholar]
- VanWormer, J.J. Pedometers and brief e-counseling: Increasing physical activity for overweight adults. J. Appl. Behav. Anal. 2004, 37, 421–425. [Google Scholar] [CrossRef]
- Yasunaga, A.; Shibata, A.; Ishii, K.; Inoue, S.; Sugiyama, T.; Owen, N.; Oka, K. Replacing sedentary time with physical activity: Effects on health-related quality of life in older Japanese adults. Health Qual. Life Outcomes 2018, 16, 240. [Google Scholar] [CrossRef]
- Salvo, G.; Lashewicz, B.; Doyle-Baker, P.; McCormack, G. Neighbourhood built environment influences on physical activity among adults: A systematized review of qualitative evidence. Int. J. Environ. Res. Public Health 2018, 15, 897. [Google Scholar] [CrossRef]
- Ebron, K.; Andersen, C.J.; Aguilar, D.; Blesso, C.N.; Barona, J.; Dugan, C.E.; Jones, J.L.; Al-Sarraj, T.; Fernandez, M.L. A larger body mass index is associated with increased atherogenic dyslipidemia, insulin resistance, and low-grade inflammation in individuals with metabolic syndrome. Metab. Syndr. Relat. Disord. 2015, 13, 458–464. [Google Scholar] [CrossRef] [PubMed]
- Fujita, M.; Sato, Y.; Nagashima, K.; Takahashi, S.; Hata, A. Predictive power of a body shape index for development of diabetes, hypertension, and dyslipidemia in Japanese adults: A retrospective cohort study. PLoS ONE 2015, 10, e0128972. [Google Scholar] [CrossRef] [PubMed]
- Gaskin, J.L.; Pulver, A.J.; Branch, K.; Kabore, A.; James, T.; Zhang, J. Perception or reality of body weight: Which matters to the depressive symptoms. J. Affect. Disord. 2013, 150, 350–355. [Google Scholar] [CrossRef] [PubMed]
- Paulo, T.R.S.; Rossi, F.E.; Viezel, J.; Tosello, G.T.; Seidinger, S.C.; Simões, R.R.; de Freitas, R.; Freitas, I.F. The impact of an exercise program on quality of life in older breast cancer survivors undergoing aromatase inhibitor therapy: A randomized controlled trial. Health Qual. Life Outcomes 2019, 17, 17. [Google Scholar] [CrossRef] [PubMed]
- Vallance, J.K.; Boyle, T.; Courneya, K.S.; Lynch, B.M. Associations of objectively assessed physical activity and sedentary time with health-related quality of life among colon cancer survivors. Cancer 2014, 120, 2919–2926. [Google Scholar] [CrossRef]
- Gallagher, D.; Visser, M.; Sepulveda, D.; Pierson, R.N.; Harris, T.; Heymsfield, S.B. How useful is body mass index for comparison of body fatness across age, sex, and ethnic groups? Am. J. Epidemiol. 1996, 143, 228–239. [Google Scholar] [CrossRef]
- Zeller, M.H.; Inge, T.H.; Modi, A.C.; Jenkins, T.M.; Michalsky, M.P.; Helmrath, M.; Courcoulas, A.; Harmon, C.M.; Rofey, D.; Baughcum, A.; et al. Severe obesity and comorbid condition impact on the weight-related quality of life of the adolescent patient. J. Pediatr. 2015, 166, 651–659. [Google Scholar] [CrossRef]


| Variables | Mean (SD) | Range |
|---|---|---|
| Age (years) | 63.65 (10.02) | 27–80 |
| BMI (kg/m2) | 25.02 (3.35) | 15–40 |
| Blood pressure (mm Hg) | ||
| Systolic blood pressure | 124.65 (15.41) | 87–183 |
| Diastolic blood pressure | 74.43 (9.78) | 49–105 |
| n (%) | ||
| Gender | ||
| Male | 348 (65.17) | |
| Female | 186 (34.83) | |
| Annual household income | ||
| Low (1) | 134 (26.03) | |
| Middle/low (2) | 153 (28.65) | |
| Middle/high (3) | 114 (21.35) | |
| High (4) | 124 (23.22) | |
| Missing | 4 (0.75) | |
| Education | ||
| Elementary school | 228 (42.70) | |
| Middle school | 73 (13.67) | |
| High school | 136 (25.47) | |
| ≥University | 96 (17.98) | |
| Missing | 1 (0.19) | |
| Alcohol consumption status | ||
| Drink | 319 (59.74) | |
| No drink | 215 (40.26) | |
| Smoking status | ||
| Current smoker | 355 (66.48) | |
| Past smoker | 119 (22.28) | |
| Non-smoker | 60 (11.24) | |
| Variables | 2. Light Physical Activity | 3. Perceived Body Shape | 4. BMI | 5. Quality of Life | 6. Alcohol Consumption Status | 7. Smoking Status |
|---|---|---|---|---|---|---|
| 1. Sedentary behavior (sitting) | −0.109 * | 0.045 | 0.048 | −0.072 | −0.024 | 0.087 * |
| 2. Light physical activity | −0.035 | −0.144 ** | 0.120 ** | 0.047 | 0.005 | |
| 3. Perceived body shape | 0.692 ** | −0.078 | 0.081 | −0.020 | ||
| 4. BMI | −0.156 ** | 0.038 | 0.034 | |||
| 5. Quality of life | 0.178 ** | 0.052 | ||||
| 6. Alcohol consumption status | 0.272 ** | |||||
| 7. Smoking status |
| Fit Statistics | 1 Class | 2 Classes | 3 Classes | 4 Classes |
|---|---|---|---|---|
| AIC | 9099.53 | 5348.23 | 5138.27 | N/A |
| BIC | 9150.87 | 5429.42 | 5266.63 | |
| SSA-BIC | 9112.78 | 5369.11 | 5171.40 | |
| BLRT p-value | <0.001 | <0.001 | ||
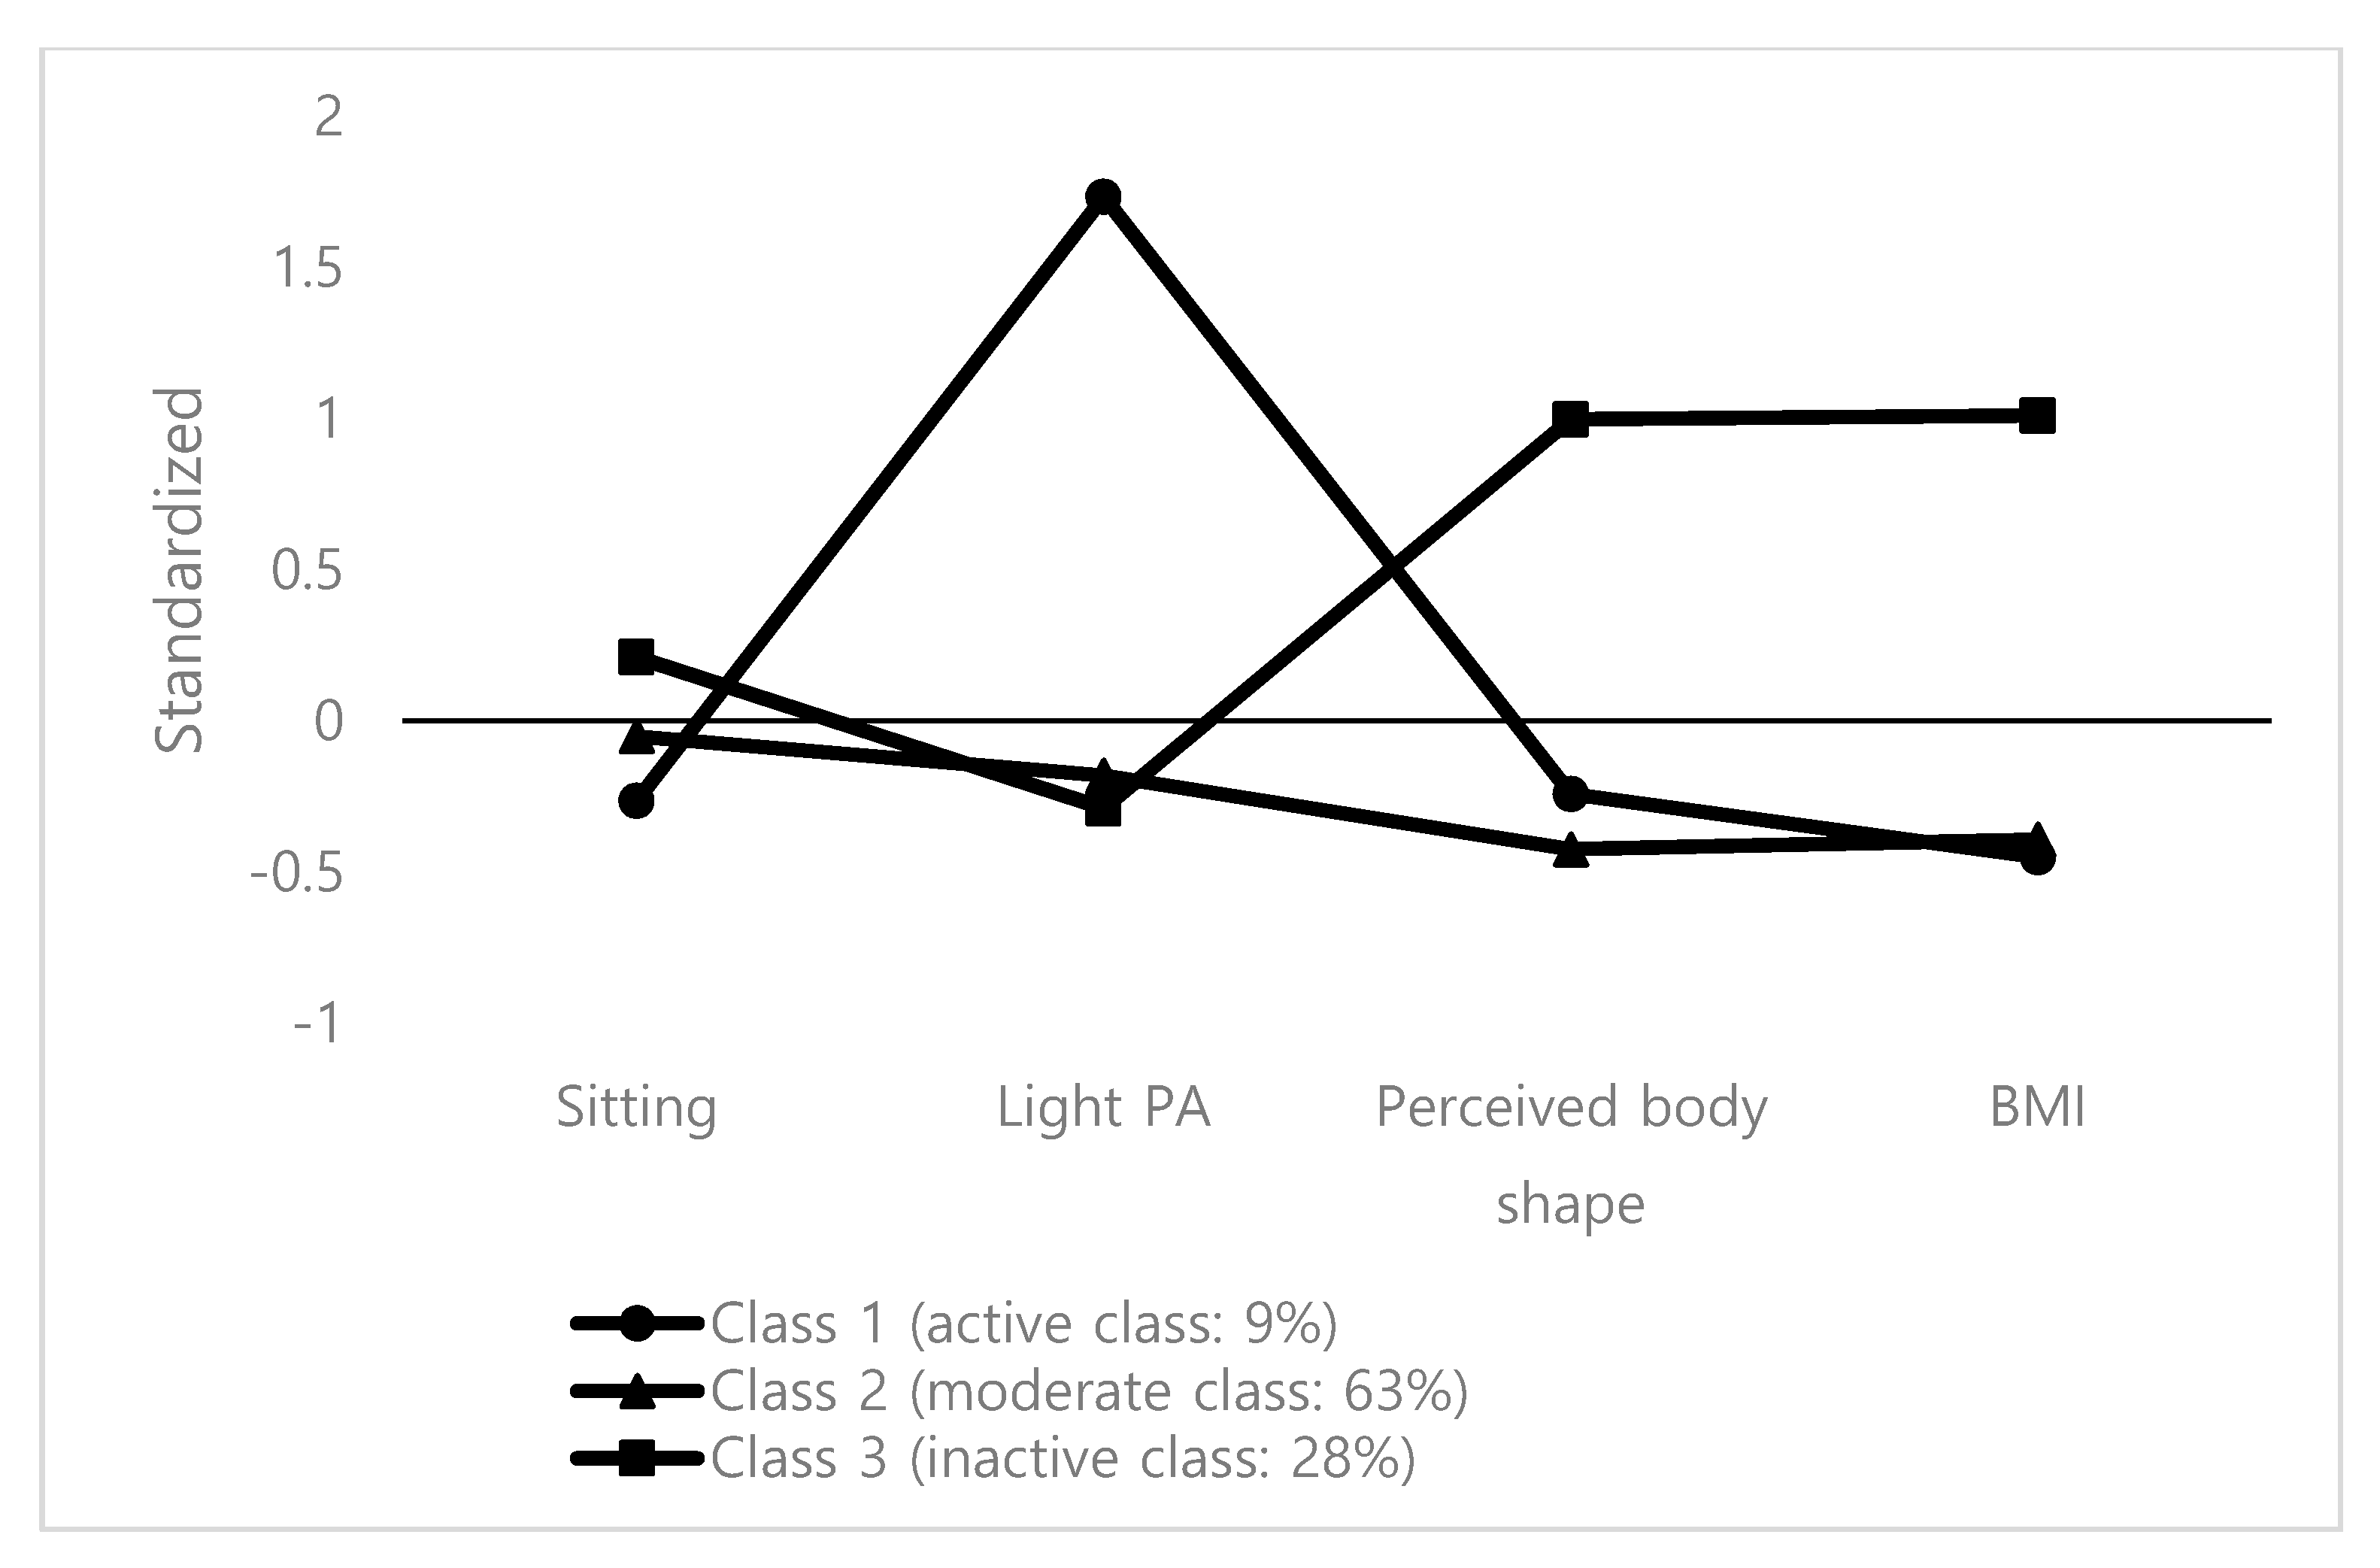
| Percent of participants per Class (%) | n = 477 (90%), n = 56 (11%) | Class 1 (n = 48: 9%), Class 2 (331: 62%), Class 3 (154: 29%) |
| Variables | Active Class (Class 1; n = 48, 9%) | Moderate Class (Class 2; n = 331, 62%) | Inactive Class (Class 3; n = 154, 29%) Inactive | Cohen’s d Effect Size | |||||
|---|---|---|---|---|---|---|---|---|---|
| M | SD | M | SD | M | SD | dactive-moderate | dactive-inactive | dmoderate-inactive | |
| Sitting | 395.60 | 225.08 | 441.63 | 283.49 | 495.85 | 478.37 | 0.18 | 0.27 | 0.14 |
| Light PA | 153.20 | 209.13 | 26.69 | 80.91 | 19.74 | 100.42 | 0.80 | 0.81 | 0.08 |
| Perceived body shape | 3.24 | 1.98 | 3.06 | 3.35 | 4.41 | 1.58 | 0.07 | 0.67 | 0.52 |
| BMI | 23.50 | 6.21 | 23.69 | 8.02 | 28.38 | 10.52 | 0.03 | 0.57 | 0.50 |
| Classes | Quality of Life | |
|---|---|---|
| Mean | SD | |
| Active class (class 1; n = 48) | 0.95 | 0.14 |
| Moderate class (class 2; n = 331) | 0.91 | 0.16 |
| Inactive class (class 3; n = 154) | 0.86 | 0.22 |
| Class comparison | Chi square | p |
| Overall test | 11.64 | 0.003 |
| Active vs. moderate | 2.99 | 0.084 |
| Active vs. inactive | 11.41 | 0.001 |
| Moderate vs. inactive | 5.44 | 0.019 |
| Cohen’s d effect size | ||
| dactive-moderate | 0.27 | |
| dactive-inactive | 0.49 | |
| dmoderate-inactive | 0.26 | |
© 2019 by the authors. Licensee MDPI, Basel, Switzerland. This article is an open access article distributed under the terms and conditions of the Creative Commons Attribution (CC BY) license (http://creativecommons.org/licenses/by/4.0/).
Share and Cite
Park, S.; Park, S.-Y.; Oh, G.; Oh, I.-H. Latent Profiles Based on Light Physical Activity, Sedentary Behavior, Perceived Body Shape, and Body Mass Index in Patients with Dyslipidemia Influence Their Quality of Life. Int. J. Environ. Res. Public Health 2019, 16, 4034. https://0-doi-org.brum.beds.ac.uk/10.3390/ijerph16204034
Park S, Park S-Y, Oh G, Oh I-H. Latent Profiles Based on Light Physical Activity, Sedentary Behavior, Perceived Body Shape, and Body Mass Index in Patients with Dyslipidemia Influence Their Quality of Life. International Journal of Environmental Research and Public Health. 2019; 16(20):4034. https://0-doi-org.brum.beds.ac.uk/10.3390/ijerph16204034
Chicago/Turabian StylePark, Saengryeol, So-Youn Park, Gapjin Oh, and In-Hwan Oh. 2019. "Latent Profiles Based on Light Physical Activity, Sedentary Behavior, Perceived Body Shape, and Body Mass Index in Patients with Dyslipidemia Influence Their Quality of Life" International Journal of Environmental Research and Public Health 16, no. 20: 4034. https://0-doi-org.brum.beds.ac.uk/10.3390/ijerph16204034