Article

Observation of Dispersion in the Japanese Coastal Area of Released 90Sr, 134Cs, and 137Cs from the Fukushima Daiichi Nuclear Power Plant to the Sea in 2013

1
Department of Radiation Chemistry, Institute of Radiation Emergency Mediation, Hirosaki University, Hirosaki 036-8652, Japan
2
College of Humanities and Sciences, Nihon University, Tokyo 156-8550, Japan
3
Graduate School of Basic Integrated Sciences, Nihon University, Tokyo 156-8550, Japan
4
Atmosphere and Ocean Research Institute, University of Tokyo 277-8564, Japan
5
Environmental Science Research Laboratory, Central Research Institute of Electric Power Industry, Tokyo 270-1194, Japan
6
Department of Ocean Sciences, Graduate Faculty of Marine Science, Tokyo University of Marine Science and Technology, Tokyo 108-8477, Japan
7
Marine Ecology Research Institute, Chiba 299-5105, Japan
*
Author to whom correspondence should be addressed.
Int. J. Environ. Res. Public Health 2019, 16(21), 4094; https://0-doi-org.brum.beds.ac.uk/10.3390/ijerph16214094
Submission received: 30 September 2019 / Revised: 21 October 2019 / Accepted: 22 October 2019 / Published: 24 October 2019

Abstract

:
The March 2011 earthquake and tsunami resulted in significant damage to the Fukushima Daiichi Nuclear Power Plant (FDNPP) and the subsequent release of radionuclides into the ocean. Here, we investigated the spatial distribution of strontium-90 (90Sr) and cesium-134/cesium-137 (134, 137Cs) in surface seawater of the coastal region near the FDNPP. In the coastal region, 90Sr activity was high, from 0.89 to 29.13 mBq L−1, with detectable FDNPP site-derived 134Cs. This indicated that release of 90Sr from the power plant was ongoing even in May 2013, as was that of 134Cs and 137Cs. 90Sr activities measured at open ocean sites corresponded to background derived from atmospheric nuclear weapons testing fallout. The FDNPP site-derived 90Sr/137Cs activity ratios in seawater were much higher than those in the direct discharge event in March 2011, in river input, and in seabed sediment; those ratios showed large variability, ranging from 0.16 to 0.64 despite a short sampling period. This FDNPP site-derived 90Sr/137Cs activity ratio suggests that these radionuclides were mainly derived from stagnant water in the reactor and turbine buildings of the FDNPP, while a different source with a low 90Sr/137Cs ratio could contribute to and produce the temporal variability of the 90Sr/137Cs ratio in coastal water. We estimated the release rate of 90Sr from the power plant as 9.6 ± 6.1 GBq day−1 in May 2013 on the basis of the relationship between 90Sr and 137Cs activity (90Sr/137Cs = 0.66 ± 0.05) and 137Cs release rate.

1. Introduction

Large amounts of radionuclides, such as cesium-134 (134Cs), cesium-137 (137Cs), and iodine-131 (131I), were dispersed into the terrestrial and aquatic environments as a result of an accident at the Fukushima Daiichi Nuclear Power Plant (FDNPP) of the Tokyo Electric Power Company (TEPCO) in March 2011. Atmospheric release of strontium-90 (90Sr) in March 2011 was two to four orders of magnitude lower than that of 137Cs on the basis of an analysis of highly contaminated soils (<1.1 Bq g−1) and vegetation (0.026–1.1 Bq g−1) collected from a contaminated area in Japan [1]. These 90Sr/137Cs activity ratios were much lower than the ratio for the estimated nuclear fuel compositions (90Sr/137Cs = 0.74) found in the reactor obtained by the ORIGEN2 code [2]. Atmospheric 90Sr release (0.01–0.14 PBq [3]) was estimated at less than 0.027% of the total amount in the nuclear fuel (5.2 × 10² PBq [2]) at FDNPP reactor units 1, 2, and 3. Most of the 90Sr remained in the reactor, although some of it had dissolved in stagnant water in the reactor and turbine buildings. Observed 90Sr and 137Cs concentrations in the stagnant water were 140 MBq L−1 and 2.8 GBq L−1, respectively, on 27 March 2011 [4]. Hence, 137Cs concentrations were 20 times higher than 90Sr concentrations, and 1.6% of the 90Sr core inventory was dissolved into stagnant water [2], which was the most likely candidate for pollution to the ocean. 90Sr in seawater could be a useful tracer specific to the radionuclide contaminants directly released from the FDNPP into the ocean.
Analytical results of the stagnant water sampled from a turbine building in February 2012 indicated that 137Cs activity decreased to 240 MBq L−1, while 90Sr concentration remained high (170 MBq L−1) [5]. Highly contaminated stagnant water was decontaminated and stored in storage tanks on the FDNPP site. Some decontaminated water was transferred into reactors for cooling purposes after distillation or reverse osmosis processes. Before 2015, the decontamination system was optimized to remove Cs; hence, the treated water had significantly higher 90Sr activity (150 MBq L−1) than 137Cs activity (3.9 kBq L−1) [5]. This treated water in the storage tanks was a potential source for 90Sr contamination in the environment.
In observation wells between the reactor buildings and the harbor, groundwater was also monitored by TEPCO after a leakage event of contaminated water in December 2012 [4]. In particular, 90Sr activity in groundwater in the wells near the seawater intake for reactor units 1 and 2 were significantly higher than the 137Cs activity (e.g., 90Sr: 5 × 10⁶ Bq L−1; 137Cs: 2.1 × 10² Bq L−1 at the no. 1–2 wells on 5 July 2013 [6]). The 90Sr-enriched groundwater might have resulted from leakage of the decontamination system or from stagnant water. Due to these existing contamination sources, it is necessary to observe the 90Sr behavior in the aquatic environment near the FDNPP.
Kanda [7] indicated that continuous release of 137Cs from the FDNPP harbor to the ocean was occurring in 2012 based on time series seawater monitoring data. Due to the high 90Sr/137Cs activity ratio in the stagnant water, 90Sr release from the FDNPP should also be evaluated. TEPCO has continued seawater monitoring for 90Sr, 134,137Cs, and other radionuclides near the FDNPP [3,6]. However, only a few 90Sr data were obtained within small areas, particularly after 2012 (Figure 1).
This limited monitoring cannot evaluate how much 90Sr was released or its impact on the coastal environment and open ocean.
Time series seawater monitoring by TEPCO of 90Sr near the FDNPP was infrequent compared to that for radiocesium [3,6]. Povinec et al. [3] showed that the 90Sr/137Cs ratio in seawater at a monitoring point near FDNPP increased gradually from 0.01 to 1 between April 2011 and February 2012 (Figure 1), which clearly related with decontamination of stagnant water. The transient increase of 90Sr in seawater at the T2 site observed in December 2011 could reflect the leakage event from the 137Cs decontamination system [4]. After 2012, the 90Sr/137Cs ratio remained at a constant value around 0.5 at the T2 site with large variability. 90Sr/137Cs activity ratios in stagnant water have varied depending on the decontamination of 134, 137Cs. The agreement between the temporal variation of 90Sr/137Cs activity ratio and decontamination of the stagnant water supported the idea that the most probable candidate was the continuous release from reactor buildings of the FDNPP.
The behavior of 137Cs in seawater and biota after the accident has been well documented [7,8,9,10,11]. High-density sampling of surface seawater to determine radiocesium activity [12] has been carried out. Kumamoto et al. [13] reported detailed vertical distributions of Fukushima-derived radiocesium along the 149 °E meridian in the western North Pacific. However, distributions of 90Sr derived from the FDNPP in the sea have been studied to a significantly lesser extent [3,6,14,15,16,17]. Castrillejo et al. [17] suggested that continuous release of 90Sr from the FDNPP was occurring in September 2013 based on simultaneous observations of 90Sr and 137Cs. The estimated release rate of 90Sr was 2.3–8.5 GBq day−1, which was 2–3 orders of magnitude larger than river inputs.
It is still necessary to investigate the amount of released 90Sr, including its subsequent dispersion from the FDNPP site to the ocean. Simultaneous determinations of 90Sr and 137Cs in seawater are important for monitoring the release of radionuclides from the reactor buildings and contaminated water from the storage tanks. By comparing 90Sr behavior with that of 137Cs in the ocean, we studied the input source to the sea and the environmental migration processes of both radionuclides, such as fluvial input, desorption from sediment, and atmospheric deposition. Accumulating environmental data and understanding the dispersion to the coastal and open oceans are necessary to respond to any accidental release during decommissioning of the FDNPP—work that will require more than 30 years. Our aim in this study is to determine the distributions of 90Sr, 134Cs, and 137Cs in 2013 and evaluate the continuous release of radionuclides from the FDNPP to the ocean based on the comprehensive analysis of seawater.

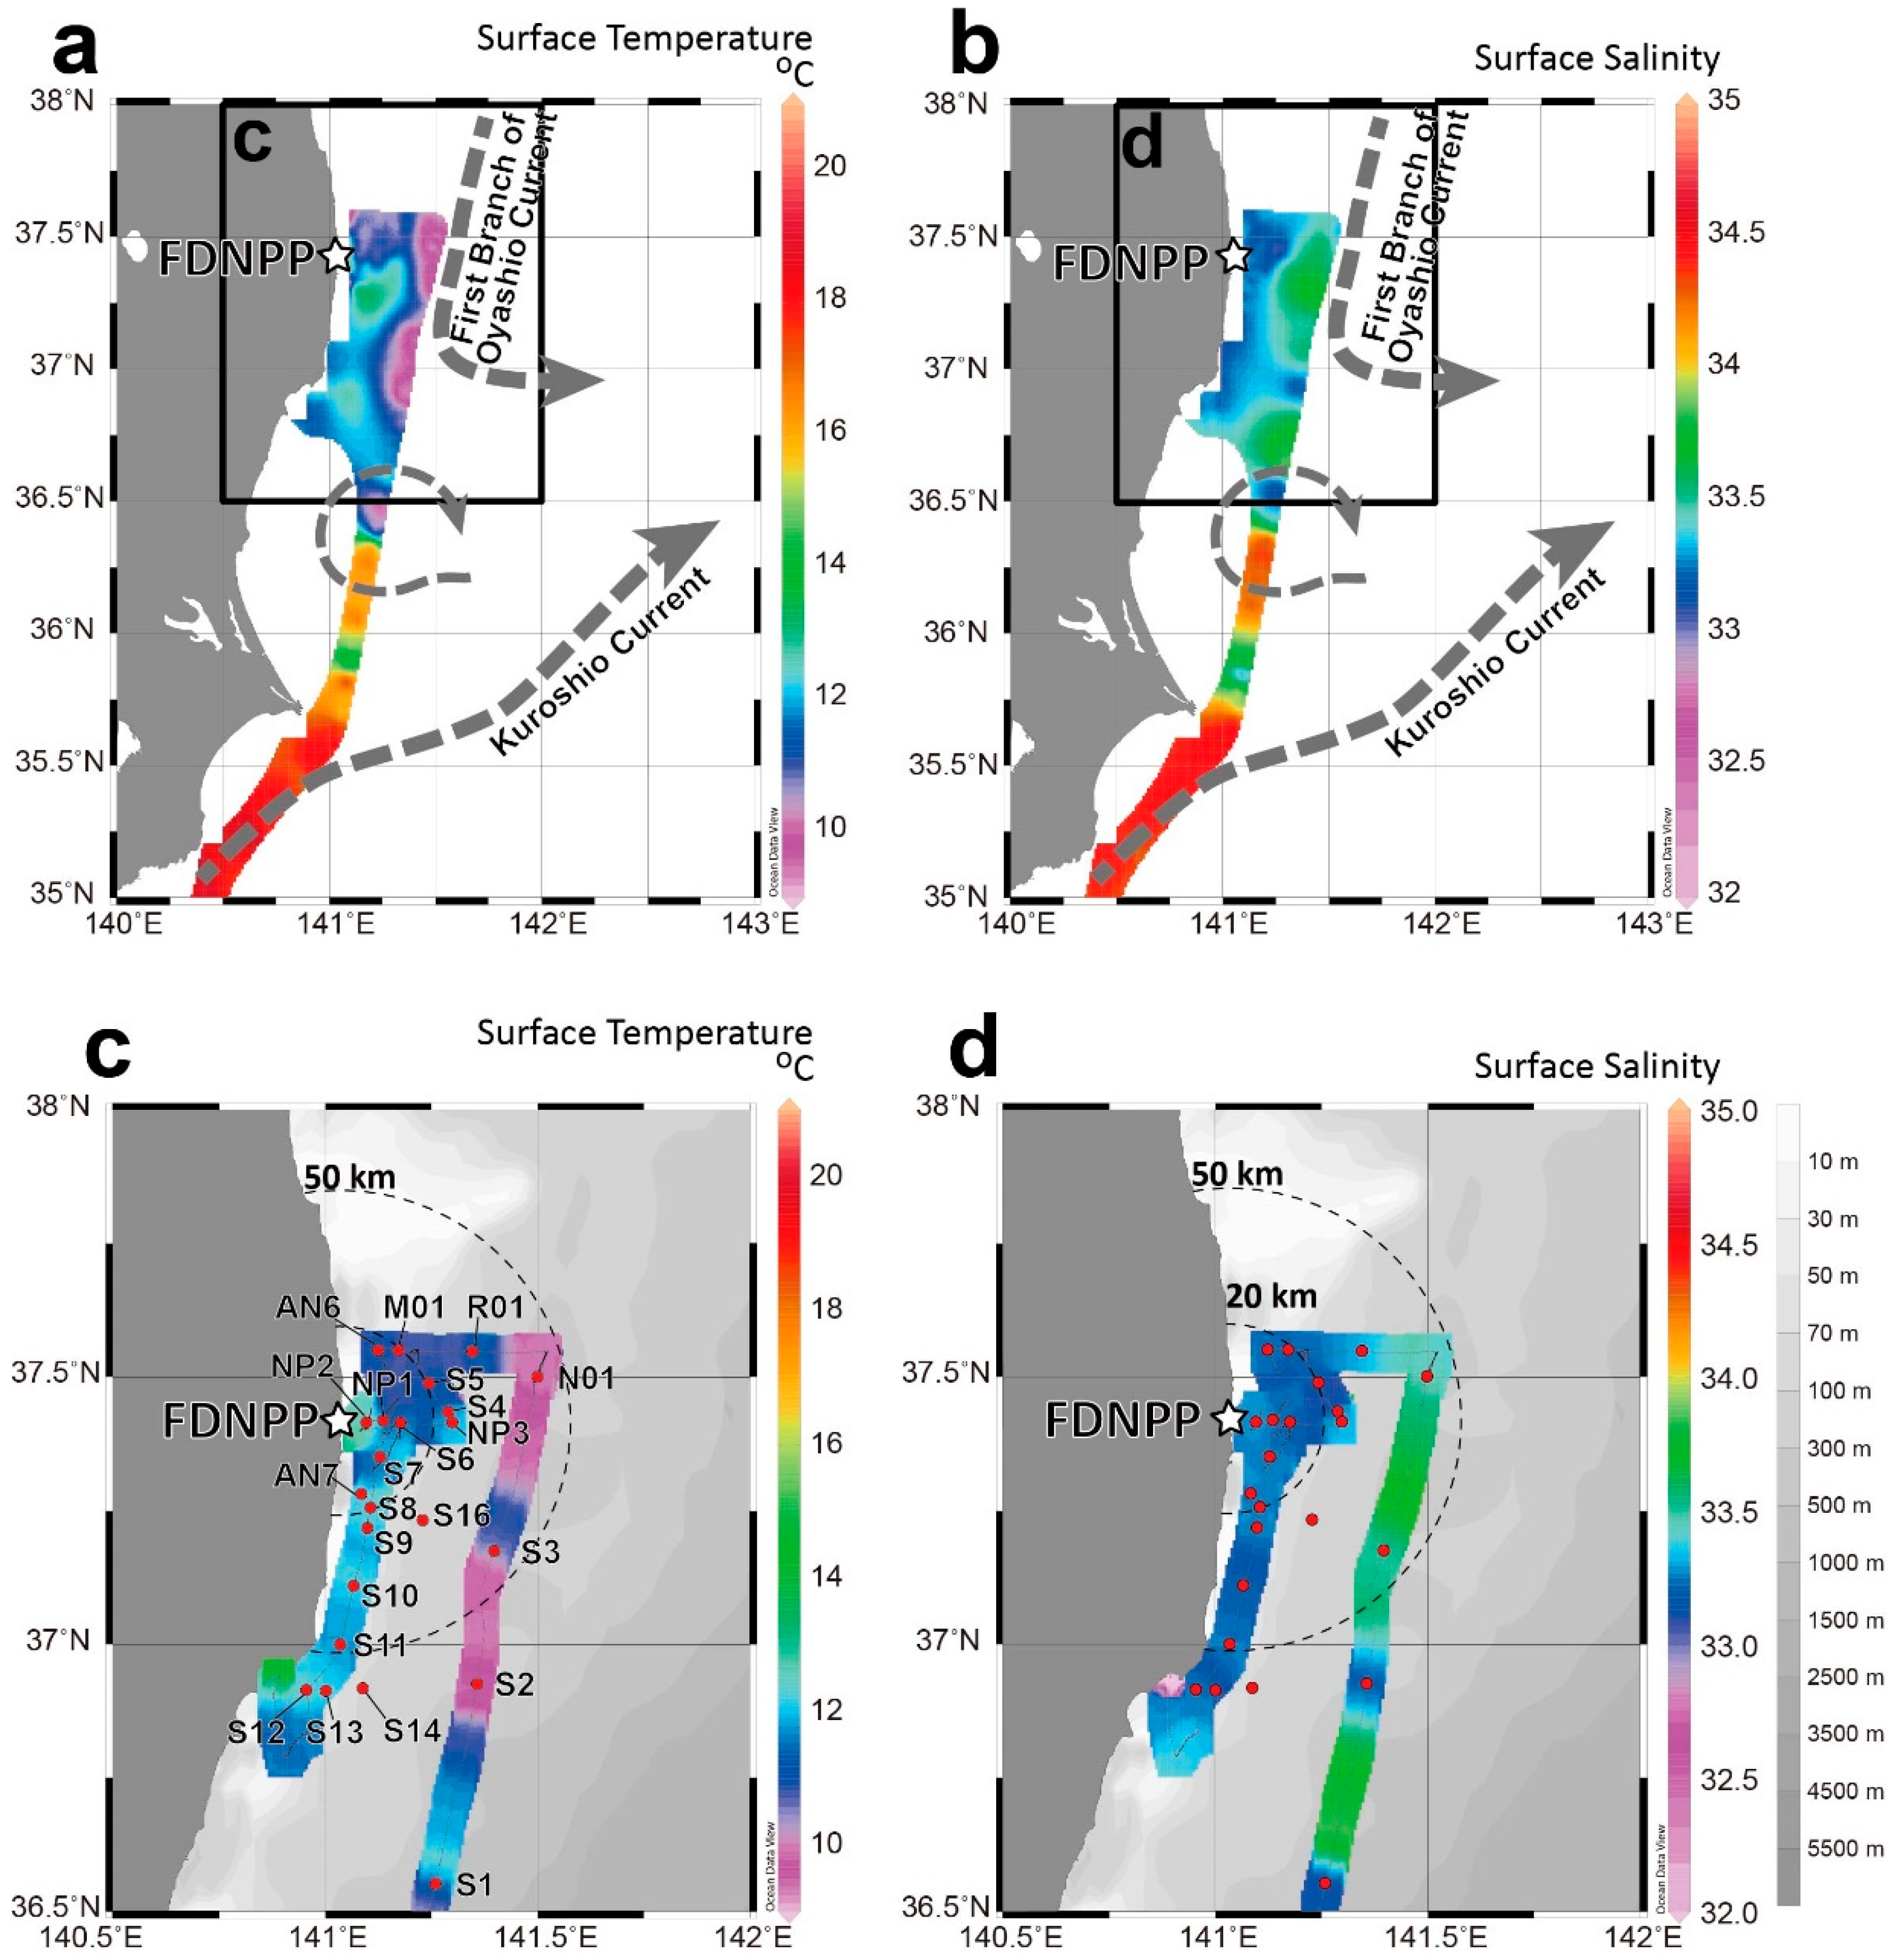
2. Surface Current System off Fukushima Coast

The Kuroshio and Oyashio currents are generated in the mixed region around 36 °N off the Ibaraki Prefecture coast in the subject area (Figure 2a,b). The warm (16.5–22.0 °C) and saline (34.4–34.8 psu) Kuroshio flows northeastward off the Boso Peninsula. The Oyashio current, off the Fukushima Prefecture coast, intrudes southward into the mixing region. The southward intrusion (9.5–10.5 °C, salinity 33.4–33.8 psu) reaches 36.5 °N, 141.3 °E, and is called the First Branch of the Oyashio [18]. The coastal currents near Fukushima Prefecture are variable on a time scale different from those of the Kuroshio and Oyashio currents. Coastal water is at a higher temperature (10.8–12.7 °C) and lower salinity (33.2–33.4 psu) relative to the first branch of the Oyashio current. Current meter observations made between 1971 and 1981 [19] indicated that the along-shore (north–south component) currents were dominant in this coastal area. The direction of the currents varied approximately every 3−4 days because of changes in the synoptic-scale wind fields [19]. The spread of radionuclides from the direct-release event in April 2011 depended on the coastal current system. Model simulation of directly released Cs employed the Regional Ocean Modeling System (ROMS), which indicated that the plume was southwardly advected to the coastal region [20].

3. Materials and Methods

Seawater samples for the analysis of 90Sr, 134Cs, and 137Cs were obtained during the UM13-5 cruise from 14 to 23 May 2013 undertaken by the RTV Umitaka−Maru of the Tokyo University of Fisheries, Japan. Seawater sampling sites were located in the offshore region in the first branch of the Oyashio current and the coastal region near Fukushima Prefecture (Figure 2c,d). Most of the coastal sites were south of the FDNPP and close to Iwaki city. The closest observation site to the FDNPP was NP-2, located approximately 6 km east of it. During the sampling period, most of the influence from the FDNPP could be detected in the region associated with the southerly coastal current.
During the cruise, surface seawater samples were collected by an underway sampling system, whose inlet was located on the bottom of the ship, at a depth 5 m below the surface. Collected samples were filtered through a 0.5 μm pore polypropylene cartridge filter (TCW-05N-PPS, Advantec, Tokyo, Japan). Filtered water samples were stored in 20 L polyethylene bags and 90Sr and radiocesium analyses were carried out separately on land.
We conducted 134Cs and 137Cs analyses based on Aoyama et al. [21]. First, 20 L of a filtered seawater sample was acidified to pH 1.6 with HNO3. Next, 0.26 g of CsCl was added and the solution was adsorbed on ammonium phosphomolybdate (AMP) [21]. Then, AMP was collected by filtering through a 0.45 μm pore mixed cellulose esters membrane (A045A047A, Advantec, Tokyo, Japan). After drying the AMP/Cs compound, gamma rays were counted for 80,000–200,000 s with a lead-shielded HPGe detector (EGPC 250-P 15, EURISYS MEASURES, NV, USA), 604.7 keV for 134Cs and 661.7 keV for 137Cs, at the Nihon University in Tokyo. Since the detector was slightly contaminated by atmospherically released 134Cs and 137Cs at the time of the accident of the FDNPP, the background was determined before and after this counting period and subtracted from the detected signals for seawater samples. Cs yield was determined gravimetrically based on AMP weight. The typical minimum detectable concentrations (MDCs) of 134Cs and 137Cs were 0.5 mBq L−1 and 0.4 mBq L−1, respectively.
For 90Sr analysis, we added 150 g of (NH4)2C2O4 H2O to 20 L of filtered seawater and shook the solution vigorously. Sr was precipitated with Ca oxalate. Oxalate precipitate was decomposed to carbonate at 550 °C in a muffle oven. Then, the precipitate was dissolved in HCl and diluted to about 200 mL with Milli-Q water. A small portion of sample solution was used for determination of stable Sr yield by ICP-OES (SPECTROBLUE TI, SPECTRO Analytical Instruments GmbH, Kleve, Germany). After secular equilibrium between 90Sr and yttrium-90 (90Y) (>2 weeks), 90Y with stable Y carrier (0.1 mg) was “milked” from the 90Sr by precipitating the Fe hydroxide and purified by solid phase extraction using DGA Resin (DN1ML-R50-S) purchased from Eichrom Technologies, LLC. (IL, USA). Detailed chemical separation and beta counting procedures are described elsewhere [22,23]. Beta particles were counted by a low background 2π gas flow proportional counter (LB−4200, Canberra, NV, USA) during 120 min intervals for more than 20 h. Typical Sr and Y yields were 82 ± 9 % and 95 ± 5 %, respectively.

4. Results

Activities of 90Sr, 134Cs, and 137Cs in surface seawater samples collected in May 2013 are summarized in Table 1. Mean 90Sr activity of 0.80 ± 0.11 mBq L−1 at offshore sites (S1, S2, S3, and N01) was slightly lower than the estimated value (1.0 ± 0.1 mBq L−1 [3]) based on long-term monitoring for surface water of the western North Pacific. Around sites S2, S3, and N01, cool surface water (9.4–10.4 °C) from the southerly first branch of the Oyashio current was present. 134Cs activities were lower than the MDC (<0.5 mBq L−1) at the offshore sites. In this study, we used values obtained at the offshore sites as the background level originating from atmospheric nuclear weapons testing. Compared to 137Cs and 90Sr, 134Cs has a relatively short half-life (2.06 years compared to 30.17 years for 137Cs and 28.8 years for 90Sr).
High 90Sr activities were observed along the coastal region with higher temperatures (10.86–12.89 °C) and higher salinity (33.23–33.35 psu). The highest 90Sr activity (29.13 ± 0.35 mBq L−1) was found at AN7, approximately 16 km south of the FDNPP, with 22.4 ± 0.6 mBq L−1 for 134Cs activity and 44.7 ± 0.4 mBq L−1 for 137Cs activity. At the NP-2 site closest to the FDNPP (5 km offshore) in this sampling campaign, we also found high 90Sr activity (21.81 ± 0.28 mBq L−1). Furthermore, at S12 off Iwaki City, 57 km south of the FDNPP, relatively high 90Sr activity (9.86 ± 0.22 mBq L−1) was found. Distributions of radiocesium activities in surface seawater showed similar trends to those of 90Sr. The maximum radiocesium activities were obtained at AN7; in particular, 137Cs activities ranged from 1.4 mBq L−1 at S2 to 44.7 mBq L−1 there. In the coastal region, 134Cs activities were in agreement with 137Cs activities corrected to 11 March 2011, which indicated that this radiocesium was derived from the Fukushima accident (134Cs/137Cs = 0.99 ± 0.03 [11]).

5. Discussion

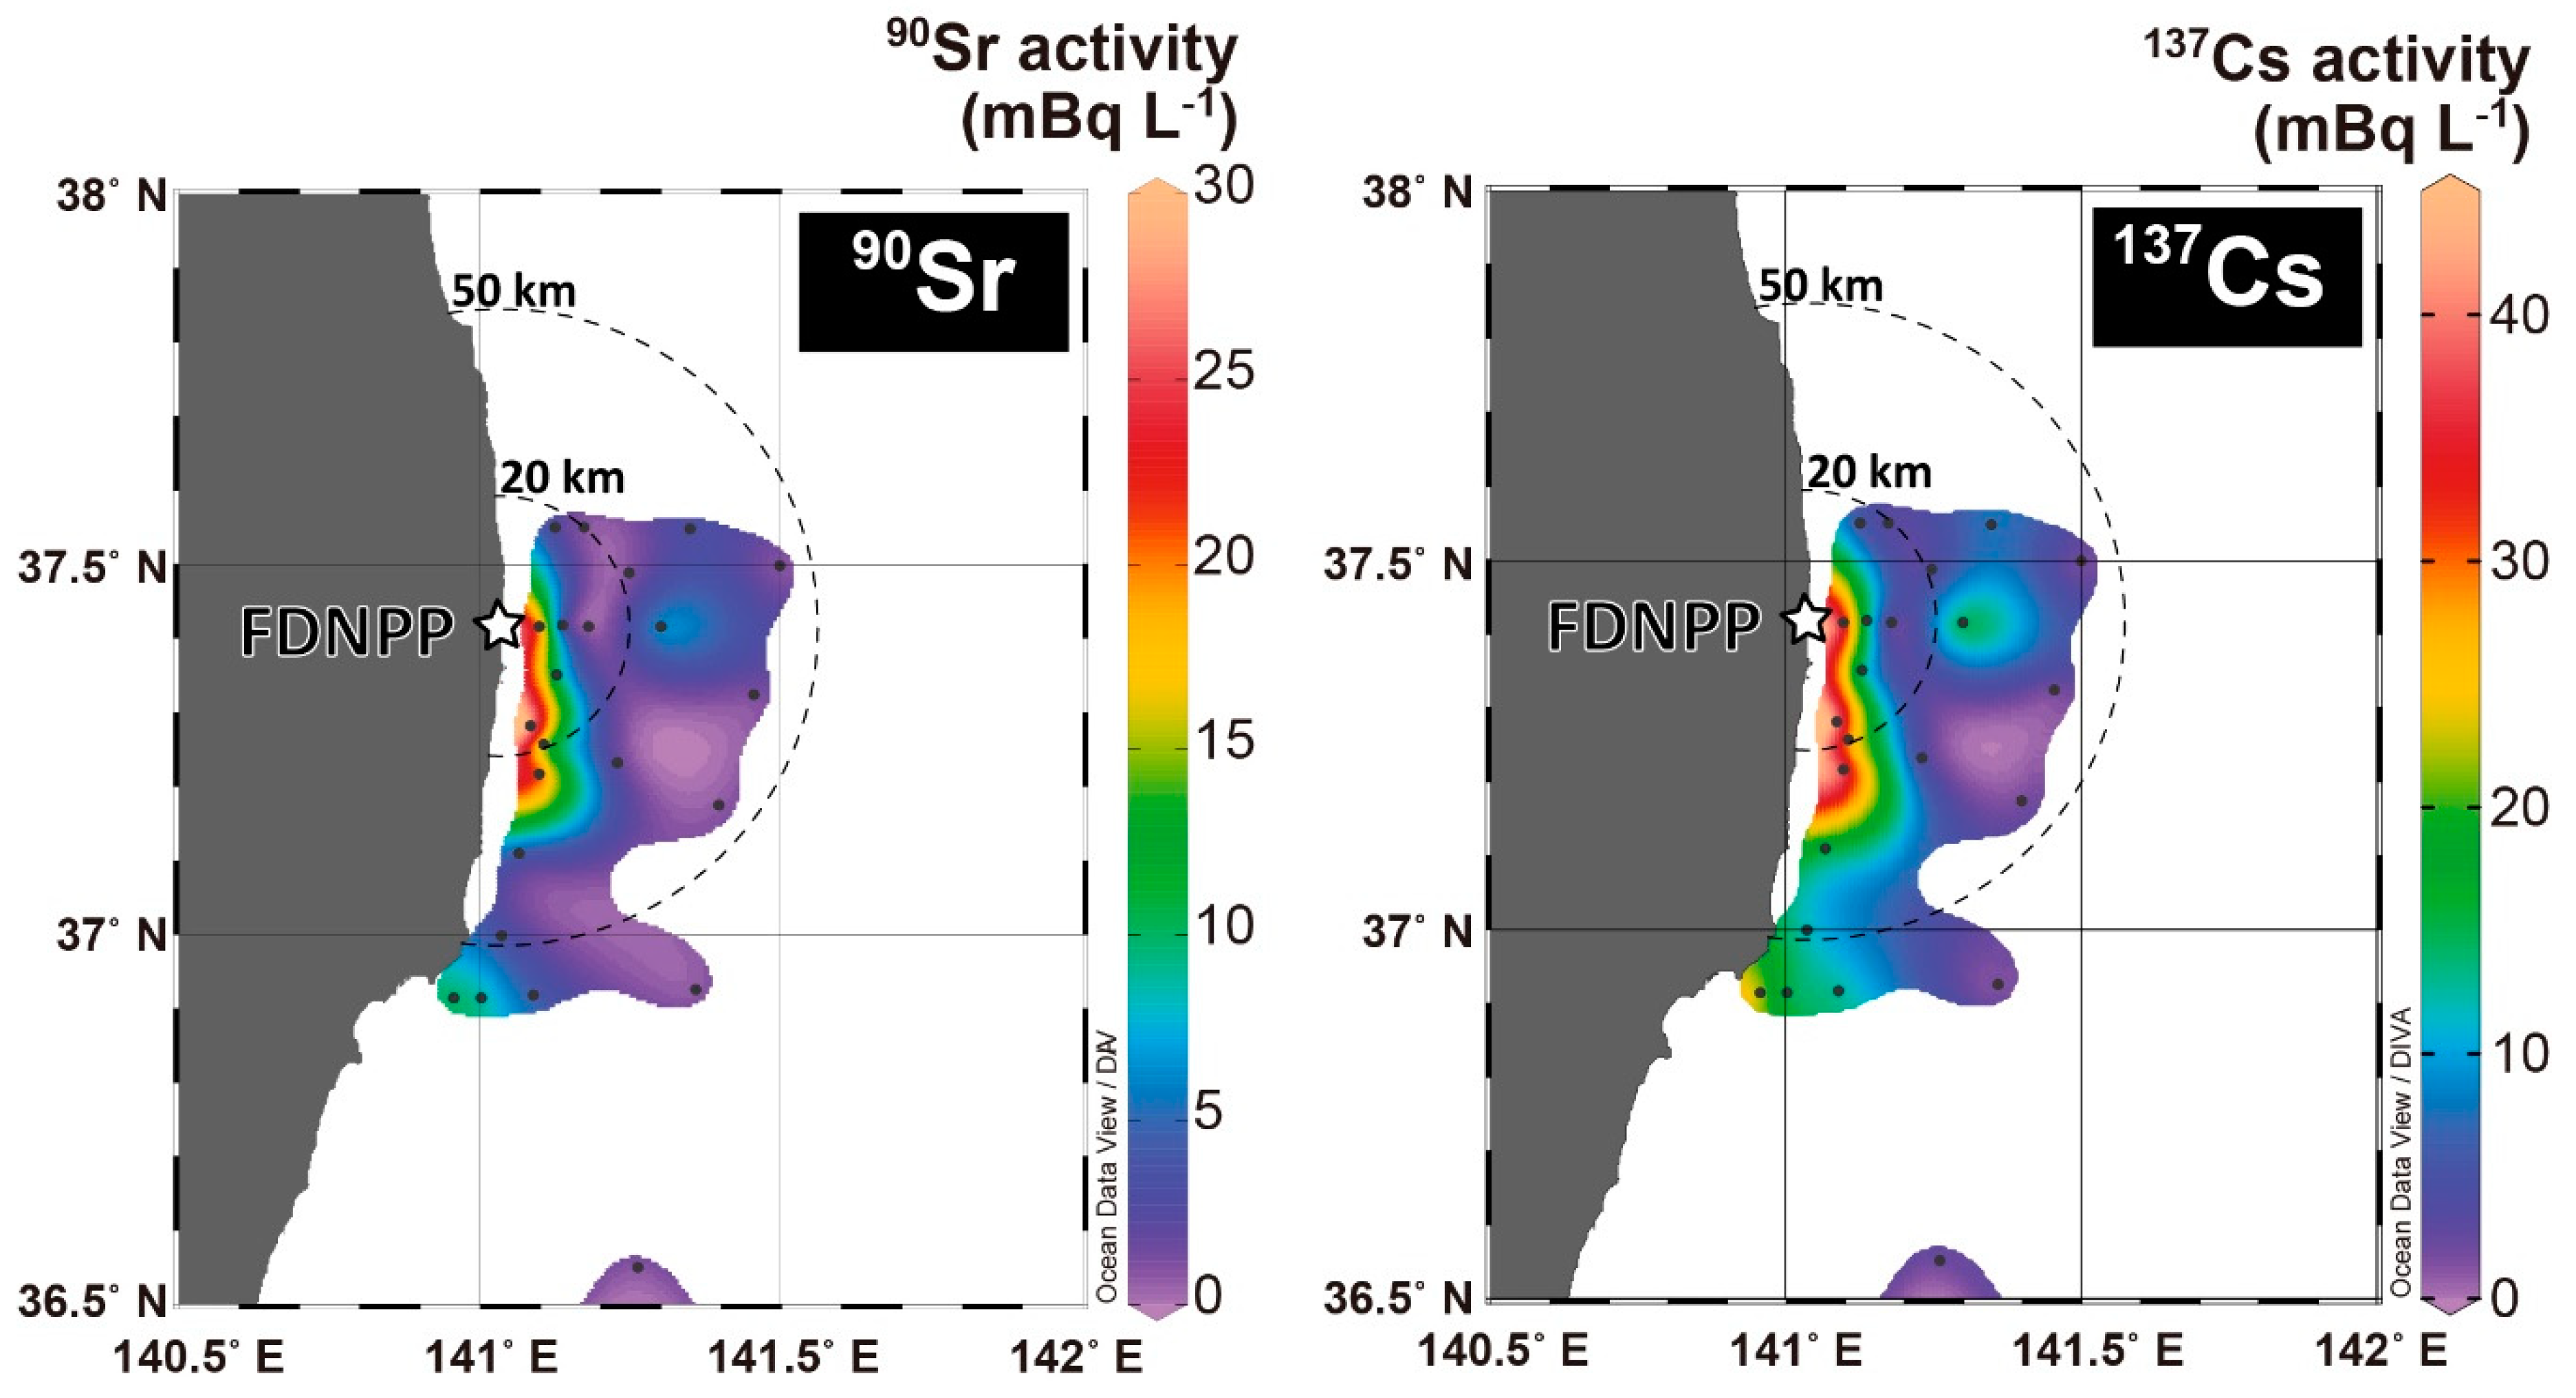
5.1. Dispersion of High 90Sr and 134, 137Cs Activity Plume

The high activities of 90Sr and 137Cs in the coastal region (Figure 3) can be explained by the release at the time of the FDNPP accident and the physical processes that later occurred in the ocean. In the coastal region, high 90Sr activity seawater samples with high 134Cs and 137Cs activities were mainly collected from south of the FDNPP (NP2, and AN7) to off Iwaki (S12 and S6), which reflects the southward transport of seawater along the Fukushima coast by the coastal currents. Higher 90Sr activity in seawater (>8 mBq L−1) was found where the salinity was 33.23–33.33 psu and 11.95–12.41 psu. In the coastal region, no clear correlation between 90Sr and salinity or 90Sr and temperature was observed.
The distributions of 90Sr and 137Cs activities in May 2013 observed in this study correspond to those of a model simulation of the direct-release event between 26 March and 6 April 2011 [20]. The 137Cs released from the FDNPP from 26 March was initially advected southward, then transported to the Ibaraki coast. This simulation suggested that the 137Cs concentration decreased in May due to advection and diffusion in the open ocean. The coastal currents are variable in this region and sometimes flow northward. Oikawa et al. [16] compiled monitoring data for seawater in the coastal region by the Ministry of Education, Culture, Sports, Science and Technology, Japan (MEXT) and suggested that the activities of 90Sr in surface water decreased slowly over time in 2011 and reached the background level by the end of December 2011. However, because of a lack of sampling sites for 90Sr, the 90Sr plume could have been missed in previous observations. The distribution of our results indicates that the released 90Sr plume from the FDNPP site (leakage of contaminated water from storage tanks) could move to the coastal region south of the FDNPP, carried by the southward coastal current.
Both activities decreased rapidly from NP2 toward the eastern sites (S6, NP1, and NP3), which indicate that the eastward dispersion was limited because of the effect of the southern coastal current during this sampling period. Compared with the pre-Fukushima accident, offshore 90Sr activities in the north Pacific Ocean (1.0 ± 0.1) [3] and the activities measured in May 2013 indicate that the influences of the Fukushima-derived 90Sr on open ocean sites in the mixed region between the Oyashio and Kuroshio currents were negligibly small, as were those of 134Cs and 137Cs. However, if any accidental releases from the FDNPP site were to occur during the decommissioning of the reactors, coastal areas could be exposed to a high activity plume.
In September 2017, low 90Sr (1.0−1.8 mBq L−1) and high 137Cs (9−43 mBq L−1) activities were obtained at low salinity (4–28 psu) in groundwater and beach seawater samples from Sendai Bay, located north of the FDNPP [17]. 90Sr/137Cs ratios ranged from 0.036 to 0.19. The 137Cs activity in low salinity samples was affected by atmospheric fallout from the FDNPP accident that was deposited on land, while 90Sr activity was not sensitive to terrestrial input. Therefore, the relationship between 90Sr and 137Cs can be a useful indicator for river input.
The mouth of the Ukedo River is located between collection sites NP2 and AN6. 137Cs activity at NP2 (39.0 mBq L−1) was more than five times higher than that at AN6 (6.9 mBq L−1), though their salinities were comparable (33.24 and 33.26 psu). Dissolved 137Cs activity in the Ukedo River, which drains a highly contaminated area, ranged from 200 to 1100 Bq L−1 in August and November 2012 [6]. 90Sr activity in the Ukedo River was not available but the reported 90Sr/137Cs ratio for river water in the Fukushima Prefecture [6] was less than 0.04. The contribution to 90Sr activity in seawater by input from the Ukedo River should be minor.

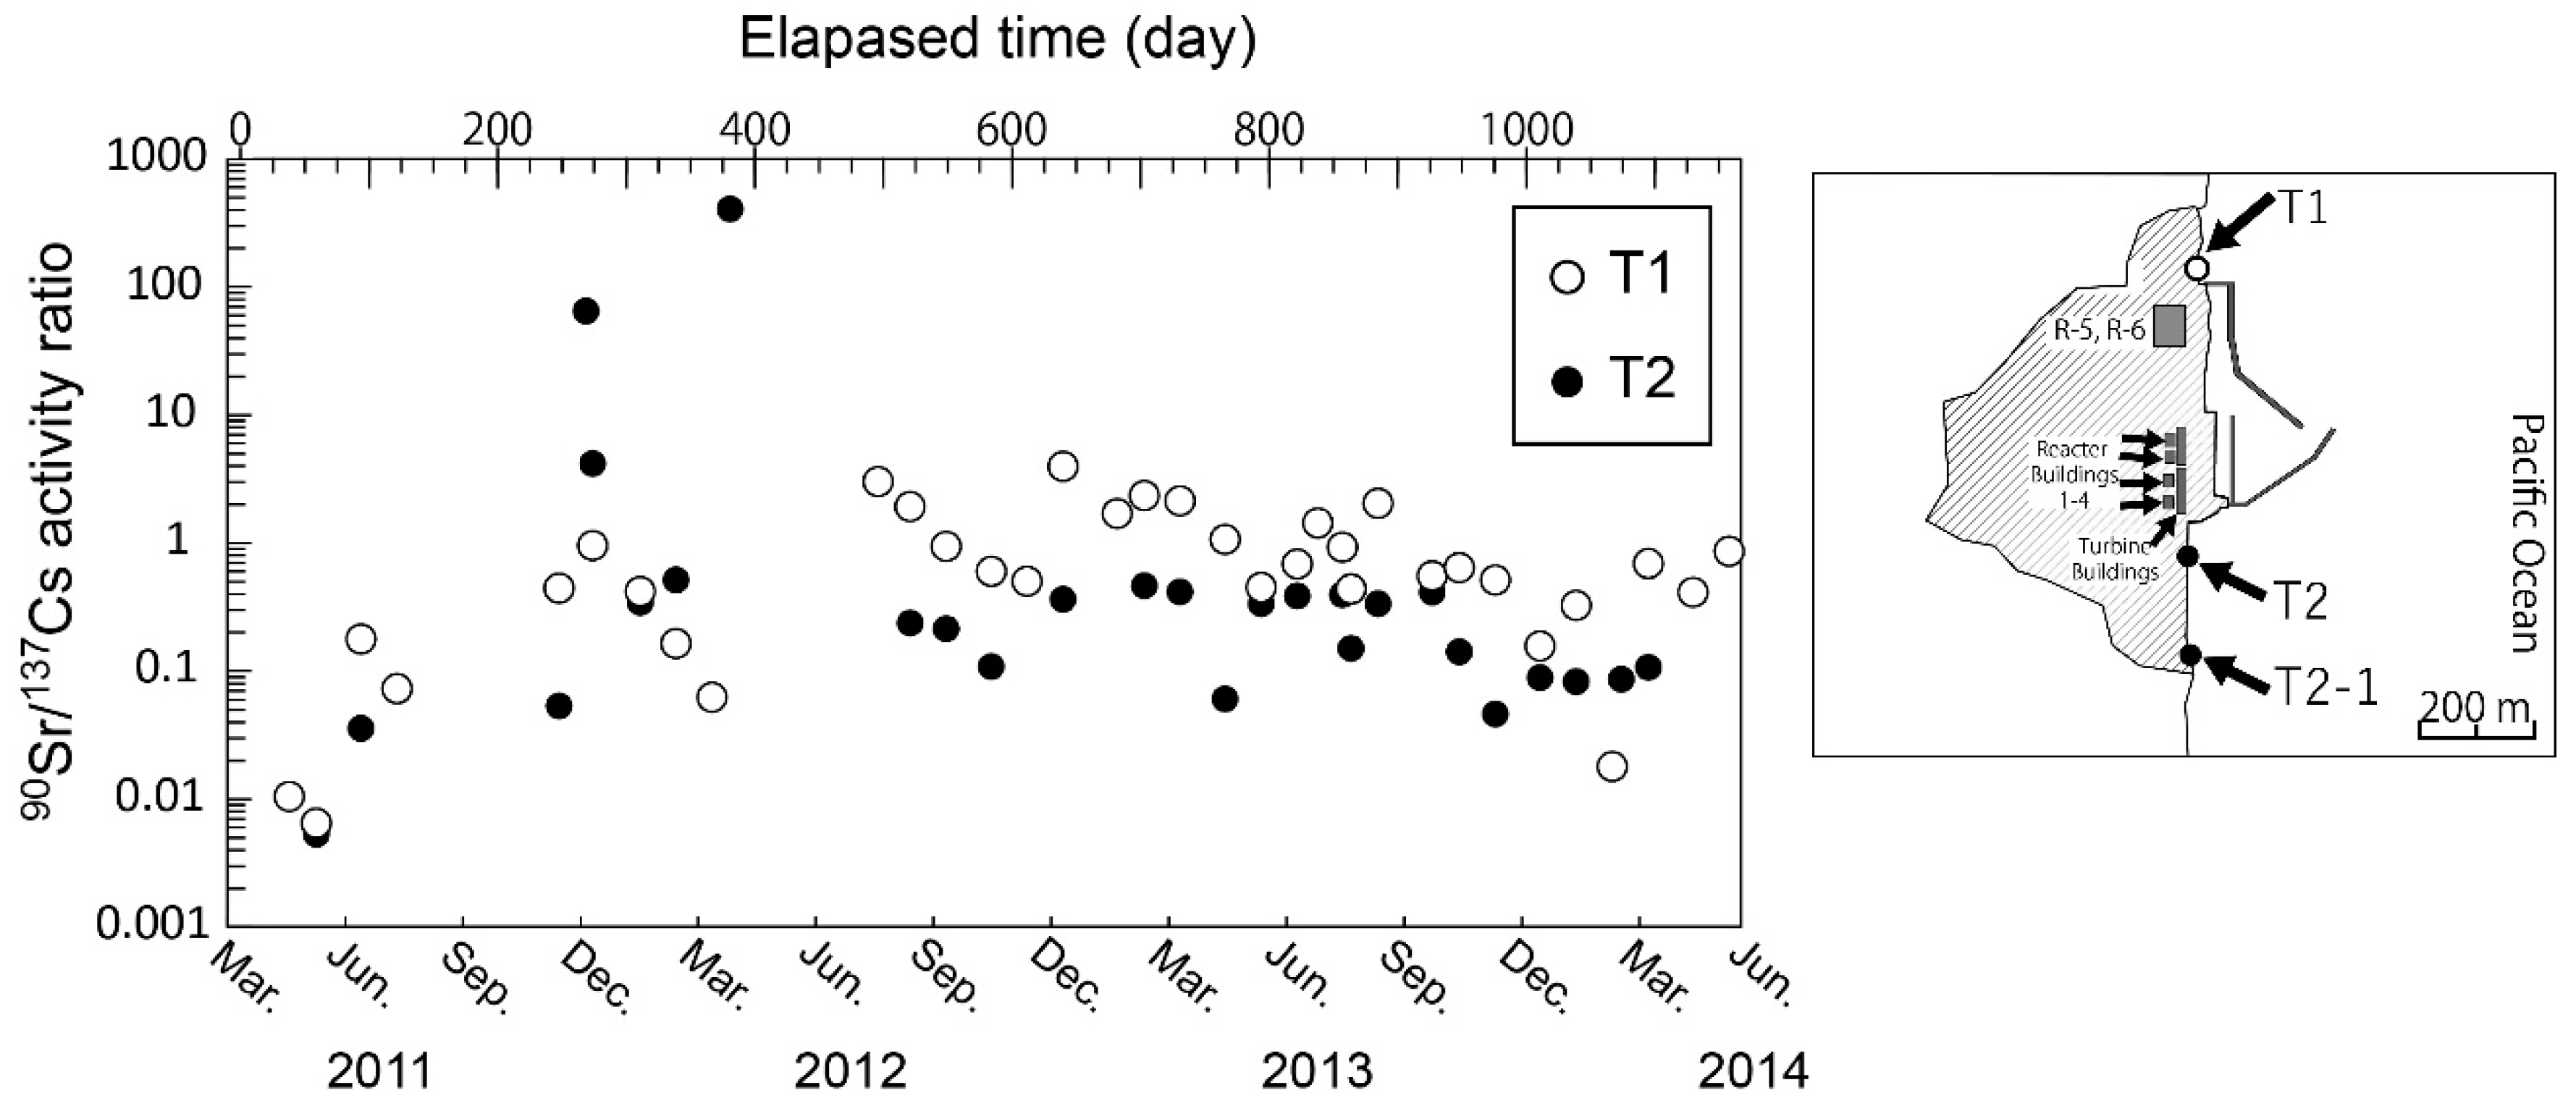
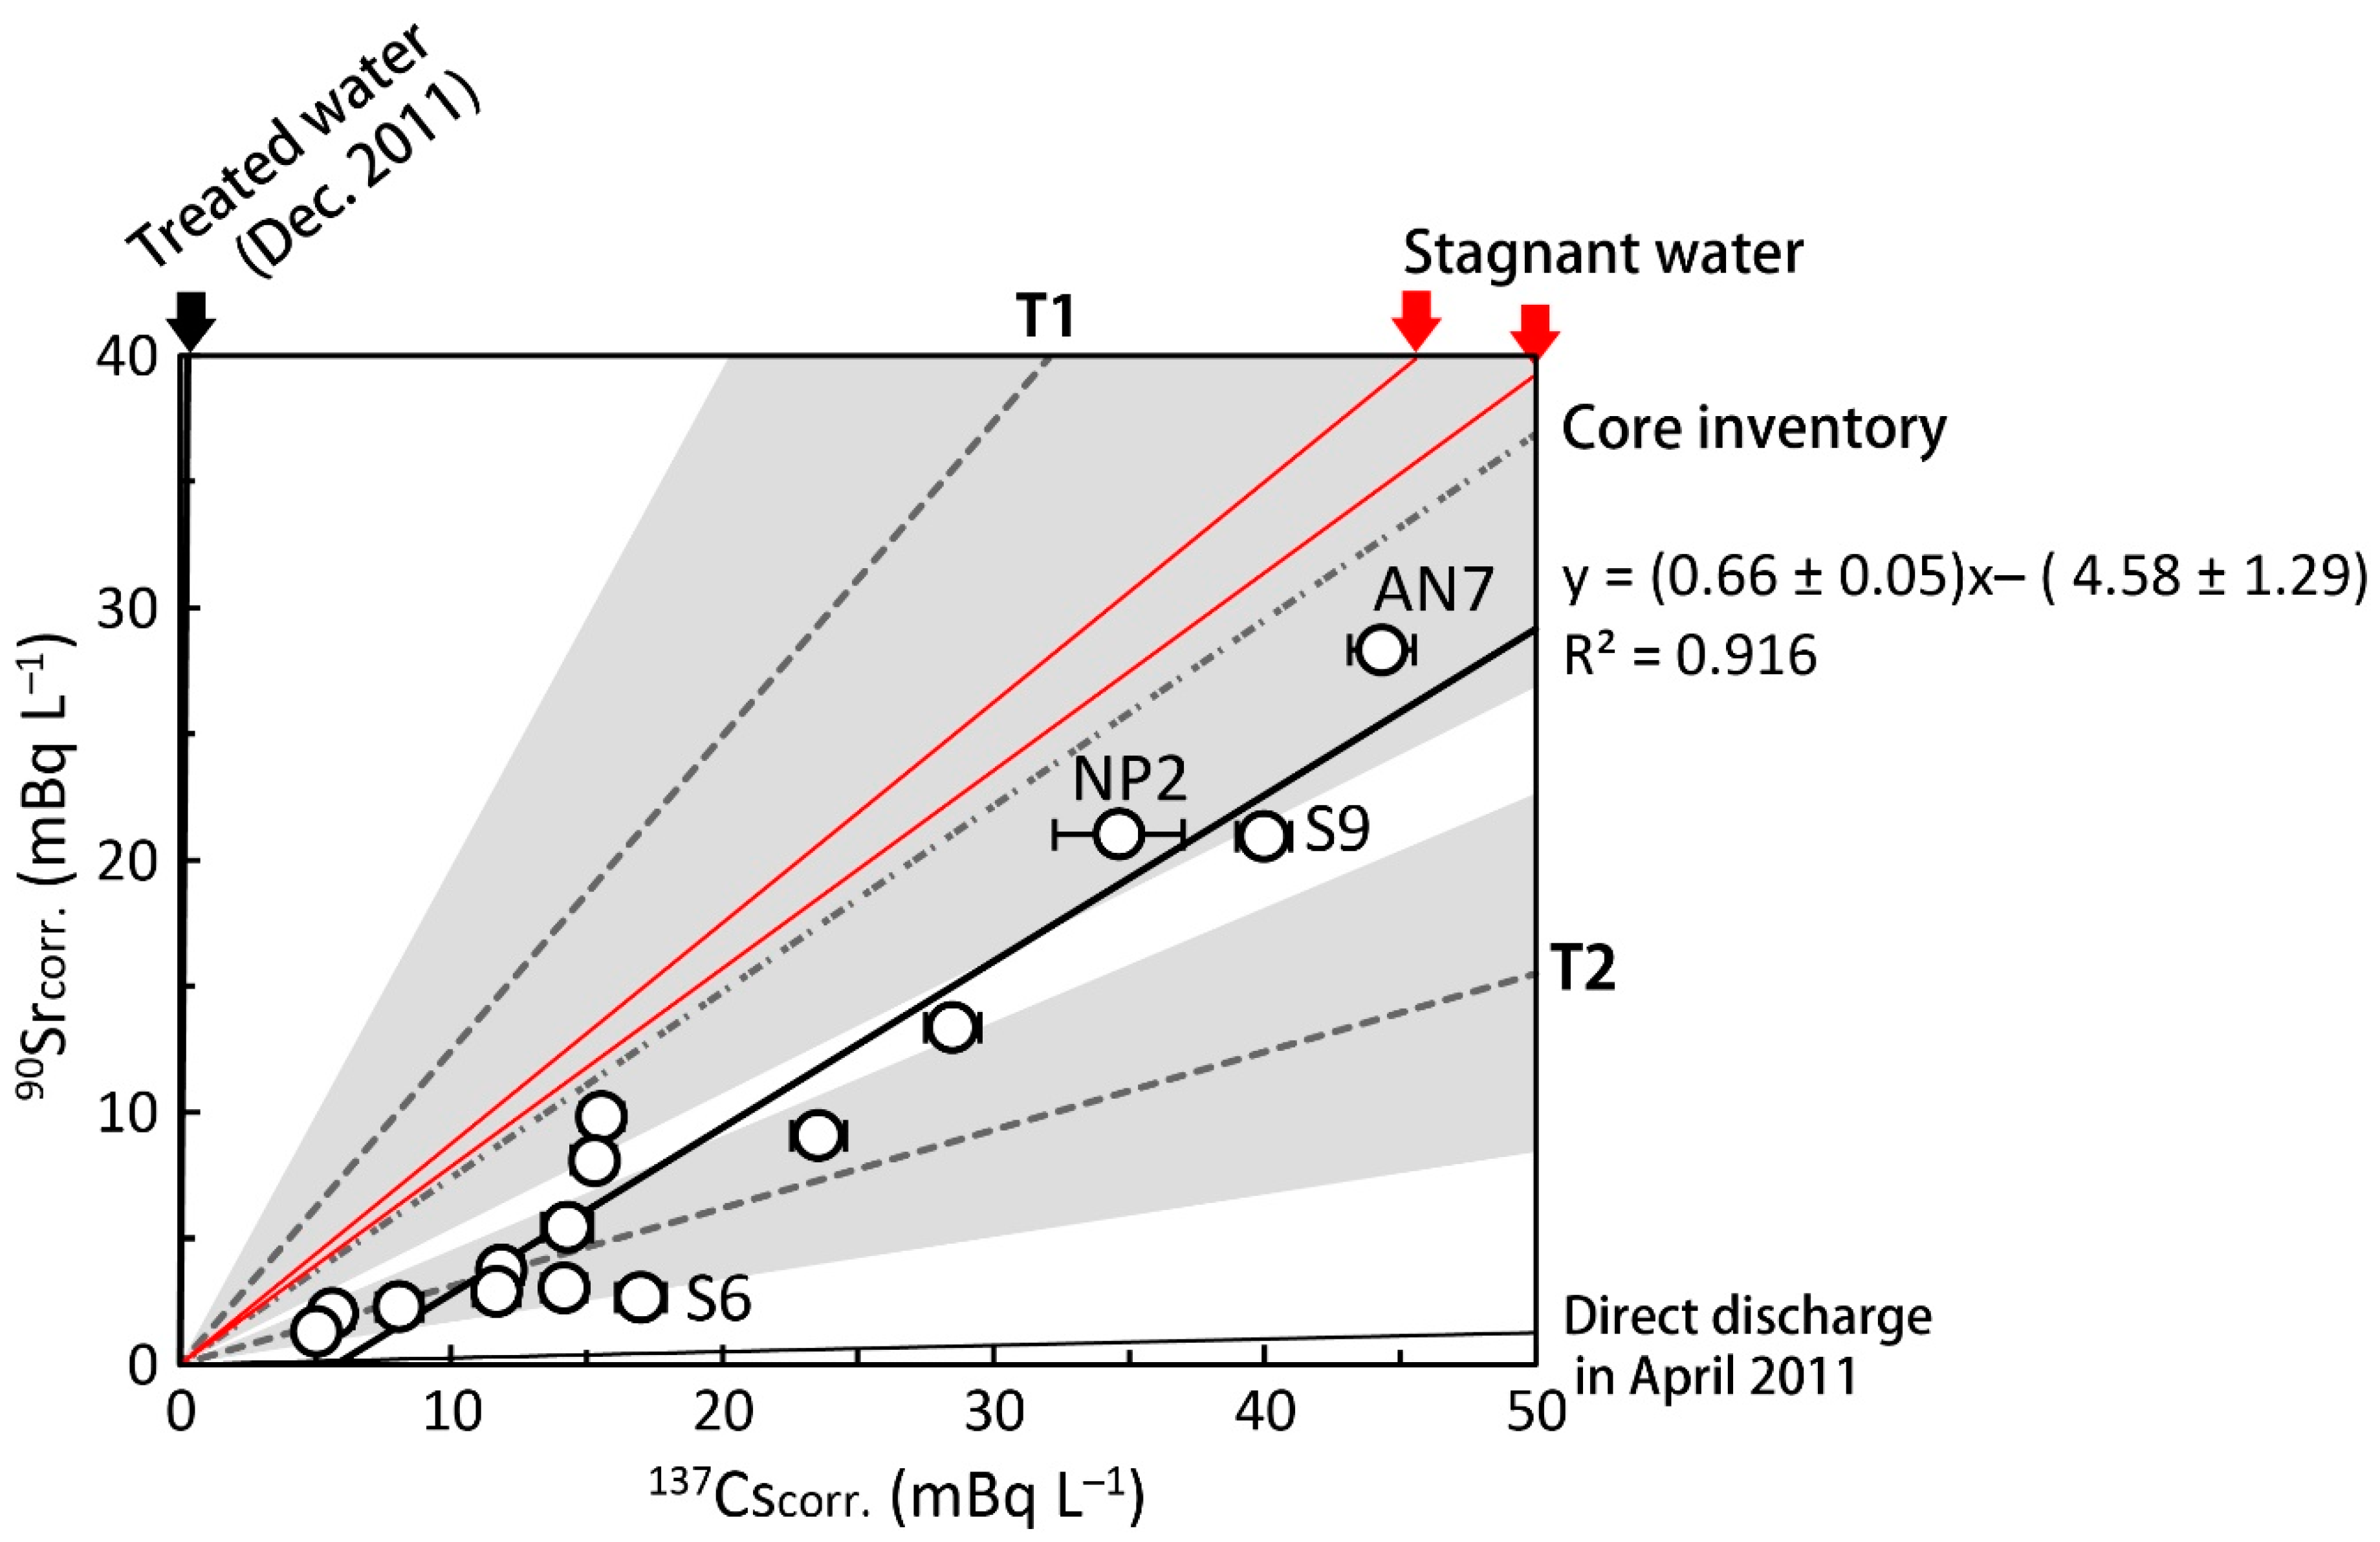
5.2. 90Sr/137Cs Activity Ratios Derived from the FDNPP Accident

The 90Sr/137Cs activity ratios in seawater are different according to timing of any release or leakage event (e.g., direct discharge event from late March to early April 2011 [3,15]). Since Sr and Cs are highly soluble in seawater, the 90Sr/137Cs activity ratio depends on the source, which could be a useful tracer for the source. The most possible source of 90Sr and 137Cs is stagnant water in the reactor building of unit 2. The 90Sr/137Cs ratio of open ocean seawater [3], seawater monitoring data near the FDNPP [6], stagnant water [4], atmospheric input [1], seabed sediment [24], and river water [6] are summarized with our data in Figure 4.
The 90Sr activity of 0.80 ± 0.11 mBq L−1 was obtained at the offshore sites, S1, S2, S3, and N01 (Table 2). To evaluate FDNPP site-derived 90Sr, measured 90Sr activity was subtracted from this value as the background value for North Pacific seawater. The measured 134Cs was a pure FDNPP site-derived component because of its short half-life (T1/2 = 2.06 yr). The FDNPP site-derived 134Cs/137Cs ratio was reported to be 0.99 ± 0.03 [11] in March 2011. FDNPP site-derived 137Cs was calculated on the basis of measured 134Cs activity and the FDNPP site-derived 134Cs/137Cs ratio.
The 90Srcorr/137Cscorr ratio estimated from the slope of a linear regression fitting was 0.66 ± 0.05 in Figure 5. 90Srcorr activities strongly correlated with those of 137Cscorr (R2 = 0.919), as described in similar contour maps of 90Sr and 137Cs (Figure 3). The high correlation between 90Sr and 137Cs indicates that 90Sr and 137Cs were derived from a common source. However, the low 90Sr activity samples (<10 mBq L−1) showed larger variability in 90Sr/137Cs activity ratio (0.34 ± 0.14) relative to those for high 90Sr activity samples (>10 mBq L−1: ratio of 0.56 ± 0.08). If multiple sources to seawater exist, such as stagnant water, storage water, and groundwater, contributions from each source could yield temporal and spatial variations. To distinguish these components, detailed 134,137Cs and 90Sr distributions should be investigated. Castrillejo et al. [17] found a short-term transition of 90Sr/137Cs ratio from 0.14 to 0.36 and an abrupt increase in 137Cs activity in the vicinity of the FDNPP (observation site St. 1 (or NP0)) in September 2013. 90Sr and 137Cs release from the FDNPP could be related to the tidal cycle and weather conditions, which caused a temporal variation of the released 90Sr/137Cs ratio from the FDNPP site.
The slope of a linear regression fitting (0.66) was similar to the reported 90Sr/137Cs activity ratios in stagnant water of 0.78 and 0.88, respectively, in July and August of 2013 [5]. The stagnant water samples were collected from the sampling line behind the mixing point of water from each reactor building [4,5] (Figure 5). These radionuclides were thought to mainly be derived from the reactor building of unit 2 on the basis of the initial data for stagnant water in the unit 2 turbine building [2], which was severely damaged. The 90Sr/137Cs activity ratio in stagnant water varied depending on the decontamination of 134, 137Cs, and gradually increased from the direct-release event in March 2011 (0.0256 ± 0.0006 [15]). The 90Sr/137Cs activity ratio of seawater in this study is slightly lower than that of stagnant water, although the most possible source candidate is the continuous release of stagnant water from the FDNPP.
The discrepancy between our data and monitoring data at T1 (1.25 ± 0.71) implies multiple sources exist at the FDNPP site. The higher 90Sr/137Cs at the T1 site could reflect a contribution from 90Sr-rich groundwater. Groundwater around the reactor buildings had a 90Sr/137Cs activity ratio (2.4 × 10⁴ [5]) that was 5 orders of magnitude higher than the seawater value observed in this study. The decontaminated water in storage tanks in the FDNPP was also observed to have high 90Sr/137Cs activity ratios.
The fitted regression line had an x-intercept of 5.8 mBq L−1. A very low 90Sr/137Cs ratio (0.16) was observed at S6 without a change in salinity. These results indicate that there is a missing source for the site with a low 90Sr/137Cs ratio. In the coastal region, salinities ranged from 33.2 to 33.3 psu and showed no correlation with activities of 90Sr and 134, 137Cs. Atmospherically deposited 90Sr on land soil in March 2011 was at a lower level (<1.1 Bq g−1) than 137Cs, where the 90Sr/137Cs activity ratio was considered to be 0.00008−0.017 [1] (Figure 5). Higher mobility of 90Sr has been recognized, but 90Sr activity in water of the Fukushima River was less than 4 mBq L−1 in 2012 [6]. 137Cs activity ranged from 12 to 190 mBq L−1, which yielded a low 90Sr/137Cs activity ratio of 0.01–0.04 [6]. Considering the 90Sr/137Cs activity ratio in seawater, riverine input from the land to the ocean was minor for 90Sr, though dissolved 90Sr activity in the Ukedo River was never reported.
A possible supply process for 137Cs is the release from seabed sediments. Some amount of Cs could be scavenged by seabed sediments through adsorption onto particles, such as clay minerals [25,26,27] during the direct discharge event. The sedimentary 137Cs inventory of 100–200 TBq represents only 1%–3% of the total discharge from the FDNPP to the Pacific Ocean in 2011 [28,29]. Approximately 80% of the total 137Cs sedimentary inventory was found in coastal sediments at less than 150 m water depth [29]. The highest 90Sr activity of 63 Bq kg-dry−1 in seabed sediments was observed near the south discharge gate of the FDNPP site (T2 monitoring point) in September 2011 [6]. Sedimentary 90Sr/137Cs activity ratios observed after the accident ranged from 0.001 to 0.08, which were lower than those in seawater. 137Cs could be attributed to the direct discharge event in late March to April 2011 [20]. The extremely low 90Sr/137Cs ratio indicates that the contribution of 90Sr in seawater from the soil and seafloor sediments is less than that of 137Cs, even if there is a higher mobility for Sr than for Cs in the soil and sediments.
Another possible low 90Sr/137Cs source is contaminated water that remained in a tunnel for pipes and cables, which were connected to the turbine buildings of units 2 and 3. Contaminated water in the turbine and reactor buildings was released into the ocean via the tunnel and cracks resulting from the earthquake and tsunami. During this direct release event, the 90Sr/137Cs ratio was very low 0.0256 ± 0.0006 [15] (Figure 5). 137Cs activity at T1 reached 68 kBq L−1 [20]. After the direct release was stopped in early April 2011 by sealing cracks and the tunnel entrance, contaminated water could have been left in the tunnel until July 2015. Such highly contaminated water could be the source of the low 90Sr/137Cs ratio.
The 90Sr/137Cs activity ratio of 0.66 ± 0.05 observed in this study was higher than data at the monitoring point, T2-1, near the south discharge gate (0.31 ± 0.14) [6] from January to December 2013, but was lower than that at T1 near the north discharge gate (1.25 ± 0.71) [6] (Figure 5). A large variation of 90Sr/137Cs at T1 was observed, which might reflect the local input processes of 90Sr and 137Cs. A much higher 90Sr/137Cs activity ratio (e.g., 90Sr activity of 7.5 Bq L−1 and 90Sr/137Cs activity ratio of 3.2 on 26 June 2013) was observed by TEPCO in the harbor [6] than the coastal region as observed in this study. The variation in 90Sr/137Cs activity ratios might reflect the spatial and temporal heterogeneities of released water.
As mentioned above, the similarity of the 90Sr/137Cs activity ratio between seawater and the stagnant water supported the idea that the most likely candidate was the continuous release from the reactor buildings of the FDNPP. Both high 90Sr activity and 90Sr/137Cs activity ratio in the coastal region reflect the input of the stagnant water. Variability of 90Sr/137Cs activity ratios in seawater is an important indicator to understand the status of the release of contaminated water from the FDNPP. Unfortunately, the contribution of underground water near the reactor buildings, and released from sediments to the harbor water, could not be distinguished from the release of the reactor buildings on the basis of seawater obtained from outside of the harbor. More detailed temporal and spatial data in the harbor and for other radionuclides such as tritium (3H) and iodine-129 (129I) are necessary.

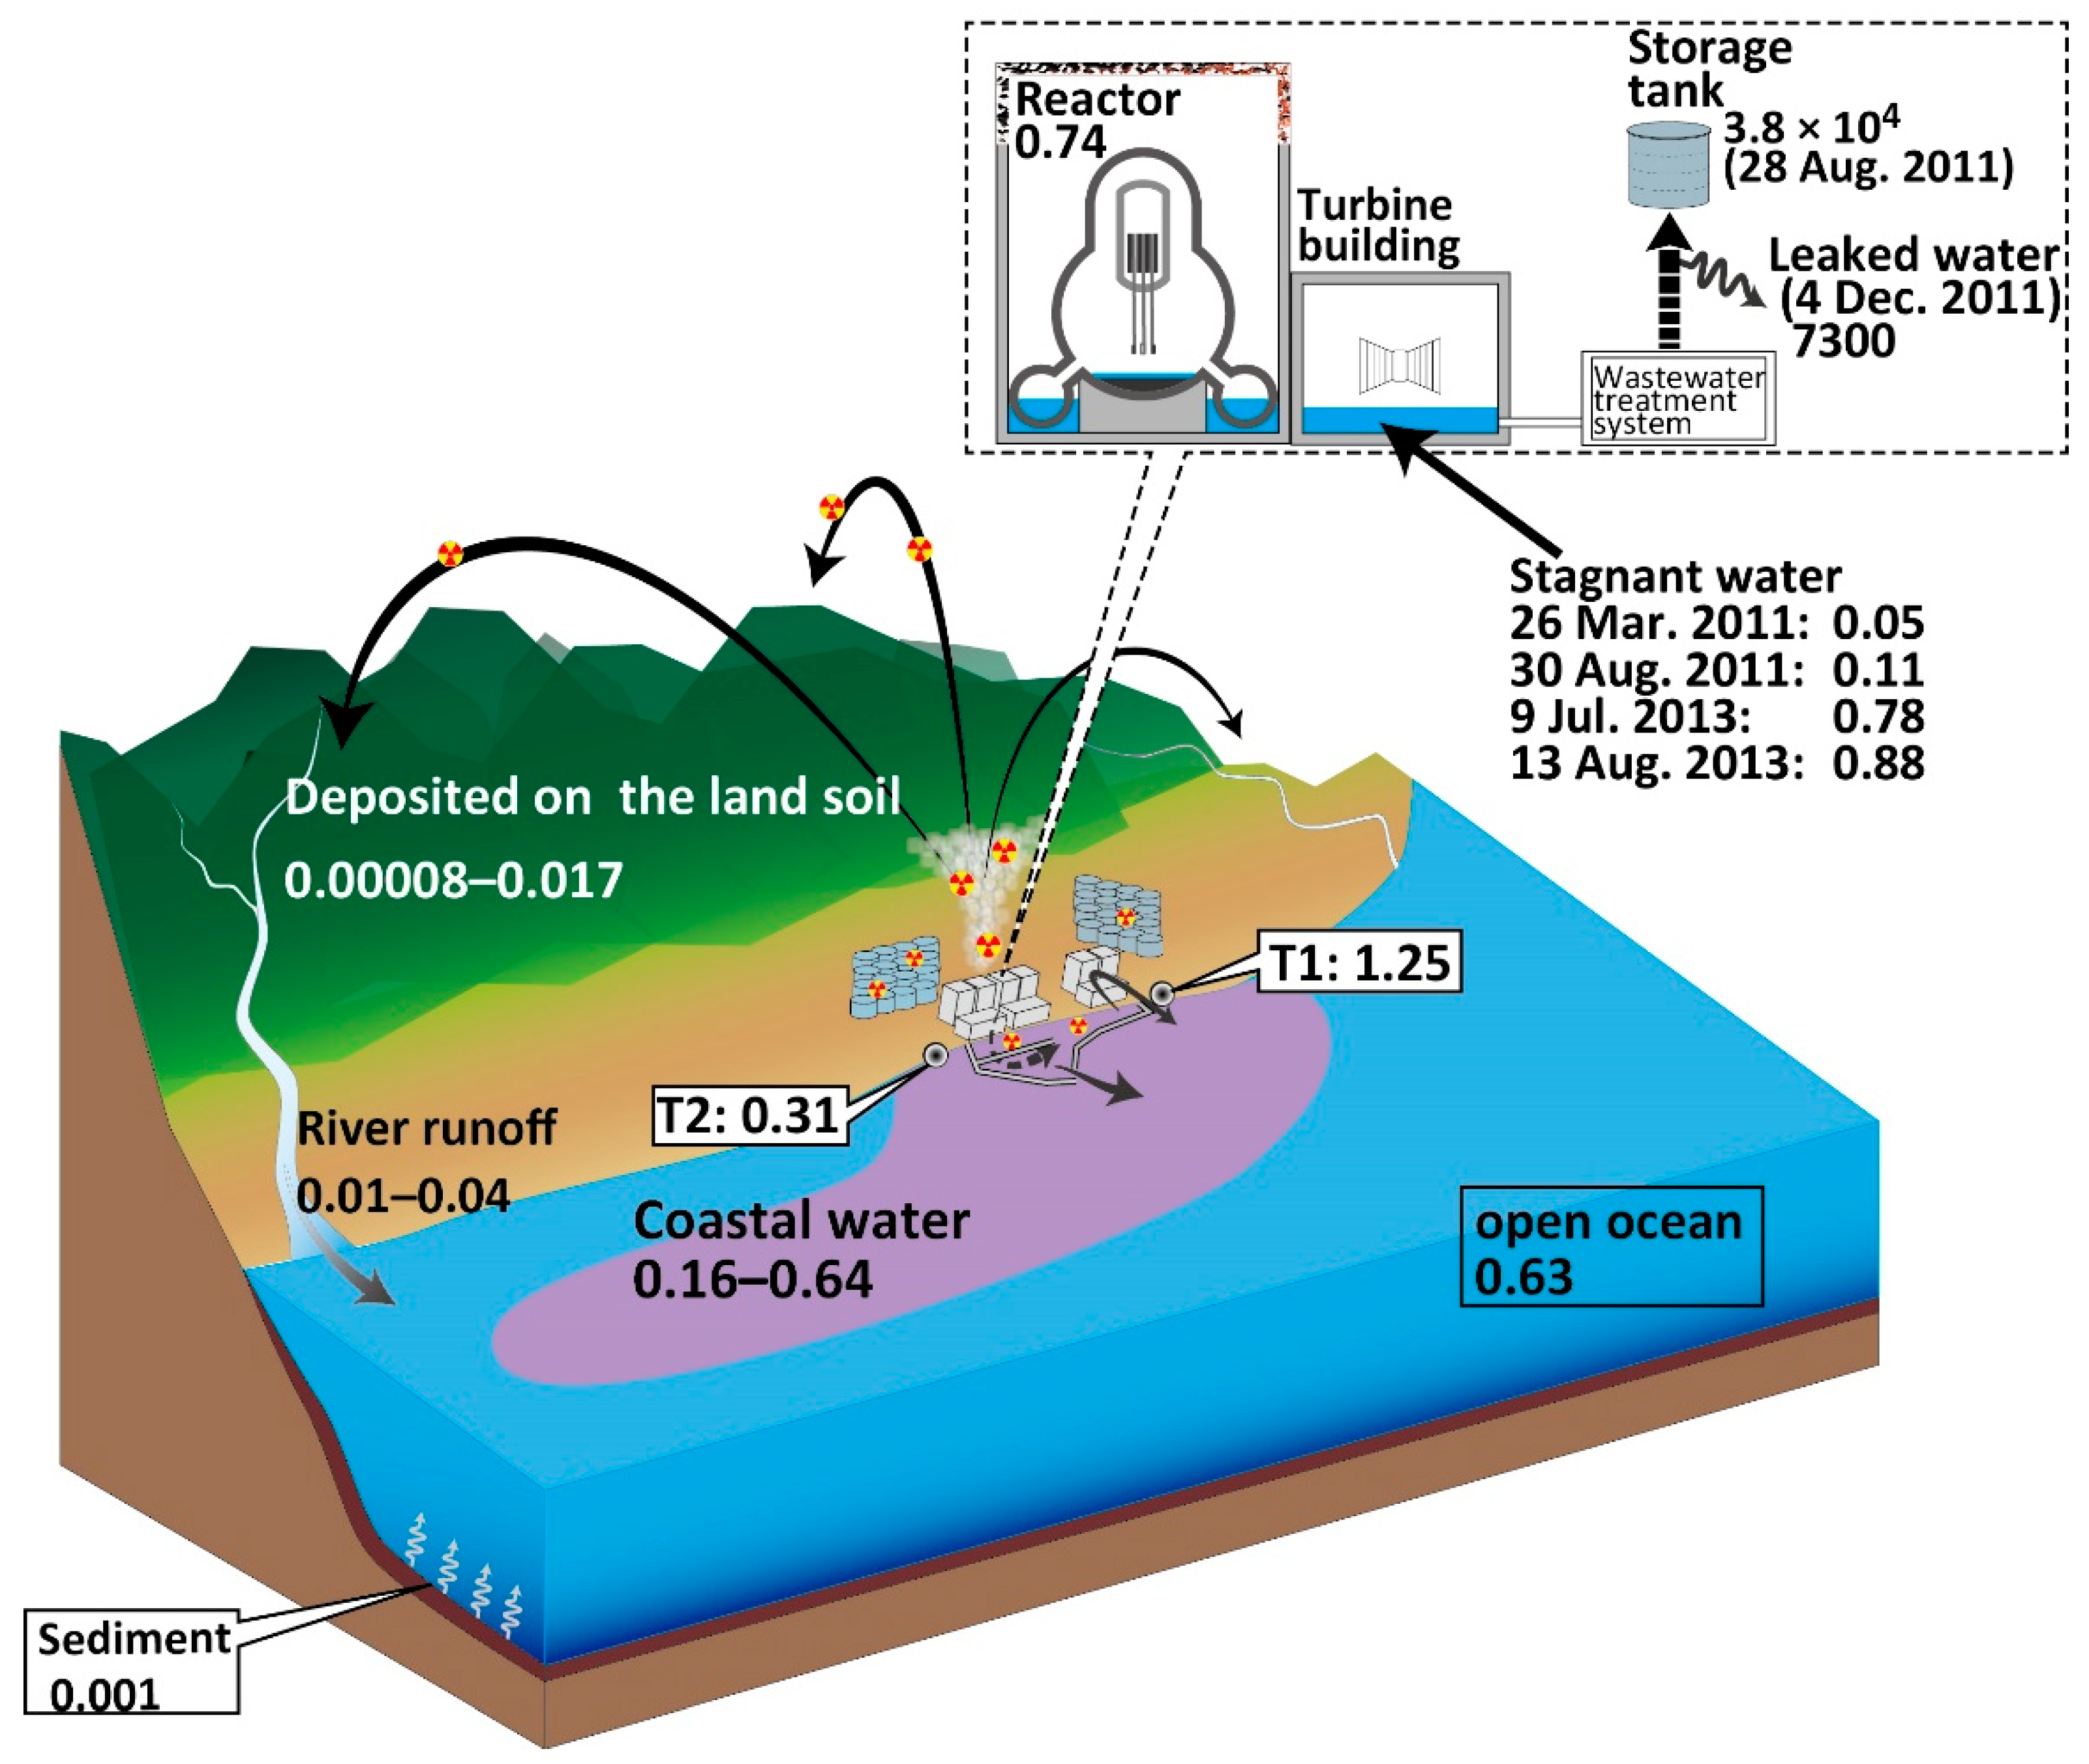
5.3. Estimation of 90Sr Input to the Ocean from the FDNPP

The continuous release from the FDNPP was the main source to the Fukushima coast. The amount of 137Cs released daily to the ocean was estimated to be from 8.1 GBq day−1 [7] to 30 GBq day−1 [8] in 2012 on the basis of simulation of the 137Cs activities of seawater in the harbor and at the north discharge gate, respectively. We examined the amount of released 90Sr based on that of 137Cs in 2013 by using Equation (1):
N S r 90 = N C s 137 × ( C S r 90 C C s 137 ) S W = C C s 137 × F × ( C S r 90 C C s 137 ) S W
where N, C, and F represent release rate, activity, and conversion factor from activity to daily release rate of 137Cs, respectively. For the estimation of daily released 137Cs, the activities of 137Cs at T2-1 300 m south of the south discharge gate were used (Table 3) [6]. Most of the 137Cs activities were lower than the MDA (1.2–1.5 Bq L−1). To avoid overestimation of the averaged 137Cs activity, we used only precise analysis data. The 137Cs activity at the T2-1 site ranged from 0.14 to 0.98 Bq L−1 and showed considerable variation (mean value = 0.60 ± 0.35 Bq L−1). The conversion factors, F, from activity to daily release rate of 137Cs were obtained on the basis of the amount of released 137Cs in the direct release event of March 2011 and 137Cs activities at the T2-1 site [7,20]. The conversion factor applied was 25.5 × 10⁹ [20] for the T2-1 site.
The resulting daily released amount of 90Sr was 9.1 ± 6.1 GBq day−1 during our sampling campaign in May 2013. The observed 90Sr activity in the coastal region was too low to disturb the ecological system and affect the background radiation dose, as mentioned above. Continuous release could increase the inventory of 90Sr in the Pacific Ocean. If the constant release (9.1 GBq day−1) continued over the year, the annual release rate would be estimated at 3.3 TBq yr−1, which is small relative to the inventory of 105 PBq in the ocean [3]. However, 90Sr in seawater should be closely observed to detect any unexpected release from the nuclear reactor buildings and the contaminated water storage tanks. This estimation needs to assume a stable release rate from the single source. As discussed above, the low 90Sr/137Cs source contributed to seawater around the FDNPP. Therefore, this result could be overestimated.
In this study, the 90Sr/137Cs activity ratio of 0.66 ± 0.05, which was influenced by continuous release from the FDNPP, was distinguished based on precise 90Sr analysis. Buesseler et al. [11,30] suggested that the possible source of 137Cs was not only continuous release from the FDNPP but also the input from subsurface groundwater [31], river water [32], and desorption from the marine sediments in the coastal region [29,30,33]. The environmental migration of 137Cs through particulate and dissolved fluvial inputs, and remineralization from the sediments contaminated by direct discharge of stagnant water from 26 March to 6 April 2011, must also be taken into consideration. 90Sr/137Cs activity ratios could fluctuate according to the source in the FDNPP area and remobilization of 137Cs in coastal water. In addition to monitoring for ongoing release from the reactor buildings and possible leakage of stored contaminated water in tanks, continuous measurement of 90Sr is necessary for investigation of the migration of 137Cs in the marine environment. A combination of other fission product nuclides, 129I and 3H activity, will provide precise information for the current status of leakages from stagnant water, groundwater, and stored water in tanks.

5.4. Estimation of Effective Dose Rate by Ingestion from Marine Products

90Sr dispersion to the coastal area is the most serious issue for fisheries due to its radiotoxicity. We estimated the dose impact to human health from marine products. The highest 90Sr activity (29.13 mBq L−1 at AN7; Table 1) was comparable to typical levels for North Pacific surface seawater in the early 1960s during nuclear weapons testing [34]. Taking into consideration the processes in the food chain and the highest activity in the coastal water observed in this study (29.13 mBq L−1 at AN−7), we obtained Equation (2):
D = C × C F × I R × F
where D is representative of the annual dose rate. C, CF, IR, and F are representative of the 90Sr activity in seawater, the concentration factor from seawater to marine products (5–10 [35]), the intake rate of marine products (28.4 kg yr−1 [36]), and dose coefficient (2.8 × 10⁻⁸ Sv/Bq [37]), respectively. It should be noted that these concentrations are quite small (0.23 μSv yr−1) compared with the International Commission on Radiological Protection (ICRP) limit of 1 mSv yr−1 for a member of the general public. Much higher 90Sr activities were observed at monitoring points near the south (150−670 mBq L−1) and north (260−5800 mBq L−1) discharge gates [6]. Even this anomalously high 90Sr activity (5800 mBq L−1) close to the FDNPP would contribute 46 μSv yr−1 to the annual effective dose rate by marine products.

6. Conclusions

90Sr is useful as a tracer for continuous releases from the FDNPP site. We reported 90Sr data in seawater along with 134Cs and 137Cs in samples collected in the coastal area off Fukushima Prefecture. Released 90Sr was dispersed along the Fukushima coast, and the highest 90Sr activity was 29.13 mBq L−1 at a sampling site 16 km south of the FDNPP. FDNPP site-derived 90Sr/137Cs ranged from 0.16 to 0.64 and the slope of a linear regression fitting of the relationship of Fukushima site-derived 90Sr and 137Cs was 0.66 ± 0.05, which was similar to the ratio of contaminated water in the FDNPP reactor and turbine buildings. These results suggest that the major contamination source is contaminated water in the FDNPP buildings. On the other hand, the l37Cs-rich source could also affect seawater and cause temporal and spatial variations. The estimated release rate of 90Sr (9.6 ± 6.1 GBq day−1) was small relative to the inventory of 90Sr in the Pacific Ocean. Release of 90Sr has been controlled by the water shielding wall between the reactor buildings and the harbor since 2015. However, our results imply that if any accidental release of radionuclides, including 90Sr from the FDNPP, occurs during decommissioning of the reactors, the coastal area can be exposed to a high activity plume.

Author Contributions

Conceptualization, H.T. and M.Y.; methodology, H.T. and H.O.; investigation, H.T; data curation, H.T., T.Y., K.T., and H.N.; writing—original draft preparation, H.T.; writing—review and editing, H.O, D.T., and J.K.; visualization, H.T.; supervision, M.Y.; project administration, H.T.; funding acquisition, H.T. All authors interpreted the data. All authors provided final approval of the version of the manuscript for publication and agreed to be accountable for all aspects of the work.

Funding

This work was supported by JSPS KAKENHI (grant numbers: 24110004 and 26340019).

Acknowledgments

We would like to thank the captain, crew, and scientific party of the UM-13-5 cruise by the RTV Umitaka-Maru for their collaboration in sampling.

Conflicts of Interest

The authors declare no conflicts of interest.

References

  1. Steinhauser, G.; Schauer, V.; Shozugawa, K. Concentration of strontium-90 at selected hot spots in Japan. PLoS ONE 2013, 8, e57760. [Google Scholar] [CrossRef] [PubMed]
  2. Nishihara, K.; Yamagishi, I.; Yasuda, K.; Ishimori, K.; Tanaka, K.; Kuno, T.; Inada, S.; Gotoh, Y. Radionuclide release to stagnant water in Fukushima 1 Nuclear Power Plant. J. At. Energy Soc. Jpn. 2012, 11, 13–19. [Google Scholar] [CrossRef]
  3. Povinec, P.P.; Hirose, K.; Aoyama, M. Radiostrontium in the western North Pacific: Characteristics, behavior, and the Fukushima impact. Environ. Sci. Technol. 2012, 46, 10356–10363. [Google Scholar] [CrossRef] [PubMed]
  4. Japan Atomic Energy Agency—JAEA. Results of Radiological Analysis for Stagnant Water and Treated Water. Available online: https://www.meti.go.jp/earthquake/nuclear/decommissioning/committee/osensuitaisakuteam/2015/pdf/0730_3_4c.pdf (accessed on 15 September 2019). (In Japanese).
  5. Tokyo Electric Power Company—TEPCO. Report to NISA upon the Additional Directive Document Regarding the Leak of Water Containing Radioactive Material from the Water Desalination Apparatus (Evaporative Concentration Apparatus) of Fukushima Daiichi Nuclear Power Plant (Update). 2012. Available online: http://www.tepco.co.jp/en/press/corp-com/release/2012/12013108-e.html (accessed on 23 October 2019).
  6. Japan Atomic Energy Agency—JAEA. Database for Radioactive Substance Monitoring Data. Available online: https://emdb.jaea.go.jp/emdb/en/ (accessed on 12 September 2019).
  7. Kanda, J. Continuing 137Cs release to the sea from the Fukushima Dai-ichi Nuclear Power Plant through 2012. Biogeosciences 2013, 10, 6107–6113. [Google Scholar] [CrossRef]
  8. Tsumune, D.; Tsubono, T.; Aoyama, M.; Uematsu, M.; Misumi, K.; Maeda, Y.; Yoshida, Y.; Hayami, H. One-year, regional-scale simulation of Cs-137 radioactivity in the ocean following the Fukushima Dai-Ichi Nuclear Power Plant accident. Biogeosciences 2013, 10, 5601–5617. [Google Scholar] [CrossRef]
  9. Honda, M.; Kawakami, H.; Watanabe, S.; Saino, T. Concentration and vertical flux of Fukushima-derived radiocesium in sinking particles from two sites in the Northwestern Pacific Ocean. Biogeosciences 2013, 10, 3525–3534. [Google Scholar] [CrossRef] [Green Version]
  10. Buesseler, K.O.; Jayne, S.R.; Fisher, N.S.; Rypina, I.I.; Baumann, H.; Baumann, Z.; Breier, C.F.; Douglass, E.M.; George, J.; MacDonald, A.M.; et al. Fukushima-derived radionuclides in the ocean and biota off Japan. Proc. Natl. Acad. Sci. USA 2012, 109, 5984–5988. [Google Scholar] [CrossRef] [Green Version]
  11. Buesseler, K.O.; Aoyama, M.; Fukasawa, M. Impacts of the Fukushima Nuclear Power Plants on marine radioactivity. Environ. Sci. Technol. 2011, 45, 9931–9935. [Google Scholar] [CrossRef]
  12. Aoyama, M.; Uematsu, M.; Tsumune, D.; Hamajima, Y. Surface pathway of radioactive plume of TEPCO Fukushima NPP1 released Cs-134 and Cs-137. Biogeosciences 2013, 10, 3067–3078. [Google Scholar] [CrossRef]
  13. Kumamoto, Y.; Aoyama, M.; Hamajima, Y.; Aono, T.; Kouketsu, S.; Murata, A.; Kawano, T. Southward spreading of the Fukushima-derived radiocesium across the Kuroshio Extension in the North Pacific. Sci. Rep. 2014, 4, 4274. [Google Scholar] [CrossRef]
  14. Ministry of Education. Culture, Sports, Science and Technology—Japan MEXT Readings of Environmental Radioactivity Level (English Version). Available online: http://radioactivity.mext.go.jp/en/ (accessed on 30 September 2019).
  15. Casacuberta, N.; Masque, P.; Garcia-Orellana, J.; Garcia-Tenorio, R.; Buesseler, K.O. Sr-90 and Sr-89 in seawater off Japan as a consequence of the Fukushima Dai-ichi nuclear accident. Biogeosciences 2013, 10, 3649–3659. [Google Scholar] [CrossRef]
  16. Oikawa, S.; Takata, H.; Watabe, T.; Misonoo, J.; Kusakabe, M. Distribution of the Fukushima-derived radionuclides in seawater in the Pacific off the coast of Miyagi, Fukushima, and Ibaraki Prefectures, Japan. Biogeosciences 2013, 10, 5031–5047. [Google Scholar] [CrossRef] [Green Version]
  17. Castrillejo, M.; Casacuberta, N.; Breier, C.F.; Pike, S.M.; Masque, P.; Buesseler, K.O. Reassessment of 90Sr, 137Cs, and 134Cs in the Coast off Japan Derived from the Fukushima Dai-ichi Nuclear Accident. Environ. Sci. Technol. 2016, 50, 173–180. [Google Scholar] [CrossRef] [PubMed]
  18. Okuda, K.; Yasuda, I.; Hiroe, Y.; Shimizu, Y. Structure of subsurface intrusion of the Oyashio water into the Kuroshio Extension and formation process of the North Pacific Intermediate Water. J. Oceanogr. 2001, 57, 121–140. [Google Scholar] [CrossRef]
  19. Nakamura, Y. Studies on the fishing ground formation of Sakhalin Surf Clam and the hydraulic environment in coastal region. Fukushima Suisan Shikenjo Res. Rep. 1991, 1–118. (In Japanese) [Google Scholar]
  20. Tsumune, D.; Tsubono, T.; Aoyama, M.; Hirose, K. Distribution of oceanic Cs-137 from the Fukushima Dai-ichi Nuclear Power Plant simulated numerically by a regional ocean model. J. Environ. Radioact. 2012, 111, 100–108. [Google Scholar] [CrossRef]
  21. Aoyama, M.; Hirose, K.; Miyao, T.; Igarashi, Y. Low-level 137Cs measurements in deep seawater samples. Appl. Radiat. Isot. 2000, 53, 159–162. [Google Scholar] [CrossRef]
  22. Tazoe, H.; Obata, H.; Yamagata, T.; Karube, Z.; Nagai, H.; Yamada, M. Determination of strontium-90 from direct separation of yttrium-90 by solid phase extraction using DGA Resin for seawater monitoring. Talanta 2016, 15, 219–227. [Google Scholar] [CrossRef]
  23. Tazoe, H.; Obata, H.; Tomita, M.; Namura, S.; Nishioka, J.; Yamagata, T.; Karube, Z.; Yamada, M. Novel method for low level Sr-90 activity detection in seawater by combining oxalate precipitation and chelating resin extraction. Geochem. J. 2017, 51, 193–197. [Google Scholar] [CrossRef] [Green Version]
  24. Kusakabe, M.; Oikawa, S.; Takata, H.; Misonoo, J. Spatiotemporal distributions of Fukushima-derived radionuclides in nearby marine surface sediments. Biogeosciences 2013, 10, 5019–5030. [Google Scholar] [CrossRef] [Green Version]
  25. Santschi, P.H.; Bower, P.; Nyffeler, U.P.; Azevedo, A.; Broecker, W.S. Estimates of the resistance to chemical transport posed by the deep-sea boundary layer. Limnol. Oceanogr. 1983, 28, 899–912. [Google Scholar] [CrossRef]
  26. Nyffeler, U.P.; Li, Y.H.; Santschi, P.H. A kinetic approach to describe trace-element distribution between particles and solution in natural aquatic systems. Geochim. Cosmochim. Acta 1984, 48, 1513–1522. [Google Scholar] [CrossRef]
  27. Lujanienė, G.; Vilimaitė-Šilobritienė, B.; Jokšas, K. Accumulation of 137Cs in bottom sediments of the Curonian Lagoon. Nucleonika 2005, 50, 23–29. [Google Scholar]
  28. Black, E.; Buesseler, K. Spatial variability and the fate of cesium in coastal sediments near Fukushima, Japan. Biogeosci. Discuss. 2014, 11, 7235–7271. [Google Scholar]
  29. Otosaka, S.; Kato, Y. Radiocesium derived from the Fukushima Daiichi Nuclear Power Plant accident in seabed sediments: Initial deposition and inventories. Environ. Sci. Proc. Impacts 2014, 16, 978–990. [Google Scholar] [CrossRef]
  30. Buesseler, K.O. Fukushima and ocean radioactivity. Oceanography 2014, 27, 92–105. [Google Scholar] [CrossRef]
  31. Charette, M.A.; Breier, C.F.; Henderson, P.B.; Pike, S.M.; Rypina, I.I.; Jayne, S.R.; Buesseler, K.O. Radium-based estimates of cesium isotope transport and total direct ocean discharges from the Fukushima Nuclear Power Plant accident. Biogeosciences 2013, 10, 2159–2167. [Google Scholar] [CrossRef] [Green Version]
  32. Nagao, S.; Kanamori, M.; Ochiai, S.; Tomihara, S.; Fukushi, K.; Yamamoto, M. Export of 134Cs and 137Cs in the Fukushima river systems at heavy rains by Typhoon Roke in September 2011. Biogeosciences 2013, 10, 6215–6223. [Google Scholar] [CrossRef]
  33. Mitchell, P.; Condren, O.; Vintró, L.L.; McMahon, C. Trends in plutonium, americium and radiocaesium accumulation and long-term bioavailability in the western Irish Sea mud basin. J. Environ. Radioact. 1999, 44, 223–251. [Google Scholar] [CrossRef]
  34. United Nations Scientific Committee on the Effects of Atomic Radiation—UNSCEAR. Sources and Effects of Ionizing Radiation: Sources; United Nations Publications: New York, NY, USA, 2000; Volume 1. [Google Scholar]
  35. International Atomic Energy Agency (IAEA). Sediment Distribution Coefficients and Concentration Factors for Biota in the Marine Environment; Technical Reports Series No.422; IAEA: Vienna, Austria, 2004. [Google Scholar]
  36. Ministry of Agriculture, Forestry and Fisheries. MAFF Annual Report Food Balance Sheet 2012. Available online: http://www.maff.go.jp/e/tokei/kikaku/nenji_e/88nenji/index.html#nse01372 (accessed on 15 September 2019).
  37. International Commission on Radiological Protection. Age-Dependent Doses to the Members of the Public from Intake of Radionuclides Part 5, Compilation of Ingestion and Inhalation Coefficients; ICRP Publication 72; Pergamon Press: Oxford, UK, 1996. [Google Scholar]
Figure 1. Temporal variations of strontium-90/cesium-137 (90Sr/137Cs) activity ratio in seawater from monitoring sites T1 and T2 (T2-1) in the Fukushima Daiichi Nuclear Power Plant (FDNPP) site [6]. T1 and T2 (T2-1) sites are located north and south of the discharge channel of the FDNPP, respectively.
Ijerph 16 04094 g001
Figure 2. Maps showing sampling locations. (a) Surface temperature and (b) salinity had two boundary currents (dashed arrows), the warm northeastwardly Kuroshio current south of the Boso Peninsula and the cold southerly first branch of the Oyashio current off the Fukushima coast. (c,d) Sampling locations are marked by red circles and located near the coast of Fukushima Prefecture.
Ijerph 16 04094 g002
Figure 3. Distribution of 90Sr and 137Cs activities in surface seawater collected in May 2013.
Ijerph 16 04094 g003
Figure 4. The 90Sr/137Cs activity ratios in the environment and the FDNPP site. The 90Sr/137Cs activity ratio in seawater near the FDNPP was consistent with those from the monitoring points, T1 and T2 [12]. Soil [4] and sediment [24] samples had extremely low 90Sr/137Cs activity ratios.
Ijerph 16 04094 g004
Figure 5. FDNPP site-derived 90Sr and 137Cs activities in surface seawater with 90Sr/137Cs ratio for possible sources. The lower and upper red solid lines show 90Sr/137Cs ratios for stagnant water in the reactor building in July 2013 (0.78) and August 2013 (0.88), respectively [6]. Core inventory (0.74) was estimated by the ORIGEN2 code [2]. Shaded areas were averaged monitoring data at T1 (1.25 ± 0.71) and T2-1 (0.31 ± 0.14) sites from January 2013 to October 2013.
Ijerph 16 04094 g005
Table 1. 90Sr, 134Cd, and 137Cs activities and hydrographic data in seawater collected on the Fukushima Prefecture coast in May 2013. Uncertainties represent 1σ error.
IDSampling Date and Time (year/month/day)LatitudeLatitudeTemperature (oC)Salinity (psu)90Sr Activity (mBq L−1)134Cs Activity (mBq L−1)137Cs Activity (mBq L−1)
S12013/5/14 16:4136°33.15′ N141°15.60′ E11.4133.160.87 ± 0.06 <0.41.9 ± 0.1
S22013/5/14 18:3936°55.62′ N141°21.48′ E9.4333.210.66 ± 0.05 <0.41.4 ± 0.1
S32013/5/14 19:5437°10.50′ N141°23.88′ E10.3733.510.75 ± 0.06 <0.41.8 ± 0.1
S42013/5/14 20:4737°26.13′ N141°17.46′ E9.8833.641.03 ± 0.06 <0.41.5 ± 0.1
N012013/5/14 23:1237°29.33′ N141°14.75′ E9.72 33.46 0.90 ± 0.07 <0.42.0 ± 0.2
R012013/5/15 5:3937°25.20′ N141° 8.26′ E11.0233.313.09 ± 0.07 4.1 ± 0.47.7 ± 0.3
AN62013/5/15 7:5337°21.09′ N141° 7.80′ E10.8633.242.94 ± 0.13 6.9 ± 0.46.9 ± 0.2
M012013/5/16 2:2837°15.42′ N141° 6.40′ E10.3733.240.92 ± 0.07 1.0 ± 0.33.8 ± 0.2
NP32013/5/16 8:0537°13.11′ N141° 5.94′ E11.9033.356.25 ± 0.08 7.2 ± 0.514.5 ± 0.3
S52013/5/16 6:3637° 6.60′ N141° 4.02′ E11.2233.170.89 ± 0.06 1.4 ± 0.33.5 ± 0.2
S62013/5/16 6:0836°59.97′ N141° 2.16′ E11.0933.263.46 ± 0.08 8.6 ± 0.518.2 ± 0.3
NP22013/5/16 22:0536°54.93′ N140°57.36′ E12.4133.2621.81 ± 0.28 17.5 ± 1.239.0 ± 1.2
NP12013/5/17 3:4836°54.87′ N141° 0.06′ E11.0833.210.99 ± 0.07 1.4 ± 0.23.8 ± 0.1
S72013/5/17 11:2736°55.05′ N141° 5.35′ E11.9833.2814.17 ± 0.23 7.9 ± 0.416.5 ± 0.3
S82013/5/17 12:0837°16.94′ N141° 5.14′ E12.1033.2610.63 ± 0.27 14.4 ± 0.529.8 ± 0.4
S92013/5/17 12:4037°14.00′ N141°13.80′ E11.9533.2421.74 ± 0.38 20.2 ± 0.539.8 ± 0.4
S102013/5/17 14:0537°32.91′ N141°20.85′ E12.0433.213.84 ± 0.12 7.2 ± 0.415.7 ± 0.3
S112013/5/17 15:1137°33.03′ N141°10.41′ E11.7433.243.68 ± 0.08 5.9 ± 0.412.5 ± 0.3
S122013/5/17 16:1537°24.99′ N141°17.99′ E12.3633.269.86 ± 0.22 11.9 ± 0.524.0 ± 0.3
S132013/5/19 0:5737°33.03′ N141° 7.56′ E12.3233.238.92 ± 0.25 7.7 ± 0.416.1 ± 0.3
S142013/5/19 5:0937°24.99′ N141°10.68′ E12.6933.304.56 ± 0.08 6.0 ± 0.413.3 ± 0.3
AN72013/5/20 8:4537°24.99′ N141° 5.88′ E12.2033.3329.13 ± 0.35 22.4 ± 0.644.7 ± 0.4
S162013/5/20 23:0537°30.00′ N141°30.00′ E12.1633.262.10 ± 0.06 2.6 ± 0.35.7 ± 0.2
Table 2. FDNPP site-derived 90Sr (90Srcorr.) and 137Cs (137Cscorr.) activities and 90Srcorr./137Cscorr. activity ratios.
ID90Srcorr. Activity (mBq L−1)137Cscorr. Activity (mBq L−1)90Srcorr./137Cscorr.
S62.66 ± 0.1317.0 ± 1.00.16 ± 0.01
S79.83 ± 0.2815.6 ± 0.80.63 ± 0.04
S813.37 ± 0.2528.5 ± 1.00.47 ± 0.02
S920.94 ± 0.3940.0 ± 1.00.52 ± 0.02
S103.04 ± 0.1614.2 ± 0.80.21 ± 0.02
S112.88 ± 0.1311.7 ± 0.80.25 ± 0.02
S129.07 ± 0.2423.5 ± 1.00.39 ± 0.02
S138.12 ± 0.2715.2 ± 0.80.53 ± 0.03
S143.76 ± 0.1311.9 ± 0.80.32 ± 0.02
AN728.33 ± 0.3744.3 ± 1.20.64 ± 0.02
S161.30 ± 0.125.1 ± 0.60.25 ± 0.04
R012.30 ± 0.128.1 ± 0.80.28 ± 0.03
NP35.46 ± 0.1314.2 ± 1.00.38 ± 0.03
AN62.15 ± 0.165.9 ± 0.60.36 ± 0.05
NP221.02 ± 0.3034.6 ± 2.40.61 ± 0.04
Table 3. Estimation of the release rates for 90Sr and 137Cs into the ocean from the FDNPP site in May 2013. C: activity; F: conversion factor; N: release rate.
Monitoring Point C C s 137   ( Bq   L 1 )
( Jan .   to   Oct .   2013 )
F
(×109 L day−1)
N C s 137
(GBq day−1)
( C S r 90 C C s 137 ) S W N S r 90
( GBq   day 1 )
T2-10.60 ± 0.35 [6]25.5 [20]15.3 ± 8.90.63 ± 0.059.6 ± 6.1

