Road Traffic Noise Exposure and Depression/Anxiety: An Updated Systematic Review and Meta-Analysis


Abstract
:1. Introduction
2. Materials and Methods
2.1. Systematic Review Protocol
("traffic noise"[All Fields] OR "road traffic noise"[All Fields] OR "transportation noise"[All Fields] OR "environmental noise"[All Fields] OR "community noise"[All Fields] OR "noise exposure"[All Fields]) AND ("anxiety"[All Fields] OR "depression"[All Fields] OR "mental health"[All Fields] OR "psychiatric disorders"[All Fields] OR "mental disorder"[All Fields] OR "psychotropic medication"[All Fields] OR "antidepressants"[All Fields] OR "anxiolytics"[All Fields]).
- (1)
- Time period: 2015–August 2019;
- (2)
- Language: English;
- (3)
- Original research papers;
- (4)
- Design: cohort, case-control, cross-sectional, ecological;
- (5)
- Population: adults (≥18 years);
- (6)
- Exposure: road traffic noise (alone or in combination with other sources);
- (7)
- Outcome: anxiety/depression as discrete outcomes (diagnosis, psychotropic medication use, dichotomized self-reported symptoms scale);
- (8)
- Effect size estimate: quantitative risk estimate (OR, RR, HR) and 95% CI or SE, or p-value.
- (1)
- Experimental studies, review articles;
- (2)
- Studies only including children and adolescents (< 18 years);
- (3)
- Studies with only subjective noise ratings (e.g., annoyance or traffic intensity);
- (4)
- Studies with no calculated or measured noise levels (e.g., only distance to source);
- (5)
- Studies exclusively on noise sources other than road traffic;
- (6)
- Studies with only general psychological symptoms scores;
- (7)
- Studies with the outcomes (anxiety/depression) not dichotomized;
- (8)
- Studies on health-related quality of life only;
- (9)
- Studies with no quantitative data or reporting effect measures that could not be transformed.
2.2. Data Extraction
2.3. Risk of Bias Assessment
2.4. Meta-Analysis
2.5. Quality of Evidence Assessment
3. Results
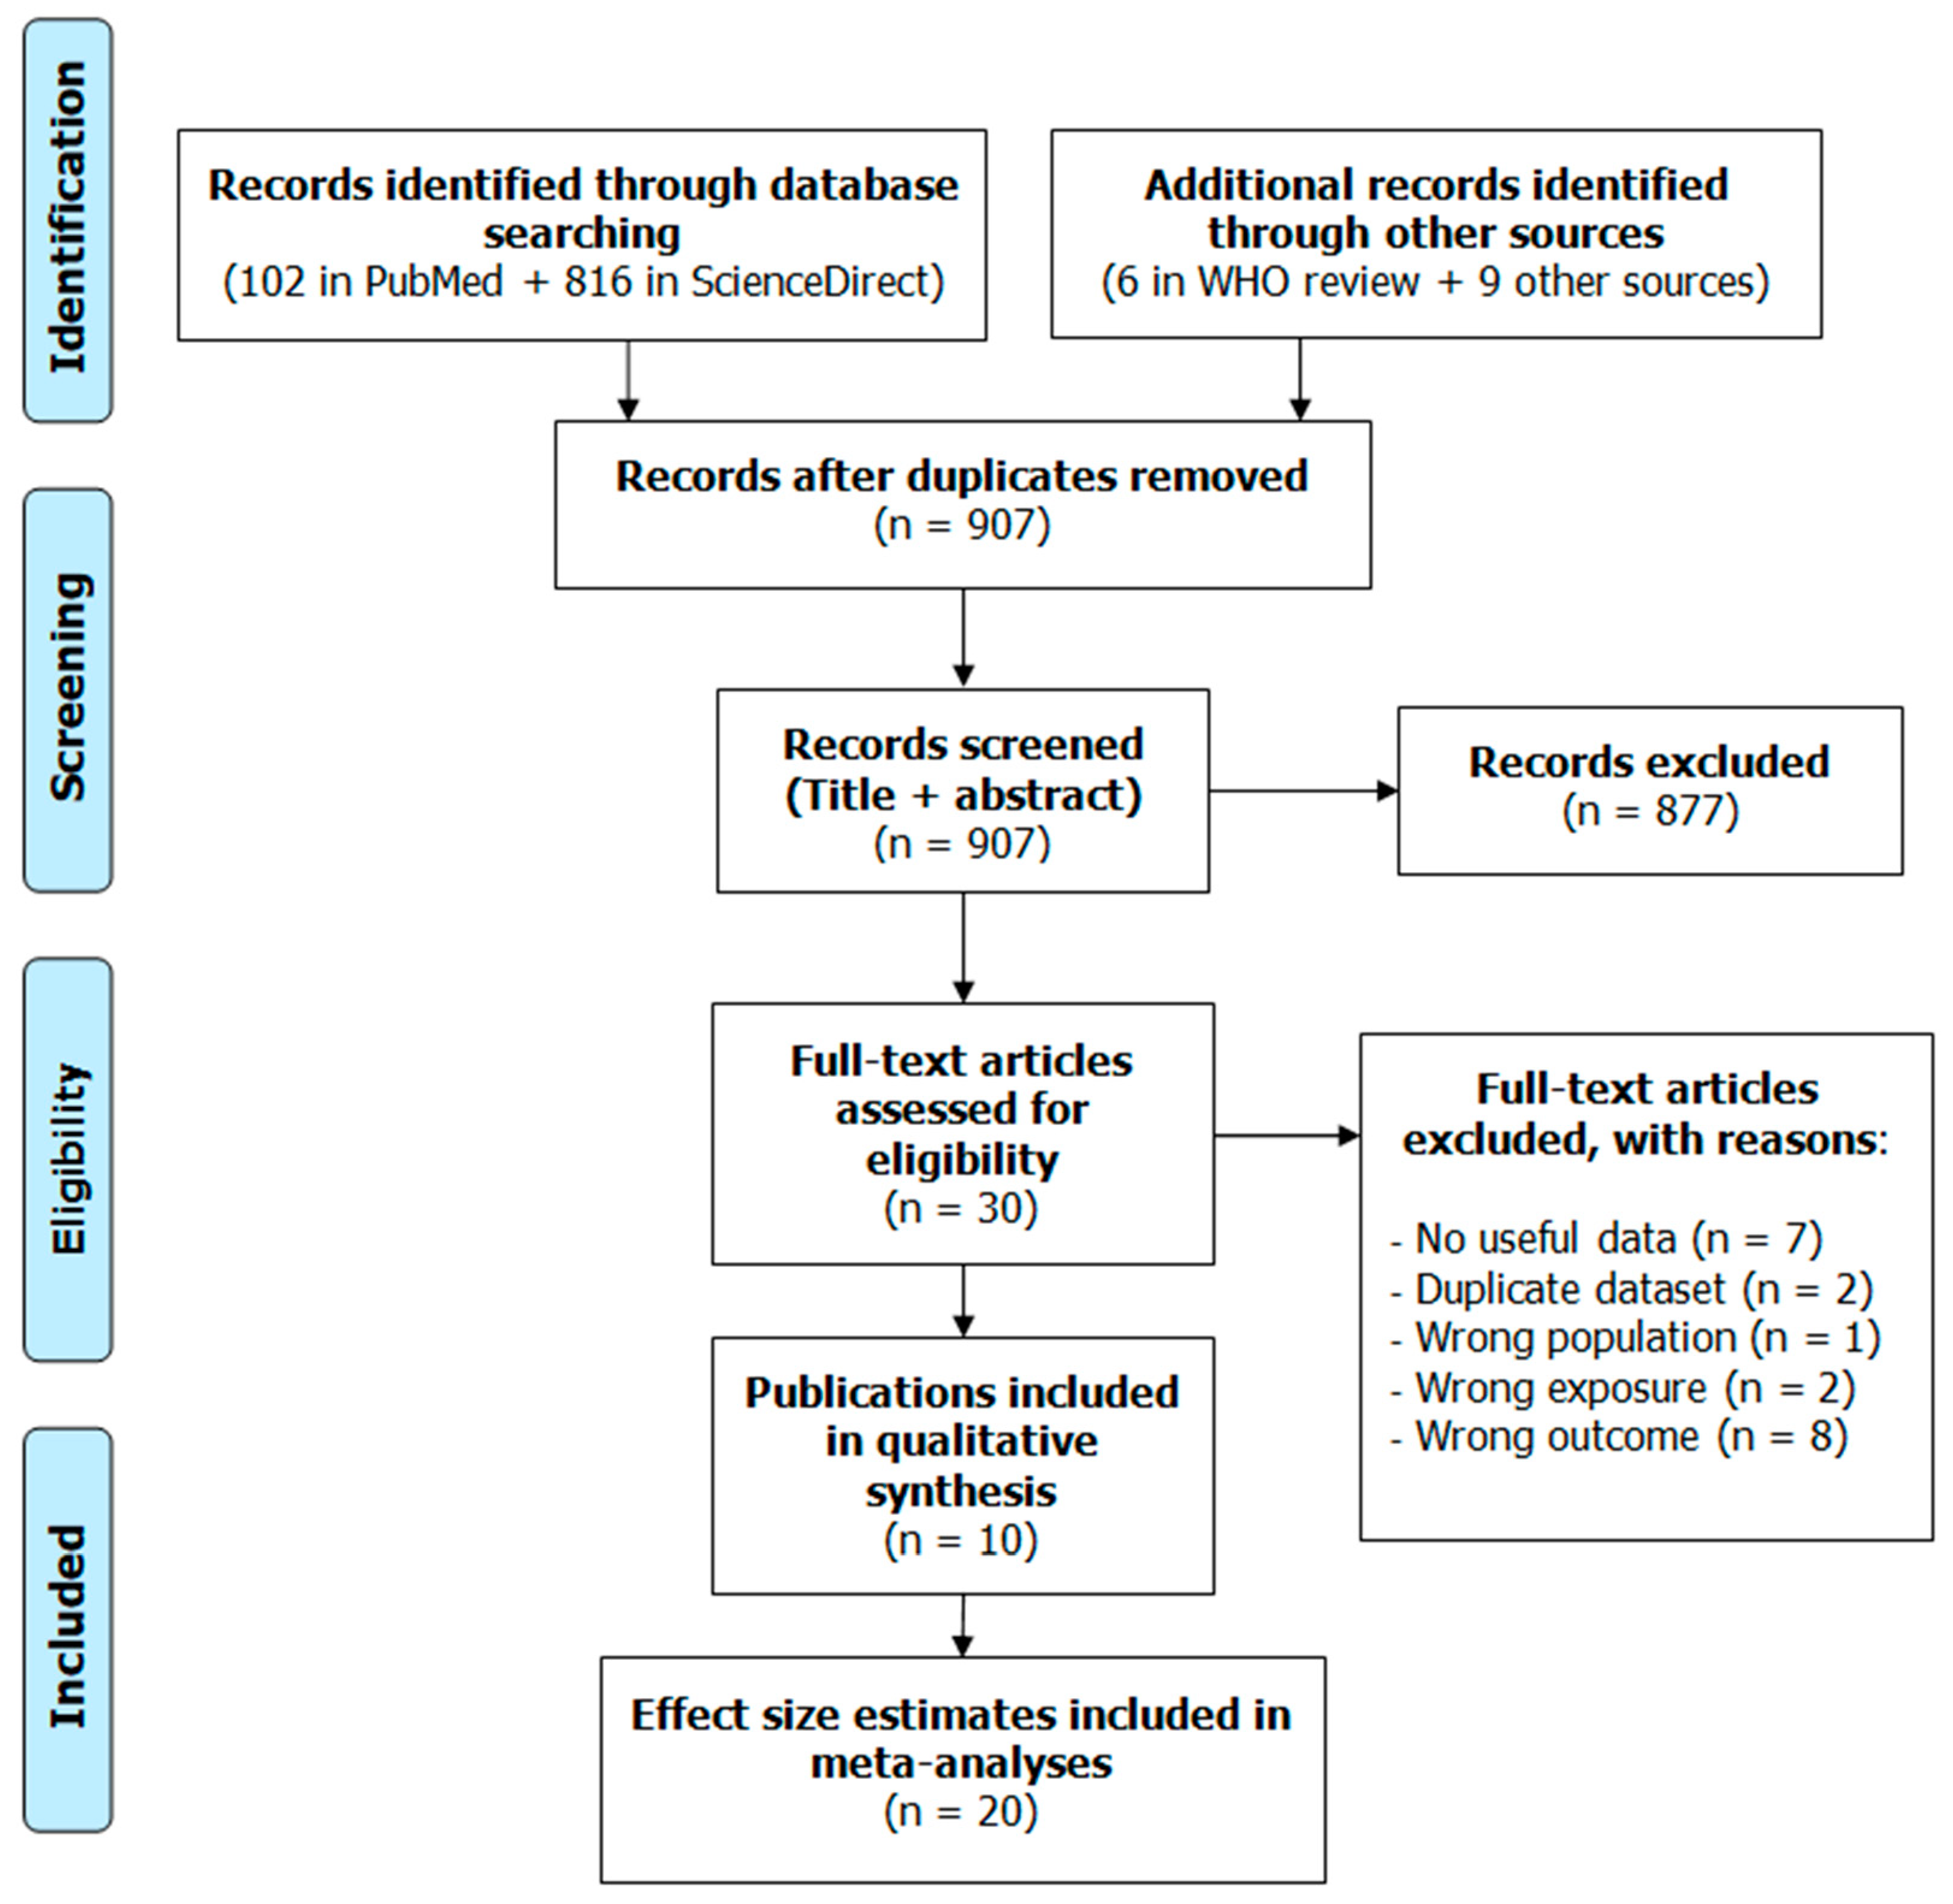
3.1. Literature Search Results
3.2. Narrative Description of the Studies Included
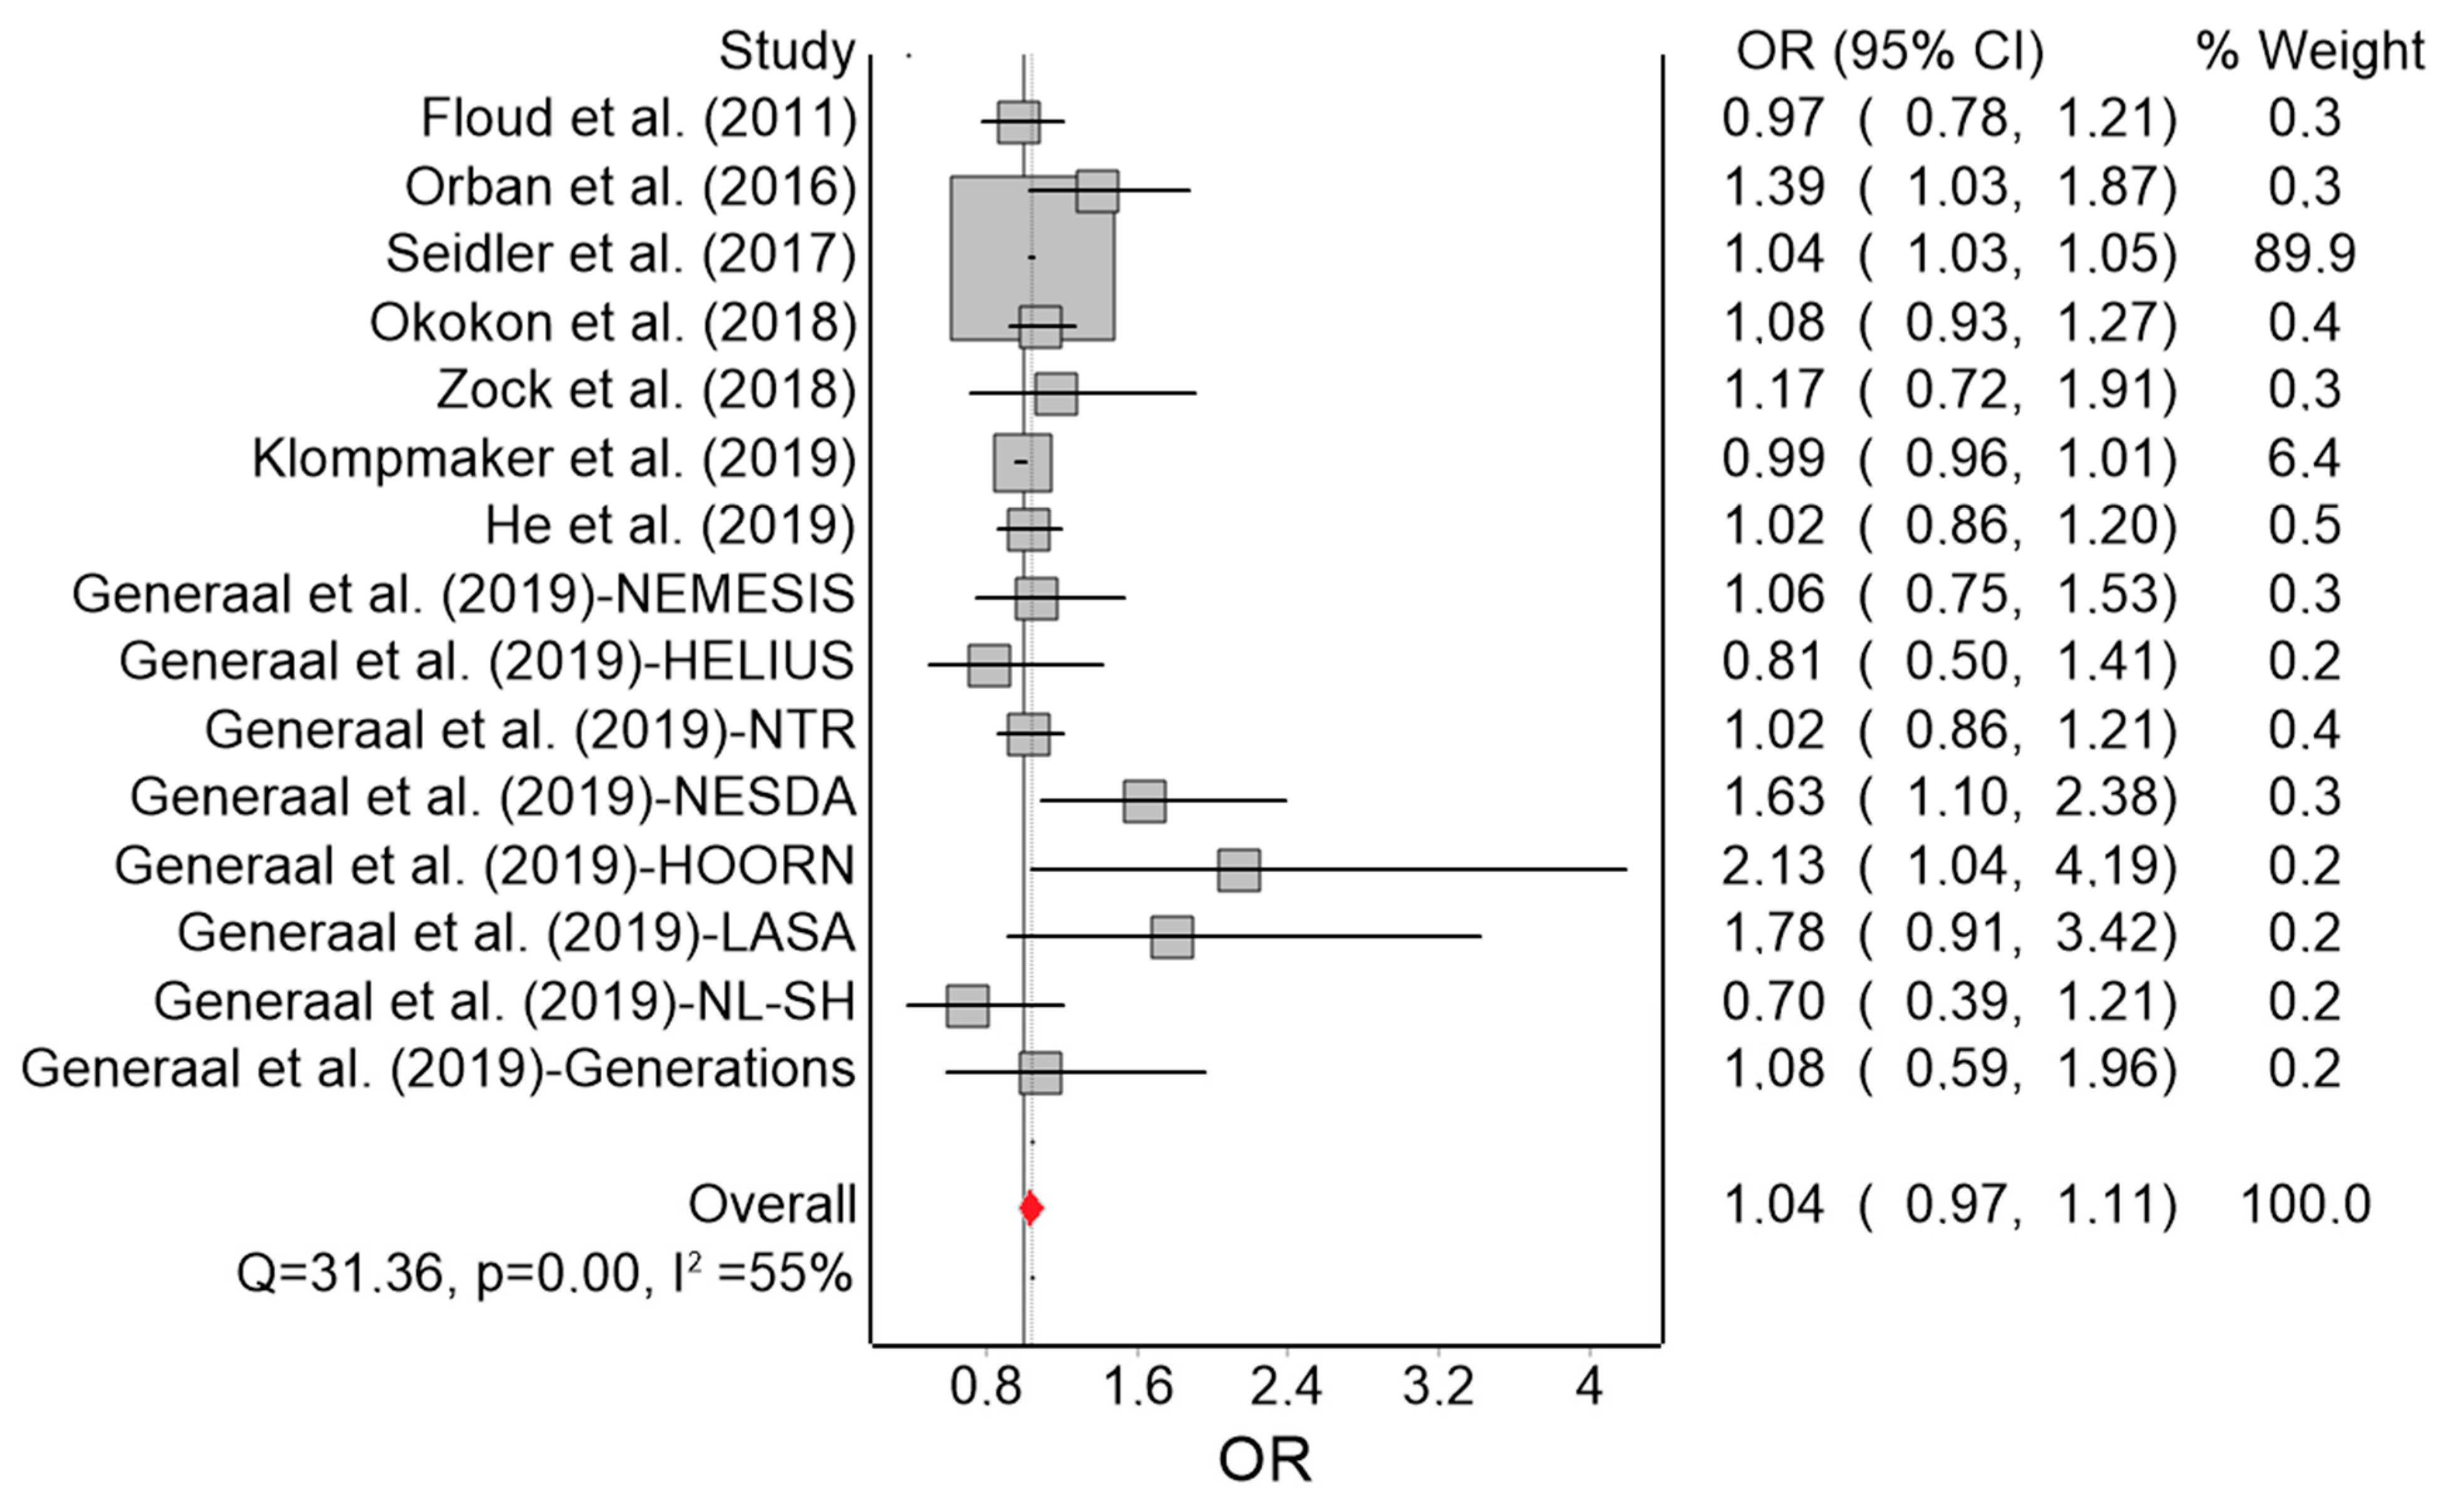
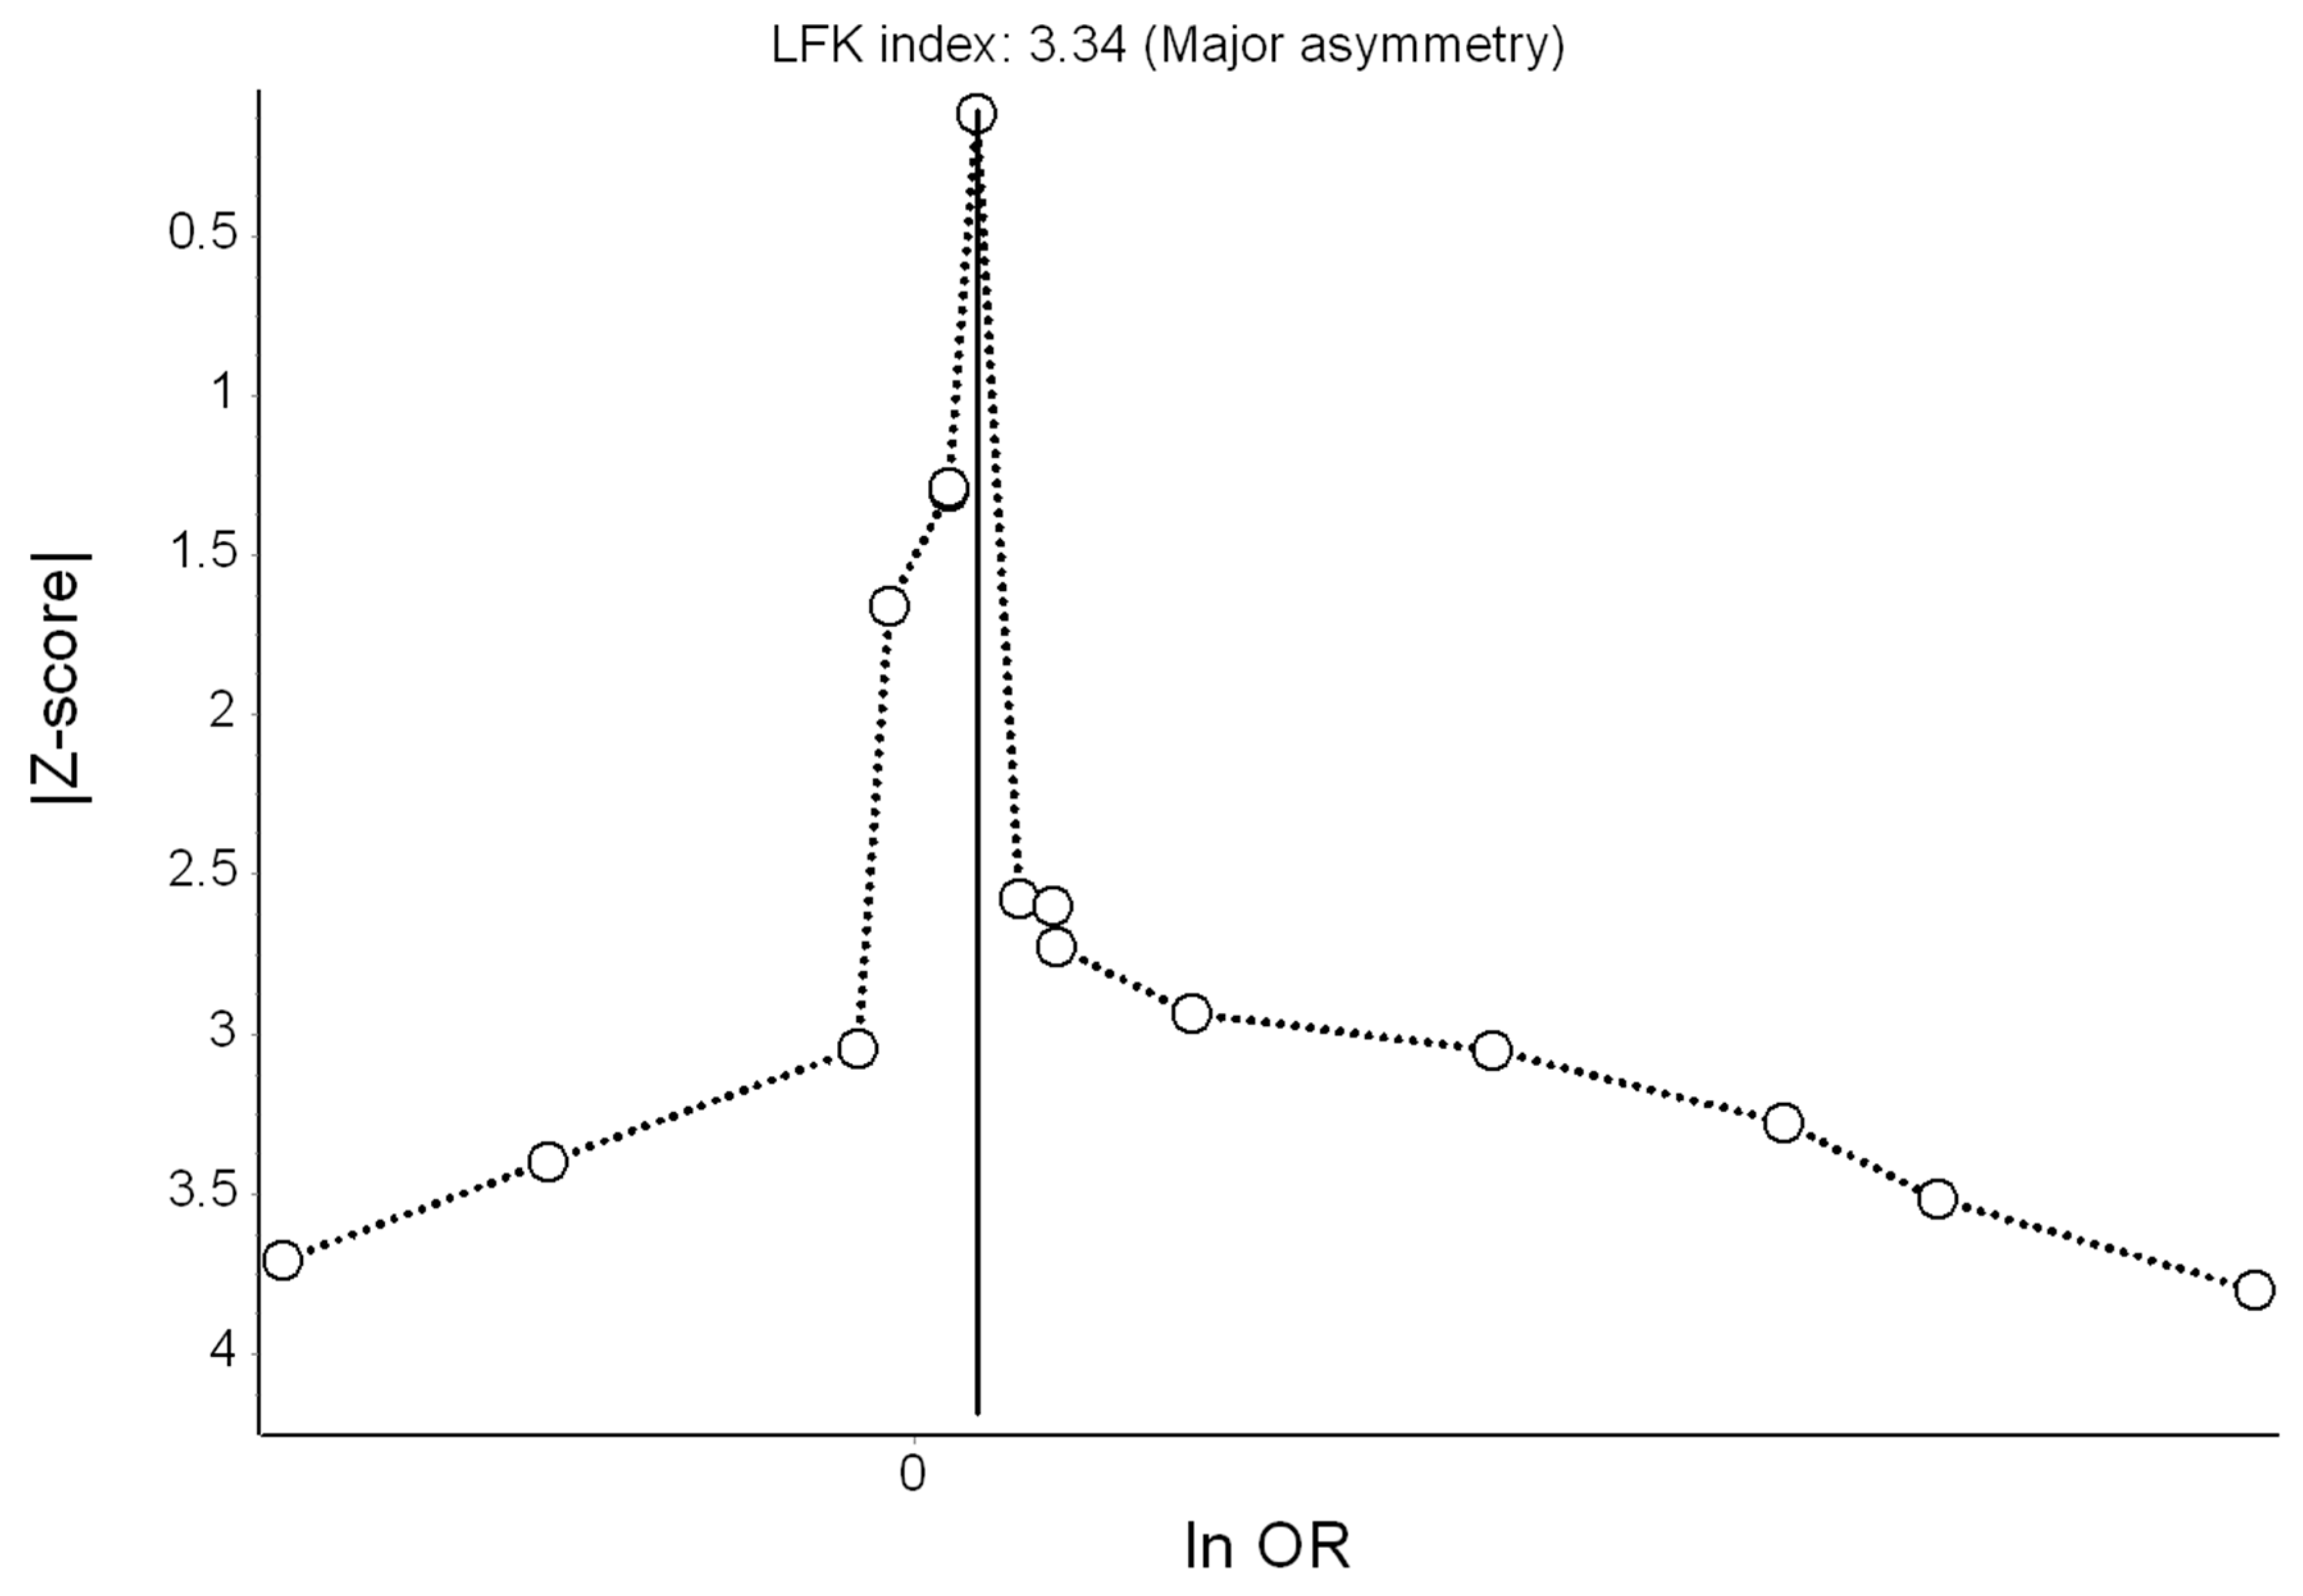
3.3. Meta-Analysis for Depression
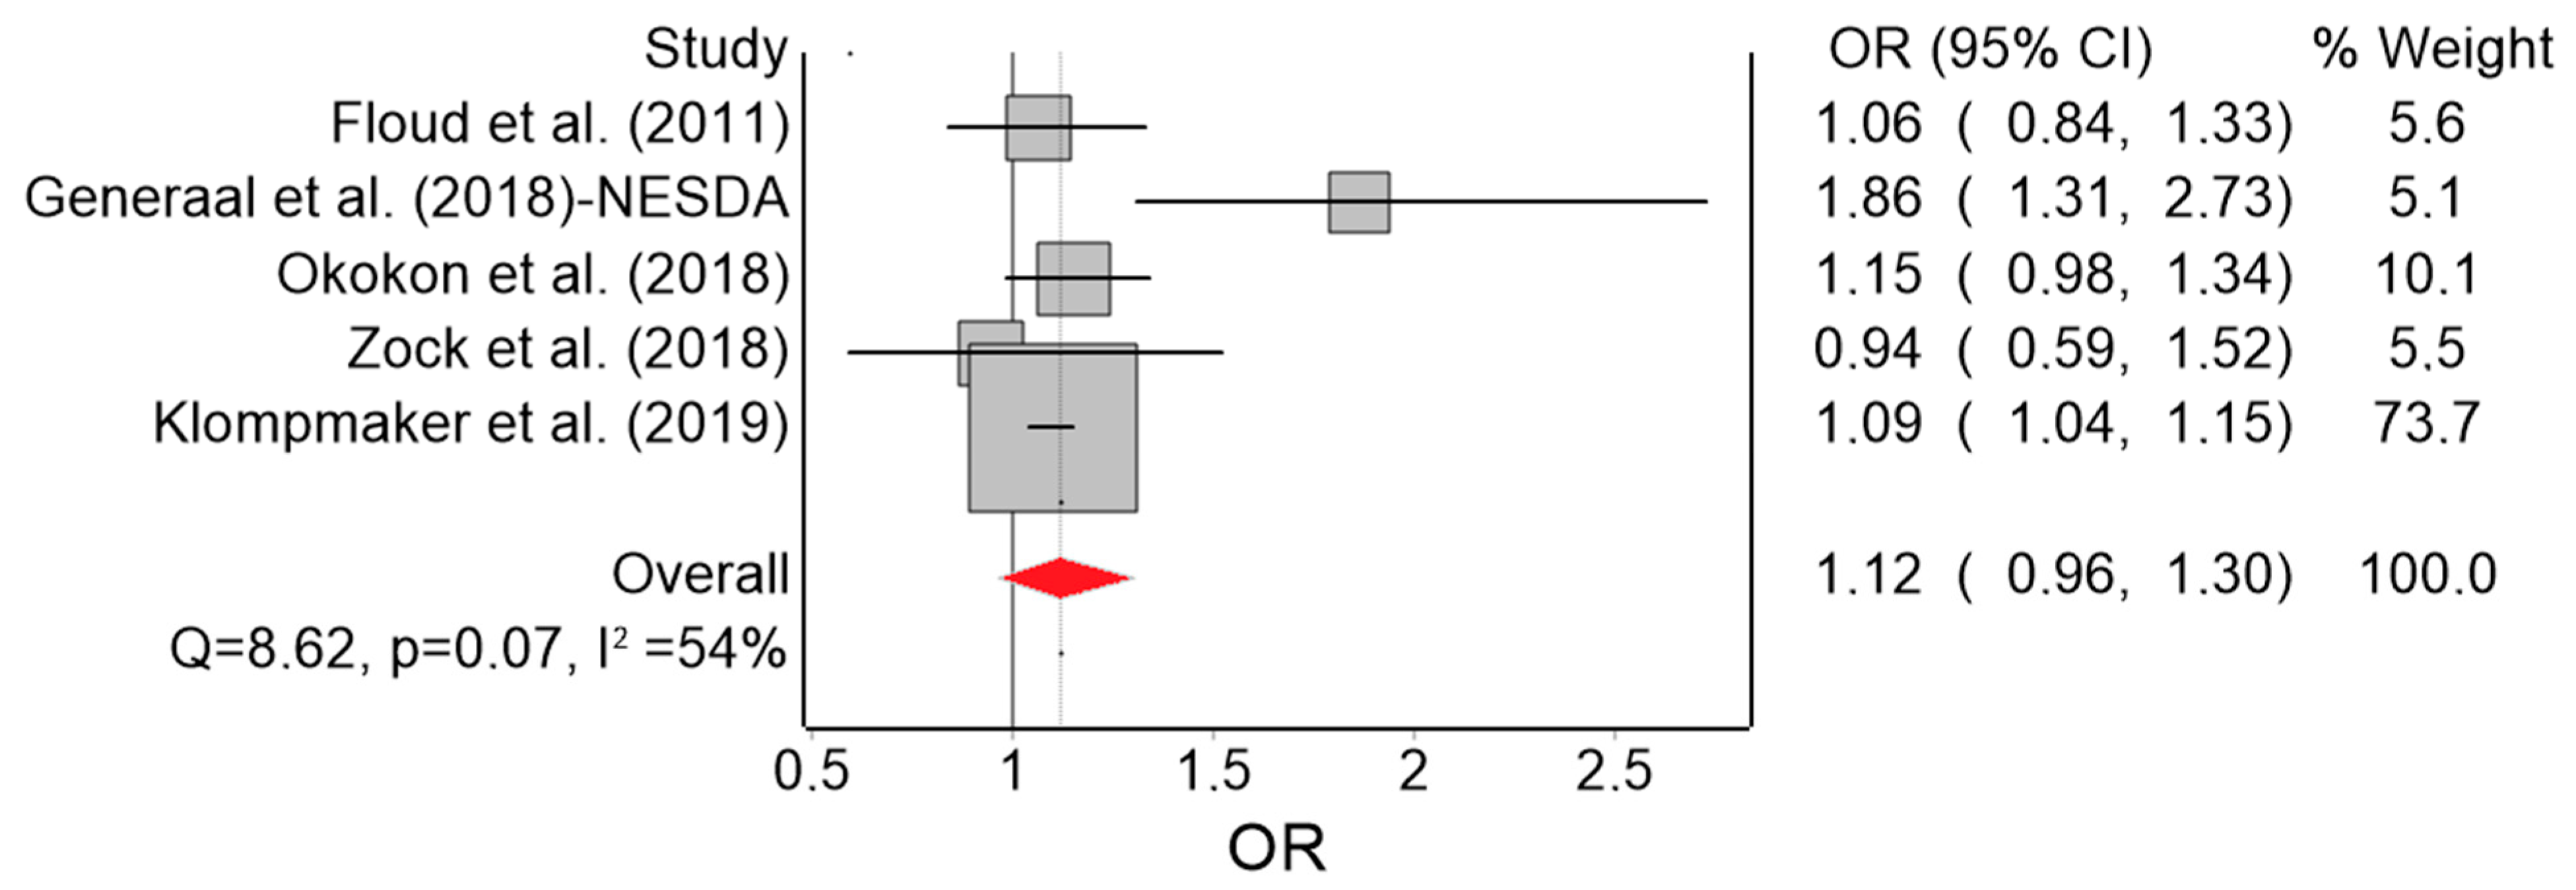
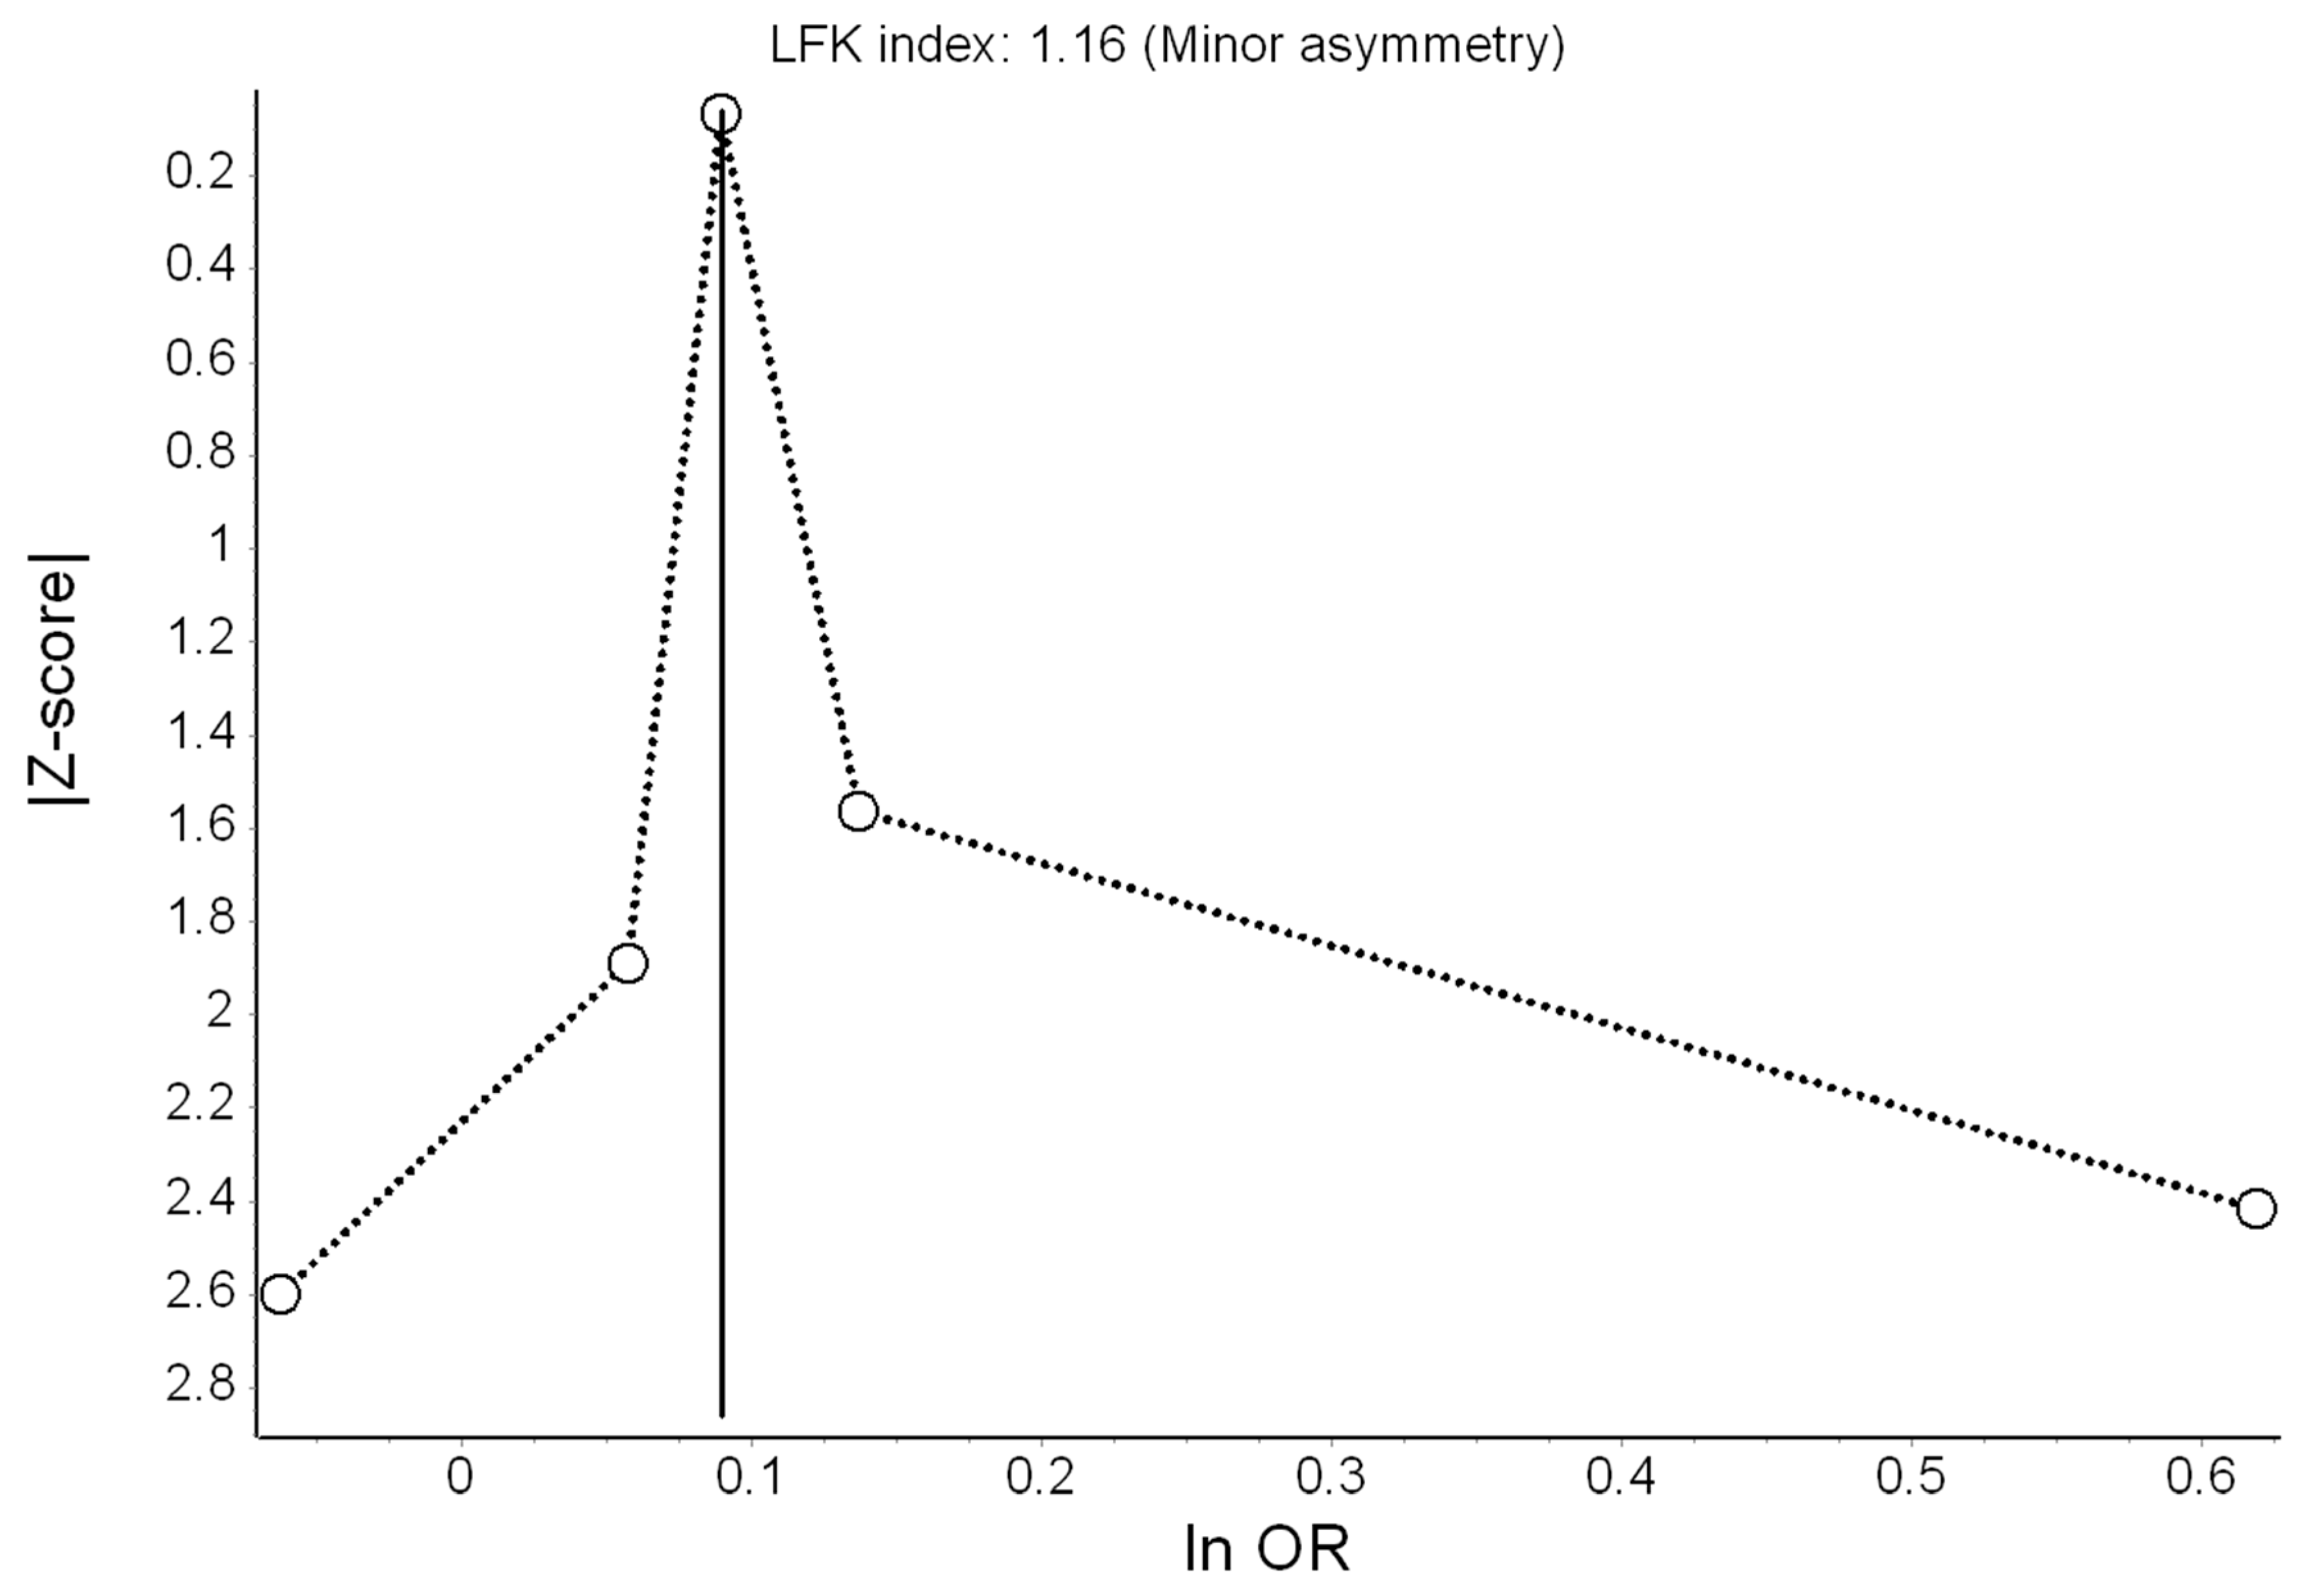
3.4. Meta-Analysis for Anxiety
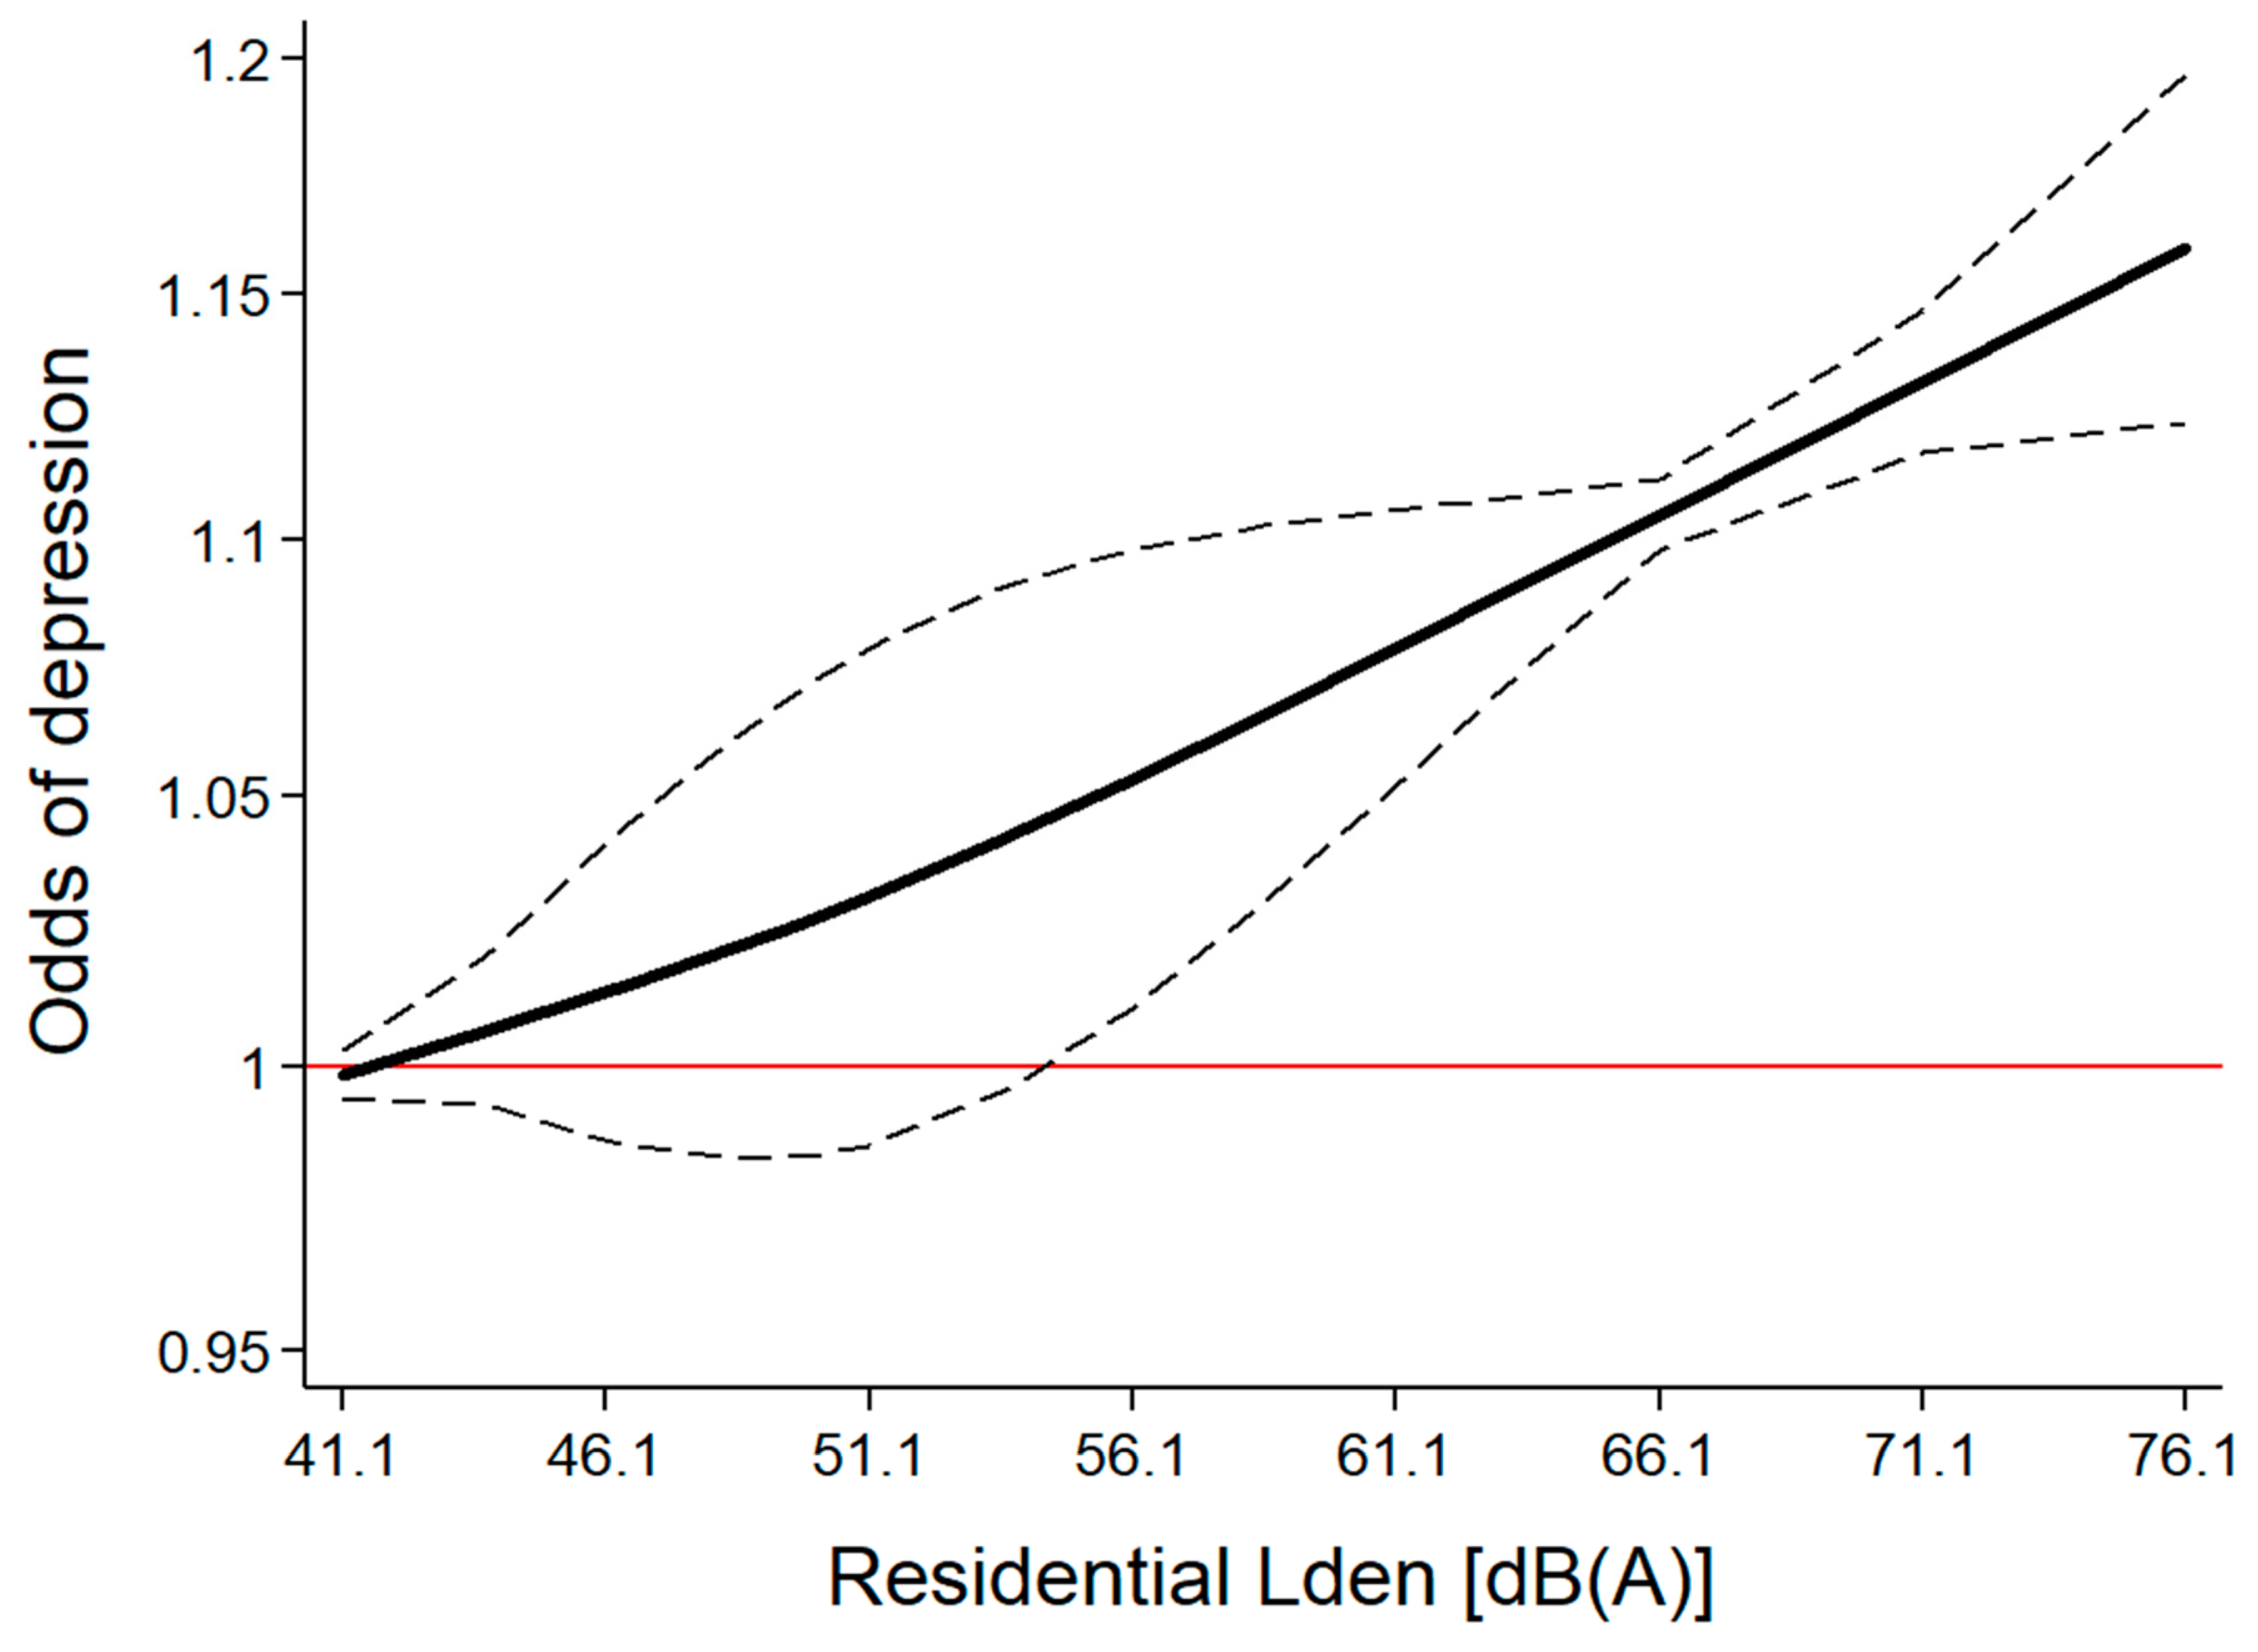
3.5. Moderators of the Effect of Road Traffic Noise on Depression
3.6. Quality of Evidence according to GRADE
4. Discussion
4.1. Major Findings
4.2. Strengths and Limitations
5. Conclusions
Author Contributions
Funding
Conflicts of Interest
Appendix A

| Bias Criteria |
|---|
| Publication type: |
| 0 = Not peer reviewed; |
| 1 = Peer reviewed article |
| Study design: |
| 0 = Ecological; |
| 1 = Cross-sectional; |
| 2 = Case control; |
| 3 = Cohort study |
| Selection of participants: |
| 0 = No random sampling OR response rate less than 60% OR attrition rate higher than 20% OR no information provided; |
| 3 = Participants randomly sampled from a known population AND response rate higher than 60%/most of source population sampled AND attrition rate less than 20% in follow-up studies |
| Sample representativeness: |
| 0 = No information provided; |
| 1 = Specific population group (e.g., narrow age range, disease status, socioeconomic status/education selection); |
| 2 = Broader age range, no major selection; |
| 3 = Reasonably representative of the general population, indicated by sampling method and/or provided comparison |
| Noise exposure quality: |
| 0 = Objective method, low accuracy (e.g., postcode-level exposure) OR no information about resolution provided; |
| 1 = Objective method, limited accuracy (land-use regression model, simple propagation modelling (engineering method) with poor traffic source data input, no validation measurements, no dwelling floor or noise barriers considered); |
| 2 = Objective method, moderate accuracy (propagation modelling (engineering method) with validation measurements, considering noise barriers and/or dwelling floor); |
| 3 = Objective method, high accuracy propagation modelling (scientific model), high quality traffic source data input, validation measurements with consideration of noise barriers and dwelling floor |
| Noise exposure timeframe: |
| 0 = After study period OR no information provided; |
| 1 = During study period; |
| 2 = In addition: a previous assessment preceding the study period; |
| 3 = 1 or 2 including a long-term residential history (duration of living) |
| Assessment of mental disorders: |
| 0 = Self-report symptoms scale; |
| 1= Self-reported diagnosis/ psychotropic medication use; |
| 2 = Registry-based expert diagnosis/ psychotropic medication use; |
| 3 = Clinical diagnosis/prescription |
| Confounding factors: |
| 0 = None or only 1 important confounding factor considered (age or sex or education/socioeconomic status) OR no information provided; |
| 1 = Confounding factors considered but at least 2 of the following are considered: age; sex; education/socioeconomic status; |
| 2 = Consideration of all of the above confounders; |
| 3 = Consideration of all of the above and area-level socioeconomic status/urbanicity; |
| 4 = Consideration of all of the above and at least 1 of the following: ethnicity; marital status; both area-level socioeconomic status and urbanicity |
| Statistical analysis: |
| 0 = No information provided; |
| 1 = Flaws in or inappropriate statistical testing or interpretation of statistical tests that may have affected results (e.g., adjusting for mediators) OR transformation of effect estimates needed; |
| 2 = Appropriate statistical testing and interpretation of tests; 3 = Specific advanced statistical model (multilevel analysis with appropriate data) |
| Additional bias: |
| 0 = Other study or data extraction issues that may have led to bias; |
| 3 = No other serious issues detected |
| Publication | Publication Type | Study Design | Selection of Participants | Sample Representativeness | Noise Exposure Quality | Noise Exposure Timeframe | Mental Disorders | Confounding Factors | Statistics | Bias | Overall Score |
|---|---|---|---|---|---|---|---|---|---|---|---|
| Floud et al. [20] | 1 | 1 | 0 | 1 | 1 | 0 | 1 | 2 | 1 | 3 | 11 |
| Orban et al. [15] | 1 | 3 | 0 | 1 | 2 | 0 | 1 | 3 | 2 | 01 | 13 |
| Seidler et al. [36] | 1 | 2 | 3 | 1 | 2 | 3 | 2 | 2 | 2 | 3 | 21 |
| Okokon et al. [33] | 1 | 1 | 0 | 3 | 2 | 2 | 1 | 2 | 1 | 01 | 13 |
| Zock et al. [65] | 1 | 1 | 0 | 3 | 0 | 2 | 2 | 2 | 3 | 3 | 17 |
| Generaal et al. [31] | 1 | 1 | 0 | 1 | 2 | 1 | 3 | 2 | 3 | 01,2 | 14 |
| Klompmaker et al. [30] | 1 | 1 | 0 | 1 | 1 | 2 | 2 | 4 | 2 | 01 | 14 |
| He et al. [16] | 1 | 3 | 3 | 1 | 0 | 1 | 3 | 1 | 1 | 3 | 17 |
| Generaal et al. [32] | |||||||||||
| NEMESIS dataset | 1 | 1 | 0 | 3 | 2 | 2 | 3 | 2 | 3 | 01,2 | 17 |
| HELIUS dataset | 1 | 1 | 0 | 3 | 2 | 2 | 0 | 2 | 3 | 01,2 | 14 |
| NTR dataset | 1 | 1 | 0 | 3 | 2 | 2 | 0 | 2 | 3 | 01,2 | 14 |
| NESDA dataset | 1 | 1 | 0 | 1 | 2 | 2 | 3 | 2 | 3 | 01,2 | 15 |
| HOORN dataset | 1 | 1 | 0 | 1 | 2 | 2 | 0 | 2 | 3 | 01,2 | 12 |
| LASA dataset | 1 | 1 | 0 | 1 | 2 | 2 | 0 | 2 | 3 | 01,2 | 12 |
| NL-SH dataset | 1 | 1 | 0 | 3 | 2 | 2 | 0 | 2 | 3 | 01,2 | 14 |
| Generations dataset | 1 | 1 | 0 | 1 | 2 | 2 | 0 | 2 | 3 | 01,2 | 12 |
| Leijssen et al. [34] 1 | 1 | 1 | 0 | 3 | 0 | 2 | 0 | 4 | 1 | 02 | 12 |
| Publication | OR | 95% CI | Lden [dB(A)] 1 | |
|---|---|---|---|---|
| Lower Bound | Upper Bound | |||
| He et al. [16] | 1 | 1 | 1 | 52.5 |
| He et al. [16] | 0.80 | 0.50 | 1.27 | 57.5 |
| He et al. [16] | 0.75 | 0.47 | 1.19 | 62.5 |
| He et al. [16] | 0.77 | 0.48 | 1.23 | 67.5 |
| Leijssen et al. [34] | 1 | 1 | 1 | 49.5 |
| Leijssen et al. [34] | 0.94 | 0.84 | 1.06 | 57 |
| Leijssen et al. [34] | 0.82 | 0.70 | 0.97 | 62 |
| Leijssen et al. [34] | 1.07 | 0.85 | 1.36 | 67 |
| Leijssen et al. [34] | 1.65 | 1.10 | 2.48 | 72 |
| Okokon et al. [33] | 1 | 1 | 1 | 42.5 |
| Okokon et al. [33] | 1.20 | 0.83 | 1.73 | 47.5 |
| Okokon et al. [33] | 1.13 | 0.78 | 1.64 | 52.5 |
| Okokon et al. [33] | 1.04 | 0.70 | 1.53 | 57.5 |
| Okokon et al. [33] | 1.32 | 0.91 | 1.90 | 62.5 |
| Seidler et al. [36] | 1 | 1 | 1 | 41.1 |
| Seidler et al. [36] | 1.02 | 1 | 1.06 | 46.1 |
| Seidler et al. [36] | 1.06 | 1.03 | 1.09 | 51.1 |
| Seidler et al. [36] | 1.09 | 1.06 | 1.12 | 56.1 |
| Seidler et al. [36] | 1.05 | 1.01 | 1.08 | 61.1 |
| Seidler et al. [36] | 1.12 | 1.08 | 1.16 | 66.1 |
| Seidler et al. [36] | 1.12 | 1.08 | 1.17 | 71.1 |
| Seidler et al. [36] | 1.17 | 1.10 | 1.25 | 76.1 |
| Orban et al. [15] | 1 | 1 | 1 | 52.5 |
| Orban et al. [15] | 1.19 | 0.86 | 1.65 | 57.5 |
| Orban et al. [15] | 1.52 | 1.11 | 2.07 | 62.5 |
| Orban et al. [15] | 1.19 | 0.85 | 1.68 | 67.5 |
| Klompmaker et al. [30] | 1 | 1 | 1 | 47.95 |
| Klompmaker et al. [30] | 0.99 | 0.95 | 1.04 | 50.65 |
| Klompmaker et al. [30] | 1.02 | 0.98 | 1.07 | 53.35 |
| Klompmaker et al. [30] | 0.98 | 0.93 | 1.02 | 56.7 |
| Klompmaker et al. [30] | 0.96 | 0.92 | 1.01 | 60.7 |
References
- Guski, R.; Schreckenberg, D.; Schuemer, R. WHO Environmental Noise Guidelines for the European Region: A Systematic Review on Environmental Noise and Annoyance. Int. J. Environ. Res. Public Health 2017, 14, 1539. [Google Scholar] [CrossRef] [PubMed]
- Basner, M.; McGuire, S. WHO Environmental Noise Guidelines for the European Region: A Systematic Review on Environmental Noise and Effects on Sleep. Int. J. Environ. Res. Public Health 2018, 15, 519. [Google Scholar] [CrossRef] [PubMed]
- Van Kempen, E.; Casas, M.; Pershagen, G.; Foraster, M. WHO Environmental Noise Guidelines for the European Region: A Systematic Review on Environmental Noise and Cardiovascular and Metabolic Effects: A Summary. Int. J. Environ. Res. Public Health 2018, 15, 379. [Google Scholar] [CrossRef] [PubMed]
- Clark, C.; Paunovic, K. WHO Environmental Noise Guidelines for the European Region: A Systematic Review on Environmental Noise and Quality of Life, Wellbeing and Mental Health. Int. J. Environ. Res. Public Health 2018, 15, 2400. [Google Scholar] [CrossRef]
- OECD. Mental Health Problems Costing Europe Heavily. 2018. Available online: https://www.oecd.org/health/mental-health-problems-costing-europe-heavily.htm (accessed on 29 September 2019).
- Baiyewu, O.; Bello, B. Primary Mental Health Prevention—A Public Health Priority Around the World. In Global Mental Health; Bährer-Kohler, S., Carod-Artal, F., Eds.; Springer: Cham, Switzerland, 2017. [Google Scholar]
- Baranne, M.L.; Falissard, B. Global burden of mental disorders among children aged 5–14 years. Child Adol. Psychiatry Men. Health 2018, 12, 19. [Google Scholar] [CrossRef]
- Thornicroft, G.; Chatterji, S.; Evans-Lacko, S.; Gruber, M.; Sampson, N.; Aguilar-Gaxiola, S.; Al-Hamzawi, A.; Alonso, J.; Andrade, L.; Borges, G.; et al. Undertreatment of people with major depressive disorder in 21 countries. Br. J. Psychiatry 2017, 210, 119–214. [Google Scholar] [CrossRef]
- Alonso, J.; Liu, Z.; Evans-Lacko, S.; Sadikova, E.; Sampson, N.; Chatterji, S.; Abdulmalik, J.; Aguilar-Gaxiola, S.; Al-Hamzawi, A.; Andrade, L.H.; et al. Treatment gap for anxiety disorders is global: Results of the World Mental Health Surveys in 21 countries. Depress. Anxiety 2018, 35, 195–208. [Google Scholar] [CrossRef]
- Ormel, J.; Kessler, R.C.; Schoevers, R. Depression: More treatment but no drop in prevalence: How effective is treatment? And can we do better? Curr. Opin. Psychiatry 2019, 32, 348–354. [Google Scholar] [CrossRef]
- Steel, Z.; Marnane, C.; Iranpour, C.; Chey, T.; Jackson, J.W.; Patel, V.; Silove, D. The global prevalence of common mental disorders: A systematic review and meta-analysis 1980–2013. Int. J. Epidemiol. 2014, 43, 476–493. [Google Scholar] [CrossRef]
- WHO. Mental Health Action Plan 2013–2020; WHO: Geneva, Switzerland, 2013. [Google Scholar]
- Patel, V.; Saxena, S.; Lund, C.; Thornicroft, G.; Baingana, F.; Bolton, P.; Chisholm, D.; Collins, P.Y.; Cooper, J.L.; Eaton, J.; et al. The Lancet Commission on global mental health and sustainable development. Lancet 2018, 392, 1553–1598. [Google Scholar] [CrossRef] [Green Version]
- Jorm, A.; Yap, M. The future of Mental Health & Prevention. Ment. Health Prev. 2019, 14, 200168. [Google Scholar] [CrossRef]
- Orban, E.; McDonald, K.; Sutcliffe, R.; Hoffmann, B.; Fuks, K.B.; Dragano, N.; Viehmann, A.; Erbel, R.; Jöckel, K.H.; Pundt, N.; et al. Residential Road Traffic Noise and High Depressive Symptoms after Five Years of Follow-up: Results from the Heinz Nixdorf Recall Study. Environ. Health Perspect. 2016, 124, 578–585. [Google Scholar] [CrossRef] [PubMed] [Green Version]
- He, S.; Smargiassi, A.; Low, N.; Bilodeau-Bertrand, M.; Ayoub, A.; Auger, N. Residential noise exposure and the longitudinal risk of hospitalization for depression after pregnancy: Postpartum and beyond. Environ. Res. 2019, 170, 26–32. [Google Scholar] [CrossRef] [PubMed]
- Nieuwenhuijsen, M.J.; Ristovska, G.; Dadvand, P. WHO Environmental Noise Guidelines for the European Region: A Systematic Review on Environmental Noise and Adverse Birth Outcomes. Int. J. Environ. Res. Public Health 2017, 14, 1252. [Google Scholar] [CrossRef]
- Schubert, M.; Hegewald, J.; Freiberg, A.; Starke, K.R.; Augustin, F.; Riedel-Heller, S.G.; Zeeb, H.; Seidler, A. Behavioral and Emotional Disorders and Transportation Noise among Children and Adolescents: A Systematic Review and Meta-Analysis. Int. J. Environ. Res. Public Health 2019, 16, 3336. [Google Scholar] [CrossRef]
- Moher, D.; Liberati, A.; Tetzlaff, J.; Altman, D.G.; the PRISMA Group. Preferred reporting items for systematic reviews and meta-analyses: The PRISMA statement. Ann. Intern. Med. 2009, 151, 264–269. [Google Scholar] [CrossRef]
- Floud, S.; Vigna-Taglianti, F.; Hansell, A.; Blangiardo, M.; Houthuijs, D.; Breugelmans, O.; Cadum, E.; Babisch, W.; Selander, J.; Pershagen, G.; et al. Medication use in relation to noise from aircraft and road traffic in six European countries: Results of the HYENA study. Occup. Environ. Med. 2011, 68, 518–524. [Google Scholar] [CrossRef]
- Bocquier, A.; Cortaredona, S.; Boutin, C.; David, A.; Bigot, A.; Sciortino, V.; Nauleau, S.; Gaudart, J.; Giorgi, R.; Verger, P. Is exposure to night-time traffic noise a risk factor for purchase of anxiolytic-hypnotic medication? A cohort study. Eur. J. Public Health 2014, 24, 298–303. [Google Scholar] [CrossRef]
- Halonen, J.I.; Lanki, T.; Yli-Tuomi, T.; Turunen, A.W.; Pentti, J.; Kivimäki, M.; Vahtera, J. Associations of traffic noise with self-rated health and psychotropic medication use. Scand. J. Work Environ. Health 2014, 40, 235–243. [Google Scholar] [CrossRef]
- Kishikawa, H.; Matsui, T.; Uchiyama, I.; Miyakawa, M.; Hiramatsu, K.; Stansfeld, S.A. Noise sensitivity and subjective health: Questionnaire study conducted along trunk roads in Kusatsu, Japan. Noise Health 2009, 11, 111–117. [Google Scholar] [CrossRef]
- Honold, J.; Beyer, R.; Lakes, T.; van der Meer, E. Multiple environmental burdens and neighborhood-related health of city residents. J. Environ. Psychol. 2012, 32, 305–317. [Google Scholar] [CrossRef]
- Stansfeld, S.A.; Haines, M.M.; Berry, B.; Burr, M. Reduction of road traffic noise and mental health: An intervention study. Noise Health 2009, 11, 169–175. [Google Scholar] [CrossRef] [PubMed]
- Zijlema, W.L.; Wolf, K.; Emeny, R.; Ladwig, K.H.; Peters, A.; Kongsgård, H.; Hveem, K.; Kvaløy, K.; Yli-Tuomi, T.; Partonen, T.; et al. The association of air pollution and depressed mood in 70,928 individuals from four European cohorts. Int. J. Hyg. Environ. Health 2016, 219, 212–219. [Google Scholar] [CrossRef] [PubMed]
- WHO. Environmental Noise Guidelines for the European Region; WHO Regional Office for Europe: Copenhagen, Denmark, 2018. [Google Scholar]
- Babisch, W. Road traffic noise and cardiovascular risk. Noise Health 2008, 10, 27–33. [Google Scholar] [CrossRef]
- Dzhambov, A.M.; Dimitrova, D.D. Residential road traffic noise as a risk factor for hypertension in adults: Systematic review and meta-analysis of analytic studies published in the period 2011–2017. Environ. Pollut. 2018, 240, 306–318. [Google Scholar] [CrossRef]
- Klompmaker, J.O.; Hoek, G.; Bloemsma, L.D.; Wijga, A.H.; van den Brink, C.; Brunekreef, B.; Lebret, E.; Gehring, U.; Janssen, N.A.H. Associations of combined exposures to surrounding green, air pollution and traffic noise on mental health. Environ. Int. 2019, 129, 525–537. [Google Scholar] [CrossRef]
- Generaal, E.; Timmermans, E.J.; Dekkers, J.E.C.; Smit, J.H.; Penninx, B.W.J.H. Not urbanization level but socioeconomic, physical and social neighbourhood characteristics are associated with presence and severity of depressive and anxiety disorders. Psychol. Med. 2019, 49, 149–161. [Google Scholar] [CrossRef]
- Generaal, E.; Hoogendijk, E.O.; Stam, M.; Henke, C.E.; Rutters, F.; Oosterman, M.; Huisman, M.; Kramer, S.E.; Elders, P.J.M.; Timmermans, E.J.; et al. Neighbourhood characteristics and prevalence and severity of depression: Pooled analysis of eight Dutch cohort studies. Br. J. Psychiatry 2019, 215, 468–475. [Google Scholar] [CrossRef]
- Okokon, E.O.; Yli-Tuomi, T.; Turunen, A.W.; Tiittanen, P.; Juutilainen, J.; Lanki, T. Traffic noise, noise annoyance and psychotropic medication use. Environ. Int. 2018, 119, 287–294. [Google Scholar] [CrossRef]
- Leijssen, J.B.; Snijder, M.B.; Timmermans, E.J.; Generaal, E.; Stronks, K.; Kunst, A.E. The association between road traffic noise and depressed mood among different ethnic and socioeconomic groups. The HELIUS study. Int. J. Hyg. Environ. Health 2019, 222, 221–229. [Google Scholar] [CrossRef]
- Orsini, N.; Bellocco, R.; Greenland, S. Generalized least squares for trend estimation of summarized dose-response data. Stata J. 2006, 6, 40–57. [Google Scholar] [CrossRef]
- Seidler, A.; Hegewald, J.; Seidler, A.L.; Schubert, M.; Wagner, M.; Dröge, P.; Haufe, E.; Schmitt, J.; Swart, E.; Zeeb, H. Association between aircraft, road and railway traffic noise and depression in a large case-control study based on secondary data. Environ. Res. 2017, 152, 263–271. [Google Scholar] [CrossRef] [PubMed]
- Brink, M.; Schäffer, B.; Pieren, R.; Wunderli, J.M. Conversion between noise exposure indicators Leq24h, LDay, LEvening, LNight, Ldn and Lden: Principles and practical guidance. Int. J. Hyg. Environ. Health 2018, 221, 54–63. [Google Scholar] [CrossRef]
- Dzhambov, A.M.; Lercher, P. Road Traffic Noise Exposure and Birth Outcomes: An Updated Systematic Review and Meta-Analysis. Int. J. Environ. Res. Public Health 2019, 16, 2522. [Google Scholar] [CrossRef] [PubMed]
- Brockwell, S.E.; Gordon, I.R. A simple method for inference on an overall effect in meta-analysis. Stat. Med. 2007, 26, 4531–4543. [Google Scholar] [CrossRef]
- Cornell, J.E.; Mulrow, C.D.; Localio, R.; Stack, C.B.; Meibohm, A.R.; Guallar, E.; Goodman, S.N. Random-effects meta-analysis of inconsistent effects: A time for change. Ann. Intern. Med. 2014, 160, 267–270. [Google Scholar] [CrossRef]
- Doi, S.A.; Barendregt, J.J.; Khan, S.; Thalib, L.; Williams, G.M. Advances in the meta-analysis of heterogeneous clinical trials II: The quality effects model. Contemp. Clin. Trials. 2015, 45, 123–129. [Google Scholar] [CrossRef]
- Doi, S.A.; Barendregt, J.J.; Khan, S.; Thalib, L.; Williams, G.M. Simulation Comparison of the Quality Effects and Random Effects Methods of Meta-analysis. Epidemiology 2015, 26, e42–e44. [Google Scholar] [CrossRef]
- Doi, S.A.R.; Furuya-Kanamori, L.; Thalib, L.; Barendregt, J.J. Meta-analysis in evidence-based healthcare: A paradigm shift away from random effects is overdue. Int. J. Evid.-Based Healthc. 2017, 15, 152–160. [Google Scholar] [CrossRef]
- Barendregt, J.J.; Doi, S.A. MetaXL User Guide, Version 5.3; EpiGear International Pty Ltd.: Sunrise Beach, Australia, 2016; Available online: http://www.epigear.com/index.htm (accessed on 20 November 2016).
- Furuya-Kanamori, L.; Barendregt, J.J.; Doi, S.A.R. A new improved graphical and quantitative method for detecting bias in meta-analysis. Int. J. Evid.-Based Healthc. 2018, 16, 195–203. [Google Scholar] [CrossRef]
- Hedges, L.V.; Tipton, E.; Johnson, M.C. Robust variance estimation in meta-regression with dependent effect size estimates. Res. Synth. Methods 2010, 1, 39–65. [Google Scholar] [CrossRef] [PubMed]
- Xu, C.; Doi, S.A.R. The robust error meta-regression method for dose-response meta-analysis. Int. J. Evid.-Based Healthc. 2018, 16, 138–144. [Google Scholar] [CrossRef] [PubMed]
- Higgins, J.P.; Thompson, S.G.; Deeks, J.J.; Altman, D.G. Measuring inconsistency in meta-analyses. BMJ 2003, 327, 557–560. [Google Scholar] [CrossRef] [PubMed] [Green Version]
- Guyatt, G.H.; Oxman, A.D.; Vist, G.E.; Kunz, R.; Falck-Ytter, Y.; Alonso-Coello, P.; Schünemann, H.J. GRADE Working Group. GRADE: An emerging consensus on rating quality of evidence and strength of recommendations. BMJ 2008, 336, 924–926. [Google Scholar] [CrossRef]
- Schünemann, H.; Bro_zek, J.; Guyatt, G.; Oxman, A. GRADE Handbook for Grading the Quality of Evidence and the Strength of Recommendations using the GRADE Approach. 2013. Available online: https://gdt.gradepro.org/app/handbook/handbook.html#h.svwngs6pm0f2 (accessed on 20 November 2016).
- Sygna, K.; Aasvang, G.M.; Aamodt, G.; Oftedal, B.; Krog, N.H. Road traffic noise, sleep and mental health. Environ. Res. 2014, 131, 17–24. [Google Scholar] [CrossRef]
- Roswall, N.; Høgh, V.; Envold-Bidstrup, P.; Raaschou-Nielsen, O.; Ketzel, M.; Overvad, K.; Olsen, A.; Sørensen, M. Residential exposure to traffic noise and health-related quality of life—A population-based study. PLoS ONE 2015, 10, e0120199. [Google Scholar] [CrossRef]
- Héritier, H.; Vienneau, D.; Frei, P.; Eze, I.C.; Brink, M.; Probst-Hensch, N.; Röösli, M. The association between road traffic noise exposure, annoyance and health-related quality of life (HRQOL). Int. J. Environ. Res. Public Health 2014, 11, 12652–12667. [Google Scholar] [CrossRef]
- Evandt, J.; Oftedal, B.; Hjertager Krog, N.; Nafstad, P.; Schwarze, P.E.; Aasvang, G.M. A Population-Based Study on Nighttime Road Traffic Noise and Insomnia. Sleep 2017, 40. [Google Scholar] [CrossRef]
- Evandt, J.; Oftedal, B.; Krog, N.H.; Skurtveit, S.; Nafstad, P.; Schwarze, P.E.; Skovlund, E.; Houthuijs, D.; Aasvang, G.M. Road traffic noise and registry based use of sleep medication. Environ. Health 2017, 16, 110. [Google Scholar] [CrossRef]
- Hammersen, F.; Niemann, H.; Hoebel, J. Environmental Noise Annoyance and Mental Health in Adults: Findings from the Cross-Sectional German Health Update (GEDA) Study 2012. Int. J. Environ. Res. Public Health 2016, 13, 954. [Google Scholar] [CrossRef]
- Jensen, H.A.R.; Rasmussen, B.; Ekholm, O. Neighbour and traffic noise annoyance: A nationwide study of associated mental health and perceived stress. Eur. J. Public Health 2018, 28, 1050–1055. [Google Scholar] [CrossRef] [PubMed]
- Noori, K.; Zand, F. An Investigation of Traffic Noise Pollution Effects on Citizens’ General and Mental Health (Case Study: Kermanshah City). J. Novel Appl. Sci. 2013, 2, 344–349. [Google Scholar]
- Krefis, A.C.; Albrecht, M.; Kis, A.; Langenbruch, A.; Augustin, M.; Augustin, J. Multivariate Analysis of Noise, Socioeconomic and Sociodemographic Factors and Their Association with Depression on Borough Level in the City State of Hamburg, Germany. J. Depress. Ther. 2017, 1. [Google Scholar] [CrossRef]
- Turunen, A.W.; Yli-Tuomi, T.; Tiittanen, P.; Halonen, J.I.; Männistö, S.; Lanki, T. Traffic Noise in Relation to Self-Reported Mental Health. In Proceedings of the Inter-noise 2014, Melbourne, Australia, 16–19 November 2014. [Google Scholar]
- Tzivian, L.; Winkler, A.; Dlugaj, M.; Schikowski, T.; Vossoughi, M.; Fuks, K.; Weinmayr, G.; Hoffmann, B. Effect of long-term outdoor air pollution and noise on cognitive and psychological functions in adults. Int. J. Hyg. Environ. Health 2015, 218, 1–11. [Google Scholar] [CrossRef] [PubMed]
- Zijlema, W.L.; Dadvand, P.; Bartoll, X.; Cirach, M.; Borrell, C.; Nieuwenhuijsen, M. Urban Built Environment, Environmental Exposures and Mental Health in a Dense Mediterranean City. In Proceedings of the InterNoise 2019, Madrid, Spain, 16–19 June 2019. [Google Scholar]
- Seidler, A.; Hegewald, J.; Seidler, A.L.; Schubert, M.; Zeeb, H. Is the Whole More Than the Sum of Its Parts? Health Effects of Different Types of Traffic Noise Combined. Int. J. Environ. Res. Public. Health 2019, 16, 1665. [Google Scholar] [CrossRef] [PubMed]
- Rudolph, K.E.; Shev, A.; Paksarian, D.; Merikangas, K.R.; Mennitt, D.J.; James, P.; Casey, J.A. Environmental noise and sleep and mental health outcomes in a nationally representative sample of urban US adolescents. Environ. Epidemiol. 2019, 3, e056. [Google Scholar] [CrossRef] [PubMed]
- Zock, J.P.; Verheij, R.; Helbich, M.; Volker, B.; Spreeuwenberg, P.; Strak, M.; Janssen, N.A.H.; Dijst, M.; Groenewegen, P. The impact of social capital, land use, air pollution and noise on individual morbidity in Dutch neighbourhoods. Environ. Int. 2018, 121, 453–460. [Google Scholar] [CrossRef]
- Van den Bosch, M.; Meyer-Lindenberg, A. Environmental Exposures and Depression: Biological Mechanisms and Epidemiological Evidence. Annu. Rev. Public Health 2019, 40, 239–259. [Google Scholar] [CrossRef] [Green Version]
- Dzhambov, A.M.; Markevych, I.; Tilov, B.; Arabadzhiev, Z.; Stoyanov, D.; Gatseva, P.; Dimitrova, D.D. Pathways linking residential noise and air pollution to mental ill-health in young adults. Environ. Res. 2018, 166, 458–465. [Google Scholar] [CrossRef]
- Von Lindern, E.; Hartig, T.; Lercher, P. Traffic-related exposure, constrained restoration, and health in the residential context. Health Place 2016, 39, 92–100. [Google Scholar] [CrossRef]
- Greenland, S.; Pearce, N. Statistical foundations for model-based adjustments. Annu. Rev. Public Health 2015, 36, 89–108. [Google Scholar] [CrossRef] [PubMed]
- Greenland, S.; Daniel, R.; Pearce, N. Outcome modelling strategies in epidemiology: Traditional methods and basic alternatives. Int. J. Epidemiol. 2016, 45, 565–575. [Google Scholar] [CrossRef] [PubMed]
- Wang, T.; Li, H.; Su, P.; Yu, Y.; Sun, X.; Liu, Y.; Yuan, Z.; Xue, F. Sensitivity analysis for mistakenly adjusting for mediators in estimating total effect in observational studies. BMJ Open 2017, 7, e015640. [Google Scholar] [CrossRef] [PubMed]
- Van Kamp, I.; van Kempen, E.; Baliatsas, C.; Houthuijs, D. Mental Health as Context Rather than Health outcome of Noise: Competing Hypotheses Regarding the Role of Sensitivity, Perceived Soundscapes and Restoration. In Proceedings of the INTER-NOISE 2013, Innsbruck, Austria, 15–18 September 2013. [Google Scholar]
- Job, R.F. Noise sensitivity as a factor influencing human reaction to noise. Noise Health 1999, 1, 57–68. [Google Scholar]
- Miedema, H.M.; Vos, H. Noise sensitivity and reactions to noise and other environmental conditions. J. Acoust. Soc. Am. 2003, 113, 1492–1504. [Google Scholar] [CrossRef]
- Stansfeld, S.A.; Clark, C.R.; Jenkins, L.M.; Tarnopolsky, A. Sensitivity to noise in a community sample: I. Measurement of psychiatric disorder and personality. Psychol. Med. 1985, 15, 243–254. [Google Scholar] [CrossRef]
- Stansfeld, S.A. Noise, noise sensitivity and psychiatric disorder: Epidemiological and psychophysiological studies. Psychol. Med. 1992, 22, 1–44. [Google Scholar] [CrossRef]
- Nivison, M.E.; Endresen, I.M. An analysis of relationships among environmental noise, annoyance and sensitivity to noise, and the consequences for health and sleep. J. Behav. Med. 1993, 16, 257–276. [Google Scholar] [CrossRef]
- Marks, A.; Griefahn, B. Associations between noise sensitivity and sleep, subjectively evaluated sleep quality, annoyance, and performance after exposure to nocturnal traffic noise. Noise Health 2007, 9, 1–7. [Google Scholar]
- Staner, L. Comorbidity of insomnia and depression. Sleep Med. Rev. 2010, 14, 35–46. [Google Scholar] [CrossRef]
- Alvaro, P.K.; Roberts, R.M.; Harris, J.K. A systematic review assessing bidirectionality between sleep disturbances, anxiety, and depression. Sleep 2013, 36, 1059–1068. [Google Scholar] [CrossRef] [PubMed]
- Kyrou, I.; Kollia, N.; Panagiotakos, D.; Georgousopoulou, E.; Chrysohoou, C.; Tsigos, C.; Randeva, H.S.; Yannakoulia, M.; Stefanadis, C.; Papageorgiou, C.; et al. Association of depression and anxiety status with 10-year cardiovascular disease incidence among apparently healthy Greek adults: The ATTICA Study. Eur. J. Prev. Cardiol. 2017, 24, 145–152. [Google Scholar] [CrossRef] [PubMed]
- Chrysohoou, C.; Kollia, N.; Tousoulis, D. The link between depression and atherosclerosis through the pathways of inflammation and endothelium dysfunction. Maturitas 2018, 109, 1–5. [Google Scholar] [CrossRef] [PubMed]
- John, A.; Patel, U.; Rusted, J.; Richards, M.; Gaysina, D. Affective problems and decline in cognitive state in older adults: A systematic review and meta-analysis. Psychol. Med. 2019, 49, 353–365. [Google Scholar] [CrossRef]
- Byers, A.L.; Yaffe, K. Depression and risk of developing dementia. Nat. Rev. Neurol. 2011, 7, 323. [Google Scholar] [CrossRef]
- Becker, E.; Rios, C.L.O.; Lahmann, C.; Rücker, G.; Bauer, J.; Boeker, M. Anxiety as a risk factor of Alzheimer’s disease and vascular dementia. Br. J. Psychiatry 2018, 213, 654–660. [Google Scholar] [CrossRef]
- Rasmussen, H.; Rosness, T.A.; Bosnes, O.; Salvesen, Ø.; Knutli, M.; Stordal, E. Anxiety and depression as risk factors in frontotemporal dementia and Alzheimer’s disease: The HUNT study. Dement. Geriatr. Cogn. Disord. Extra 2018, 8, 414–425. [Google Scholar] [CrossRef]
- Fang, H.; Tu, S.; Sheng, J.; Shao, A. Depression in sleep disturbance: A review on a bidirectional relationship, mechanisms and treatment. J. Cell. Mol. Med. 2019, 23, 2324–2332. [Google Scholar] [CrossRef] [Green Version]
- Lovasi, G.S.; Mooney, S.J.; Muennig, P.; DiMaggio, C. Cause and context: Place-based approaches to investigate how environments affect mental health. Soc. Psychiatry Psychiatr. Epidemiol. 2016, 51, 1571–1579. [Google Scholar] [CrossRef]
- Evans, G.W. The built environment and mental health. J. Urban Health 2003, 80, 536–555. [Google Scholar] [CrossRef]
- Hoisington, A.J.; Stearns-Yoder, K.A.; Schuldt, S.J.; Beemer, C.J.; Maestre, J.P.; Kinney, K.A.; Postolache, T.T.; Lowry, C.A.; Brenner, L.A. Ten questions concerning the built environment and mental health. Build. Environ. 2019, 155, 58–69. [Google Scholar] [CrossRef]
- Tsai, W.L.; McHale, M.; Jennings, V.; Marquet, O.; Hipp, J.; Leung, Y.F.; Floyd, M. Relationships between characteristics of urban green land cover and mental health in US metropolitan areas. Int. J. Environ. Res. Public Health 2018, 15, 340. [Google Scholar] [CrossRef] [PubMed]
- Helbich, M.; Klein, N.; Roberts, H.; Hagedoorn, P.; Groenewegen, P.P. More green space is related to less antidepressant prescription rates in the Netherlands: A Bayesian geoadditive quantile regression approach. Environ. Res. 2018, 166, 290–297. [Google Scholar] [CrossRef] [PubMed] [Green Version]
- Hystad, P.; Payette, Y.; Noisel, N.; Boileau, C. Green space associations with mental health and cognitive function: Results from the Quebec CARTaGENE cohort. Environ. Epidemiol. 2019, 3, e040. [Google Scholar] [CrossRef]
- Seabrook, E.M.; Kern, M.L.; Rickard, N.S. Social networking sites, depression, and anxiety: A systematic review. JMIR Ment. Health 2016, 3, e50. [Google Scholar] [CrossRef]
- Ehsan, A.; Klaas, H.S.; Bastianen, A.; Spini, D. Social capital and health: A systematic review of systematic reviews. SSM Popul. Health 2019, 8, 100425. [Google Scholar] [CrossRef]
- Helbich, M. Dynamic Urban Environmental Exposures on Depression and Suicide (NEEDS) in the Netherlands: A protocol for a cross-sectional smartphone tracking study and a longitudinal population register study. BMJ Open 2019, 9, e030075. [Google Scholar] [CrossRef]
- Nieuwenhuijsen, M.J.; Agier, L.; Basagaña, X.; Urquiza, J.; Tamayo-Uria, I.; Giorgis-Allemand, L.; Robinson, O.; Siroux, V.; Maitre, L.; de Castro, M.; et al. Influence of the Urban Exposome on Birth Weight. Environ. Health Perspect. 2019, 127, 47007. [Google Scholar] [CrossRef]
- Daiber, A.; Lelieveld, J.; Steven, S.; Oelze, M.; Kröller-Schön, S.; Sørensen, M.; Münzel, T. The “exposome” concept—How environmental risk factors influence cardiovascular health. Acta Biochim. Pol. 2019, 66, 269–283. [Google Scholar] [CrossRef]
- Davey, J.; Turner, R.M.; Clarke, M.J.; Higgins, J.P.T. Characteristics of meta-analyses and their component studies in the Cochrane Database of Systematic Reviews: A cross-sectional, descriptive analysis. BMC Med. Res. Methodol. 2011, 11, 160. [Google Scholar] [CrossRef]
- Stone, J.; Gurunathan, U.; Glass, K.; Munn, Z.; Tugwell, P.; Doi, S.A.R. Stratification by quality induced selection bias in a meta-analysis of clinical trials. J. Clin. Epidemiol. 2019, 107, 51–59. [Google Scholar] [CrossRef] [PubMed] [Green Version]
- Stone, J.; Glass, K.; Munn, Z.; Tugwell, P.; Doi, S.A.R. Comparison of bias adjustment methods in meta-analysis suggests that quality effects modelling may have less limitations than other approaches. J. Clin. Epidemiol. 2019, 117, 36–45. [Google Scholar] [CrossRef] [PubMed]
- Barregard, L.; Stansfeld, S. Medication use as an outcome variable in environmental (noise) epidemiology. Scand. J. Work Environ. Health 2014, 40, 211–213. [Google Scholar] [CrossRef] [PubMed]


| Publication | Country (Study) | Design | Analysis Sample | Mental Health Outcomes | Noise Exposure | Adjustments in Main Model |
|---|---|---|---|---|---|---|
| Floud et al. [20] | Greece, United Kingdom, Netherlands, Sweden, Italy, Germany (HYENA) | Cross-sectional (2004/6) | N = 4642; 45-70 years; 50.3% female; response rate 37-51% | Antidepressants (4.1%), anxiolytics (3.1%) (self-reported) | Modelled road traffic LAeq,24h at address; lived at the address for previous 5 years; 45-75 dB | Age, sex, education, BMI, alcohol, smoking, physical activity, country |
| Orban et al. [15] | Germany (HNR) | Prospective cohort (2000/3); ≈ 5.1 years follow-up | N = 3098; 45-75 years; ≈ 48% female; 55.8% response rate | Depression (antidepressants and/or self-reported scale) (9.2%) | Modelled road traffic Lden at each floor and façade; < 55 to > 70 dB | Age, sex, education, income, economic activity, area-level SES, traffic proximity |
| Seidler et al. [36] | Germany (NORAH) | Case-control (2010) | N = 77,295 cases (67.8% female) and 578226 controls (49.5% female); ≥ 40 years; 23% of the population | Depression – ICD-10: F32, 33, 34.1, 41.2 (register-based) | Modelled road traffic LAeq,16hr; 40 to ≥ 70 dB | Age, sex, education/job title (where available), area-level SES, urban living |
| Okokon et al. [33] | Finland (HCREHS) | Cross-sectional (2015/16) | N = 5687/8; ≈ 55 ± 16 years; 57.4% female; 45-47% response rate | Anxiolytics (7%), antidepressants (7%) (self-reported) | Modelled road traffic Lden at most exposed façade; ≤ 45 to > 60 dB | Age, sex, income, marital status, employment, alcohol, smoking, physical activity, pet ownership |
| Zock et al. [65] | Netherlands | Cross-sectional (2013) | N = 4450; 40.5 years (0 to > 65); 50.9% female; 10% of all GP patients | Anxiety (4%), depression (4.5%) (register-based) | Modelled road traffic Lden at postcode-level; 61.2 dB (percentiles 58.3-64.0) | Age, sex, income, SES |
| Generaal et al. [31] 1 | Netherlands (NESDA) | Cross-sectional (2004/7) | N = 2472/2560; ≈ 42 years (18-65); ≈ 66% female; 45% response rate | Anxiety, depression (diagnosed) | Modelled combined traffic Lden; 55 (percentiles 53-57) ± 14.3 dB | Age, sex, education, income, municipality |
| Klompmaker et al. [30] | Netherlands (PHM) | Cross-sectional (2012) | N = 354,827; 19 to ≥ 65 years (43% ≥ 65); 54.6% female; 47% response rate | Anxiolytics (2%), antidepressants (7.3%), (register-based) | Modelled road traffic Lden; 53.3 ± 7.5 dB | Age, sex, education, income, marital status, region of origin, occupation, alcohol, smoking, area-level SES, urbanization |
| He et al. [16] | Canada | Prospective pregnancy cohort (2000-2017); < 18 years follow-up | N = 140,456; < 25 to ≥ 35 years; 100% female; almost all of the population | Depression (0.7%)—ICD-9: 296.2, 296.3, 300.4, 309.28, 311; ICD-10: F32-34.1, 41.2 (diagnosed) | Modelled (LUR) combined traffic Lnight at postcode-level; 62.4 ± 4.9 dB (49.2-84.9) | Age, pregnancy factors, comorbidity, area-level SES, neighbourhood walkability, time period, propensity score matching |
| Generaal et al. [32] | Netherlands (NEMESIS/ HELIUS/ NTR/ NESDA/ HOORN/ LASA/ NL-SH/ Generations) | Cross-sectional (2007-9/ 2011-15/ 2009-10/ 2004-7/ 2006-7/ 2005-6/ 2006-8/ 2009-15) | N = 6381/ 4634/ 11,388/ 2472/ 2667/ 1893/ 1575/ 1477. Age: 44 ± 13 (18-64)/ 46 ± 14 (18-70)/ 47 ± 13 (≥25)/ 42 ± 13 (18-65)/ 53 ± 17 (40-65)/ 71 ± 9 (55-85)/ 46 ± 12 (18-64)/ 35 ± 47 years. Female %: 55/ 54/ 62/ 66/ 53/ 55/ 64/ 100 | Depression (diagnosed in NEMESIS/NESDA) and depressed mood (self-reported scale in the other studies); (6.4/ 7.3/ 6.3/ 5.2/ 5.1/ 5/ 5.8/ 4%) | Modelled combined traffic Lden; 55±3.3/ 60 ± 2.5/ 54±5/ 55±3.2/ 54±2.3/ 53±3.3/ 54±3.6/ 56±5 dB | Age, sex, education, income |
| Leijssen et al. [34] 2 | Netherlands (HELIUS) | Cross-sectional (2011/15) | N = 23,293; 44 years (18-70); 57.4% female; 55% response rate | Depressed mood (self-reported scale); (14.8%) | Modelled combined road traffic Lden at postcode-level; 45 to ≥ 70 dB | Age, sex, education, ethnicity, occupation, marital status, household composition, neuroticism, stressful life events, area-level SES, green/blue space, liveability |
| Study-Level Factor | N | OR/10 dB(A) | 95% CI | I2 (%) | Moderation p-Value |
|---|---|---|---|---|---|
| Outcome assessment | |||||
| Diagnosis | 5 | 1.04 | 0.92–1.17 | 28 | Reference |
| Antidepressants | 4 | 0.99 | 0.86–1.15 | 52 | 0.120 |
| Self-report scale | 6 | 1.03 | 0.73–1.46 | 47 | 0.676 |
| Noise source | |||||
| Road traffic | 6 | 1.04 | 0.97–1.10 | 70 | Reference |
| Road traffic + other | 9 | 1.07 | 0.90–1.28 | 45 | 0.386 |
| Females % (continuous) | 15 | 1.00 | 1.00–1.00 | n/a | 0.989 |
| Mean/median age (continuous) | 10 | 1.01 | 0.99–1.03 | n/a | 0.096 |
| Minimum age (continuous) | 14 | 1.00 | 1.00–1.00 | n/a | 0.150 |
| Sample size (continuous) | 15 | 1.00 | 1.00–1.00 | n/a | 0.548 |
| Mean/median noise level (continuous) | 11 | 1.00 | 0.98–1.02 | n/a | 0.838 |
| Prevalence of depression (continuous) | 14 | 0.98 | 0.93–1.03 | n/a | 0.386 |
© 2019 by the authors. Licensee MDPI, Basel, Switzerland. This article is an open access article distributed under the terms and conditions of the Creative Commons Attribution (CC BY) license (http://creativecommons.org/licenses/by/4.0/).
Share and Cite
Dzhambov, A.M.; Lercher, P. Road Traffic Noise Exposure and Depression/Anxiety: An Updated Systematic Review and Meta-Analysis. Int. J. Environ. Res. Public Health 2019, 16, 4134. https://0-doi-org.brum.beds.ac.uk/10.3390/ijerph16214134
Dzhambov AM, Lercher P. Road Traffic Noise Exposure and Depression/Anxiety: An Updated Systematic Review and Meta-Analysis. International Journal of Environmental Research and Public Health. 2019; 16(21):4134. https://0-doi-org.brum.beds.ac.uk/10.3390/ijerph16214134
Chicago/Turabian StyleDzhambov, Angel M., and Peter Lercher. 2019. "Road Traffic Noise Exposure and Depression/Anxiety: An Updated Systematic Review and Meta-Analysis" International Journal of Environmental Research and Public Health 16, no. 21: 4134. https://0-doi-org.brum.beds.ac.uk/10.3390/ijerph16214134