1. Introduction
Exposure to many chemical substances both naturally occurring and of anthropogenic origin may influence the initiation and/or progression of tumors in animals and humans and on the other hand it affects human microbiota [
1]. An example of widely distributed environmental contaminants are pesticides, because of their frequent use in agriculture. Selected pesticides and their residues present in human food might increase cancer risk [
2,
3,
4]. Likewise, theirinfluence on microorganisms creating gut microbiota system is incontestable. It was shown that microorganisms play an important role in the metabolism of pesticides, e.g.,
Pseudomonas spp. and
E. coli are capable of utilizing 3,5,6-trichloro-2-pyridinol as a source of carbon and energy [
5]. Therefore, it was concluded that the exposure to pesticides significantly affect the composition and function of human microbiota [
6].
One of the commonly used groups of pesticides are herbicides design specifically for the control of unwanted vegetation and therefore frequently applied in forestry, agriculture, pasture systems and urban green areas. Literature data indicate possibility of their transport and contamination of surface waters, which increases the risk of environmental contamination [
7,
8]. Subsequently pollution by herbicides may cause dangerous effects in organisms that are important elements of the food chain, such as primary producers, which are the basis of the food web for aquatic organisms [
9].
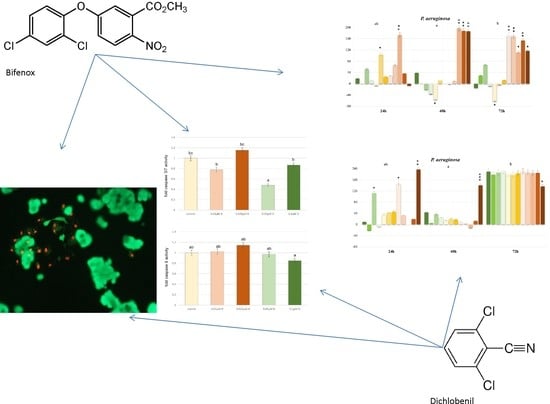
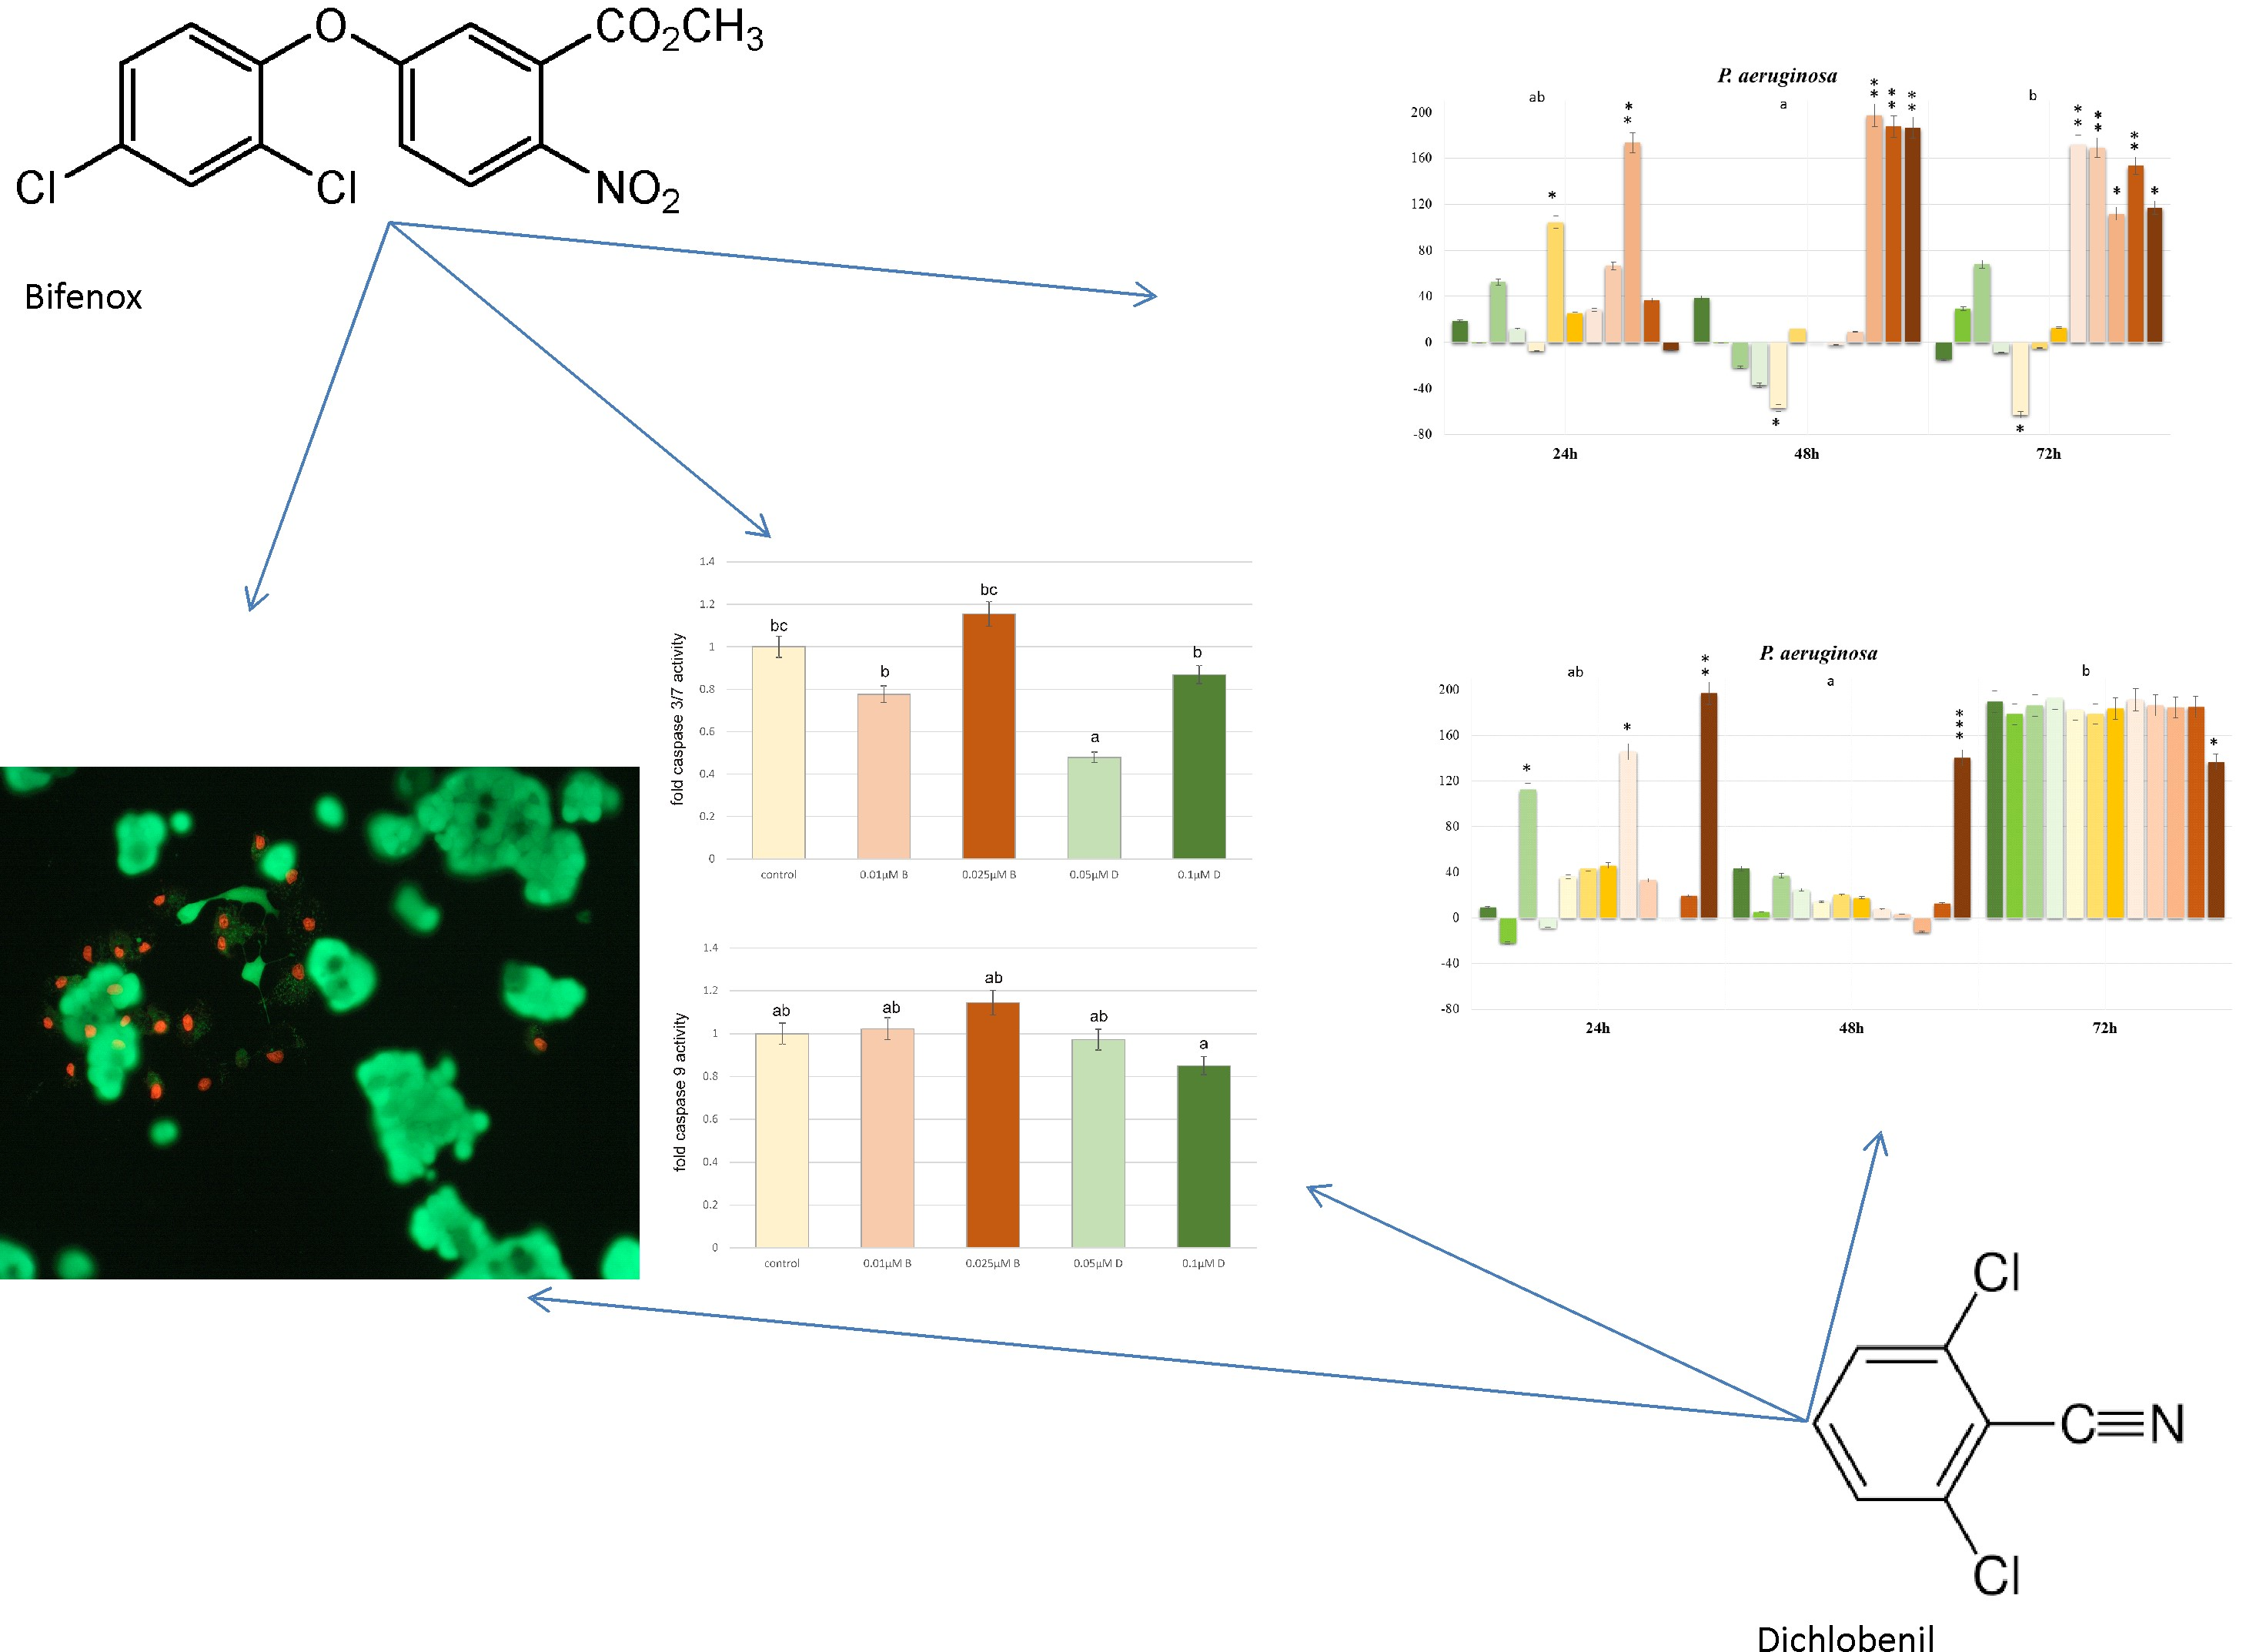
According to IUPAC (International Union of Pure and Applied Chemistry) Bifenox chemical name is methyl 5-(2,4-dichlorophenoxy)-2-nitrobenzoate and it belongs to the group of nitrophenyl ether herbicides. Bifenox belongs to the group of selective herbicides and is used to control annual broad-leaved weeds and selected grasses in many crops, e.g., cereals, maize, soybean, rice and many others. Its action at the cellular level consists in damage to cell membranes and inhibition of photosynthesis. In order to broaden the spectrum of activity, it is often used in combination with other herbicides [
10]. It is commonly detected in aquatic environment at the concentration levels which are considered toxic for aquatic organisms [
11]. However, there is scarce of data on the effects of Bifenox on the human body at the cellular level, in particular its potential carcinogenic activity and its impact on human microbiome.
The herbicide 2,6-dichlorobenzonitrile (DCBN) named Dichlobenil is a member of the benzonitrile herbicides group. It has been widely used in agriculture and households to control growth of weeds and its residues, mainly its metabolic product 2,6-dichlorobenzamide (BAM) generated by microorganisms, persist in the environment. Therefore, in the year 2008 it was prohibited as an herbicide by the European Union [
12]. The mechanism of Dichlobenil toxic effects to target organisms was described as the inhibition of plant cell wall biosynthesis [
13]. The toxicity of Dichlobenil was analyzed in many different prokaryotic and eukaryotic systems and an information regarding its acute and chronic toxicity, carcinogenicity, and mutagenicity are available [
14,
15]. However, there is a significant lack of information available for the toxicity, mutagenicity, carcinogenicity and mechanisms of action of Dichlobenil in human breast cancer cells.
This paper aims to evaluate the degree of hazard of selected herbicides application. Two compounds of this herbicidal group, Bifenox and Dichlobenil, are currently approved for commercial use in the European Union, including Poland. Therefore, it seems interesting to study their influence on human and bacterial cells. In vitro testes which are usually cell- or bacteria-based bioassays represent an excellent screening tool appropriate for high sample throughput. Biological experimental models are indispensable for detecting unknown properties of selected chemical compounds and in comparison to other bioassays especially human cell-based assays have the highest sensitivity for the detection of environmental toxicants.
2. Materials and Methods
2.1. Reagents
RPMI-1640 medium, containing glucose at 4.5 mg/mL (25 mM), penicillin, streptomycin, trypsin–EDTA, FBS and PBS (without Ca and Mg, pH 7.4) were provided by PAN Biotech. GSH/GSSG-Glo™ Assay kit, Caspase 3/7 Assay and Caspase 9 Assay were provided by Promega Madison, WI. SDS, TCA, TBA, Folin-Ciocalteu reagent were provided by Sigma-Aldrich and DTNB by Serva. Dichlorodihydrofluorescein diacetate assay (DCFH-DA). Bifenox and Dichlobenil and Mueller Hinton II Broth were provided by Sigma-Aldrich, St. Louis, MO, USA. Cell stain double staining kit containing propionium iodide and calcein—AM was provided by Sigma-Aldrich, St. Louis, MO, USA. MTT reagent (3-(4,5-dimethylthiazol-2-yl)-2,5-diphenyltetrazolium bromide) was purchased from Sigma-Aldrich and fluorescein isothiocyanate (FITC) Annexin V Apoptosis Detection Kit I from BD Pharmingen (San Diego, CA, USA).
2.2. Cell Culture
The effect of Bifenox and Dichlobenil was examined in ZR-75-1 breast cancer cell line, which were obtained from American Type Culture Collection (ATCC). Cells were maintained in RPMI-1640 supplemented with 10% FBS, penicillin (100 U/mL), and streptomycin (100 μg/mL) at 37 °C in a humified atmosphere of 5% CO
2 in air. Adherent cells (2 × 10
4 cells/mL) in 200 µL of culture medium were incubated with or without the test compounds in tissue culture white and black 96-well plates for fluorescence and luminescence measurements. Apoptosis, GSH/GSSG ratio, ROS level were examined at 0.025 µM and 0.01 µM concentrations of Bifenox and 0.1 µM and 0.05 µM concentration of Dichlobenil. The incubation time was 24 h. For the estimation of TBARS and SH groups content cells were seeded into 6-well plates in 2 mL of culture medium with and without test compounds at above mentioned concentrations. Concentrations for the experiments: 0.025 µM and 0.01 µM concentrations of Bifenox and 0.1 µM and 0.05 µM concentration of Dichlobenil, were chosen on the basis of previously obtained results already presented in the literature [
16].
2.3. Bacterial Strains
E. coli (ATCC 25922), P. aeruginosa (ATCC27853) and C. albicans (ATCC 10231) were obtained from the American Type Culture Collection (Manassas, VA, USA). Selected strains are model strains of bacteria and fungi, respectively which are used in antimicrobial tests. E. coli, P. aeruginosa (Gram negative bacteria) and C. albicans (fungi) were grown overnight in Mueller Hinton II Broth at 37 °C (bacterial strains) and 27 °C (fungi). Next day, the overnight cultures were diluted in fresh MH II Broth to obtain 108 CFU/mL (CFU – colony forming units) for bacteria and 106 CFU/mL for fungi. For the antimicrobial activity was used the inoculum where the suspension of E. coli and P. aeruginosa cells was 106 CFU/mL and C. albicans was 104 CFU/mL.
2.4. Chemical Treatment of Cells
Bifenox and Dichlobenil were stored in a refrigerator at temperature 4 °C.
Bacterial cells were treated with increasing concentrations of Bifenox and Dichlobenil in the range from 0.01 µM to 200 µM.
The compounds were added to the cultured human cells for a final concentrations: 0.025 µM and 0.01 µM of Bifenox and 0.1 µM and 0.05 µM of Dichlobenil. The control cells were incubated without the test compounds.
2.5. Microtox Toxicity Test
The ecotoxicity analysis was carried out in accordance with the PN-EN ISO 11348-3: 2008 standard [
17]. The
Aliivibrio fischeri luminescent bacteria, previously known as
Vibrio fischeri [
18], were exposed to two types of pesticides: Dichlobenil and Bifenox in above mentioned range of concentrations.
Aliivibrio fischerii emits light as a result of natural metabolic processes taking place in cells after the contact with the analyzed sample, causing changes in the intensity of light emission by these organisms [
19]. The luminescence measurement was carried out using Microtox
® Model 500 analyzer (Strategic Diagnostics Inc., Newark, NJ, USA), based on the manufacturer’s procedure—“81.9% Basic Test”. Before performing the Microtox Basic Test
®, the samples were appropriately prepared for the assays. Sodium chloride solution was used to adjust the osmotic pression of the samples to approximately 2%. Toxicity assessments were made after 5 and 15 min. Omni 4.1 supporting computer software with a standard log-linear model was used to calculate the effective concentration values (EC
50) of the tested samples. In order to determine the toxicity of investigated samples the calculated values of the EC
50 (after 15 min.) were converted into units of acute toxicity (
TUa) according to the procedure specified for liquid phase calculation:
The obtained
TUa values of the liquid phase were classified into specific toxicity classes according to the to the toxicity classification system (TCS) proposed by Persoone and are presented in
Table 1 [
20].
3. Method of Determining Antibacterial Activity Assay
Antimicrobial activity of tested pesticides against of
E. coli,
P. aeruginosa and
C. albicans was evaluated based on MTT colorimetric assay (MCA) [
21,
22]. An aliquote of 90 µL of the indicator strains suspension incubated with tested herbicides for 24, 48 and 72 h at 37 °C were transferred to a sterile 96 well plate. Next, 10 µL of 5 mg/mL MTT solution was added into each well and incubated for 4 h. After that, the cultures were centrifuged at 1000×
g for 10 min. to precipitate formazan crystals and the supernatant was removed. Then 100 µL of acid isopropanol (0.1 M HCl in isopropanol) was added and the mixture was incubated and shaken for 10 min. at room temperature. The optical density (OD) of the formazan solution was measured at the wavelength of 560 nm using a microplate reader GloMax
®-Multi Microplate Multimode Reader.
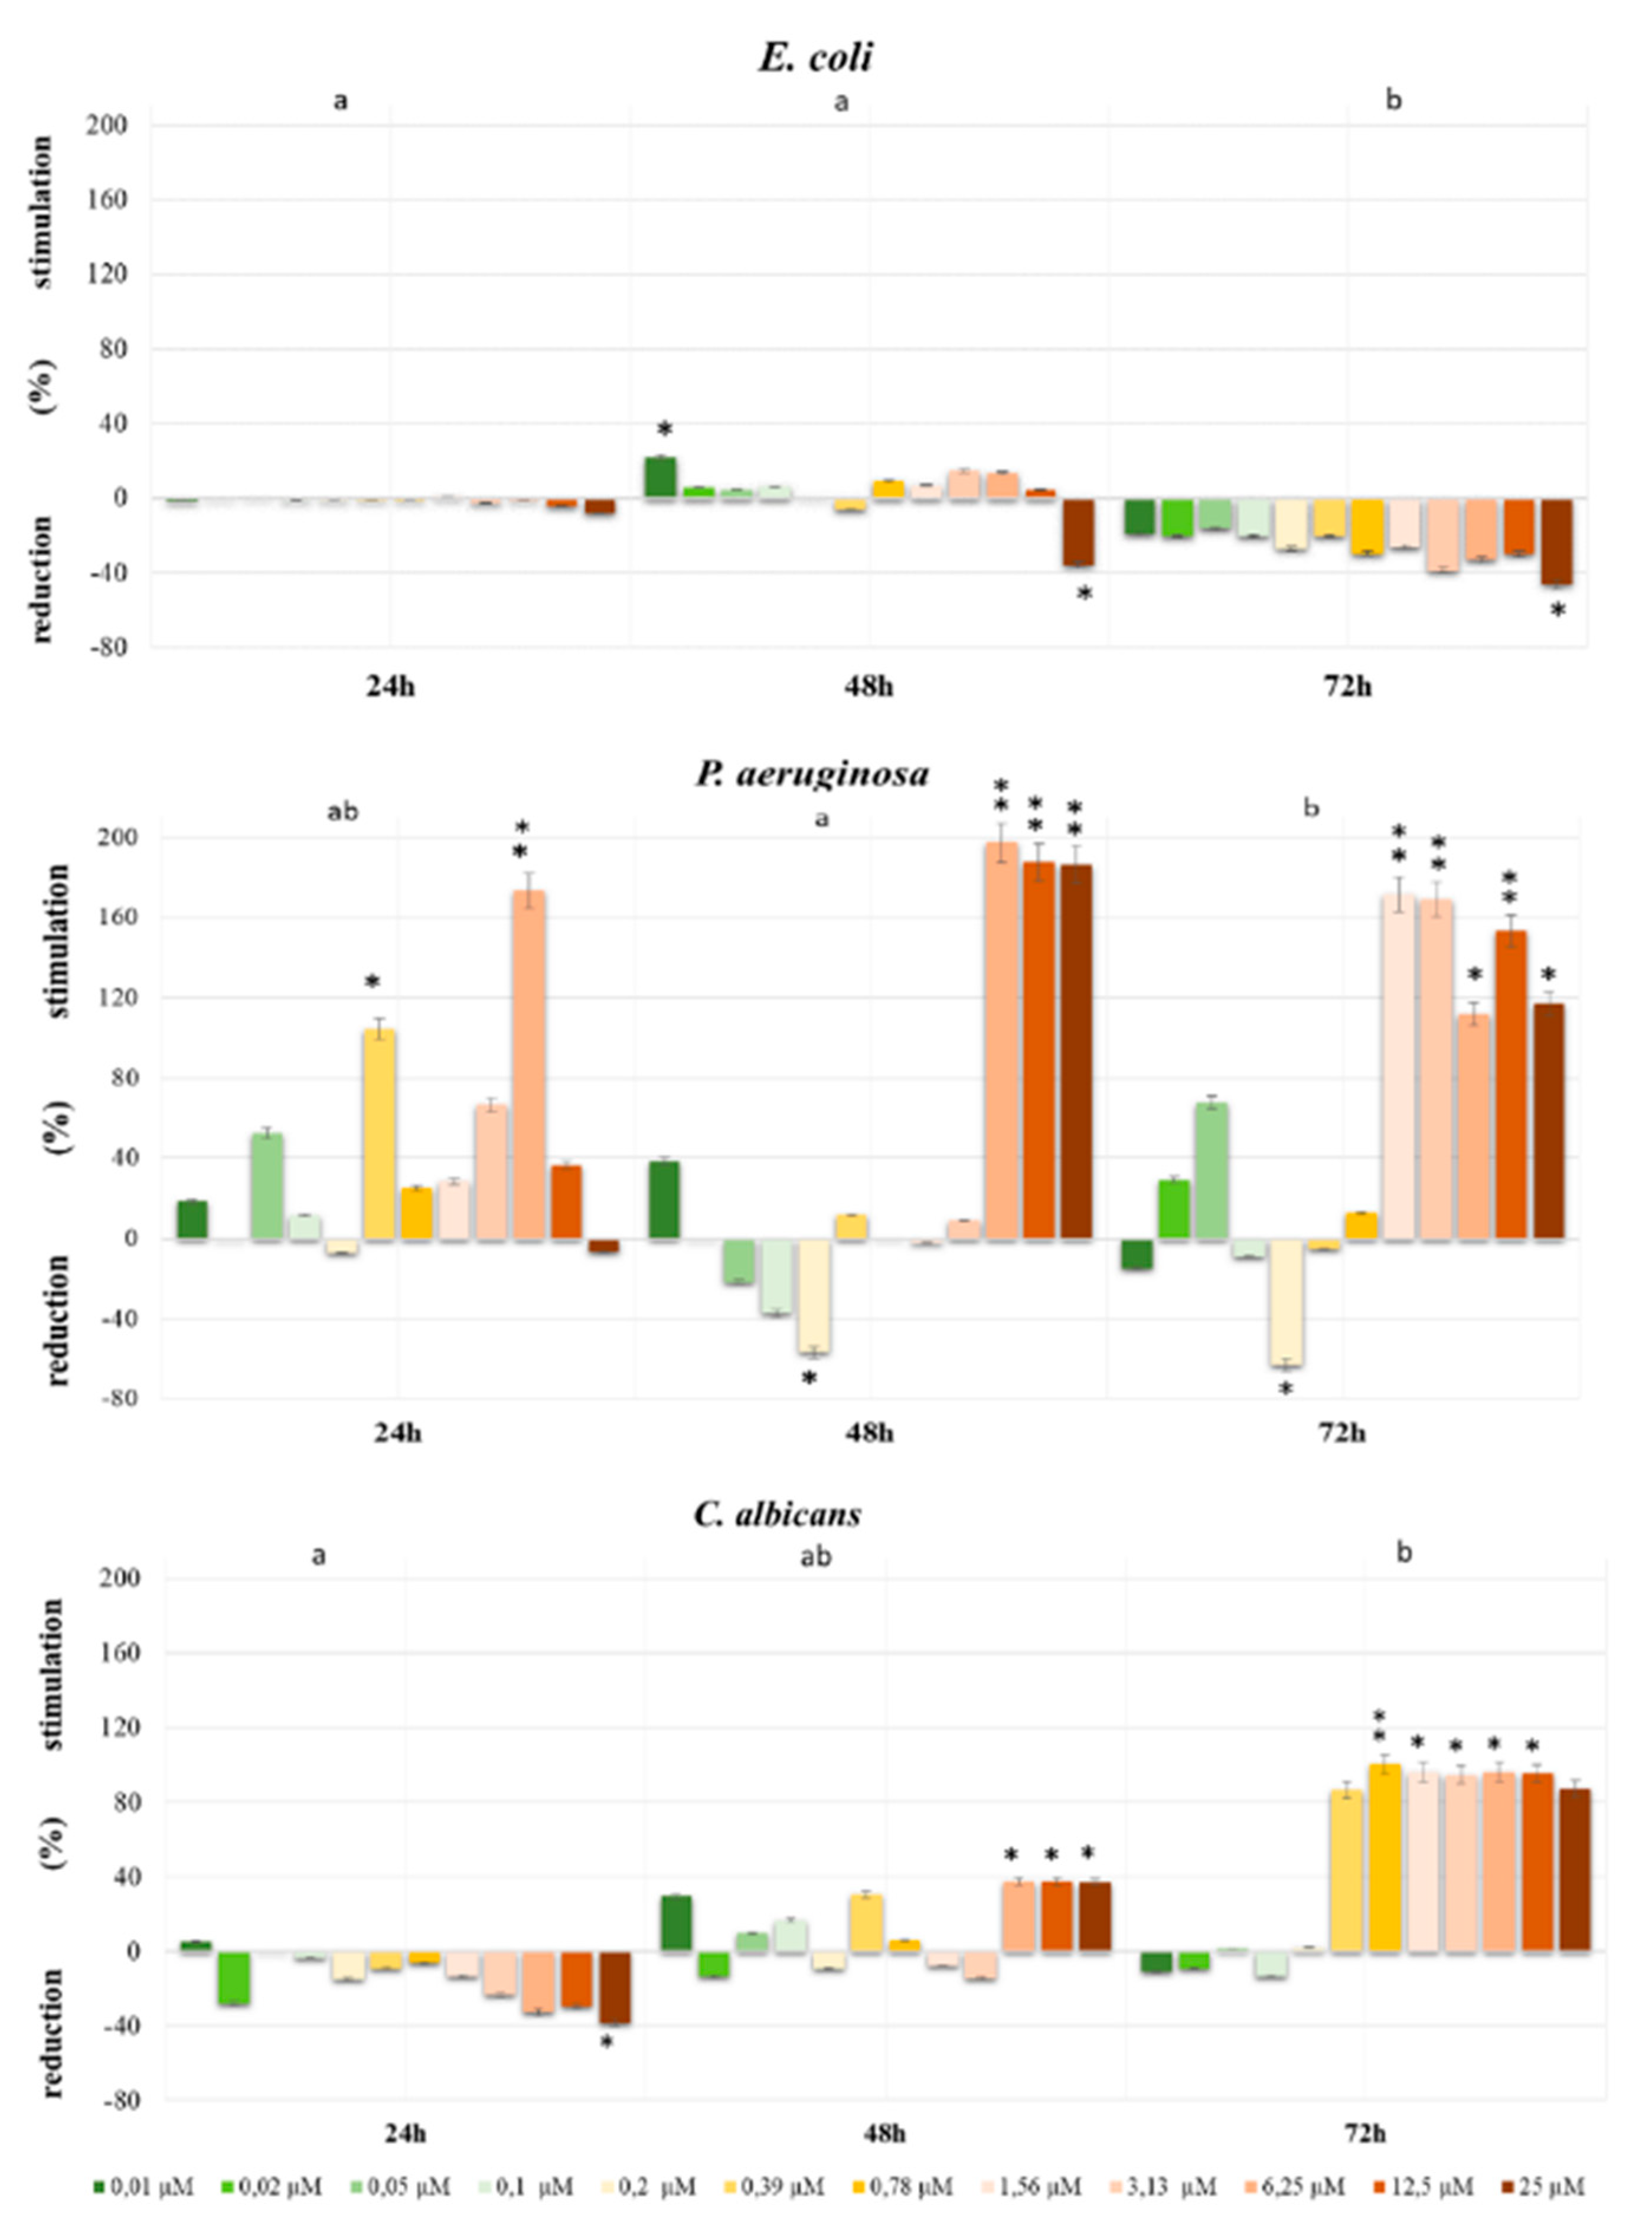
The antimicrobial activity of Bifenox and Dichlobenil was presented as a degree of the reduction or stimulation in bacterial/fungal cells viability after 24, 48 and 72 h in compared to the control cells (without tested herbicides) and expressed as a percentage (%). All experiments/assays/tests were run in triplicates.
3.1. Estimation of Tested Compounds Cytotoxicity
Cytotoxicity tests were conducted previously and the results were described in literature [
16]. On the basis of obtained results the most stimulatory concentrations were chosen for the experiments. For Bifenox the most stimulatory concentration were 0.025 µM and 0.01 µM and for Dichlobenil −0.1 µM and 0.05 µM.
3.2. Determination of Caspase 3/7 Activity
ZR-75-1 cells were seeded in 96-well white plates at a density 2 × 10⁴ cells/well. Cells were cultured for 24 h and were treated with Bifenox and Dichlobenil in a concentrations 0.025 µM and 0.01 µM of Bifenox and 0.1 µM and 0.05 µM of Dichlobenil. After intended time of incubation medium was removed and Assay reagents were added to the wells. The activity of caspases 3/7 was measured by using luminescent assay based on the substrate which contains the tetrapeptide sequence DEVD in a reagent optimized for caspase activity, luciferase activity and cell lysis. Cell lysis is followed by the caspase cleavage of the substrate and generation of the luminescent signal. Luminescence is proportional to the amount of caspase activity present in the sample. Assay is based on the thermostable luciferase activity, which generates stable, “glow-type” luminescent signal. The luminescence was measured in a microplate plate reader GloMax®-Multi Microplate Multimode Reader. All the experiments were done in triplicates.
3.3. Determination of Caspase 9 Activity
ZR-75-1 cells were seeded in 96-well white plates at a density 2 × 10⁴ cells/well. Cells were cultured for 24 h and 48 h and were treated with Bifenox and Dichlobenil in a concentrations 0.025 µM and 0.01 µM of Bifenox and 0.1 µM and 0.05 µM of Dichlobenil. After intended time of incubation medium was removed and Assay reagents were added to the wells. The activity of caspase 9 was measured by using luminescent assay based on a luminogenic caspase-9 substrate in a buffer system provided for caspase activity, luciferase activity and cell lysis. The addition of a special Caspase-Glo® 9 Reagent results in cell lysis, followed by caspase cleavage of the substrate, and generation of a “glow-type” luminescent signal. The signal generated is proportional to the amount of caspase activity present in the sample. The assay is based on thermostable luciferase, which generates the stable “glow-type” luminescent signal. The luminescence was measured in a microplate plate reader GloMax®-Multi Microplate Multimode Reader. All the experiments were done in triplicates.
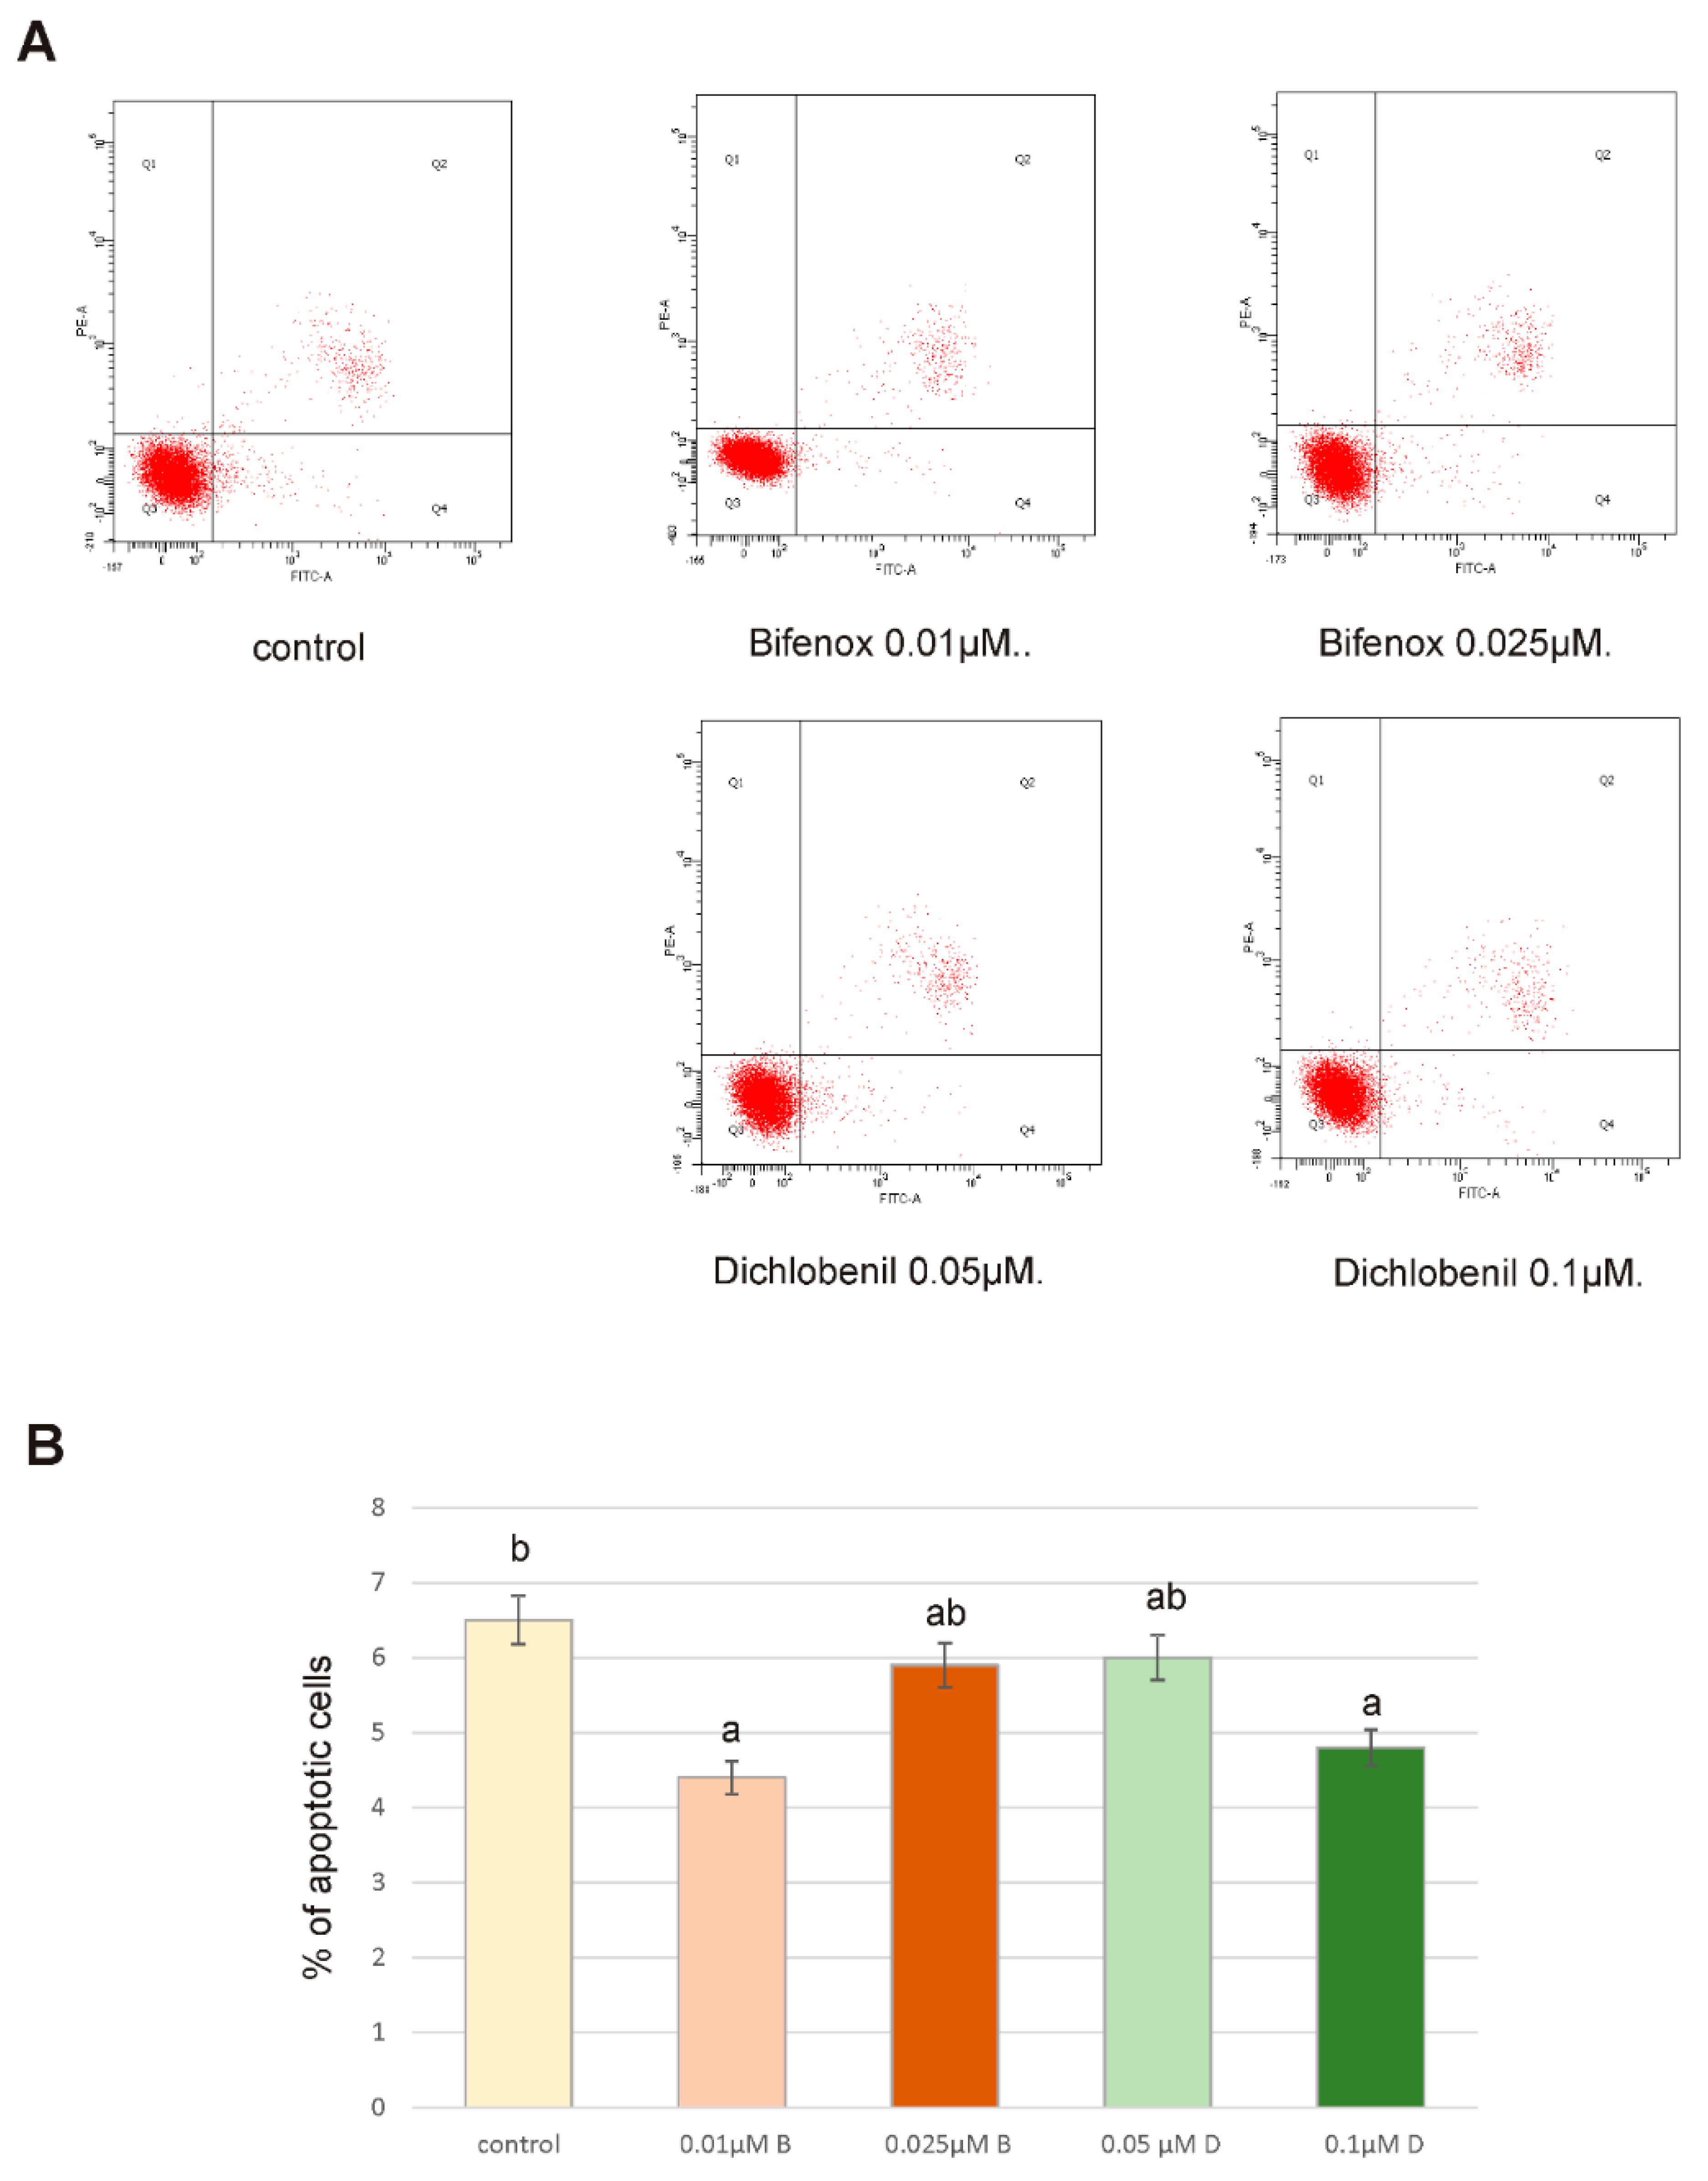
3.4. Flow Cytometry Analysis of Apoptosis
ZR-75-1 cells were exposed to 0.01 µM B, 0.025 µM B, 0.05 µM D and 0.1 µM D and incubated for 24 h. Apoptosis was evaluated by flow cytometry on FACSCanto II cytometer (Becton-Dickinson). The cells were trypsinized and resuspended in DMEM and RPMI-1640. After that time, the cells were suspended in binding buffer for staining with FITC-Annexin V and propidium iodide—PI for 15 min at room temperature in the dark following the manufacturer’s instructions (FITC Annexin V apoptosis detection Kit I). The signal obtained from cells stained with Annexin V or PI alone was used for fluorescence compensation. Data were analyzed with FACSDiva software (BD PharmingenTM, San Diego, CA, USA).
3.5. Total Protein Content in Cells
Adherent cells (2.5 × 10
5 cells/mL) in 2 mL of culture medium were incubated with or without the test compounds in tissue culture 6-well plates. After the homogenization of ZR-75-1 cells and extraction in 0.1 M NaOH at 4 °C total protein content was calculated. The concentration of proteins was determined spectrophotometrically as per Lowry. Folin phenol reagent with a protein kit calibrated with bovine serum albumin as the standard was used in the experiment. The absorbance of the extracts was measured spectrophotometrically at 750 nm [
23]. All the experiments were done in triplicates.
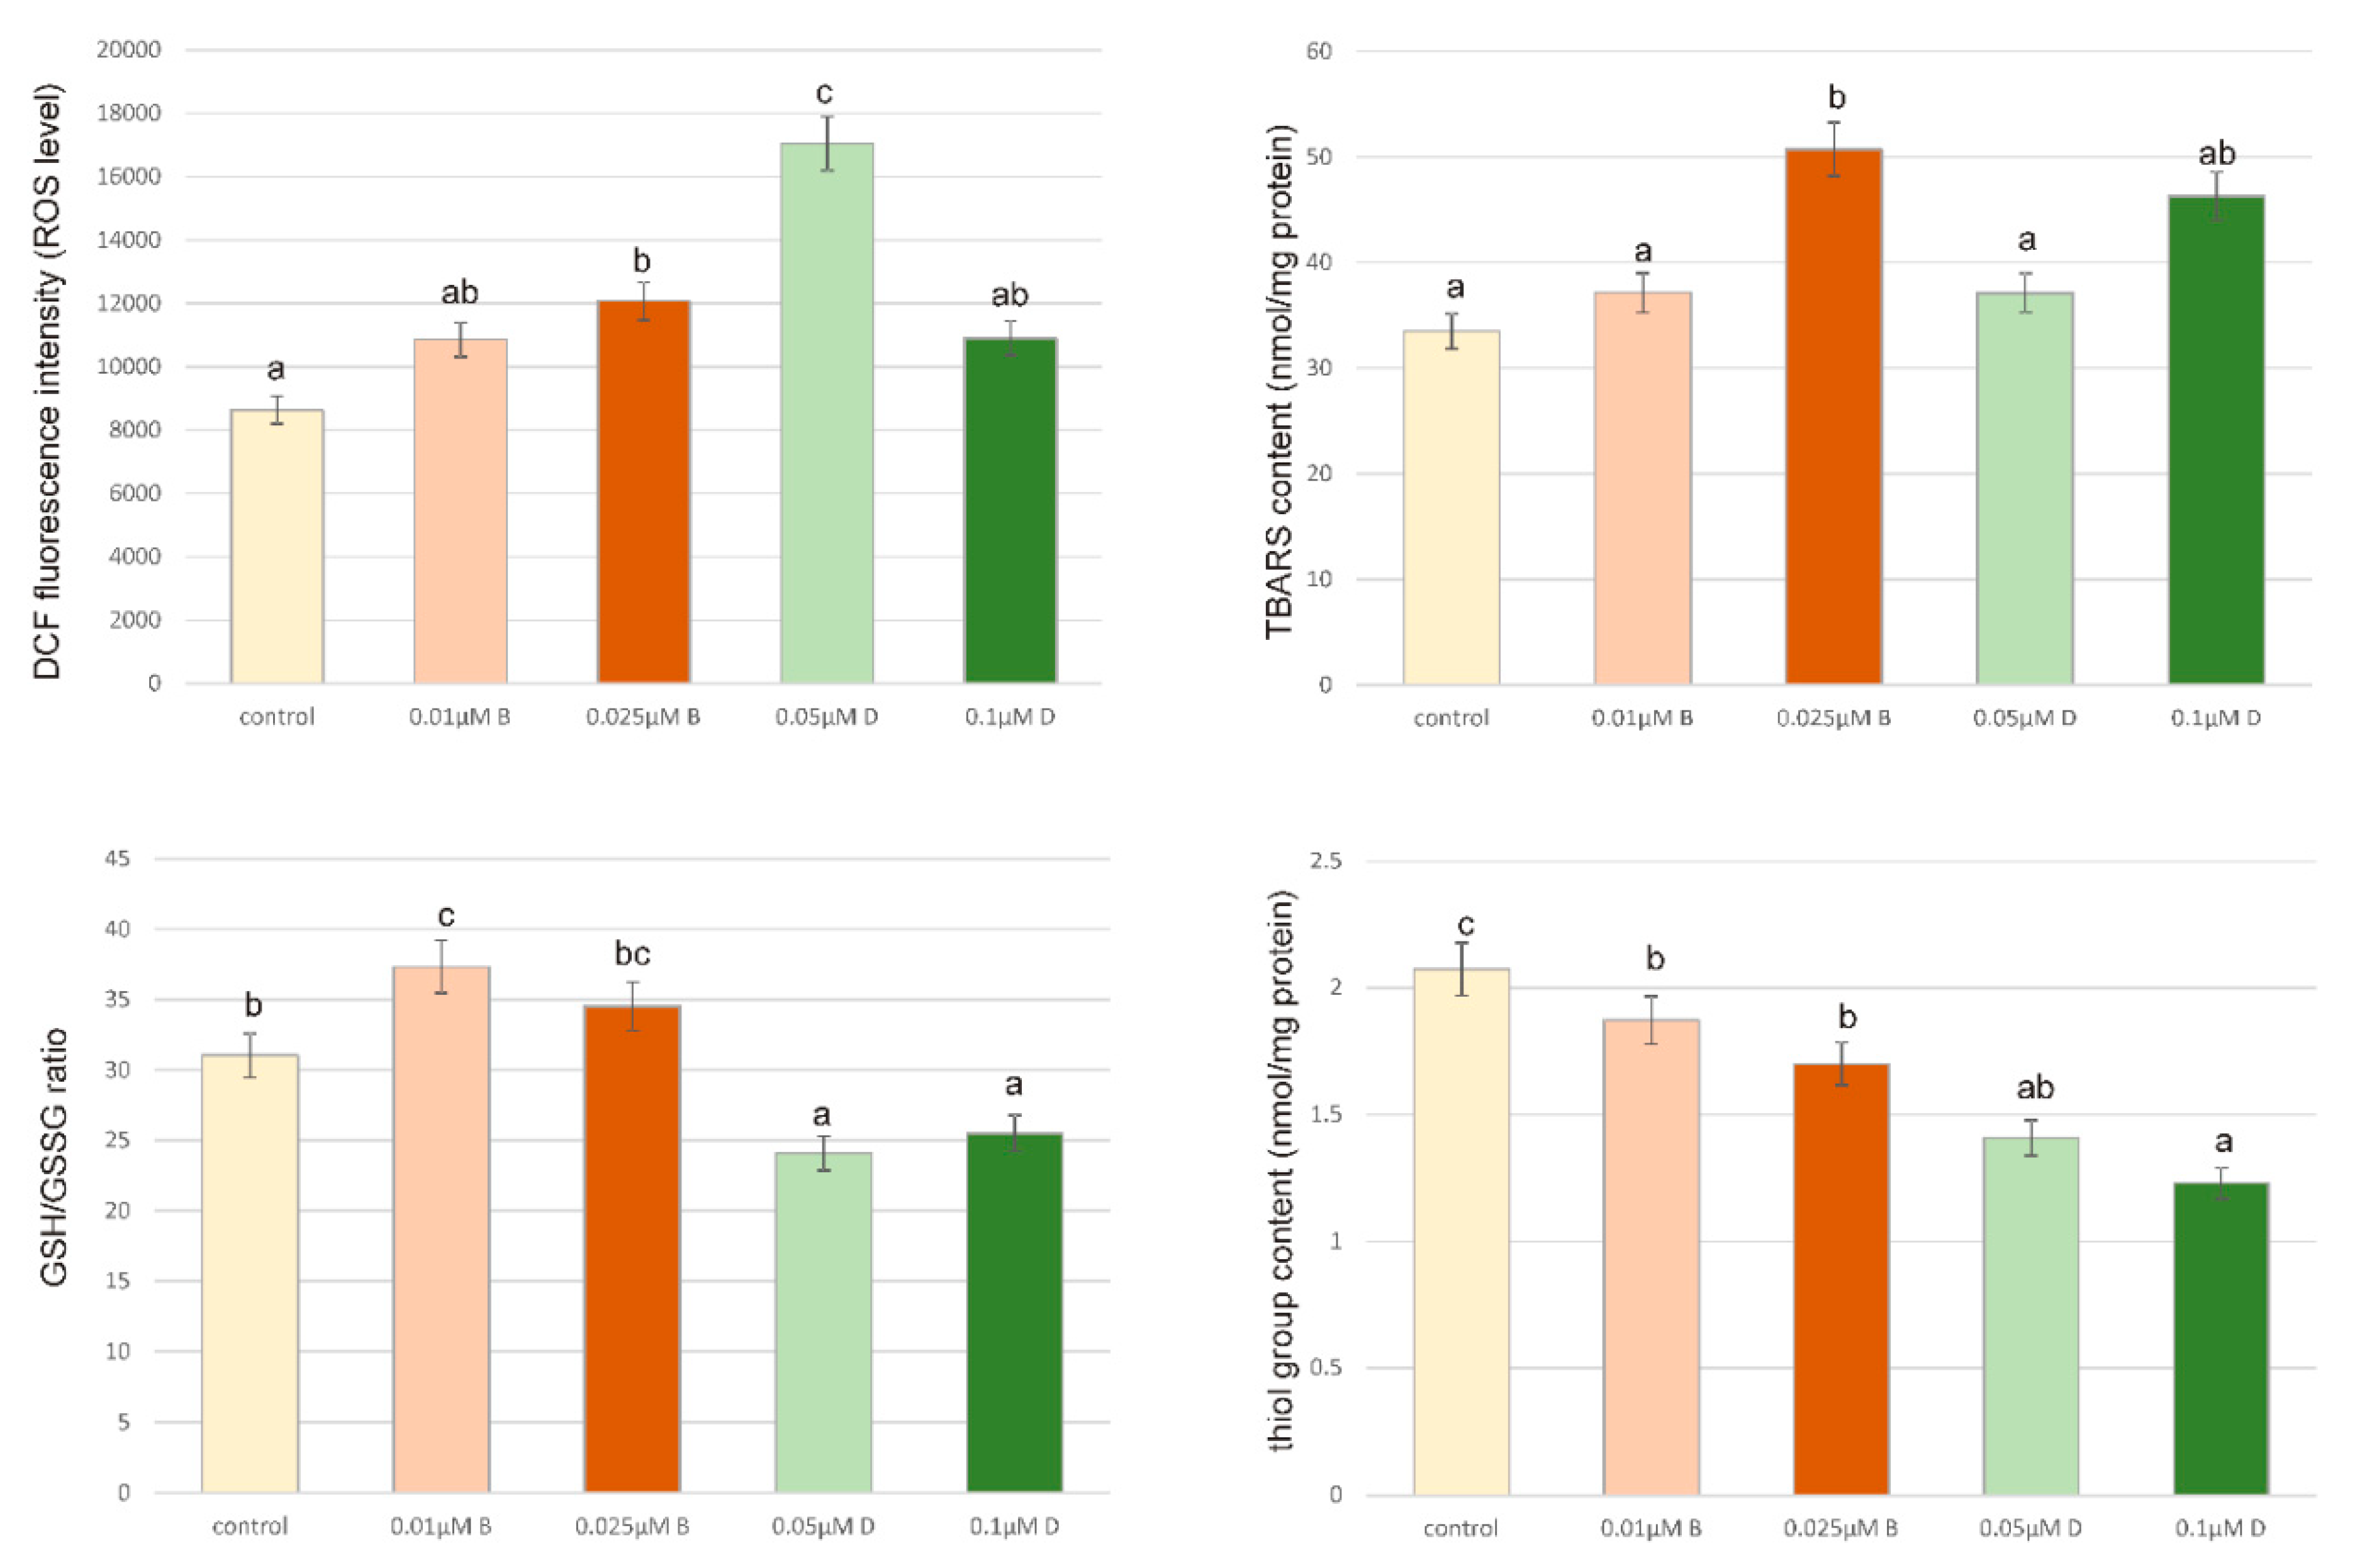
3.6. Determination of TBA Reactive Species (TBARS) Levels
The level of TBA-reactive species (TBARS) as membrane lipid peroxidation markers was measured using the method of Rice-Evans et al. as described previously [
23]. Adherent cells (2.5 × 10
5 cells/mL) in 2 mL of culture medium were incubated with or without the test compounds in tissue culture 6-well plates. The cells were washed with PBS (pH 7.4), scraped from Petri dishes and subsequently resuspended in 1 mL of PBS (between 1 and 5 × 10
6/plate). TCA (15%, 1 mL) and TBA (0.37%, 1 mL) were added to 1 mL of the cell suspension and mixed. This mixture was submerged in a boiling water bath for 10 min and the concentration of TBARS was assessed spectrophotometrically at 532 nm using the extinction coefficient of 156 mM/cm. All the experiments were done in triplicates.
3.7. Determination of SH Groups
SH-groups were measured using the method of Rice-Evans (1991) as described previously [
23]. Adherent cells (2.5 × 10
5 cells/mL) in 2 mL of culture medium were incubated with or without the test compounds in tissue culture 6-well plates. Cells were washed twice with PBS (pH = 7.4; 4 °C) and dispersed by scraping. MCF-7 cells were counted, resuspended in 1 mL of PBS and collected by centrifugation at 5000×
g for 10 min. The pellet was resuspended in 1 mL of 0.5 M phosphate buffer (pH 7.8), containing 0.1% SDS. Subsequently, 25 μL Ellman’s reagent (5 mM) was added and the thiol groups were measured spectrophotometrically at 412 nm using the molar extinction coefficient of 13.6 mM-1 cm-1. All the experiments were done in triplicates.
3.8. Determination of GSH/GSSG
Total glutathione and GSH/GSSG ratio were each assayed in triplicate via GSH/GSSG-Glo™ kit (Promega Corporation, Madison, WI, USA) following manufacturer’s instructions. Cells were seeded in white bottom 96-well plates at 104 cells/well (Sarstedt), allowed to attach, and treated with pesticides. Prior to the assay growth media were removed and cells washed with PBS. Assay is based on a luminescence measurement and detect and quantify total glutathione (GSH + GSSG), GSSG and GSH/GSSG ratios in cultured cells. Stable luminescent signals are correlated with either the GSH or GSSG concentration of a sample. In this method GSH-dependent conversion of a GSH probe, Luciferin-NT, to luciferin by a glutathione S-transferase enzyme is coupled to a firefly luciferase reaction. Light from luciferase depends on the amount of luciferin formed, which in turn depends on the amount of GSH present. Thus, the luminescent signal is proportional to the amount of GSH. GSH/GSSG ratios are calculated directly from luminescence measurements. Luminescence was read using the GloMax®-Multi Detection System. All the experiments were done in triplicates.
3.9. Intracellular ROS Detection
The level of intracellular reactive oxygen species (ROS) was determined using dichlorodihydrofluorescein diacetate (DCFH-DA), (Sigma, St. Louis, MO, USA) [
24]. After diffusion through the cell membrane, DCFH-DA is deacetylated by cellular esterases to a non-fluorescent compound, which is later oxidized by intracellular ROS into a fluorescent 2′, 7′–dichlorofluorescein (DCF). The ZR-75-1 cells (2 × 10
4) were seeded in 200 µL of growth medium in black 96-well plates. After 24 h, the medium was removed, the cells were stained with 10 μM of DCFH-DA in PBS at 37 °C, 5% CO
2 incubator, for 45 min. Next, the dye was removed and replaced with pesticides in 0.025 µM and 0.01 µM of Bifenox and 0.1 µM and 0.05 µM of Dichlobenil concentrations and incubated for 24 h. Then, the DCF fluorescence intensity was measured by using the GloMax
®-Multi Detection System at the excitation wavelength of 485 nm and the emission wavelength of 535 nm. The intracellular ROS generation in pesticides-stimulated ZR-75-1 cells was shown as the intensity of fluorescence of the DCF. All the experiments were done in triplicates.
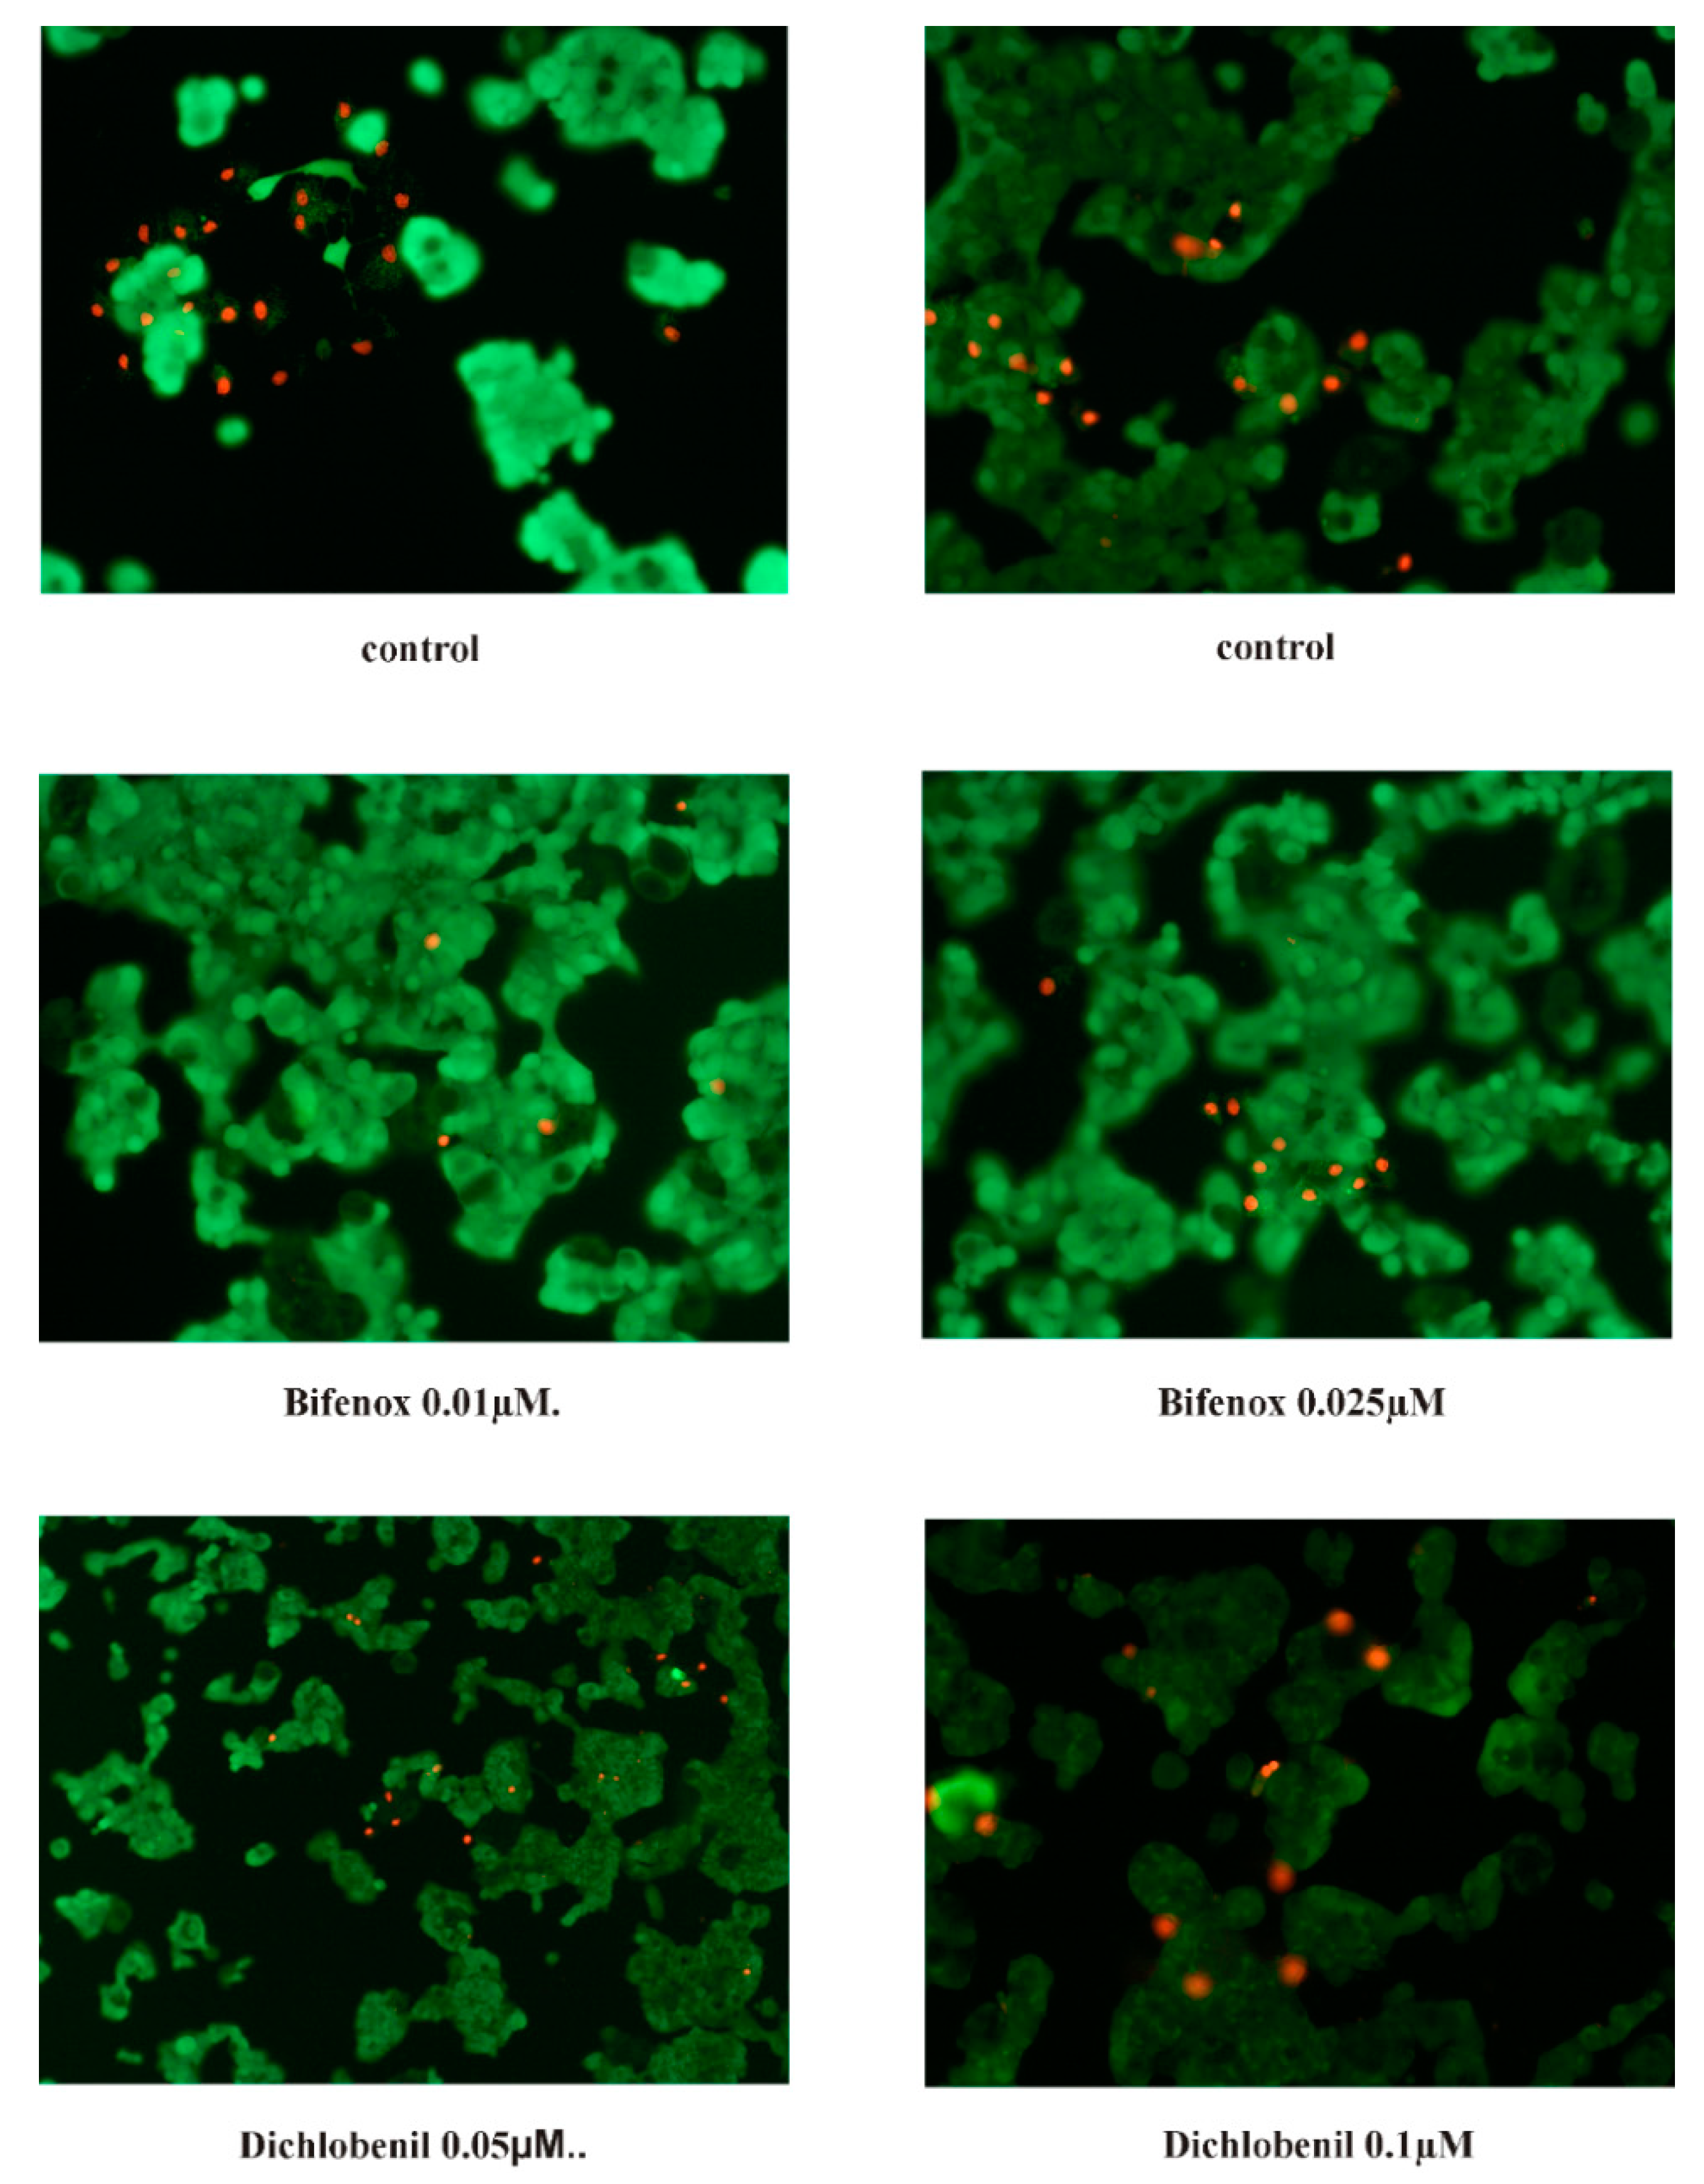
3.10. Fluorescent Microscopy Assay
For apoptotic and necrotic cells nuclear morphology evaluation fluorescent dyes, such as propidium iodide and calcein-AM were used. The ZR-75-1 cells were seeded on cell imaging dishes with coverglass bottom with 0.025 µM and 0.01 µM concentrations of Bifenox and 0.1 µM and 0.05 µM concentrations of Dichlobenil and without tested compound as a control, for 24 h. After incubation the cells were washed twice with PBS and then stained with dyes solution in the dark in 37 °C, for 15 min. After incubation, staining mixture was removed and the cells were washed with PBS and analyzed by using fluorescent microscope (200× magnification). Calcein-AM stains only viable cells and PI can only pass through disordered areas of dead cell membrane. The cells were analyzed and photographed via using Olympus IX83 fluorescent microscope with SC180 camera with Cell Sens Dimension 1.17 program. The following criteria were used: living cells - have regularly distributed green chromatin nucleus and are stained with green color and dead cells, probably apoptotic cells are characterized by red nuclei with chromatin condensation or fragmentation, while necrotic cells showed red-stained cell nuclei.
3.11. Statistical Analysis
All data are given as mean values ±SEM (standard error of means). Differences between treatments and untreated control cells were analyzed by one-way ANOVA, followed by Dunnett’s procedure for multiple comparisons. Significant effects are represented by p ≤ 0.05 (*), p ≤ 0.01 (**), p ≤ 0.001 (***). For parametric data one-way analysis of variance (ANOVA) followed Tuckey test was applied. Results were expressed as mean ± standard deviation (SD) of mean for parametric data. Significance was considered when p ≤ 0.05. The relationships among different variables determined by PCA (Principal Components Analysis) which is based on Pearson’s correlation and was presents as biplot graph. The analysis allows to visualize the variation present in a dataset with many variables. Statistica 13.0 (StatSoft, Kraków, Poland) was used.
5. Discussion
Pesticides are widely used in many branches of agriculture to control weeds, insects and plant pathogens and to stimulate plant growth. Crop plants are exposed to pesticides, which can easily get to the human digestive tract through daily meals. Low but long-term exposure to pesticides can cause dangerous effects on the skin, endocrine system, nervous system and many other systems of the human body. The mechanism of the action of pesticides is usually based on the production of free radicals that can cause lipid peroxidation, DNA damage, cell death and possible carcinogenic effects [
25].
Although the discussion about the activity of pesticides as carcinogenic pollutants is relevant and according to the literature data majority of utilized pesticides influence also human gut microbiome, very little attention has been paid to possible interactions with autochthonous human microbiota, especially that with pathogenic potential [
26,
27].
E. coli is very popular bacterium model utilized for studying bacterial response mechanisms to selected xenobiotic, e.g., environmental contaminants exposure, therefore, we also estimated the influence of both selected herbicides on it. Our results indicate decreases in
E. coli cells viability under the influence of both Bifenox and Dichlobenil, which is consistent with literature data presenting that selected herbicides cause an arrest in
E. coli divisions right after exposure [
28]. On the other hand,
P. aeruginosa is also a gram-negative bacteria, which causes a variety of diseases, from mild cutaneous infections to complicated pulmonary complications [
29]. Lima IS et al. indicated that continuous exposure to low doses of selected herbicides significantly stimulated
P. aeruginosa growth, which is also in line with our results. We observed statistically significant increases in
P. aeruginosa cells proliferation, especially under the influence of Dichlobenil. Observed increases in the intensity of bacterial cells proliferation can be also explained by the fact that herbicides may serve as a source of carbon, which could be processed in both aerobic and anaerobic conditions and, especially
Pseudomonas spp., may produce glycine with the use of pesticides, which subsequently enhance their growth [
30,
31,
32]. In case of
C. albicans initially we observed decreases in cell growth under the influence of both studied compounds, which is in agreement with recent findings indicating that selected acetohydroxyacid synthase (AHAS) inhibitors developed as commercial herbicides may represent a new class of antifungal drug candidates simultaneously exhibiting low toxicity to human cells [
33]. However, it should be also mentioned that elsewhere, Wachowska U. claimed that some pesticides may stimulate the growth of
C. albicans, what we observed after 72 h of treatment [
34].
An excessive level of oxidative stress causes cancer cell adaptation, an increase in cancer cells proliferation and genetic instability, which leads to strong resistance to anticancer therapy [
35]. Although the research has tended to focus on selected pesticides chemical analysis rather less attention has been paid to their mechanisms of action, especially on the cellular level. Therefore, we decided to study Bifenox and Dichlobenil influence on apoptosis and oxidative stress parameters in estrogen-dependent breast cancer cells. The main point of this paper was to reveal if two selected herbicides commonly used in Poland in agriculture area may exhibit stimulatory effect on oxidative stress parameters and subsequently influence cancer cell viability simultaneously inhibiting apoptosis. The results of cytotoxicity studies of two selected herbicides were obtained previously and are presented in literature [
16]. On the basis of above mentioned results we chose the most stimulatory concentrations for further analysis. As an experimental model we chose ZR-75-1 breast cancer cell line which is an estrogen-dependent cell line and may be used for endocrine-based study. The concentrations which were chosen for the experiments are environmentally relevant, because compounds from the analyzed group are often found in groundwater system in such concentration range. Rich et al. claimed also that similar concentration range has stimulatory effect on different, estrogen-dependent breast cancer cell lines, which in consistence with our data [
36]. Most studies have emphasized on an indisputable connection between oxidative stress and cancer initiation, promotion and progression [
37]. Elevated levels of ROS is an extremely important factor in the pathogenesis of breast cancer because it results in the emergence of genetic and epigenetic modification, which then cause uncontrolled cell proliferation [
38,
39]. Tumor cells usually show elevated levels of ROS compared to normal healthy cells. This is due to the fact that an increased oxidative stress caused by ROS can subsequently resulted in a decrease in the level of antioxidant defense in the body. It is the main line of defense of the body against angiogenesis and cancer metastases, which are the main stages in the development and progression of cancer [
40,
41]. This is consistent with results obtained in our experiments. We observed an increase in ROS generation in ZR-75-1 cells under the influence of both Bifenox and Dichlobenil as compared to control, untreated cells. In case of 0.1 µM concentration of Dichlobenil a decrease in ROS content was observed as compared to 0.05 µM concentration of Dichlobenil, however still we observed an increase in analyzed parameter comparing to control untreated cells. Such increases usually coexist with increases in cancer cell proliferation, which was also indicated in our study. Obtained results also indicate increases in TBARS content, especially in higher concentrations of both analyzed compounds, which draws primarily on the work of Gonenc et al., 2005, who indicated that the content of lipid peroxidation products increases in various types of cancer, including breast cancer [
42]. We also noticed that SH group content in breast cancer cells stimulated with pesticides correlated with TBARS level. Observed decreases in analyzed parameter are in accordance with literature data indicating herbicides pro-oxidative properties against cell membrane proteins [
43,
44]. It is also in accordance with GSH/GSSG ratio decreases observed especially in case of Dichlobenil in both tested concentrations. Bifenox especially in 0.01 µM concentration caused statistically significant increase in GSH/GSSG ratio, which could be confusing, but it may also be related to the level of SH groups, which is higher under the influence of Bifenox than Dichlobenil. Literature data points out that GSH decreases in breast cancer are being noticed and acts as a biomarker of oxidative stress [
45].
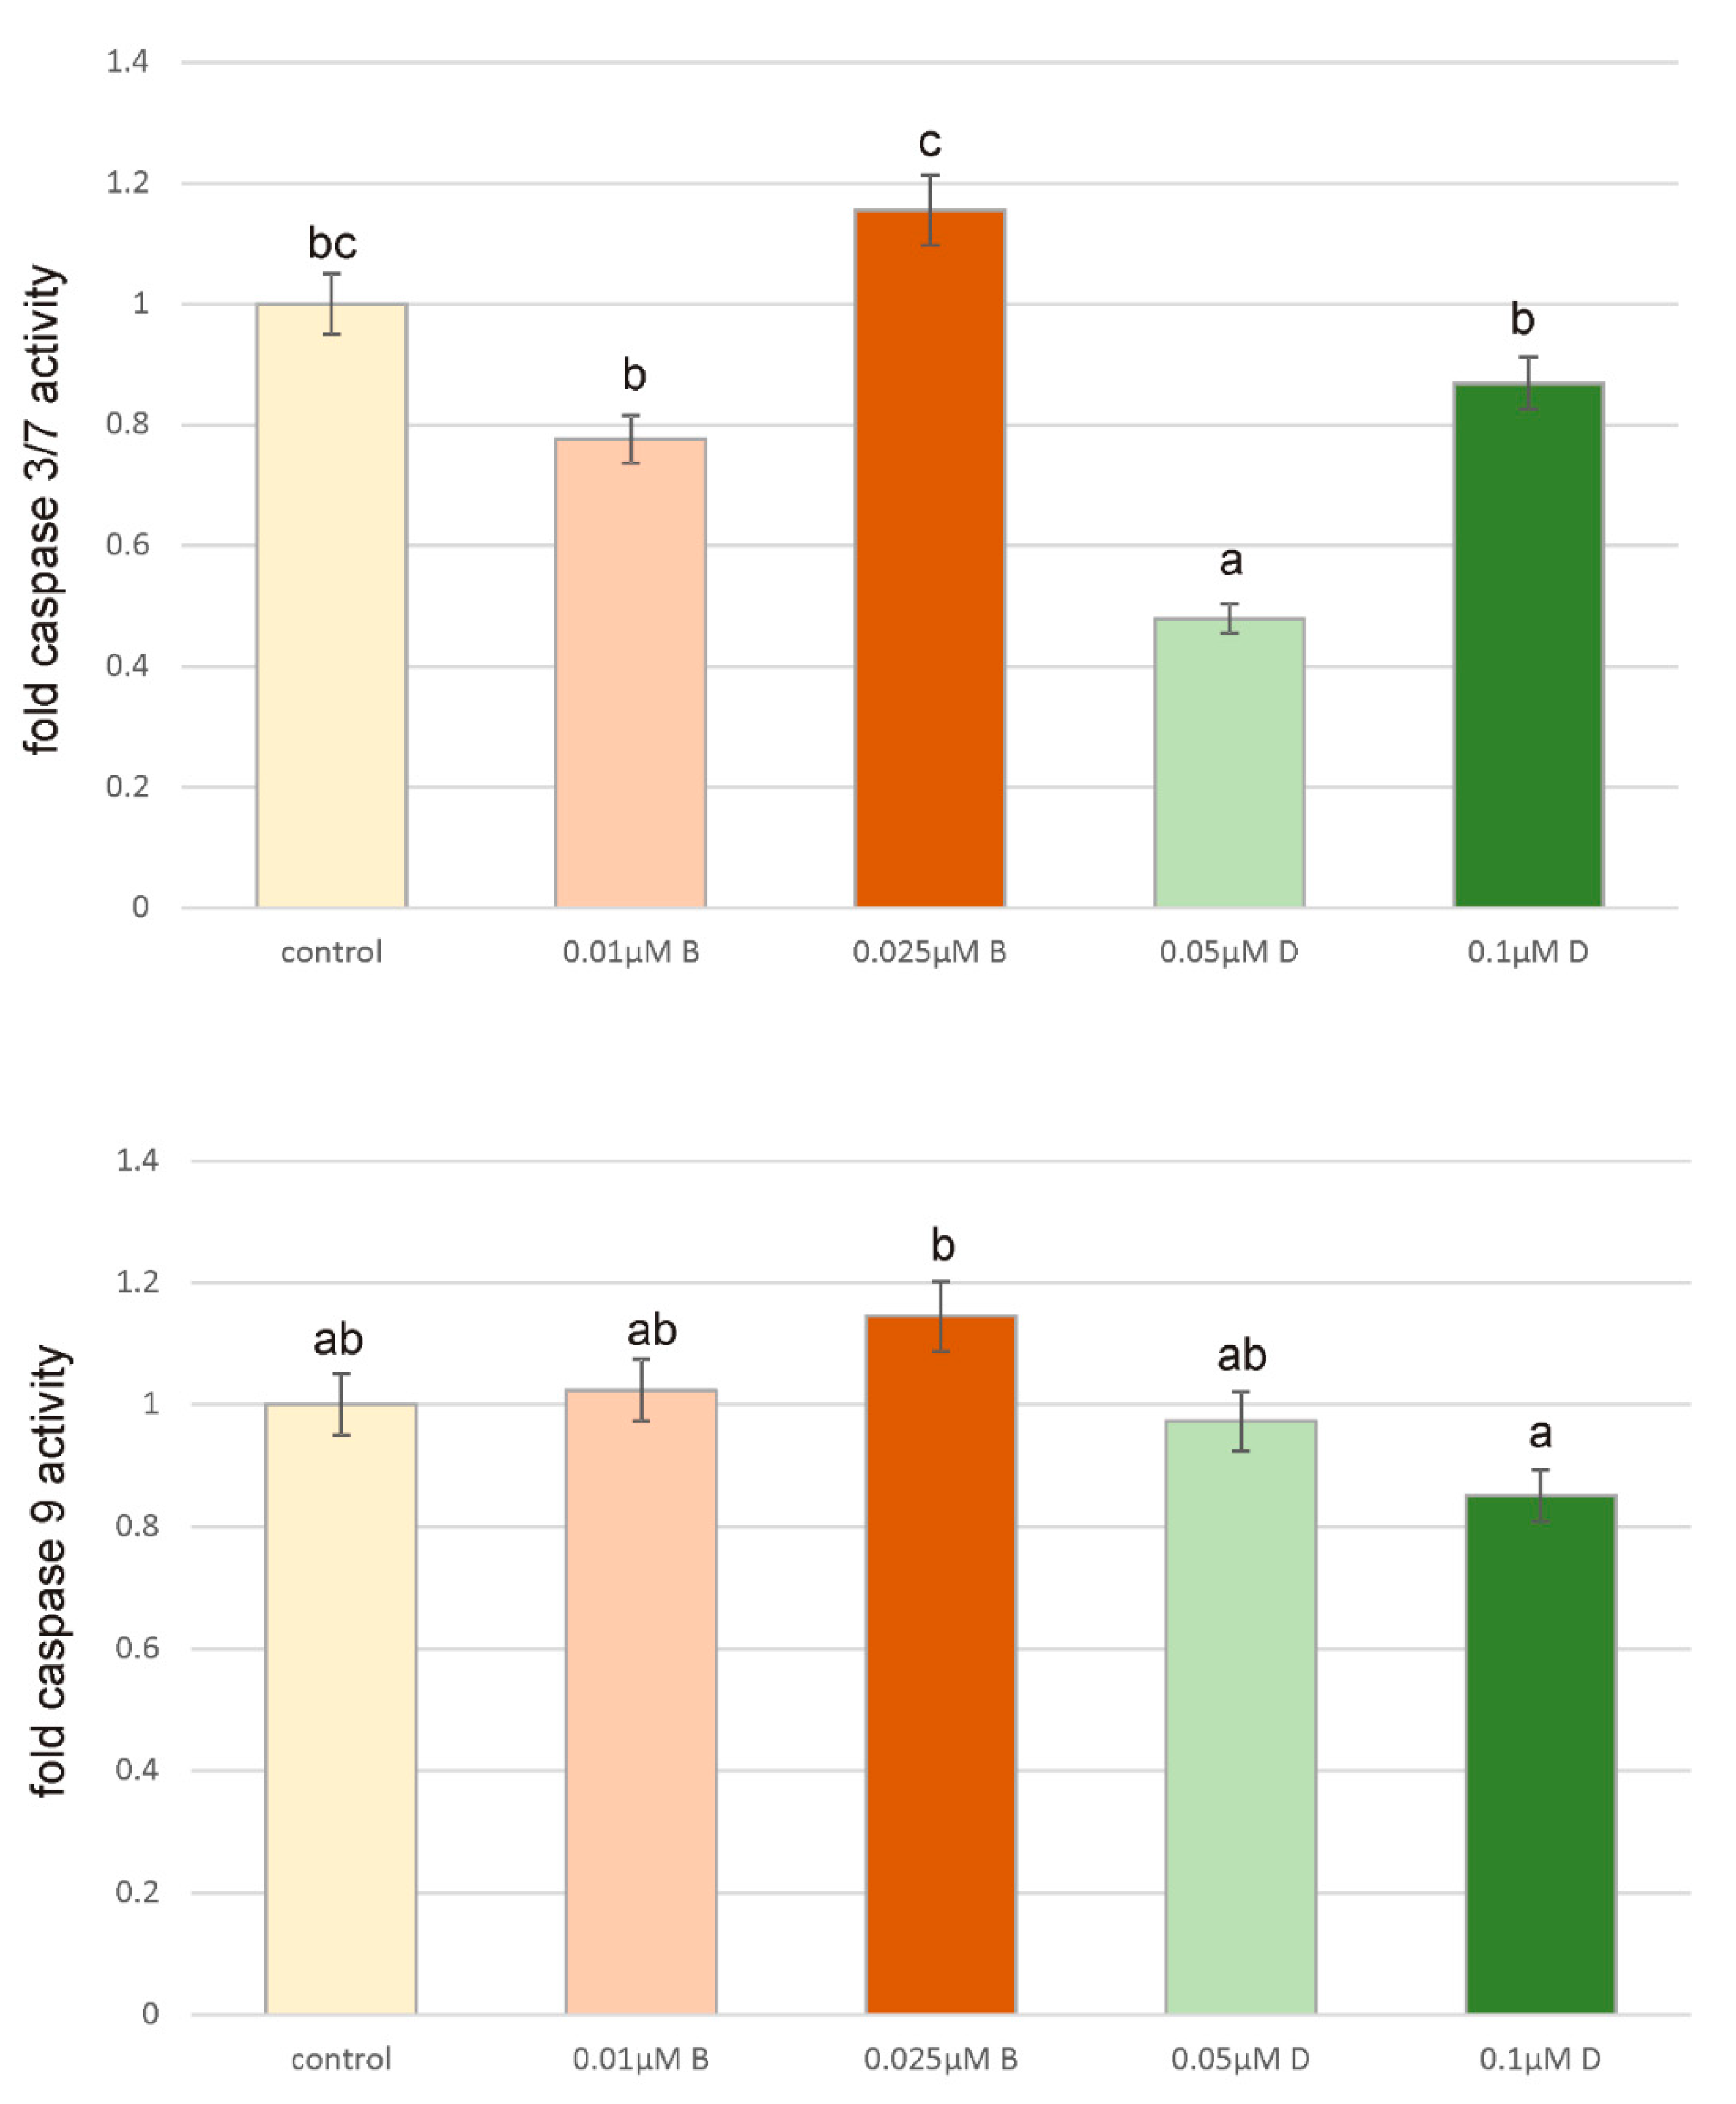
The presented results allowed us to conclude that oxidative damage of proteins, high level of lipid peroxidation and increase in ROS content may cause changes in signaling pathways and cause the aforementioned increase in the level of ZR-75-1 cancer cell proliferation and their resistance to the process of apoptosis. However, we did not observe any significant changes in caspases activity and therefore apoptosis triggering. Caspase 3/7 are effector caspases in the apoptosis pathway, which can be activated by caspase 9, which subsequently triggers apoptosis through anti-apoptotic proteins proteolysis. Caspase 9 is activated by the binding of cytochrome c, which is released after the mitochondrial damage caused by oxidative stress or other factors [
46]. Since tested compounds did not cause any significant effect on caspases activity, we did not observe any apoptotic cells by using microscopy fluorescent assay and results obtained from flow cytometry analysis also confirm lack of apoptotic cells it is possible that under the influence of analyzed herbicides ZR-75-1 cells acquire resistance to apoptosis. Acquired apoptosis resistance is a hallmark of most human cancers and among environmental chemicals that contribute to this situation pesticides are mentioned very often [
47].
PCA analysis confirms positive correlation of Dichlobenil with caspase 3/7 activity. Obtained results indicate for statistically significant decrease in caspase 3/7 activity under the influence of Dichlobenil, which was presented in
Figure 5. Both analyzed compounds are in correlation with SH group content and TBARS, which was also demonstrated by using PCA analysis. An observed changes in TBARS content accompanied SH group content, which relate with increased level of oxidative stress and this phenomenon intensifies cancer cell proliferation. It is in accordance with literature data indicating that oxidative stress plays an important role in the development of breast cancer [
41]. Results presented for the activity of caspase 9 and GSH/GSSG ratio under the influence of Bifenox are connected and represented by one component.
Although a variety of cell lines and bacterial strains are being used for the estimation of toxicity of selected environmental pollutants, one of the most common and most simple approach to assess cytotoxicity is the measurement of bioluminescence inhibition of naturally bioluminescent bacteria—
Aliivibrio fischeri [
48]. Obtained results indicated that studied herbicides were not toxic to this bacterial model strain in concentrations lower than 50 µM. Despite the lack of toxicity of the analyzed substances on the model strain (
Aliivibrio fischeri), they were found to be potentially dangerous for humans. This is due to the fact that the lower, tested concentrations of herbicides caused significant changes both in the tested strains (bacteria and fungi) and in human cells.

 ,
, 


