Functional Status and Body Mass Index in Postmenopausal Women with Fibromyalgia: A Case–control Study

 and
and
Abstract
:1. Introduction
2. Materials and Methods
2.1. Study Design and Study Population
2.2. Anthropometric Measures
2.3. Functional Status
2.4. Statistical Analysis
2.5. Sample Size Calculation
2.6. Ethical Approval
3. Results
3.1. Characteristics of the Study Participants
3.2. Functional Status and Nutritional Status
3.3. Correlations between Functional Status and BMI
4. Discussion
5. Conclusions
Author Contributions
Funding
Conflicts of Interest
References
- Bellato, E.; Marini, E.; Castoldi, F.; Barbasetti, N.; Mattei, L.; Bonasia, D.E.; Blonna, D. Fibromyalgia Syndrome: Etiology, Pathogenesis, Diagnosis, and Treatment. Pain Res. Treat. 2012, 2012, 426130. [Google Scholar] [CrossRef] [PubMed]
- Grodman, I.; Buskila, D.; Arnson, Y.; Altaman, A.; Amital, D.; Amital, H. Understanding fibromyalgia and its resultant disability. Isr. Med. Assoc. J. 2011, 13, 769. [Google Scholar] [PubMed]
- Mas, A.J.; Carmona, L.; Valverde, M.; Ribas, B. Prevalence and impact of fibromyalgia on function and quality of life in individuals from the general population: Results from a nationwide study in Spain. Clin. Exp. Rheumatol. 2008, 26, 519–526. [Google Scholar] [PubMed]
- Bennett, R.M.; Jones, J.; Turk, D.C.; Russell, I.J.; Matallana, L. An internet survey of 2596 people with fibromyalgia. BMC Musculoskelet. Disord. 2007, 8, 27. [Google Scholar]
- Rus, A.; Molina, F.; Gassó, M.; Camacho, M.V.; Peinado, M.Á.; Moral, M.L.D. Nitric Oxide, Inflammation, Lipid Profile, and Cortisol in Normal- and Overweight Women with Fibromyalgia. Biol. Res. Nurs. 2016, 18, 138–146. [Google Scholar] [CrossRef] [PubMed]
- Mork, P.J.; Vasseljen, O.; Nilsen, T.I.L. Association between physical exercise, body mass index, and risk of fibromyalgia: Longitudinal data from the Norwegian Nord-Trøndelag Health Study. Arthritis Rheum. 2010, 62, 611–617. [Google Scholar] [CrossRef]
- Gota, C.E.; Kaouk, S.; Wilke, W.S. Fibromyalgia and Obesity: The Association Between Body Mass Index and Disability, Depression, History of Abuse, Medications, and Comorbidities. J. Clin. Rheumatol. 2015, 21, 289–295. [Google Scholar] [CrossRef]
- Kibar, S.; Yıldız, H.E.; Ay, S.; Evcik, D.; Ergin, E.S. New Approach in Fibromyalgia Exercise Program: A Preliminary Study Regarding the Effectiveness of Balance Training. Arch. Phys. Med. Rehabil. 2015, 96, 1576–1582. [Google Scholar] [CrossRef]
- Panton, L.B.; Kingsley, J.D.; Toole, T.; Cress, M.E.; Abboud, G.; Sirithienthad, P.; Mathis, R.; McMillan, V. A Comparison of Physical Functional Performance and Strength in Women with Fibromyalgia, Age- and Weight-Matched Controls, and Older Women Who Are Healthy. Phys. Ther. 2006, 86, 1479–1488. [Google Scholar] [CrossRef]
- Jones, K.D.; Horak, F.B.; Winters-Stone, K.; Irvine, J.M.; Bennett, R.M.; Winters, K.S.; Morea, J.M. Fibromyalgia is associated with impaired balance and falls. JCR J. Clin. Rheumatol. 2009, 15, 16–21. [Google Scholar] [CrossRef]
- Horak, F.B. Postural orientation and equilibrium: What do we need to know about neural control of balance to prevent falls? Age Ageing 2006, 35, ii7–ii11. [Google Scholar] [CrossRef] [PubMed]
- Battaglia, G.; Bellafiore, M.; Caramazza, G.; Paoli, A.; Bianco, A.; Palma, A. Changes in spinal range of motion after a flexibility training program in elderly women. Clin. Interv. Aging 2014, 9, 653–660. [Google Scholar] [CrossRef] [PubMed]
- Cardoso, F.D.S.; Curtolo, M.; Natour, J.; Lombardi Júnior, I. Assessment of quality of life, muscle strength and functional capacity in women with fibromyalgia. Rev. Bras. Reumatol. 2011, 51, 344–350. [Google Scholar] [CrossRef]
- Wolfe, F.; Clauw, D.J.; Fitzcharles, M.-A.; Goldenberg, D.L.; Häuser, W.; Katz, R.L.; Mease, P.J.; Russell, A.S.; Russell, I.J.; Walitt, B. 2016 Revisions to the 2010/2011 fibromyalgia diagnostic criteria. Semin. Arthritis Rheum. 2016, 46, 319–329. [Google Scholar] [CrossRef] [PubMed]
- Von, E.; Altman, D.G.; Egger, M.; Pocock, S.J.; Gøtzsche, P.C.; Vandenbroucke, J.P. The strengthening the reporting of observational studies in epidemiology (STROBE) statement: Guidelines for reporting observational studies. Int. J. Surg. 2014, 12, 1495–1499. [Google Scholar] [CrossRef]
- Padgett, P.K.; Jacobs, J.V.; Kasser, S.L. Is the BESTest at Its Best? A Suggested Brief Version Based on Interrater Reliability, Validity, Internal Consistency, and Theoretical Construct. Phys. Ther. 2012, 92, 1197–1207. [Google Scholar] [CrossRef]
- Di Carlo, S.; Bravini, E.; Vercelli, S.; Massazza, G.; Ferriero, G. The Mini-BESTest: A review of psychometric properties. Int. J. Rehabil. Res. 2016, 39, 97–105. [Google Scholar] [CrossRef]
- Berg, K. Measuring balance in the elderly: Preliminary development of an instrument. Physiother. Can. 1989, 41, 304–311. [Google Scholar] [CrossRef]
- Birmingham, T.B. Test-retest reliability of lower extremity functional instability measures. Clin. J. Sport Med. 2000, 10, 264–268. [Google Scholar] [CrossRef]
- Shumway-Cook, A.; Brauer, S.; Woollacott, M. Predicting the probability for falls in community-dwelling older adults using the Timed Up & Go Test. Phys. Ther. 2000, 80, 896–903. [Google Scholar]
- Swanenburg, J.; Hegemann, S.C.A.; Zurbrugg, A.; Palla, A.; De Bruin, E.D. Reliability and validity of the extended timed-get-up-and-go test in patients with bilateral vestibular loss. Neurorehabilitation 2014, 34, 799–807. [Google Scholar] [PubMed]
- Voshaar, M.A.H.O.; Klooster, P.M.T.; Taal, E.; Wolfe, F.; Vonkeman, H.; Glas, C.A.W.; Van De Laar, M.A.F.J. Linking Physical Function Outcomes in Rheumatology: Performance of a Crosswalk for Converting Health Assessment Questionnaire Scores to Short Form 36 Physical Functioning Scale Scores. Arthritis Rheum. 2014, 66, 1754–1758. [Google Scholar] [CrossRef] [PubMed]
- Cardiel, M.H.; Abello-Banfi, M.; Ruiz-Mercado, R.; Alarcon-Segovia, D. How to measure health status in rheumatoid arthritis in non-English speaking patients: Validation of a Spanish version of the Health Assessment Questionnaire Disability Index (Spanish HAQ-DI). Clin. Exp. Rheumatol. 1993, 11, 117–121. [Google Scholar] [PubMed]
- Post, R.B.; Leferink, V.J.M. Spinal mobility: Sagittal range of motion measured with the SpinalMouse, a new non-invasive device. Arch. Orthop. Trauma Surg. 2004, 124, 187–192. [Google Scholar] [CrossRef] [PubMed]
- Livanelioglu, A.; Kaya, F.; Nabiyev, V.; Demirkiran, G.; Fırat, T. The validity and reliability of “Spinal Mouse” assessment of spinal curvatures in the frontal plane in pediatric adolescent idiopathic thoraco-lumbar curves. Eur. Spine J. 2016, 25, 476–482. [Google Scholar] [CrossRef]
- Mannerkorpi, K.; Hernelid, C. Leisure Time Physical Activity Instrument and Physical Activity at Home and Work Instrument. Development, face validity, construct validity and test-retest reliability for subjects with fibromyalgia. Disabil. Rehabil. 2005, 27, 695–701. [Google Scholar] [CrossRef]
- Munguía-Izquierdo, D.; Legaz-Arrese, A.; Mannerkorpi, K. Transcultural Adaptation and Psychometric Properties of a Spanish-Language Version of Physical Activity Instruments for Patients with Fibromyalgia. Arch. Phys. Med. Rehabil. 2011, 92, 284–294. [Google Scholar] [CrossRef]
- Huijnen, I.P.J.; Verbunt, J.A.; Meeus, M.; Smeets, R.J.E.M. Energy Expenditure during Functional Daily Life Performances in Patients with Fibromyalgia. Pain Pract. 2015, 15, 748–756. [Google Scholar] [CrossRef]
- Aparicio, V.A.; Segura-Jiménez, V.; Álvarez-Gallardo, I.C.; Estévez-López, F.; Camiletti-Moirón, D.; Latorre, P.A.; Delgado-Fernández, M.; Carbonell-Baeza, A. Are there differences in quality of life, symptomatology and functional capacity among different obesity classes in women with fibromyalgia? The al-Ándalus project. Rheumatol. Int. 2014, 34, 811–821. [Google Scholar] [CrossRef]
- Carbonell-Baeza, A.; Aparicio, V.A.; Ortega, F.B.; Cuevas, A.M.; Alvarez, I.C.; Ruiz, J.R.; Delgado-Fernandez, M. Does a 3-month multidisciplinary intervention improve pain, body composition and physical fitness in women with fibromyalgia? Br. J. Sports Med. 2011, 45, 1189. [Google Scholar] [CrossRef]
- Cancela Carral, J.M.; Ayán, C.; Sturzinger, L.; Gonzalez, G. Relationship Between Body Mass Index and Static and Dynamic Balance in Active and Inactive Older Adults. J. Geriatr. Phys. Ther. 2018. [Google Scholar] [CrossRef] [PubMed]
- Do Nascimento, J.A.; Silva, C.C.; Dos Santos, H.H.; De Almeida Ferreira, J.J.; de Andrade, P.R. A preliminary study of static and dynamic balance in sedentary obese young adults: The relationship between BMI, posture and postural balance. Clin. Obes. 2017, 7, 377–383. [Google Scholar] [CrossRef] [PubMed]
- Melzer, I.; Oddsson, L.I. Altered characteristics of balance control in obese older adults. Obes. Res. Clin. Pract. 2016, 10, 151–158. [Google Scholar] [CrossRef] [PubMed]
- Minematsu, A.; Hazaki, K.; Harano, A.; Okamoto, N.; Kurumatani, N. Differences in physical function by body mass index in elderly Japanese individuals: The Fujiwara-kyo Study. Obes. Res. Clin. Pract. 2016, 10, 41–48. [Google Scholar] [CrossRef]
- Senna, M.K.; Sallam, R.A.-E.R.; Ashour, H.S.; Elarman, M. Effect of weight reduction on the quality of life in obese patients with fibromyalgia syndrome: A randomized controlled trial. Clin. Rheumatol. 2012, 31, 1591–1597. [Google Scholar] [CrossRef]
- Shapiro, J.R.; Anderson, D.A.; Danoff-Burg, S. A pilot study of the effects of behavioral weight loss treatment on fibromyalgia symptoms. J. Psychosom. Res. 2005, 59, 275–282. [Google Scholar] [CrossRef]
- Sempere-Rubio, N.; Aguilar-Rodríguez, M.; Inglés, M.; Izquierdo-Alventosa, R.; Serra-Añó, P. Physical Condition Factors that Predict a Better Quality of Life in Women with Fibromyalgia. Int. J. Environ. Res. Public Health 2019, 16, 3173. [Google Scholar] [CrossRef] [Green Version]
- Palomo-López, P.; Calvo-Lobo, C.; Becerro-de-Bengoa-Vallejo, R.; Losa-Iglesias, M.E.; Rodriguez-Sanz, D.; Sánchez-Gómez, R.; López-López, D. Quality of life related to foot health status in women with fibromyalgia: A case-control study. Arch. Med. Sci. 2019, 15, 694–699. [Google Scholar] [CrossRef]
- Palomo-López, P.; Becerro-de-Bengoa-Vallejo, R.; Elena-Losa-Iglesias, M.; López-López, D.; Rodríguez-Sanz, D.; Cáceres-León, M.; Calvo-Lobo, C. Relationship of Depression Scores and Ranges in Women Who Suffer from Fibromyalgia by Age Distribution: A Case-Control Study. Worldviews Evid.-Based Nurs. 2019, 16, 211–220. [Google Scholar] [CrossRef]
- King, C.D.; Jastrowski, K.E.; Barnett, K.A.; Pfeiffer, M.; Ting, T.V.; Kashikar-Zuck, S. Pressure Pain Threshold and Anxiety in Adolescent Females with and Without Juvenile Fibromyalgia: A Pilot Study. Clin. J. Pain 2017, 33, 620–626. [Google Scholar] [CrossRef]
- Cagnie, B.; Coppieters, I.; Denecker, S.; Six, J.; Danneels, L.; Meeus, M. Central sensitization in fibromyalgia? A systematic review on structural and functional brain MRI. Semin. Arthritis Rheum. 2014, 44, 68–75. [Google Scholar] [CrossRef] [PubMed]


| Variables | Cases (n = 34) | Controls (n = 22) | p-Value |
|---|---|---|---|
| Mean (SD) | Mean (SD) | ||
| Age (years) | 52.89 (7.86) | 50.18 (7.50) | 0.291 |
| Weight (kg) | 73.19 (14.64) | 69.22 (11.94) | 0.293 |
| Height (m) | 1.63 (0.09) | 1.65 (0.06) | 0.203 |
| BMI (kg/m2) | 27.69 (5.04) | 25.32(3.93) | 0.067 |
| FIQ-R | 63.86 (18.79) | 2.64 (6.05) | 0.001 |
| Clinical and Functional Status Variables | Overweight/Obese Women | Normal-Weight Women | ||||
|---|---|---|---|---|---|---|
| Cases (n = 24) | Controls (n = 12) | p-Value | Cases (n = 10) | Controls (n = 10) | p-Value | |
| Median (IR) | Median (IR) | Median (IR) | Median (IR) | |||
| Age (yeras) | 54.00 (9.75) | 56.00 (12.25) | 0.697 | 47.00 (10.50) | 47.50 (12.25) | 0.806 |
| Weight (kg) | 76.00 (17.50) | 77.00 (17.00) | 0.801 | 58.50 (11.00) | 60.00 (5.50) | 0.676 |
| Height (cm) | 1.60 (0.09) | 1.65 (0.14) | 0.275 | 1.64 (0.08) | 1.67 (0.07) | 0.224 |
| BMI (kg/m2) | 28.63 (4.29) | 28.61 (3.35) | 0.450 | 21.48 (3.65) | 22.05 (2.49) | 0.762 |
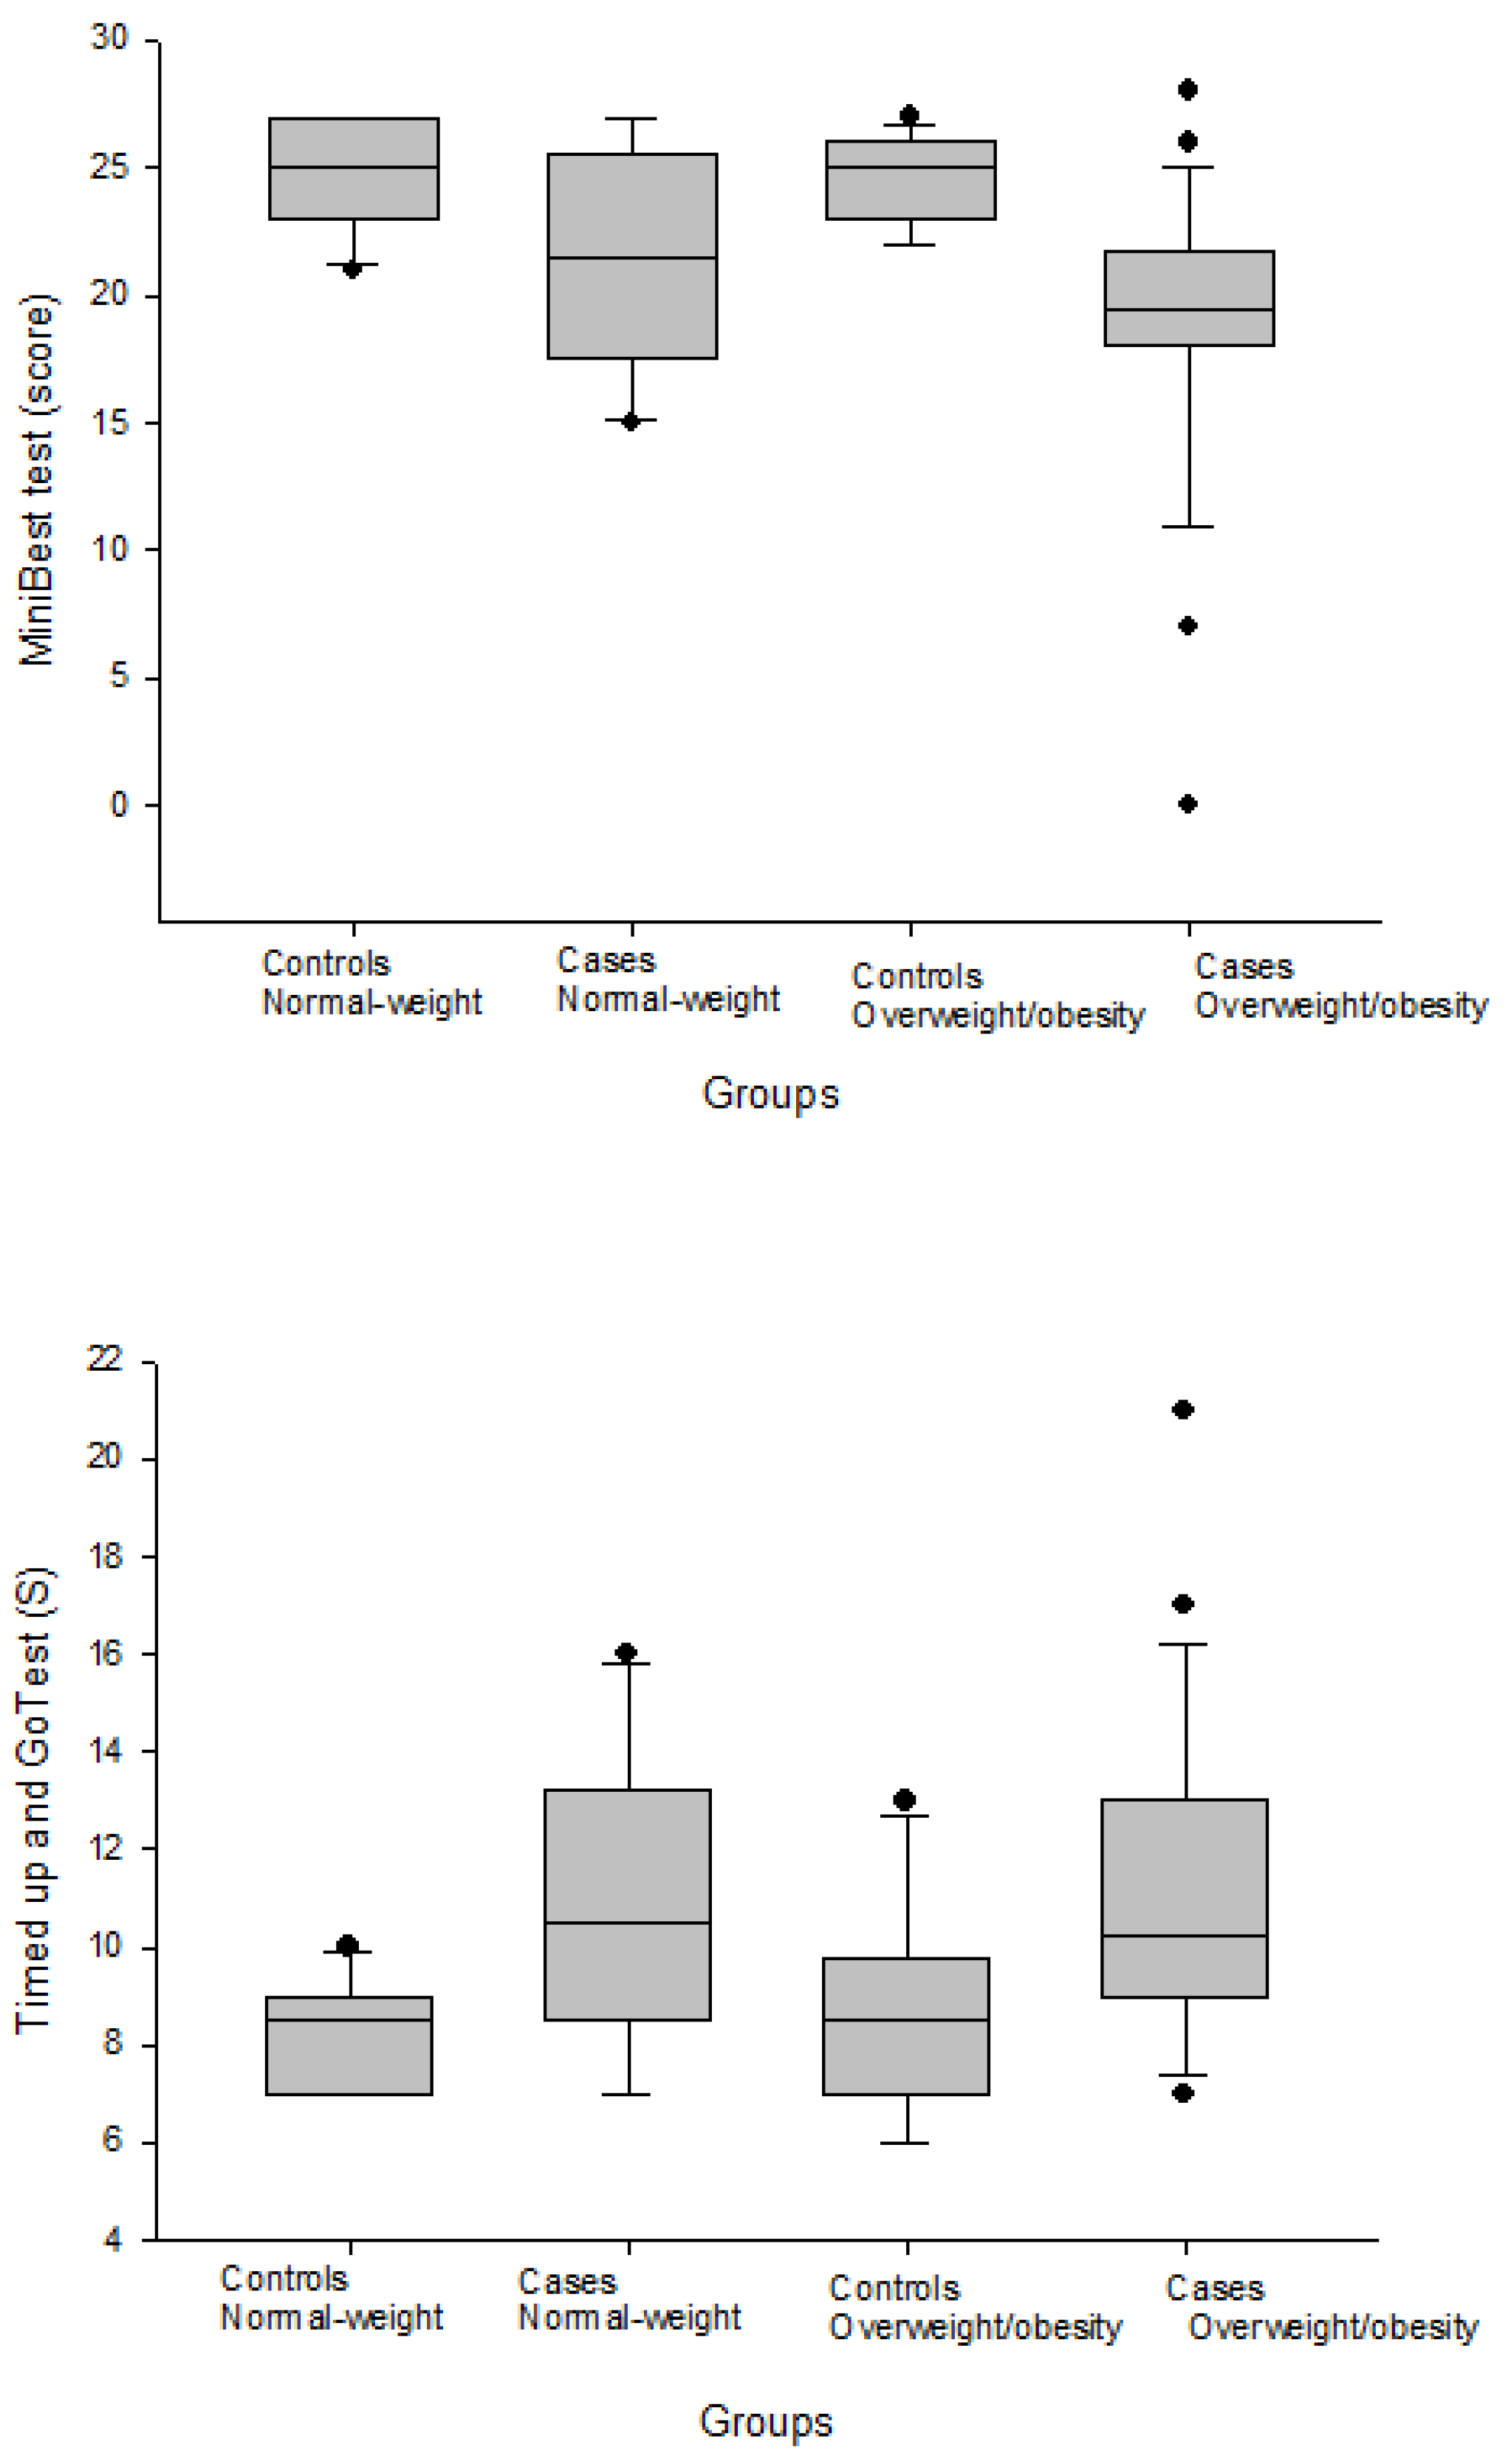
| MiniBESTest (score) | 19.50 (3.75) | 25.00 (3.00) | 0.001 * | 21.50 (8.00) | 25.00 (4.00) | 0.085 |
| TUG (s) | 10.24 (4.00) | 8.50 (2.75) | 0.008 * | 10.50 (4.75) | 8.50 (2.00) | 0.041 * |
| TUG-manual (s) | 12.00 (4.00) | 10.00 (3.75) | 0.037 * | 12.00 (6.25) | 9.00 (2.00) | 0.073 |
| TUG-cognitive (s) | 13.00 (5.00) | 13.00 (4.50) | 0.587 | 15.50 (9.75) | 12.50 (2.50) | 0.287 |
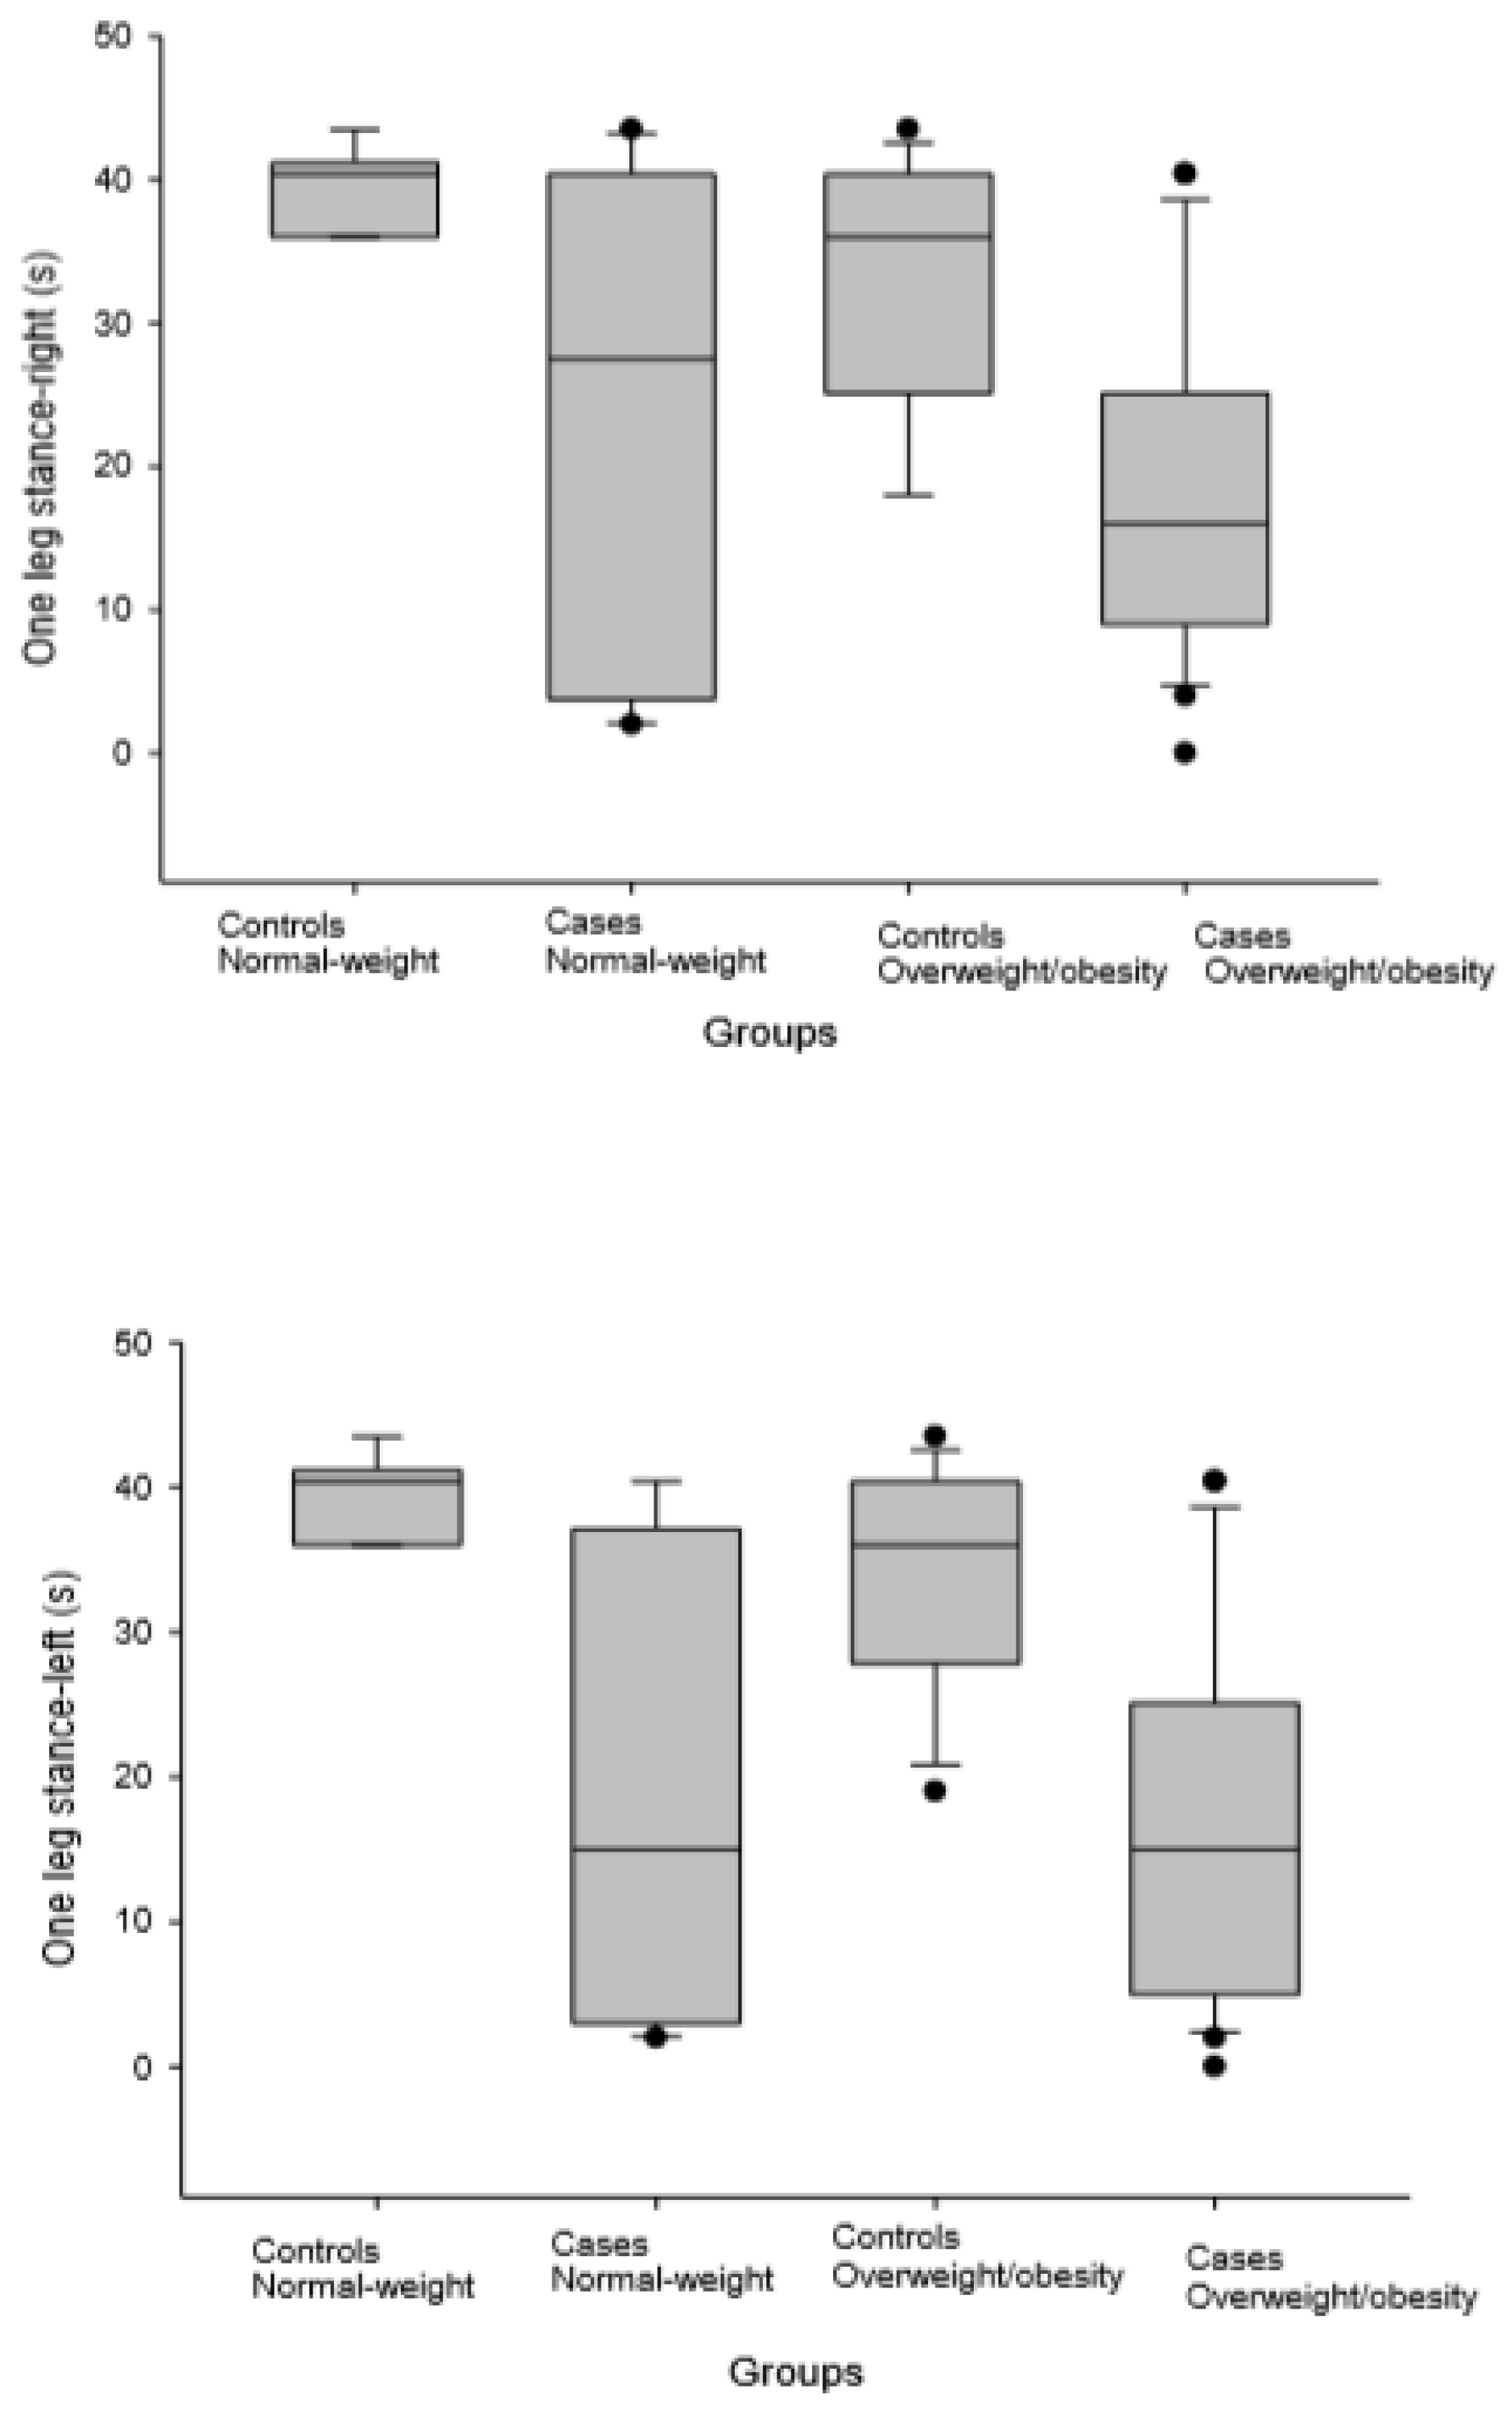
| One leg stance-right (s) | 16.00 (16.1) | 36.00 (15.3) | 0.002 * | 27.50 (36.65) | 40.40 (5.175) | 0.102 |
| One leg stance-left (s) | 15.00 (20.10) | 36.00 (12.57) | 0.001 * | 15.00 (34.10) | 40.40 (5.175) | 0.005 * |
| HAQ-DI (score) | 1.25 (0.87) | 0.00 (0.75) | 0.001 * | 1.50 (1.12) | 0.00 (0.25) | 0.007 * |
| Spinal Flexion (°) | 91.50 (30.50) | 90.00 (34.00) | 0.763 | 93.50 (24.50) | 81.50 (39.25) | 0.350 |
| Spinal Extension (°) | −15.50 (−10.25) | −23.00 (−11.00) | 0.087 | −17.00 (13.25) | −21.50 (−5.75) | 0.165 |
| Total tange of spinal inclination (°) | 109.00 (32.25) | 113.00 (45.00) | 0.657 | 114.00 (38.25) | 100.50 (42.25) | 0.625 |
| LTPAI total (score) | 5.00 (7.75) | 5.50 (6.12) | 0.755 | 4.50 (3.75) | 6.50 (5.12) | 0.081 |
| PAHWI (total) | 25.00 (32.00) | 45.00 (24.75) | 0.024 * | 25.50 (24.25) | 53.50 (30.37) | 0.003 * |
| Functional Status Variables | Overweight/Obese Women with FMS (n = 24) | Overweight/Obese Healthy Women (n = 12) | ||
|---|---|---|---|---|
| r | p-Value | r | p-Value | |
| MiniBESTest (score) | −0.281 | 0.183 | −0.374 | 0.231 |
| TUG (s) | −0.029 | 0.897 | −0.322 | 0.307 |
| TUG-manual (s) | −0.051 | 0.818 | −0.201 | 0.531 |
| TUG-cognitive (s) | 0.162 | 0.460 | −0.149 | 0.645 |
| One leg stance-right (s) | −0.169 | 0.441 | −0.108 | 0.738 |
| One leg stance-left (s) | −0.267 | 0.218 | 0.081 | 0.804 |
| HAQ-DI (score) | 0.187 | 0.442 | −0.124 | 0.700 |
| Spinal Flexion (°) | −0.241 | 0.256 | 0.236 | 0.484 |
| Spinal Extension (°) | −0.163 | 0.446 | 0.749 | 0.008 |
| Total range of spinal inclination (°) | −0.249 | 0.241 | 0.434 | 0.183 |
| LTPAI total (score) | −0.008 | 0.976 | 0.337 | 0.283 |
| PAHWI (total) | 0.225 | 0.386 | 0.187 | 0.561 |
| Functional Status Variables | Normal-Weight Women with FMS (n = 10) | Normal-Weight Healthy Women (n = 10) | ||
|---|---|---|---|---|
| r | p-Value | r | p-Value | |
| MiniBESTest (score) | −0.269 | 0.452 | 0.181 | 0.617 |
| TUG (s) | 0.341 | 0.334 | 0.356 | 0.313 |
| TUG-manual (s) | 0.348 | 0.325 | 0.299 | 0.401 |
| TUG-cognitive (s) | 0.450 | 0.192 | 0.488 | 0.153 |
| One leg stance-right (s) | −0.411 | 0.238 | 0.311 | 0.381 |
| One leg stance-left (s) | −0.256 | 0.475 | 0.311 | 0.381 |
| HAQ-DI (score) | −0.025 | 0.949 | −0.493 | 0.148 |
| Spinal Flexion (°) | 0.134 | 0.713 | −0.286 | 0.493 |
| Spinal Extension (°) | −0.153 | 0.673 | −0.479 | 0.230 |
| Total range of spinal inclination (°) | 0.188 | 0.603 | −0.357 | 0.385 |
| LTPAI total (score) | 0.252 | 0.548 | 0.337 | 0.283 |
| PAHWI (total) | 0.095 | 0.823 | 0.187 | 0.561 |
© 2019 by the authors. Licensee MDPI, Basel, Switzerland. This article is an open access article distributed under the terms and conditions of the Creative Commons Attribution (CC BY) license (http://creativecommons.org/licenses/by/4.0/).
Share and Cite
Cerón Lorente, L.; García Ríos, M.C.; Navarro Ledesma, S.; Tapia Haro, R.M.; Casas Barragán, A.; Correa-Rodríguez, M.; Aguilar Ferrándiz, M.E. Functional Status and Body Mass Index in Postmenopausal Women with Fibromyalgia: A Case–control Study. Int. J. Environ. Res. Public Health 2019, 16, 4540. https://0-doi-org.brum.beds.ac.uk/10.3390/ijerph16224540
Cerón Lorente L, García Ríos MC, Navarro Ledesma S, Tapia Haro RM, Casas Barragán A, Correa-Rodríguez M, Aguilar Ferrándiz ME. Functional Status and Body Mass Index in Postmenopausal Women with Fibromyalgia: A Case–control Study. International Journal of Environmental Research and Public Health. 2019; 16(22):4540. https://0-doi-org.brum.beds.ac.uk/10.3390/ijerph16224540
Chicago/Turabian StyleCerón Lorente, Laura, María Carmen García Ríos, Santiago Navarro Ledesma, Rosa María Tapia Haro, Antonio Casas Barragán, María Correa-Rodríguez, and María Encarnación Aguilar Ferrándiz. 2019. "Functional Status and Body Mass Index in Postmenopausal Women with Fibromyalgia: A Case–control Study" International Journal of Environmental Research and Public Health 16, no. 22: 4540. https://0-doi-org.brum.beds.ac.uk/10.3390/ijerph16224540