Validation of Submaximal Step Tests and the 6-Min Walk Test for Predicting Maximal Oxygen Consumption in Young and Healthy Participants

 , , ,
, , , 
Abstract
:1. Introduction
2. Materials and Methods
2.1. Study Sample
2.2. Experimental Protocol
2.3. Step Tests
2.4. 6MWT
2.5. Cardiopulmonary Exercise Test (CPET)
2.6. Statistical Analysis
3. Results
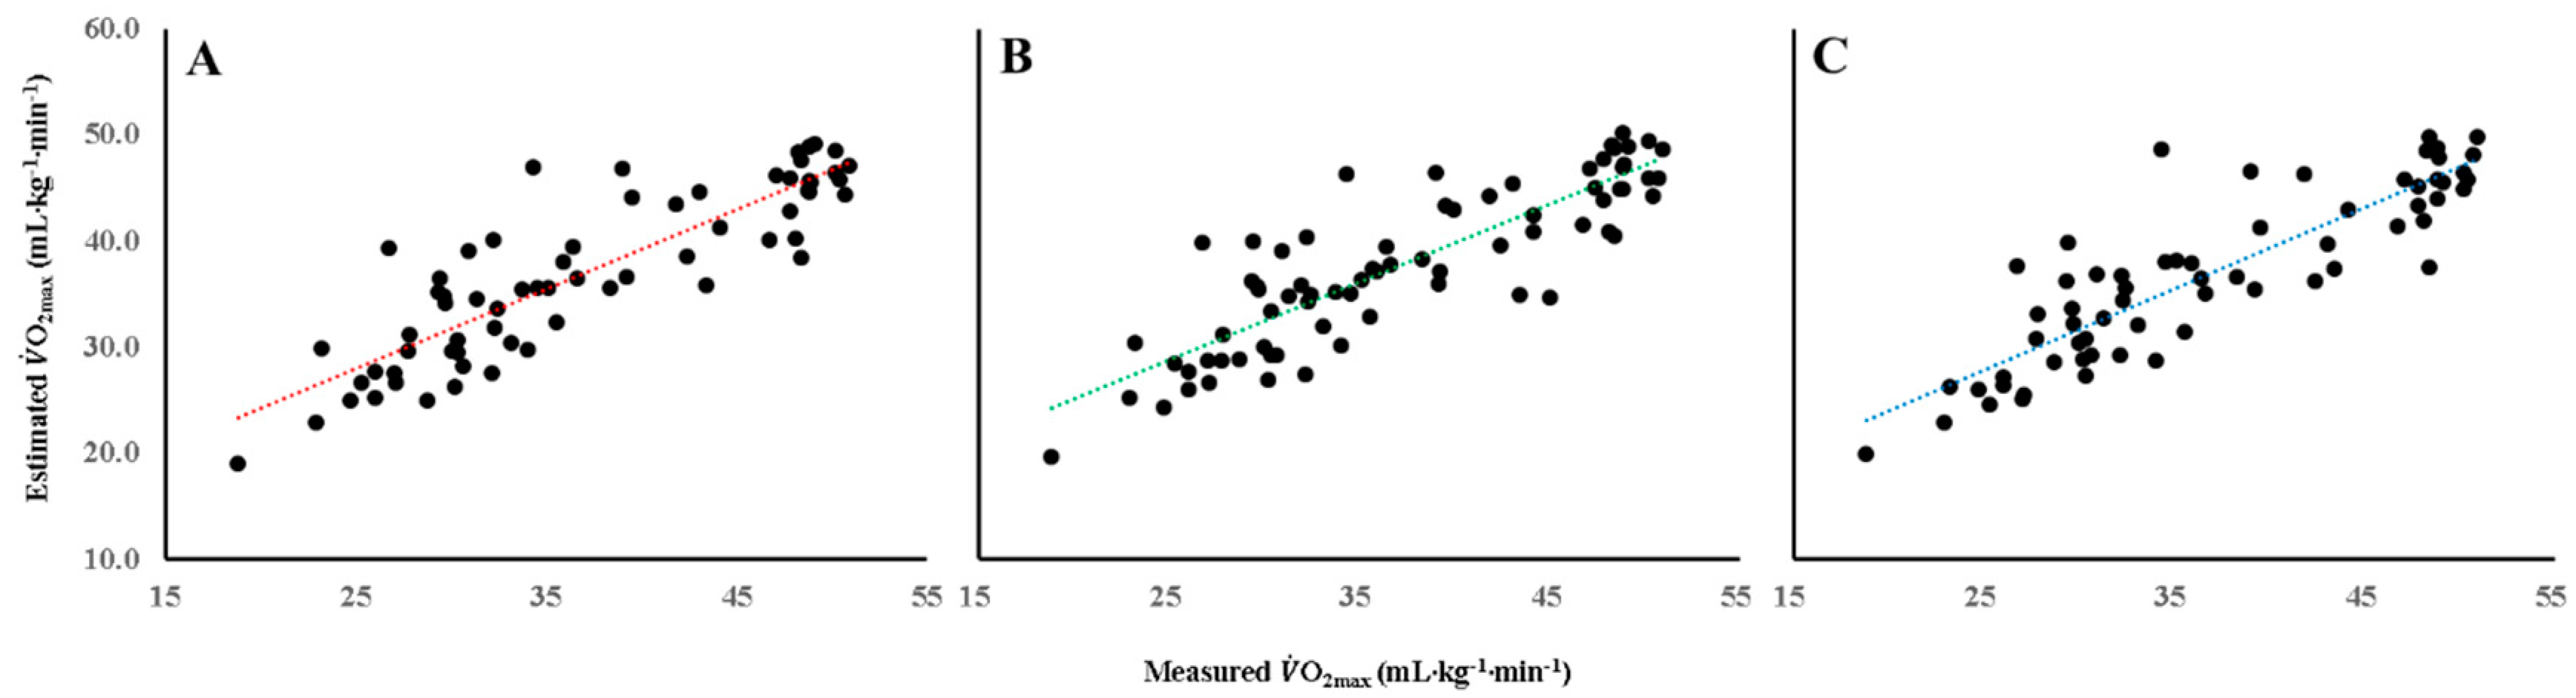
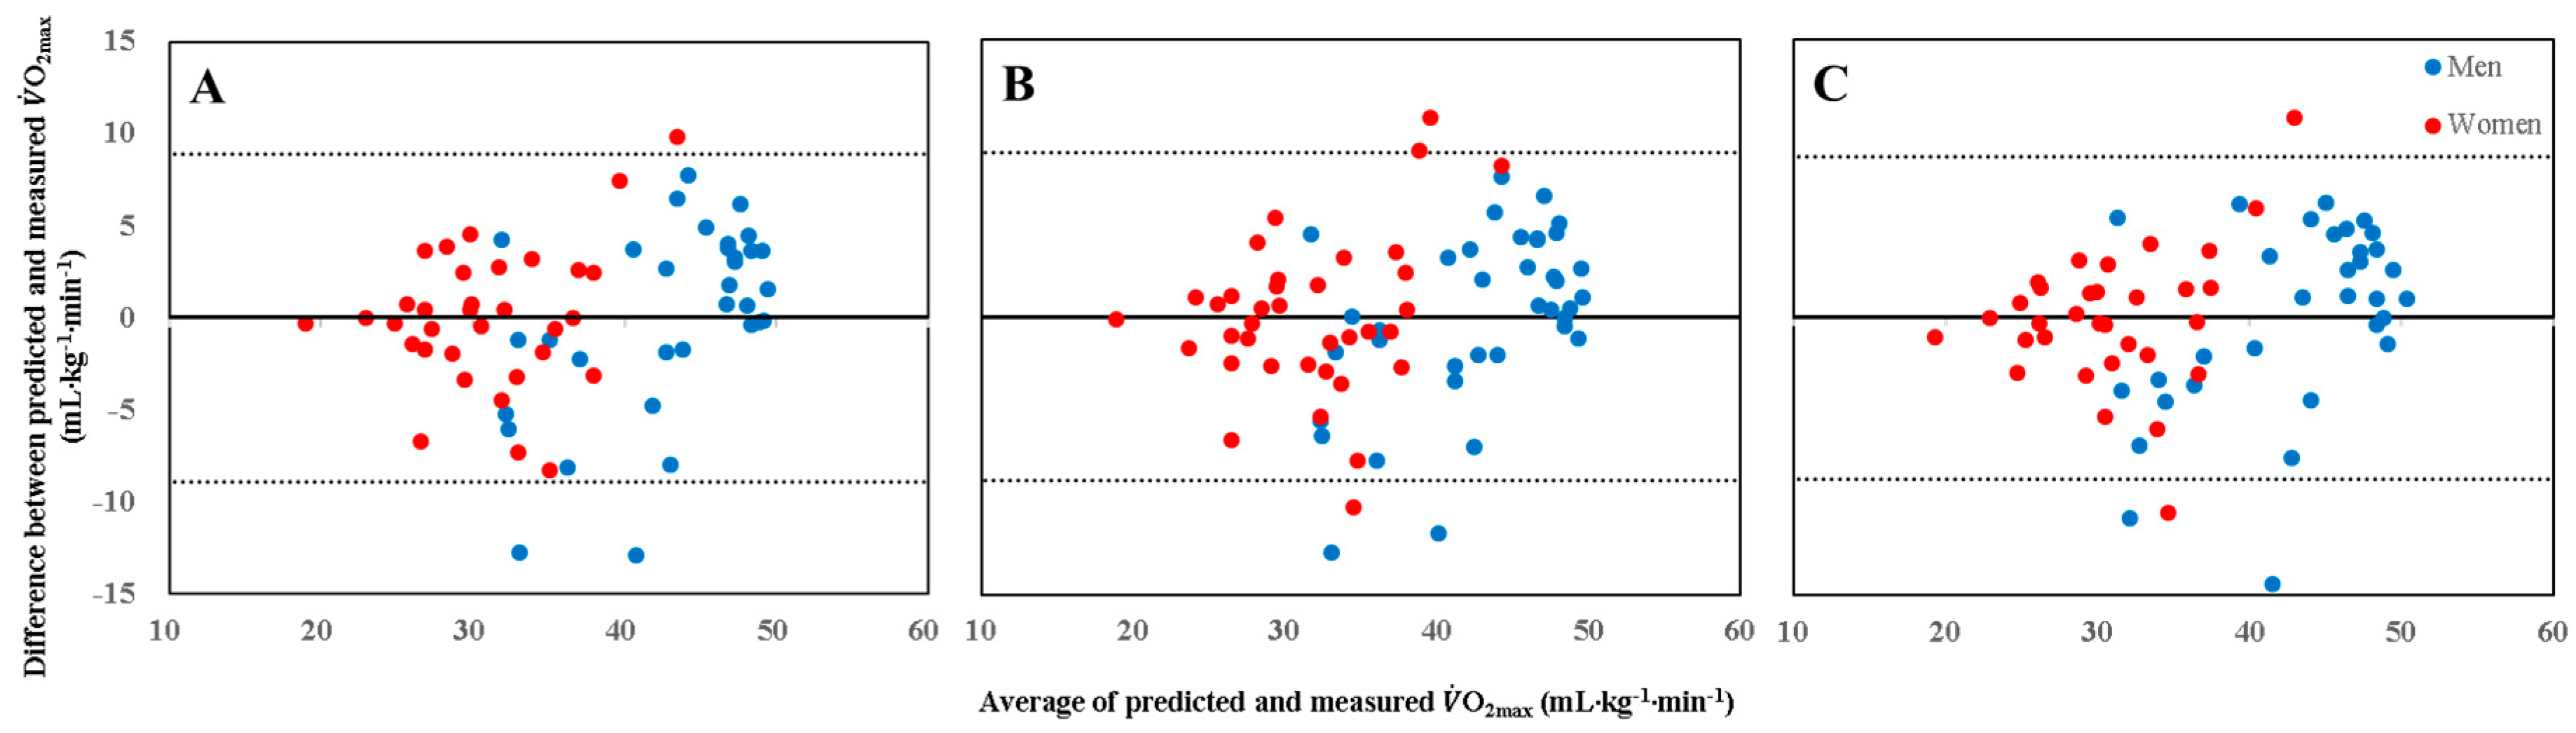
- 3MST20:
- 3MST30:
- 6MWT:
4. Discussion
5. Conclusions
Supplementary Materials
Author Contributions
Funding
Conflicts of Interest
References
- Ross, R.; Blair, S.N.; Arena, R.; Church, T.S.; Despres, J.P.; Franklin, B.A.; Haskell, W.L.; Kaminsky, L.A.; Levine, B.D.; Lavie, C.J.; et al. Importance of Assessing Cardiorespiratory Fitness in Clinical Practice: A Case for Fitness as a Clinical Vital Sign: A Scientific Statement From the American Heart Association. Circulation 2016, 134, e653–e699. [Google Scholar] [CrossRef] [PubMed]
- Beutner, F.; Ubrich, R.; Zachariae, S.; Engel, C.; Sandri, M.; Teren, A.; Gielen, S. Validation of a brief step-test protocol for estimation of peak oxygen uptake. Eur. J. Prev. Cardiol. 2015, 22, 503–512. [Google Scholar] [CrossRef] [PubMed]
- Patton, J.F.; Vogel, J.A.; Mello, R.P. Evaluation of a maximal predictive cycle ergometer test of aerobic power. Eur. J. Appl. Physiol. Occup. Physiol. 1982, 49, 131–140. [Google Scholar] [CrossRef] [PubMed]
- Bennett, H.; Parfitt, G.; Davison, K.; Eston, R. Validity of Submaximal Step Tests to Estimate Maximal Oxygen Uptake in Healthy Adults. Sports Med. 2016, 46, 737–750. [Google Scholar] [CrossRef] [PubMed]
- George, J.D.; Vehrs, P.R.; Allsen, P.E.; Fellingham, G.W.; Fisher, A.G. Development of a submaximal treadmill jogging test for fit college-aged individuals. Med. Sci. Sports Exerc. 1993, 25, 643–647. [Google Scholar] [CrossRef]
- Hughes, A.D.; Chaturvedi, N. Estimation of Maximal Oxygen Consumption and Heart Rate Recovery Using the Tecumseh Sub-Maximal Step Test and their Relationship to Cardiovascular Risk Factors. Artery Res. 2017, 18, 29–35. [Google Scholar] [CrossRef]
- Buckley, J.P.; Sim, J.; Eston, R.G.; Hession, R.; Fox, R. Reliability and validity of measures taken during the Chester step test to predict aerobic power and to prescribe aerobic exercise. Br. J. Sports Med. 2004, 38, 197–205. [Google Scholar] [CrossRef]
- JETTÉ, M. A calculator to predict maximal oxygen consumption for use with the Canadian Home Fitness Test. Can. J. Public Health 1977, 68, 195–198. [Google Scholar]
- Shephard, R.J. The current status of the Canadian home fitness test. Br. J. Sports Med. 1980, 14, 114–125. [Google Scholar] [CrossRef] [Green Version]
- Shephard, R.J.; Bailey, D.A.; Mirwald, R.L. Development of the Canadian Home Fitness Test. Can. Med. Assoc. J. 1976, 114, 675–679. [Google Scholar]
- Bohannon, R.W.; Bubela, D.J.; Wang, Y.-C.; Magasi, S.S.; Gershon, R.C. Six-minute walk test versus three-minute step test for measuring functional endurance (Alternative Measures of Functional Endurance). J. Strength Cond. Res./Natl. Strength Cond. Assoc. 2015, 29, 3240. [Google Scholar] [CrossRef] [PubMed] [Green Version]
- Enright, P.L.; McBurnie, M.A.; Bittner, V.; Tracy, R.P.; McNamara, R.; Arnold, A.; Newman, A.B.; Cardiovascular Health, S. The 6-min walk test: A quick measure of functional status in elderly adults. Chest 2003, 123, 387–398. [Google Scholar] [CrossRef] [PubMed]
- du Bois, R.M.; Weycker, D.; Albera, C.; Bradford, W.Z.; Costabel, U.; Kartashov, A.; Lancaster, L.; Noble, P.W.; Sahn, S.A.; Szwarcberg, J.; et al. Six-minute-walk test in idiopathic pulmonary fibrosis: Test validation and minimal clinically important difference. Am. J. Respir. Crit. Care Med. 2011, 183, 1231–1237. [Google Scholar] [CrossRef] [PubMed]
- ATS Committee on Proficiency Standards for Clinical Pulmonary Function Laboratories. ATS statement: Guidelines for the six-minute walk test. Am. J. Respir. Crit. Care Med. 2002, 166, 111–117. [Google Scholar] [CrossRef]
- Aquino, E.S.; Mourao, F.A.; Souza, R.K.; Glicerio, B.M.; Coelho, C.C. Comparative analysis of the six-minute walk test in healthy children and adolescents. Rev. Bras. Fisioter. 2010, 14, 75–80. [Google Scholar] [CrossRef] [PubMed] [Green Version]
- Morinder, G.; Mattsson, E.; Sollander, C.; Marcus, C.; Larsson, U.E. Six-minute walk test in obese children and adolescents: Reproducibility and validity. Physiother. Res. Int. 2009, 14, 91–104. [Google Scholar] [CrossRef] [PubMed]
- Rauchenzauner, M.; Schneider, J.; Colleselli, V.; Ruepp, M.; Cortina, G.; Hogler, W.; Neururer, S.; Geiger, R. Comparing modalities of conducting the six-minute walk test in healthy children and adolescents. Minerva Pediatr. 2019, 71, 229–234. [Google Scholar] [CrossRef]
- Takken, T. Six-minute walk test is a poor predictor of maximum oxygen uptake in children. Acta Paediatr. 2010, 99, 958. [Google Scholar] [CrossRef]
- Thomas, S.; Reading, J.; Shephard, R.J. Revision of the Physical Activity Readiness Questionnaire (PAR-Q). Can. J. Sport Sci. 1992, 17, 338–345. [Google Scholar]
- Tanaka, H.; Monahan, K.D.; Seals, D.R. Age-predicted maximal heart rate revisited. J. Am. Coll. Cardiol. 2001, 37, 153–156. [Google Scholar] [CrossRef] [Green Version]
- Kasch, F.W.; Phillips, W.H.; Ross, W.D.; Carter, J.E.; Boyer, J.L. A comparison of maximal oxygen uptake by treadmill and step-test procedures. J. Appl. Physiol. 1966, 21, 1387–1388. [Google Scholar] [CrossRef] [PubMed]
- Cooper, K.H. A means of assessing maximal oxygen intake. Correlation between field and treadmill testing. JAMA 1968, 203, 201–204. [Google Scholar] [CrossRef] [PubMed]
- McGavin, C.; Gupta, S.; McHardy, G. Twelve-minute walking test for assessing disability in chronic bronchitis. Br. Med. J. 1976, 1, 822–823. [Google Scholar] [CrossRef] [PubMed] [Green Version]
- Butland, R.; Pang, J.; Gross, E.; Woodcock, A.; Geddes, D. Two-, six-, and 12-min walking tests in respiratory disease. Br. Med. J. (Clin. Res. Ed.) 1982, 284, 1607. [Google Scholar] [CrossRef] [Green Version]
- Ross, R.M.; Murthy, J.N.; Wollak, I.D.; Jackson, A.S. The six minute walk test accurately estimates mean peak oxygen uptake. BMC Pulm. Med. 2010, 10, 31. [Google Scholar] [CrossRef] [Green Version]
- Cavalheri, V.; Jenkins, S.; Cecins, N.; Gain, K.; Hill, K. Comparison of the six-minute walk test with a cycle-based cardiopulmonary exercise test in people following curative intent treatment for non-small cell lung cancer. Chronic Respir. Dis. 2016, 13, 118–127. [Google Scholar] [CrossRef] [Green Version]
- Schmidt, K.; Vogt, L.; Thiel, C.; Jäger, E.; Banzer, W. Validity of the six-minute walk test in cancer patients. Int. J. Sports Med. 2013, 34, 631–636. [Google Scholar] [CrossRef]
- Schumacher, A.N.; Shackelford, D.Y.; Brown, J.M.; Hayward, R. Validation of the 6-min Walk Test for Predicting Peak VO2 in Cancer Survivors. Med. Sci. Sports Exerc. 2019, 51, 271–277. [Google Scholar] [CrossRef]


| Variables | All | Men | Women |
|---|---|---|---|
| N | 73 | 37 | 36 |
| Age (year) | 30.8 (9.3) | 29.4 (9.5) | 32.3 (8.9) |
| Weight (kg) | 68.3 (13.9) | 76.7 (11.5) | 59.7 (10.7) * |
| Height (cm) | 168.2 (10.5) | 175.9 (7.7) | 160.3 (6.2) * |
| BMI (kg/m2) | 24.2 (3.7) | 24.7 (2.7) | 23.6 (4.5) |
| Waist circumference (cm) | 81.8 (11.1) | 85.4 (9.1) | 78.0 (11.8) * |
| Resting heart rate (bpm) | 66.2 (9.4) | 63.2 (10.2) | 69.2 (7.6) * |
| SBP (mmHg) | 118.7 (13.4) | 127.0 (11.9) | 110.1 (8.8) * |
| DBP (mmHg) | 75.2 (9.4) | 77.0 (9.1) | 73.3 (9.6) |
| Heading | All | Men | Women |
|---|---|---|---|
| 3MST20 | N = 66 | N = 33 | N = 33 |
| RHR (bpm) | 68.9 (9.7) | 66.2 (11.0) | 71.6 (7.4) * |
| HR1 (bpm) | 109.5 (12.6) | 103.6 (10.1) | 115.4 (12.3) * |
| HR2 (bpm) | 114.1 (14.6) | 105.8 (9.5) | 122.6 (14.3) * |
| HR3 (bpm) | 116.7 (15.0) | 108.2 (9.8) | 125.3 (14.5) * |
| HRR30s (bpm) | 94.1 (15.1) | 86.2 (11.4) | 101.9 (14.2) * |
| HRR1 (bpm) | 81.1 (13.9) | 74.8 (12.2) | 87.4 (12.2) * |
| %APMHR at the third minute of exercise | 62.8 (8.7) | 57.7 (5.9) | 67.8 (8.2) * |
| 3MST30 | N = 73 | N = 37 | N = 36 |
| RHR (bpm) | 70.7 (10.7) | 67.4 (10.3) | 74.1 (10.2) * |
| HR1 (bpm) | 121.6 (13.2) | 114.3 (8.6) | 129.1 (12.9) * |
| HR2 (bpm) | 132.9 (15.6) | 122.3 (10.4) | 143.8 (12.2) * |
| HR3 (bpm) | 137.5 (17.8) | 125.3 (10.9) | 150.0 (14.6) * |
| HRR30s (bpm) | 112.9 (20.5) | 101.9 (14.9) | 124.3 (19.4) * |
| HRR1 (bpm) | 96.5 (20.4) | 86.1 (15.0) | 107.1 (19.8) * |
| %APMHR at the third minute of exercise | 73.9 (10.8) | 67.0 (7.2) | 81.1 (9.0) * |
| Six-minute walk test | N = 64 | N = 32 | N = 32 |
| Distance (m) | 715 (94.9) | 762.7 (97.2) | 667.4 (64.6) * |
| Cardiopulmonary exercise test | N = 73 | N = 37 | N = 36 |
| RHR (bpm) | 19.01 (1.1) | 19.0 (1.0) | 19.0 (1.2) |
| HR at end of the test (bpm) | 188.8 (10.3) | 191.6 (8.7) | 185.9 (11.2) * |
| %APMHR | 101.3 (5.5) | 102.3 (5.0) | 100.3 (5.8) |
| Cessation stage (range) | 5.2 (3–6) | 5.7 (5–6) | 4.6 (3–6) |
| VO2max (mL∙kg−1∙min−1) | 37.3 (8.8) | 42.8 (7.3) | 31.6 (6.3) * |
| Tests | Models | Adjusted R2 | SEE | ΔF | Coefficient Estimates | |||||
|---|---|---|---|---|---|---|---|---|---|---|
| Intercept | HRR30s | Sex | Age | Weight | Distance Walked·10−1 | |||||
| 3MST20 | Model 1 | 0.328 | 7.4 | 36.7 * | 69.9 * | −12.0 * | ||||
| Model 2 | 0.503 | 6.4 | 33.9 * | 68.5 * | −0.2 * | −9.0 * | ||||
| Model 3 | 0.713 | 4.9 | 54.7 * | 76.4 * | −0.1 * | −8.0 * | −0.5 * | |||
| Model 4 | 0.734 | 4.7 | 45.9 * | 86.0 * | −0.1 * | −10.9 * | −0.4 * | −0.1 * | ||
| 3MST30 | Model 1 | 0.458 | 6.5 | 61.9 * | 70.5 * | −0.3 * | ||||
| Model 2 | 0.555 | 5.9 | 45.9 * | 70.3 * | −0.2 * | −6.7 * | ||||
| Model 3 | 0.699 | 4.8 | 56.8 * | 73.7 * | −0.1 * | −7.6 * | −0.4 * | |||
| Model 4 | 0.722 | 4.7 | 47.7 * | 84.5 * | −0.1 * | −10.2 * | −0.4 * | −0.1 * | ||
| 6MWT | Model 1 | 0.441 | 6.8 | 50.8 * | −9.09 | 0.6 * | ||||
| Model 2 | 0.576 | 5.9 | 43.8 * | 17.6 * | −7.8 * | 0.4 * | ||||
| Model 3 | 0.699 | 5.0 | 49.7 * | 45.7 * | −8.2 * | −0.4 * | 0.2 * | |||
| Model 4 | 0.744 | 4.6 | 46.8 * | 61.1 * | −11.2 * | −0.4 * | −0.2 * | 0.2 * | ||
© 2019 by the authors. Licensee MDPI, Basel, Switzerland. This article is an open access article distributed under the terms and conditions of the Creative Commons Attribution (CC BY) license (http://creativecommons.org/licenses/by/4.0/).
Share and Cite
Hong, S.H.; Yang, H.I.; Kim, D.-I.; Gonzales, T.I.; Brage, S.; Jeon, J.Y. Validation of Submaximal Step Tests and the 6-Min Walk Test for Predicting Maximal Oxygen Consumption in Young and Healthy Participants. Int. J. Environ. Res. Public Health 2019, 16, 4858. https://0-doi-org.brum.beds.ac.uk/10.3390/ijerph16234858
Hong SH, Yang HI, Kim D-I, Gonzales TI, Brage S, Jeon JY. Validation of Submaximal Step Tests and the 6-Min Walk Test for Predicting Maximal Oxygen Consumption in Young and Healthy Participants. International Journal of Environmental Research and Public Health. 2019; 16(23):4858. https://0-doi-org.brum.beds.ac.uk/10.3390/ijerph16234858
Chicago/Turabian StyleHong, Sung Hyun, Hyuk In Yang, Dong-Il Kim, Tomas I. Gonzales, Soren Brage, and Justin Y. Jeon. 2019. "Validation of Submaximal Step Tests and the 6-Min Walk Test for Predicting Maximal Oxygen Consumption in Young and Healthy Participants" International Journal of Environmental Research and Public Health 16, no. 23: 4858. https://0-doi-org.brum.beds.ac.uk/10.3390/ijerph16234858