Trends and Age-Period-Cohort Effects of Fertility Rate: Analysis of 26,224 Married Women in Taiwan


Abstract
:1. Introduction
2. Materials and Methods
2.1. Data Source
2.2. Statistical Analysis
j = 1, 2,…,J
k = j – i + I
2.3. Multiphase Method in Estimating Cohort Effects
2.4. Curvature Change Points
3. Results
4. Discussion
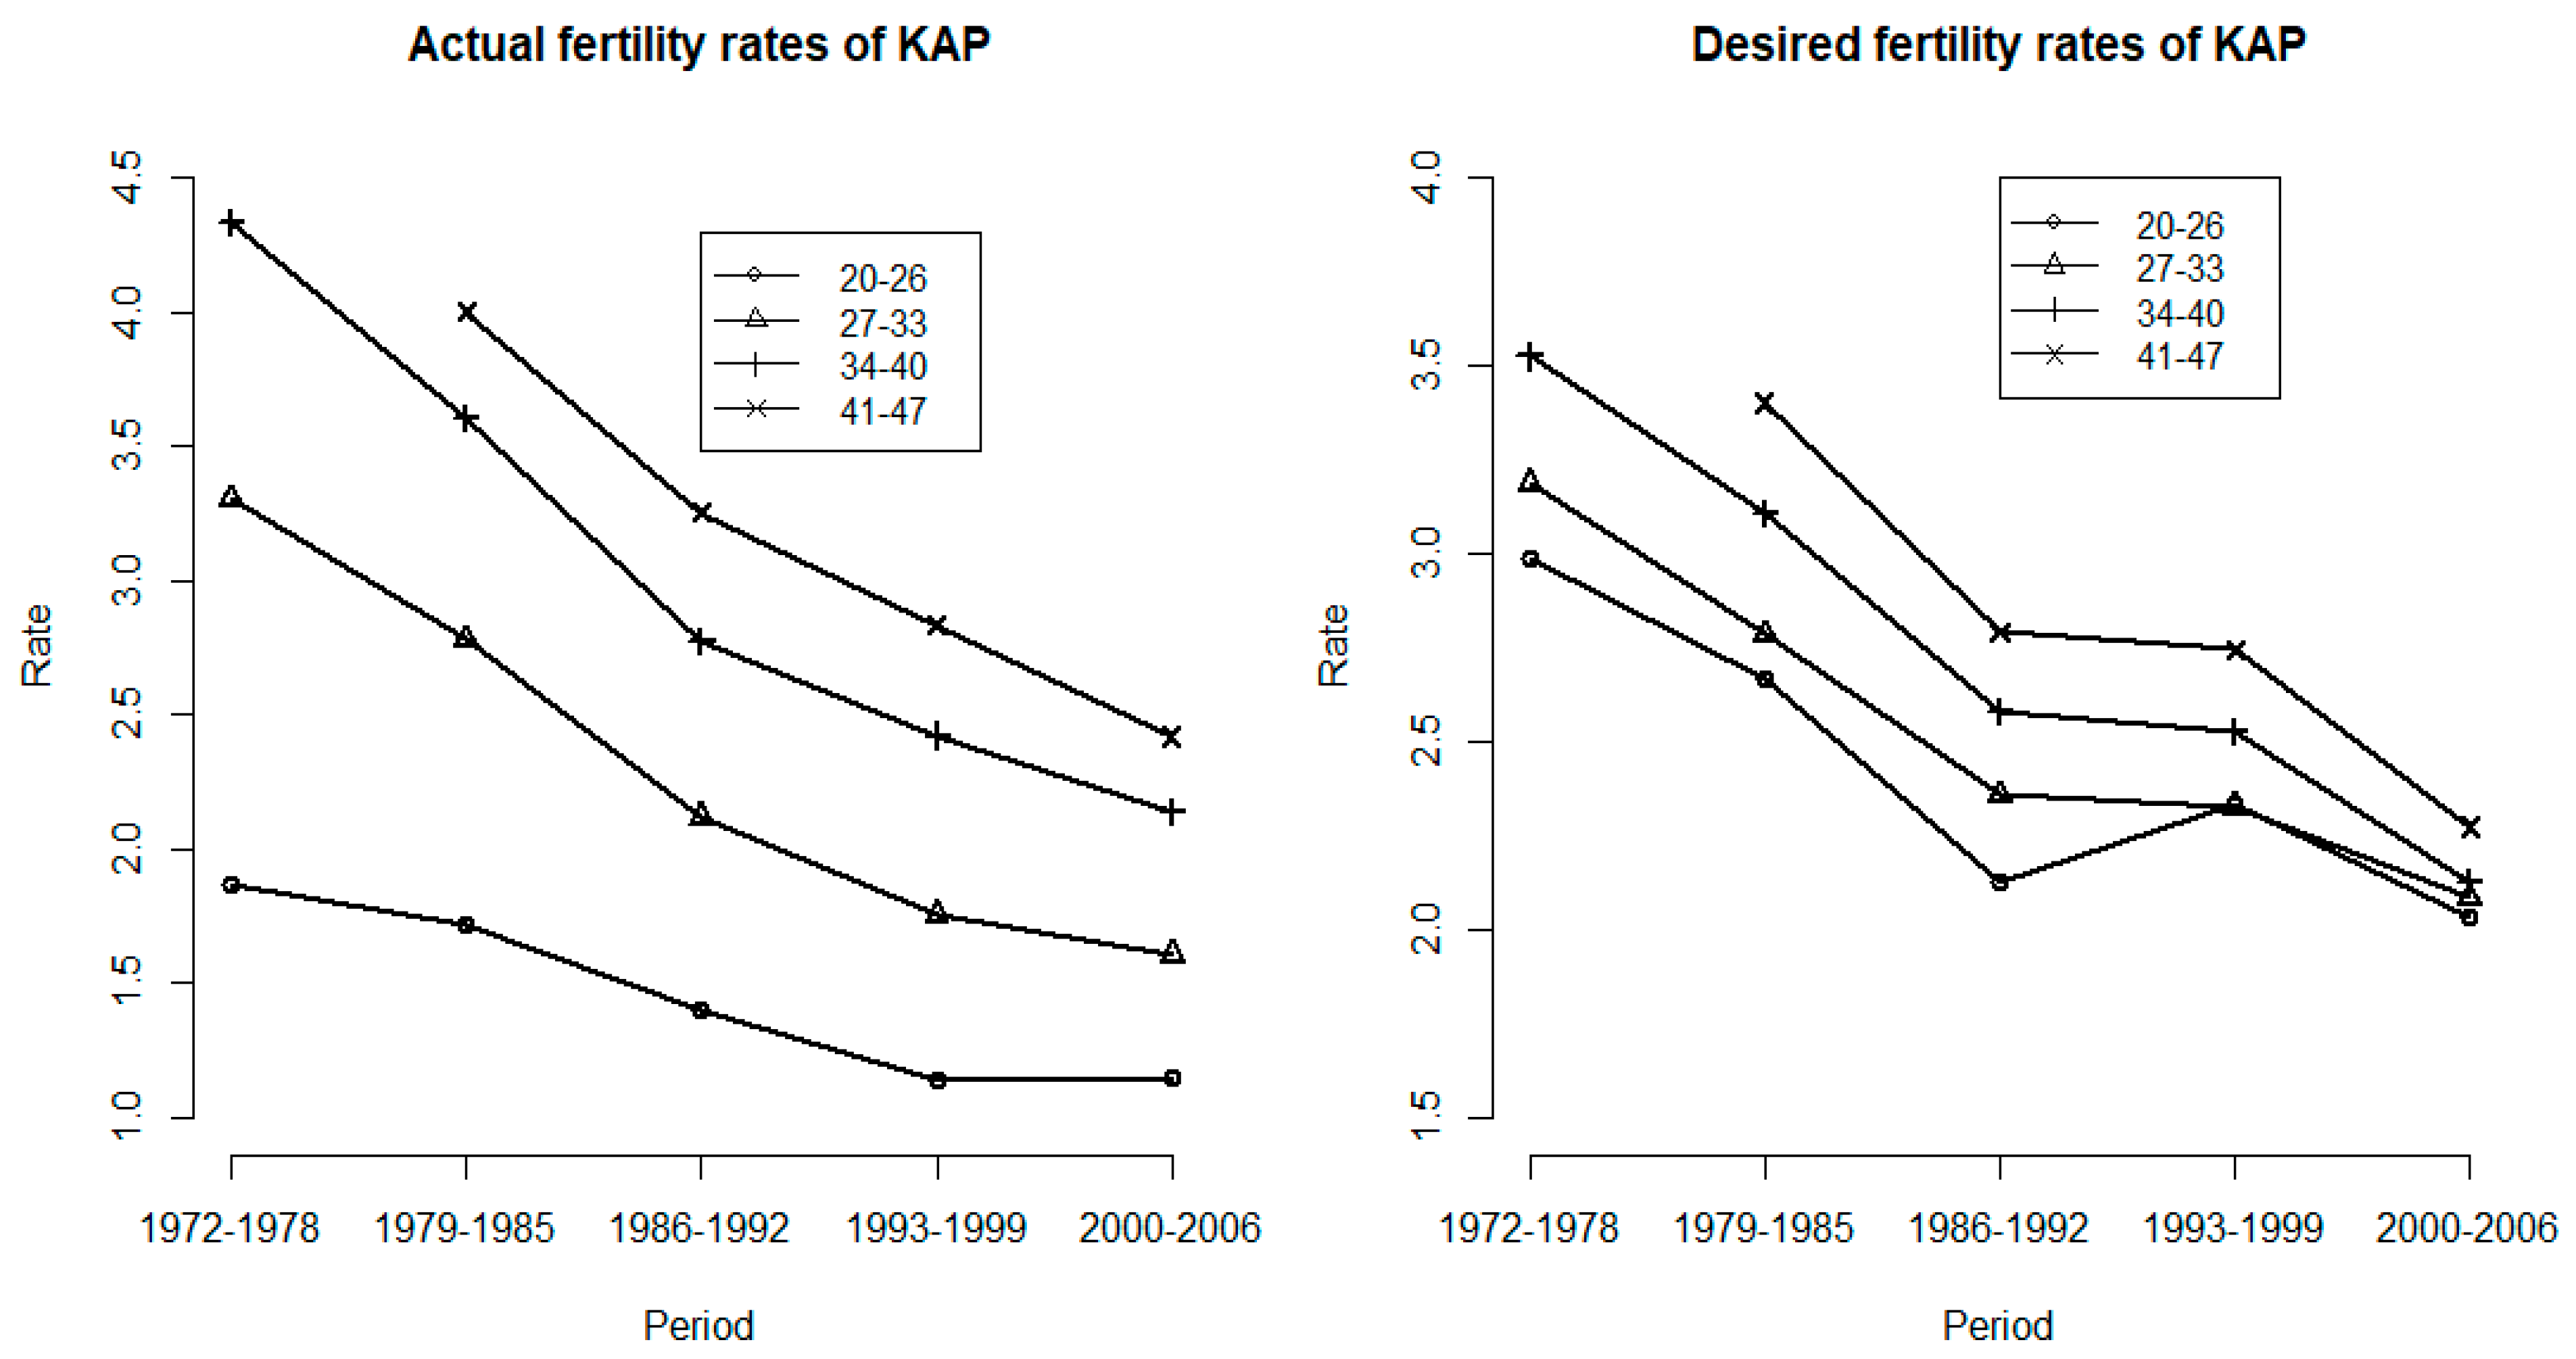
4.1. Fertility Trends
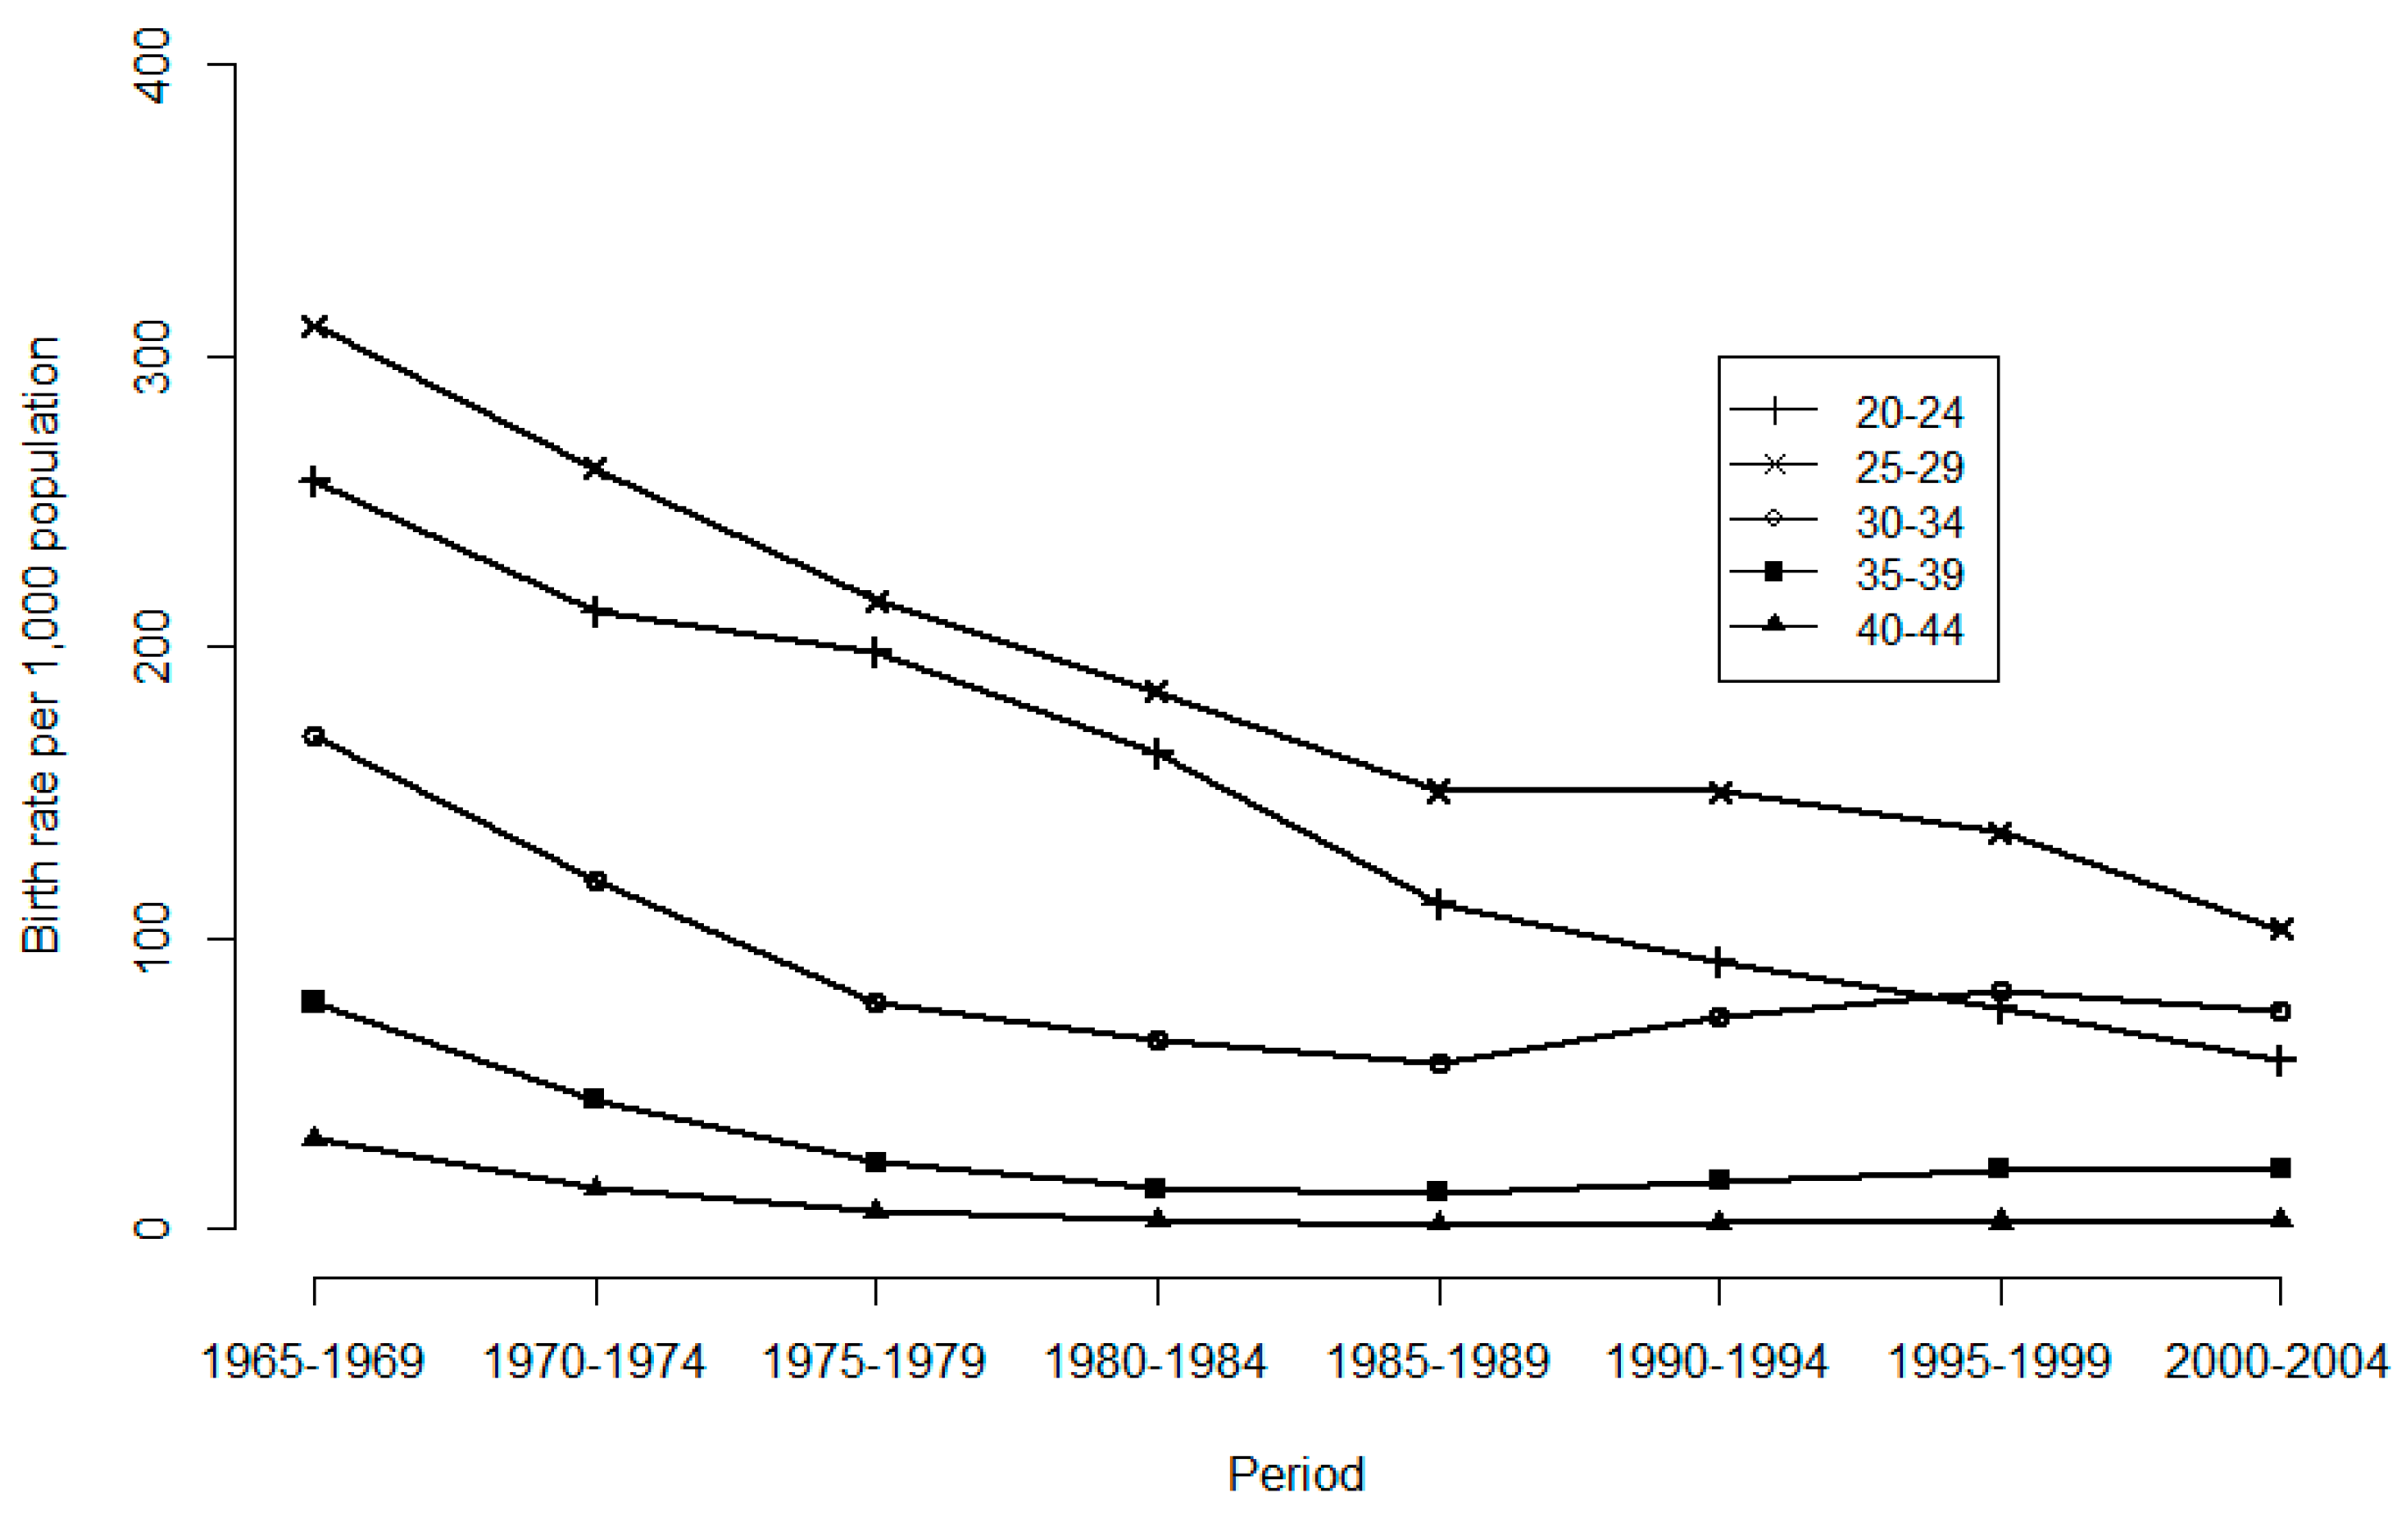
4.2. Age Effects
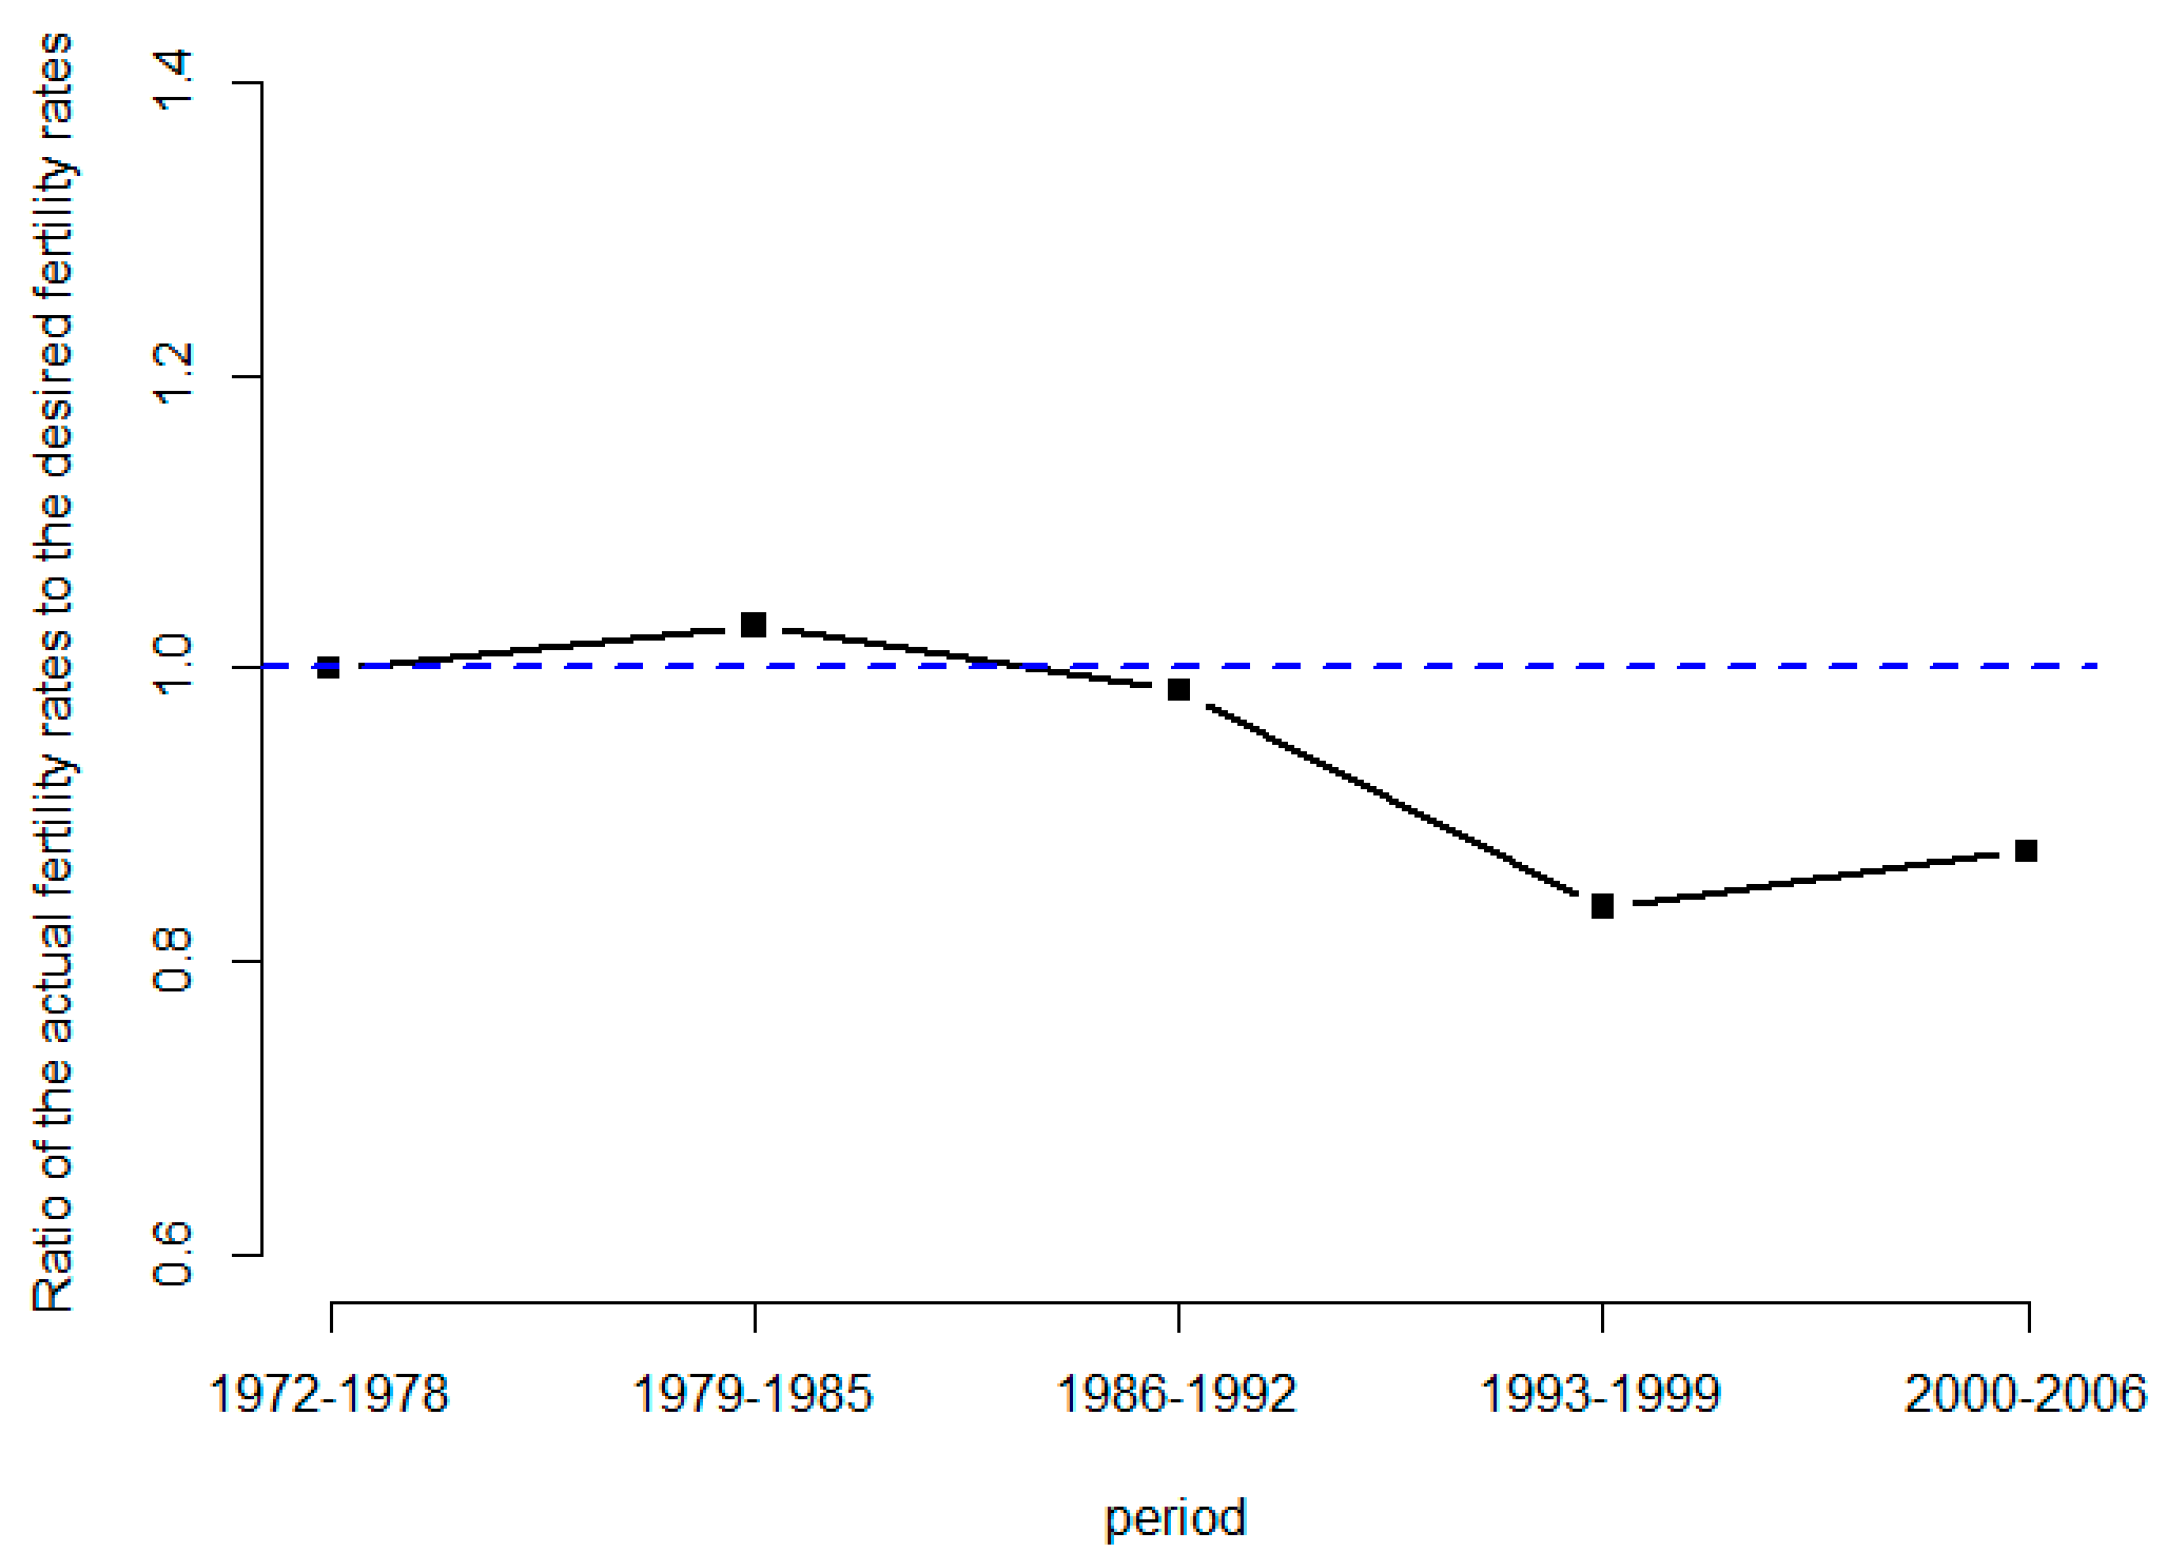
4.3. Tempo Effects
4.4. Causes of the Tempo Effects
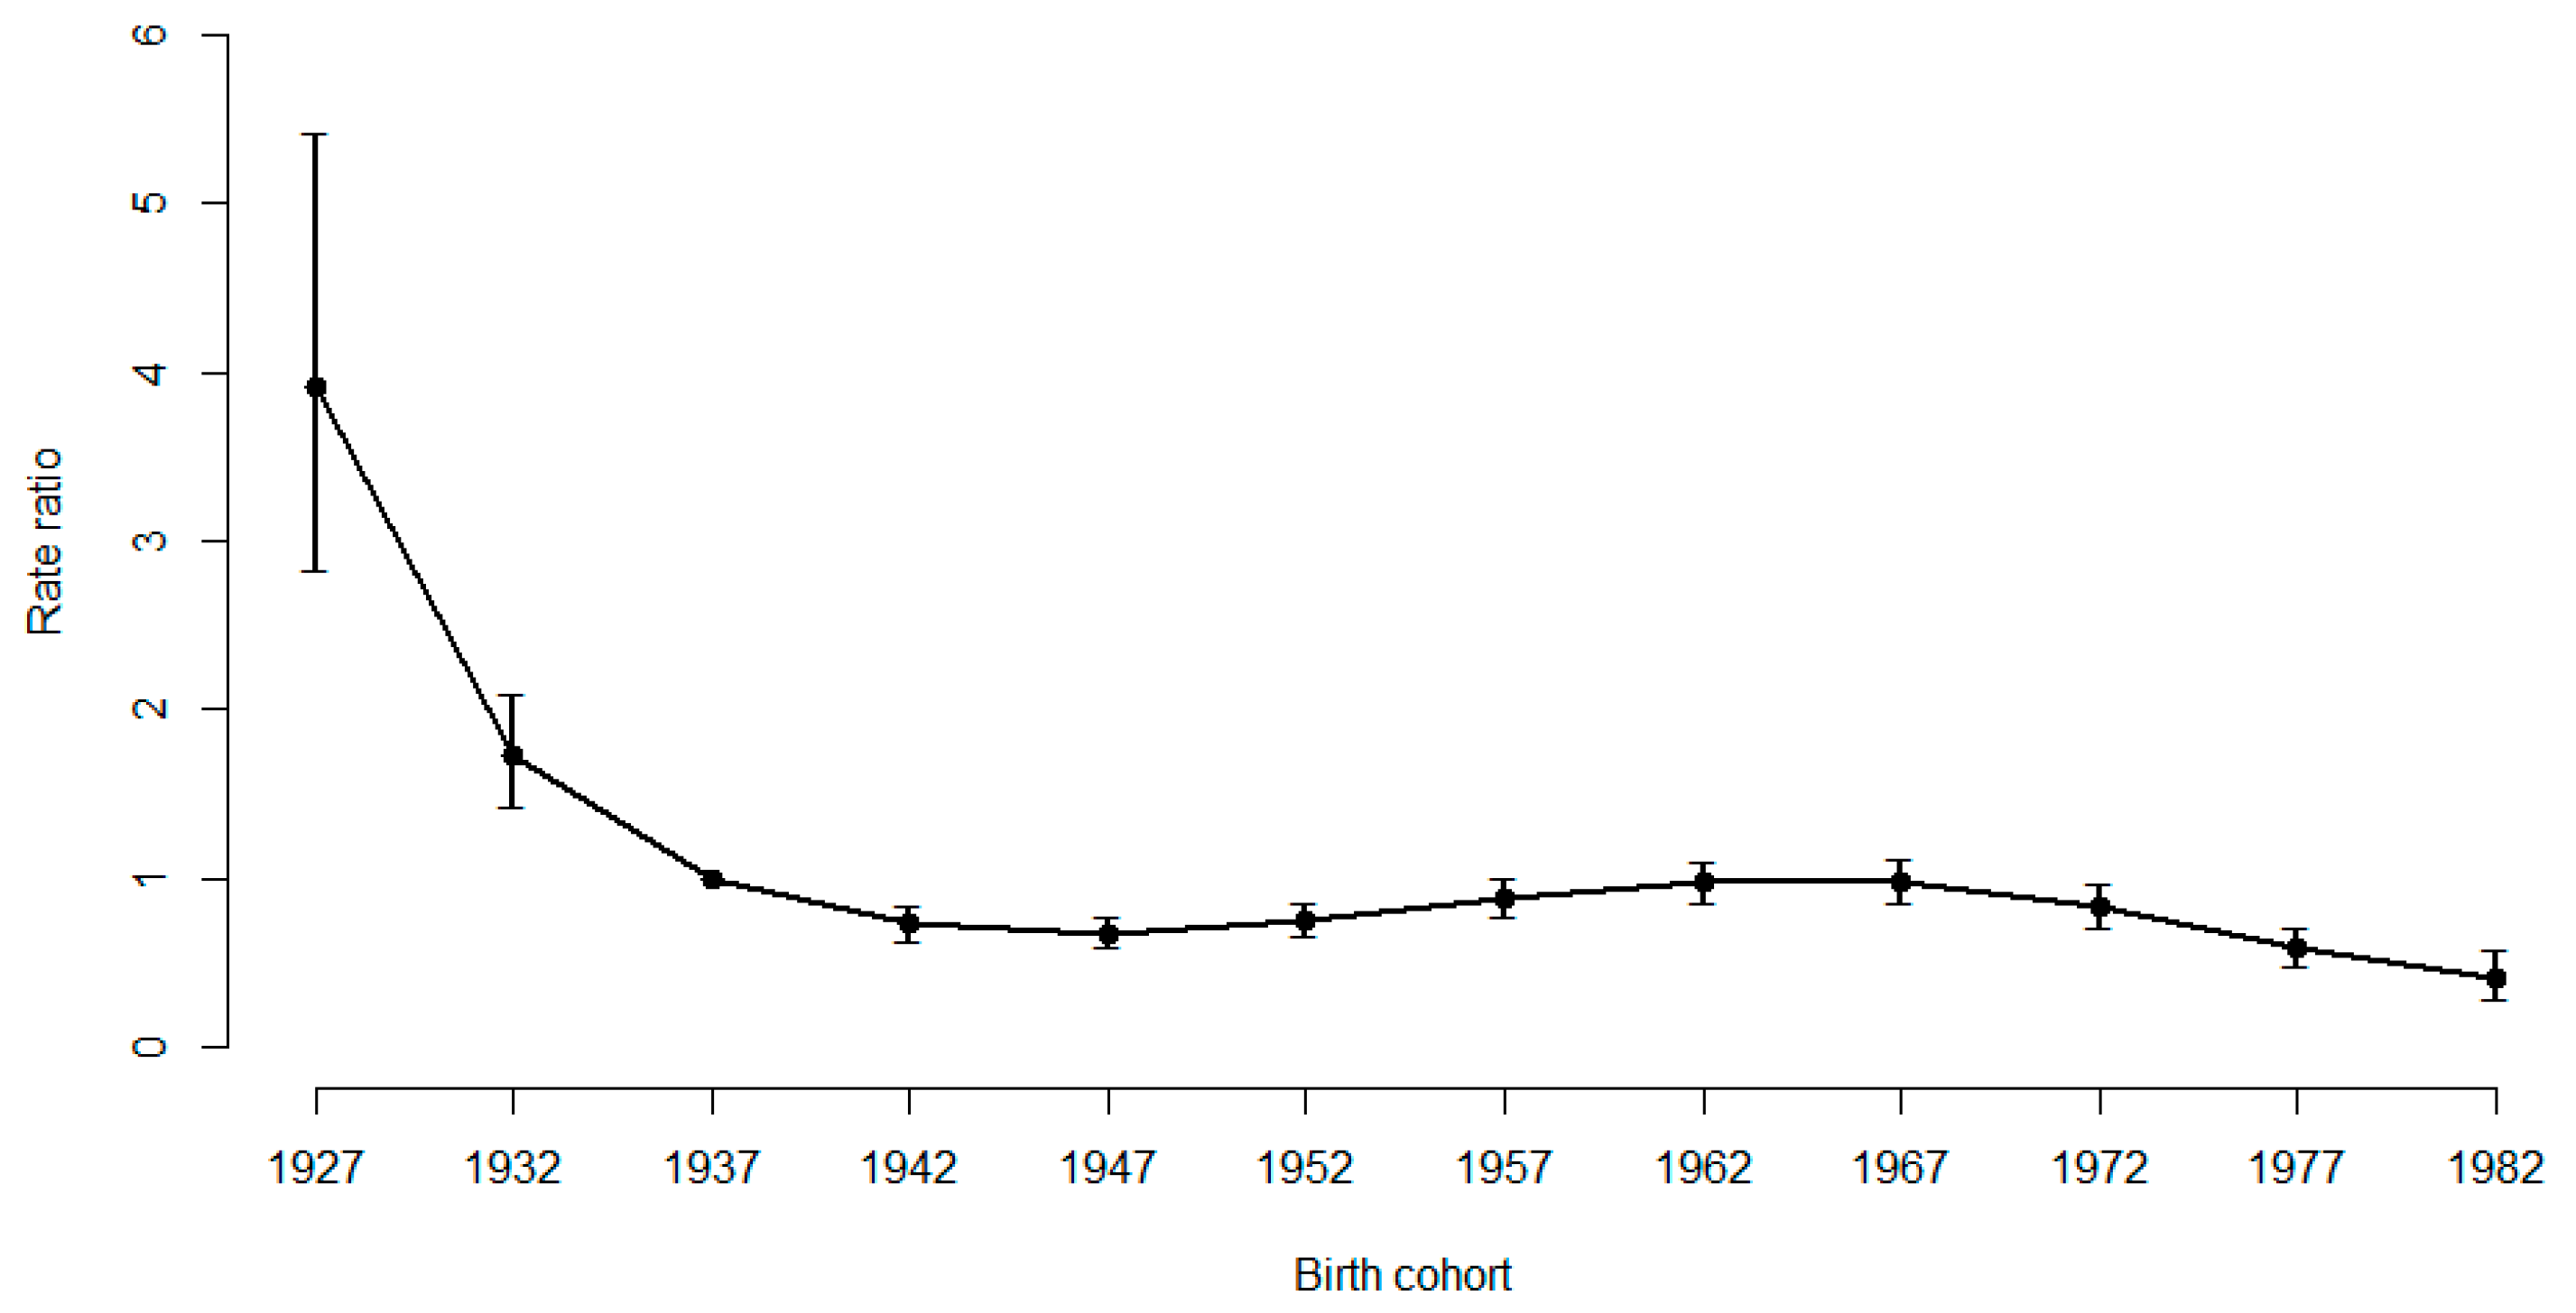
4.5. Cohort Effects
4.6. Limitations
5. Conclusions
Author Contributions
Funding
Acknowledgments
Conflicts of Interest
Appendix A


References
- Lee, R.D.; Mason, A. Fertility, human capital, and economic growth over the demographic transition. Eur. J Popul. 2010, 26, 159–182. [Google Scholar] [CrossRef] [PubMed] [Green Version]
- Brander, J.A.; Dowrick, S. The role of fertility and population in economic growth. J. Popul. Econ. 1994, 7, 1–25. [Google Scholar] [CrossRef]
- Galor, O.; Weil, D.N. The gender gap, fertility, and growth. Am. Econ. Rev. 1996, 86, 374–387. [Google Scholar]
- Basten, S.; Verropoulou, G.A. Re-Interpretation of the ‘Two-child Norm’ in Post-Transitional Demographic Systems: Fertility Intentions in Taiwan. PLoS ONE. 2015, 10, e0135105. [Google Scholar] [CrossRef] [PubMed]
- Haub, C. Taiwan’s Birth Rate Lowest Recorded in History. Available online: https://www.newsecuritybeat.org /2011/01/taiwans-birth-rate-lowest-recorded-in-history/ (accessed on 4 September 2013).
- Hoem, J.M. The statistical theory of demographic rates: A review of current developments (with discussion). Scand. J. Stat. 1976, 3, 169–185. [Google Scholar]
- Hsueh, Y.C.; Anderton, D.L. Temporal dimensions of the fertility transition: An age-period-cohort analysis of frontier fertility. Sociol. Perspect. 1990, 33, 447–464. [Google Scholar] [CrossRef] [PubMed]
- Freedman, R.; Coombs, L.C.; Chang, M.C.; Sun, T.H. Trends in fertility, family size preferences, and practice of family planning: Taiwan, 1965–1973. Stud. Fam. Plan. 1974, 5, 270–288. [Google Scholar] [CrossRef]
- Chang, M.C.; Freedman, R.; Sun, T.H. Trends in fertility, family size preferences, and family planning practice: Taiwan, 1961-80. Stud. Fam. Plan. 1981, 12, 211–228. [Google Scholar] [CrossRef]
- Cheng, K.W. The effect of contraceptive knowledge on fertility: The roles of mass media and social networks. J. Fam. Econ. Issues 2011, 32, 257–267. [Google Scholar] [CrossRef] [PubMed] [Green Version]
- Health Promotion Administration, Ministry of Health and Welfare, Republic of China. Knowledge, Attitude, and Practice of Contraception (1965–2004); Academia Sinica: Taipei, Taiwan, 1994. [Google Scholar]
- Health Promotion Administration, Ministry of Health and Welfare. Taiwan Fertility and Family Survey. Available online: https://www.hpa.gov.tw/Pages/ashx/File.ashx?FilePath=~/File/Attach./1291/File_1373.od (accessed on 12 October 2018).
- Greenberg, B.G.; Wright, J.J.; Sheps, C.G. A technique for analyzing some factors affecting the incidence of syphilis. J. Am. Stat. Assoc. 1950, 45, 373–399. [Google Scholar] [CrossRef]
- Keyes, K.M.; Li, G. A multiphase method for estimating cohort effects in age-period contingency table data. Ann. Epidemiol. 2010, 20, 779–785. [Google Scholar] [CrossRef] [PubMed] [Green Version]
- Tukey, J. Exploratory Data Analysis; Addison-Wesley Publishing Company: Menlo Park, CA, USA, 1977. [Google Scholar]
- Selvin, S. Statistical Analysis of Epidemiologic Data; Oxford University Press: Oxford, UK, 1996; Volume 17. [Google Scholar]
- Tzeng, I.S.; Lee, W.C. Forecasting hepatocellular carcinoma mortality in Taiwan using an age-period-cohort model. Asia Pac. J. Public Health 2015, 27, 65–73. [Google Scholar] [CrossRef] [PubMed]
- Davies, R.B. Hypothesis testing when a nuisance parameter is present only under the alternative. Biometrika 1987, 74, 33–43. [Google Scholar]
- Muggeo, V.M.R. Segmented: An R package to fit regression models with broken-line relationships. R News 2008, 8, 20–25. [Google Scholar]
- Kastner, J. Tiger Throttling Taiwan’s Birth Rate. Asia Times. Available online: http://atimes.com/atimes/China./MA12Ad01.html (accessed on 21 September 2013).
- Freedman, R.; Chang, M.C.; Sun, T.H. Taiwan’s transition from high fertility to below-replacement levels. Stud. Fam. Plan. 1994, 25, 317–331. [Google Scholar] [CrossRef]
- Liang, F.W.; Huang, Y.L.; Wu, M.H.; Lue, H.C.; Chiang, T.L.; Lu, T.H. Child mortality: Taiwan compared with OECD countries. Taiwan J. Public Health 2016, 35, 221–233. [Google Scholar]
- Babalola, S.; Oyenubi, O.; Speizer, I.S.; Cobb, L.; Akiode, A.; Odeku, M. Factors affecting the achievement of fertility intentions in urban Nigeria: Analysis of longitudinal data. BMC Public Health 2017, 17, 942. [Google Scholar] [CrossRef] [PubMed] [Green Version]
- Rabbi, A.M.F.; Kabir, M. Explaining fertility transition of a developing country: An analysis of quantum and tempo effect. Fertil. Res. Pract. 2015, 1, 4. [Google Scholar] [CrossRef] [PubMed] [Green Version]
- Schwartz, N.E. Nutritional knowledge, attitudes, and practices of high school graduates. J. Am. Diet. Assoc. 1975, 66, 28–31. [Google Scholar] [PubMed]
- Lee, R.D.; Lee, S.H.; Mason, A. Charting the economic lifecycle. In Population Aging, Human Capital Accumulation, and Productivity Growth, a Supplement to Population and Development Review; Prskawetz, A., Bloom, D.E., Lutz, W., Eds.; Population Council Press: New York, NY, USA, 2008; Volume 34, pp. 208–237. [Google Scholar]
- Mason, A.; Lee, R.; Tung, A.C.; Lai, M.S.; Miller, T. Population aging and intergenerational transfers: Introducing age into national income accounts. In Developments in the Economics of Aging; Wise, D., Ed.; National Bureau of Economic Research and University of Chicago Press: Chicago, IL, USA, 2009; pp. 89–122. [Google Scholar]
- Clayton, D.; Schifflers, E. Models for temporal variation in cancer rates, II: Age-period-cohort models. Stat. Med. 1987, 6, 469–481. [Google Scholar] [CrossRef] [PubMed]


| Model | Actual Fertility | Desired Fertility | ||||
|---|---|---|---|---|---|---|
| A | AP | APC | A | AP | APC | |
| Age (αi) | ||||||
| 20–26 | REF | REF | REF | REF | REF | REF |
| 27–33 | −0.54 | −0.71 | −0.67 | 0.21 | 0.10 | 0.10 |
| 34–40 | 0.64 | 0.50 | 0.50 | 0.81 | 0.71 | 0.70 |
| 41–47 | 0.81 | 0.65 | 0.67 | 0.79 | 0.69 | 0.68 |
| Period (βj) | ||||||
| 1972–1978 | 0.72 | 0.75 | 0.64 | 0.64 | ||
| 1979–1985 | REF | REF | REF | REF | ||
| 1986–1992 | 1.05 | 1.07 | 1.03 | 1.03 | ||
| 1993–1999 | −0.86 | −0.86 | −0.77 | −0.79 | ||
| 2000–2006 | −0.71 | −0.71 | −0.70 | −0.69 | ||
| Mid-Year of birth (γk) | ||||||
| 1934 | NA | NA | ||||
| 1941 | 0.99 | 1.03 | ||||
| 1948 | 1.01 | 1.01 | ||||
| 1955 | 0.99 | 1.01 | ||||
| 1962 | REF | REF | ||||
| 1969 | 1.00 | 0.99 | ||||
| 1976 | 1.00 | 1.07 | ||||
| 1983 | 1.13 | 1.09 | ||||
| df | 16 | 12 | 5 | 16 | 12 | 5 |
| Deviance | 1600.778 | 27.938 | 21.587 | 740.663 | 10.944 | 4.371 |
| Deviance/df | 100.049 | 2.328 | 4.317 | 46.291 | 0.912 | 0.874 |
| p-Value | <0.0001 | <0.0001 | <0.0001 | <0.0001 | <0.0001 | <0.0001 |
© 2019 by the authors. Licensee MDPI, Basel, Switzerland. This article is an open access article distributed under the terms and conditions of the Creative Commons Attribution (CC BY) license (http://creativecommons.org/licenses/by/4.0/).
Share and Cite
Tzeng, I.-S.; Chen, K.-H.; Lee, Y.L.; Yang, W.-S. Trends and Age-Period-Cohort Effects of Fertility Rate: Analysis of 26,224 Married Women in Taiwan. Int. J. Environ. Res. Public Health 2019, 16, 4952. https://0-doi-org.brum.beds.ac.uk/10.3390/ijerph16244952
Tzeng I-S, Chen K-H, Lee YL, Yang W-S. Trends and Age-Period-Cohort Effects of Fertility Rate: Analysis of 26,224 Married Women in Taiwan. International Journal of Environmental Research and Public Health. 2019; 16(24):4952. https://0-doi-org.brum.beds.ac.uk/10.3390/ijerph16244952
Chicago/Turabian StyleTzeng, I-Shiang, Kuo-Hu Chen, Yungling L. Lee, and Wen-Shan Yang. 2019. "Trends and Age-Period-Cohort Effects of Fertility Rate: Analysis of 26,224 Married Women in Taiwan" International Journal of Environmental Research and Public Health 16, no. 24: 4952. https://0-doi-org.brum.beds.ac.uk/10.3390/ijerph16244952