Psychomotor Limitations of Overweight and Obese Five-Year-Old Children: Influence of Body Mass Indices on Motor, Perceptual, and Social-Emotional Skills


 ,
,
Abstract
:1. Introduction
2. Materials and Methods
2.1. Participants
2.2. Instruments
2.3. Procedure
2.4. Design and Data Analysis
3. Results
3.1. Analysis of Motor Skills in the Sample of Girls
3.2. Analysis of Motor Skills in the Sample of Boys
3.3. Analysis of Perceptual Skills in the Sample of Girls
3.4. Analysis of Perceptual Skills in the Sample of Boys
3.5. Analysis of Social-Emotional Skills
4. Discussion
5. Conclusions
Author Contributions
Funding
Acknowledgments
Conflicts of Interest
Appendix A
Motor Skills in Girls
- -
- Normal Weight-Malnutrition: U = 1566.5; Z = −2.534; p = 0.011; r = 0.169
- -
- Overweight-Malnutrition: U = 327.5; Z = −2.515; p = 0.012; r = 0.304
- -
- Obesity-Malnutrition: U = 69.5; Z = −3.592; p = 0.000; r = 0.205
- -
- Obesity-Moderate malnutrition: U = 101; Z = −2.448; p = 0.014; r = 0.387
- -
- Obesity-Normal weight: U = 888.5; Z = −3.344; p = 0.001; r = 0.227
- -
- Obesity-Malnutrition: U = 104.5; Z = −2.512; p = 0.012; r = 0.397
- -
- Overweight-Malnutrition: U = 324.5; Z = −2.700; p = 0.007; r = 0.327
- -
- Overweight-Normal weight: U = 3654; Z = −2.112; p = 0.035; r = 0.134
- -
- Obesity-Malnutrition: U = 63; Z = −3.833; p = 0.000; r = 0.606
- -
- Obesity-Normal weight: U = 848; Z = −3.660; p = 0.000; r = 0.248
- -
- Overweight-Malnutrition: U = 249.5; Z = −3.558; p = 0.000; r = 0.431
- -
- Overweight-Moderate malnutrition: U = 246; Z = −3.395; p = 0.001; r = 0.414
- -
- Overweight-Normal weight: U = 1054.5; Z = −2.685; p = 0.007; r = 0.182
- -
- Obesity- Malnutrition: U = 71.5; Z = −3.515; p = 0.000; r = 0.555
- -
- Obesity-Normal weight: U = 3050; Z = −3.480; p = 0.001; r = 0.222
- -
- Moderate Malnutrition-Malnutrition: U = 147.5; Z = −2.529; p = 0.011; r = 0.377
- -
- Normal Weight-Malnutrition: U = 1683; Z = −2.198; p = 0.028; r = 0.25
- -
- Overweight-Malnutrition: U = 246; Z = −3.588; p = 0.000; r = 0.435
- -
- Overweight-Normal weight: U = 3228.5; Z = −3.036; p = 0.002; r = 0.193
- -
- Obesity-Malnutrition: U = 61.5; Z = −3.778; p = 0.000; r = 0.597
- -
- Obesity-Normal weight: U = 1040; Z = −2.733; p = 0.006; r = 0.185.
Motor Skills in Boys
- -
- Overweight-Moderate malnutrition: U = 570; Z = −2.574; p = 0.010; r = 0.282
- -
- Overweight-Normal weight: U = 3601; Z = −2.927; p = 0.003; r = 0.182
- -
- Obesity-Malnutrition: U= 410; Z = −3.625; p = 0.000; r = 0.497
- -
- Obesity-Moderate malnutrition: U = 198.5; Z = −3.219; p = 0.001; r = 0.408
- -
- Obesity-Normal Weight: U = 2780; Z = −4.009; p = 0.000; r = 0.252
Perceptive Skills in Girls
- -
- Overweight-Malnutrition: U = 341.5; Z = −2.093; p = 0.036; r = 0.255
- -
- Overweight-Normal weight: U = 3001; Z = −3.673; p = 0.000; r = 0.234
- -
- Obesity-Malnutrition: U = 327.5; Z = −2.515; p = 0.012; r = 0.304
- -
- Obesity-Moderate malnutrition: U = 94; Z = −2.694; p = 0.008; r = 0.431
- -
- Obesity-Normal weight: U = 873.5; Z = −3.517; p = 0.000; r = 0.238
- -
- Overweight-Malnutrition: U = 350; Z = −2.551; p = 0.011; r = 0.309
- -
- Overweight-Normal weight: U = 93.5; Z = −3.281; p = 0.004; r = 0.518
- -
- Obesity-Malnutrition: U = 3750; Z = −2.083; p = 0.037; r = 0.133
- -
- Obesity-Normal weight: U = 1060; Z = −3.080; p = 0.002; r = 0.209
- -
- Overweight-Malnutrition: U = 308.5; Z = −2.793; p = 0.005; r = 0.338
- -
- Overweight-Normal weight: U = 113; Z = −2.359; p = 0.024; r = 0.372
- -
- Obesity-Malnutrition: U = 2920.5; Z = −3.895; p = 0.035; r = 0.248
- -
- Overweight-Normal weight: U = 1675; Z = −2.152; p = 0.031; r = 0.144
- -
- Obesity-Normal weight: U = 3220; Z = −3.004; p = 0.003; r = 0.191
- -
- Overweight-Normal weight: U = 3044; Z = −3.822; p = 0.000; r = 0.244
Perceptive Skills in Boys
- -
- Overweight-Malnutrition: U = 592.5; Z = −2.440; p = 0.015; r = 0.268
- -
- Overweight-Normal weight: U = 3844.5; Z = −2.473; p = 0.013; r = 0.154
- -
- Obesity-Malnutrition: U = 592.5; Z = −2.440; p = 0.015; r = 0.268
- -
- Overweight-malnutrition: U = 333.5; Z = −4.371; p = 0.000; r = 0.491
- -
- Obesity-Malnutrition: U = 445; Z = −3.707; p = 0.000; r = 0.406
References
- Gil-Madrona, P.; Honrubias, C.; Rodenas, J.; Llanos, M. Motor Skills in Childhood and Its Development from an Animated Physical Education: Theory and Practice; Nova Science Publishers Inc.: New York, NY, USA, 2018; ISBN 978-1536138818. [Google Scholar]
- Bakken, L.; Brown, N.; Downing, B. Early childhood education: The long-term benefits. J. Res. Child. Educ. 2017, 31, 255–269. [Google Scholar] [CrossRef]
- Han, A.; Fu, A.; Cobley, S.; Sanders, R.H. Effectiveness of exercise intervention on improving fundamental movement skills and motor coordination in overweight/obese children and adolescents: A systematic review. J. Sci. Med. Sport 2018, 21, 89–102. [Google Scholar] [CrossRef] [PubMed]
- Terrón, M.; Queralt, A.; Molina, J.; Martínez, V. Ecological correlates of Spanish preschoolers’ physical activity during school recess. Eur. Phy. Educ. Rev. 2017. [Google Scholar] [CrossRef]
- Carducci, A.; Casini, B.; Donzelli, G.; Verani, M.; Bruni, B.; Ceretti, E.; Zani, C.; Carraro, E.; Bonetta, S.; Bagordo, F.; et al. Improving awareness of health hazards associated with air pollution in primary school children: Design and test of didactic tools. Appl. Environ. Educ. Commun. 2016, 15, 247–260. [Google Scholar] [CrossRef]
- Sanz-Arazuri, E.; Alonso-Ruiz, R.A.; Valdemoros, M.Á.; Ponce de León, A. Validación de un cuestionario que analiza cómo trabaja el profesorado de la etapa infantil la educación para la salud desde el ámbito motor. Rev. Iber. Diagn. Eval. 2013, 1, 9–34. [Google Scholar]
- Gil-Madrona, P.; Jordan, O.R.C.; Suarez, A.D.; Navarro, A.L. La Educacion Fisica en su contribución al proceso formativo de la Educacion Infantil. Rev. Educ. 2006, 339, 217–224. [Google Scholar]
- Ponce de León, A.; Alonso, R.; Fraile, A. La Educación Motriz Para Niños de 0 a 6 Años; Biblioteca Nueva: Madrid, Spain, 2009; ISBN 9788497429689. [Google Scholar]
- Ponce de León, A. Motricidad en Educacion Infantil; CCS Editorial: Madrid, Spain, 2010; ISBN 9788498424522. [Google Scholar]
- Costa, H.J.T.; Barcala-Furelos, R.; Abelairas-Gomez, C.; Arufe-Giraldez, V. The influence of a structured physical education plan on preschool children’s psychomotor development profiles. Australas. J. Early Child. 2015, 40, 68–77. [Google Scholar]
- Valdemoros, M.A.; Ponce de León, A.; Sanz-Arazuri, E.; Ramos-Echazarreta, R. El valor de la salud en las experiencias de ocio físico-deportivo de jóvenes y adolescentes: Conceptualización y estado de la cuestión. Contex. Educat. Rev. Educ. 2007, 10, 117–132. [Google Scholar]
- Cardeal, C.M.; Pereira, L.A.; Silva, P.F.; França, N.M. Efeito de um programa escolar de estimulação motora sobre desempenho da função executiva e atenção em crianças. Motri 2013, 9, 44–56. [Google Scholar] [CrossRef]
- Chaddock-Heyman, L.; Erickson, K.I.; Voss, M.W.; Knecht, A.M.; Pontifex, M.B.; Castelli, D.M. The effects of physical activity on functional MRI activation associated with cognitive control in children: A randomized controlled intervention. Front. Hum. Neurosci. 2013, 7, 72. [Google Scholar] [CrossRef]
- Gil-Madrona, P.; Contreras, O.R.; Roblizo, M.J.; Gomez, I. Potencial pedagógico de la educación física en la educación infantil: Atributos y convicciones. Infanc. Aprend. 2008, 31, 165–178. [Google Scholar] [CrossRef]
- Gil-Madrona, P.; Contreras-Jordan, O.R.; Villora-Gómez, S. Justificación de la educación física en la educación infantil. Educ. Educador. 2008, 11, 155–177. [Google Scholar]
- Schonhaut, B.L.; Rojas, N.P.; Kaempffer, R.A.M. Factores de riesgo asociados a déficit del desarrollo psicomotor en preescolares de nivel socioeconómico bajo: Comuna urbano rural, Región Metropolitana. Rev. Chil. Pediatr. 2005, 76, 589–598. [Google Scholar] [CrossRef]
- Garibotti, G.; Comar, H.; Vasconi, C.; Giannini, G.; Pittau, C. Child psychomotor development and its relationship with socio-demographic and family stimulation factors in children from Bariloche, Argentina. Arch. Argent. Pediatr. 2013, 111, 384–390. [Google Scholar] [CrossRef] [PubMed]
- Handal, A.J.; Lozoff, B.; Breilh, J.; Harlow, S.D. Sociodemographic and nutritional correlates of neurobehavioral development: A study of young children in a rural region of Ecuador. Rev. Panam. Salud. Publica. 2007, 21, 292–300. [Google Scholar] [CrossRef] [PubMed]
- Lahno, O.; Hanjukova, O.; Cherniavska, O. Evaluation of the effectiveness of integrated psychomotor development of children in the age from 2 to 4. J. Phys. Educ. Sport 2015, 15, 793–799. [Google Scholar] [CrossRef]
- Teixeira, H.; Abelairas, C.; Arufe, B.; Pazos, J.; Barcala, F. Influence of a physical education plan on psychomotor development profiles of preschool children. J. Hum. Sport Exerc. 2015, 10, 126–140. [Google Scholar] [CrossRef]
- Chaddock, L. The Effects of Physical Activity on the Brain and Cognition During Childhood. Ph.D. Thesis, University of Illinois at Urbana-Champaingn, Champaign, IL, USA, 2012. [Google Scholar]
- Grassi, T.; De Donno, A.; Bagordo, F.; Serio, F.; Piscitelli, P.; Ceretti, E.; Zani, C.; Viola, G.; Villarini, M.; Moretti, M.; et al. Socio-Economic and Environmental Factors Associated with Overweight and Obesity in Children Aged 6–8 Years Living in Five Italian Cities (the MAPEC_LIFE Cohort). Int. J. Environ. Res. Public Health 2016, 13, 1002. [Google Scholar] [CrossRef]
- Sahoo, K.; Sahoo, B.; Choudhury, A.; Sofi, N.; Kumar, R.; Bhadoria, A.S. Childhood obesity: Causes and consequences. J. Family Med. Prim. Care 2015, 4, 187. [Google Scholar] [CrossRef] [Green Version]
- Villarini, M.; Levorato, S.; Salvatori, T.; Ceretti, E.; Bonetta, S.; Carducci, A.; Grassi, T.; Vannini, S.; Donato, F.; Venari, M.; et al. Buccal micronucleus cytome assay in primary school children: A descriptive analysis of the MAPEC_LIFE multicenter cohort study. Int. J. Hyg. Environ. Health 2018, 221, 883–892. [Google Scholar] [CrossRef]
- Méndez-Ruíz, M.; Estay-Carvajal, J.; Calzadilla-Nuñez, A.; Durán-Agüero, S.; Díaz-Narváez, V.P. Comparison of psychomotor development in preschool Chilean normal weight versus overweight/obesity. Nutr. Hosp. 2015, 32, 151–155. [Google Scholar] [CrossRef]
- Gupta, N.; Goel, K.; Shah, P.; Misra, A. Childhood Obesity in Developing Countries: Epidemiology, Determinants, and Prevention. Endoc. Rev. 2012, 33, 48–70. [Google Scholar] [CrossRef] [PubMed] [Green Version]
- Liria, R. Consecuencias de la obesidad en el niño y el adolescente: Un problema que requiere atención. Rev. Perú. Med. Exp. Salud Pública 2012, 29, 357–360. [Google Scholar] [CrossRef] [PubMed]
- Lobstein, T.; Baur, L.; Uauy, R. Obesity in children and young people: A crisis in public health. Obes. Rev. 2004, 5, 4–85. [Google Scholar] [CrossRef] [PubMed]
- Contreras, O.R.; Gil-Madrona, P.; García, L.M.; Fernández, J.G.; Pastor, J.C. Incidencia de un programa de Educación Física en la percepción de la propia imagen corporal. Rev. Educ. 2012, 357, 281–303. [Google Scholar] [CrossRef]
- Black, I.E.; Menzel, N.N.; Bungum, T.J. The Relationship Among Playground Areas and Physical Activity Levels in Children. J. Pediat. Health Care 2015, 29, 156–168. [Google Scholar] [CrossRef] [PubMed]
- Peralta, M.; Marques, A.; Martins, J.; Sarmiento, H.; Carreiro da Costa, F. Effects of obesity on perception of ability and perception of body image in Portuguese children and adolescents. J. Hum. Sport Exerc. 2016, 11, 367–375. [Google Scholar] [CrossRef]
- Utesch, T.; Dreiskämper, D.; Naul, R.; Geukes, K. Understanding physical (in-) activity, overweight, and obesity in childhood: Effects of congruence between physical self-concept and motor competence. Sci. Rep. 2018, 8, 5908. [Google Scholar] [CrossRef]
- Peyre, H.; Hoertel, N.; Bernard, J.Y.; Rouffignac, C.; Forhan, A.; Taine, M.; Heude, B.; Ramus, F.; EDEN Mother–Child Cohort Study Group. Sex differences in psychomotor development during the preschool period: A longitudinal study of the effects of environmental factors and of emotional, behavioral, and social functioning. J. Exp. Child Psychol. 2019, 178, 369–384. [Google Scholar] [CrossRef]
- Flatters, I.; Hill, L.J.B.; Williams, J.H.G.; Barber, S.E.; Mon-Williams, M. Manual control age and sex differences in 4 to 11 year old children. PLoS ONE 2014, 9, e88692. [Google Scholar] [CrossRef]
- Toivainen, T.; Papageorgiou, K.A.; Tosto, M.G.; Kovas, Y. Sex differences in non-verbal and verbal abilities in childhood and adolescence. Intelligence 2017, 64, 81–88. [Google Scholar] [CrossRef] [Green Version]
- Town Hall of Albacete. List of Public and Private Schools in the Province of Albacete. Available online: http://www.albacete.es/es/webs-municipales/educacion/primaria-y-secundaria/colegios-publicos-y-concertados (accessed on 17 July 2017).
- Food and Nutrition Technical Assistance (FANTA III Project). Tablas de IMC y Tablas de IMC Para la Edad, de Niños(as) y Adolescentes de 5 a 18 Años de Edad y Tablas de IMC Para Adultos(as) no Embarazadas, no Lactantes ≥ 19 Años de Edad; Food and Nutrition Technical Assistance: Washington, WA, USA, 2013. [Google Scholar]
- Romero, S.J.; Ordóñez, X.G.; Gil-Madrona, P. Development of the Checklist of Psychomotor Activities for 5- to 6-Year-Old Children. Percept. Mot. Skills 2018, 125, 1070–1092. [Google Scholar] [CrossRef] [PubMed]
- León, O.G.; Montero, I. Métodos de Investigación en Psicología y Educación: Las Tradiciones Cuantitativa y Cualitativa, 4th ed.; McGraw-Hill: Madrid, Spain, 2015; ISBN 978-84-486-0838-5. [Google Scholar]
- IBM Corp. IBM SPSS Statistics for Windows, Version 20.0; IBM Corp: Armonk, NY, USA, 2011; ISBN 10: 128508601. [Google Scholar]
- Catenassi, F.Z.; Marques, I.; Bastos, C.B.; Basso, L.; Ronque, V.E.R.; Gerage, A.M. Relação entre índice de massa corporal e habilidade motora grossa em crianças de quatro a seis anos. Rev. Brasil Med. do Esporte 2007, 13, 227–230. [Google Scholar] [CrossRef] [Green Version]
- Shumway-Cook, A.; Woollacott, M. Motor Control: Translating Research into Clinical Practice; Lippincott Williams & Wilkins: Philadelphia, PA, USA, 2001; ISBN 9781608310180. [Google Scholar]
- Bucco-dos Santos, L.; Zubiaur-Gonzalez, M. Desarrollo de las habilidades motoras fundamentales en función del sexo y del índice de masa corporal en escolares. Cuad. Psic. Dep. 2013, 13, 63–72. [Google Scholar] [CrossRef] [Green Version]
- Molina, J.M.; Som, J.J.; López, A.; Zabala, M. Asociaciones entre el IMC, la realización de actividad física y la calidad de vida en adolescentes. Cult. Cienc. Dep. 2009, 4, 159–165. [Google Scholar]
- Laguna-Nieto, M.; Lara-Hernández, M.T.; Aznar-Laín, S. Patrones de Actividad Física en función del género y los niveles de obesidad en población infantil española. Estudio EYHS. Rev. Psic. Dep. 2011, 20, 621–636. [Google Scholar]
- Aleixo, A.A.; Guimarães, E.L.; Pereira, K.; Walsh, I.A.P. Influence of overweight and obesity on posture, overall praxis and balance in schoolchildren. Rev. Bras. Crescimento Desenvolv. Hum. 2012, 22, 239–245. [Google Scholar]
- Nascimiento, R.; Rosso, M. Influência do sobrepeso/obesidade na coordenação motora ampla de alunos das séries finais do ensino fundamental da cidade de Cruz Alta, RS. Rev. Digital 2010, 15. [Google Scholar]
- Cano-Cappelacci, M.; Leyton-Artigas, F.; Oyarzún-Alfaro, T.; Sepúlveda-Muñoz, C. Relación entre estado nutricional, nivel de actividad física y desarrollo psicomotor en preescolares. Nutr. Hosp. 2014, 30, 1313–1318. [Google Scholar] [CrossRef]
- Almagià, A.; Curilem, C.; Fernández, M.; Fernández, R.; Jiménez, C.; Yuing, T. Relación Entre Escoliosis, Sexo y Lateralidad Manual en una Muestra de Escolares. Int. J. Morphol. 2015, 33, 24–30. [Google Scholar] [CrossRef] [Green Version]
- Mayolas, M.C.; Reverter, J. Influencia de la edad y el género en los fenotipos y coeficientes de lateralidad en niños de 6 a 15 años. Apunt. Educ. Fís. Deport. 2015, 2, 11–18. [Google Scholar] [CrossRef]
- Brum, K.O.; Neto, F.R. O perfil motor de escolares obesos. Rev. Digital 2009, 14. [Google Scholar]


| Age (Y:M) | Malnutrition < −3SD (BMI) | Moderate Malnutrition ≥ −3a < −2SD (BMI) | Normal ≥ −2a ≤ +1SD (BMI) | Overweight > +1a ≤ +2SD (BMI) | Obesity > +2SD (BMI) | |
|---|---|---|---|---|---|---|
| Boys | 5:1 | Less than 12.1 | 12.1–12.9 | 13.0–16.6 | 16.7–18.3 | 18.4 or more |
| 5:6 | Less than 12.1 | 12.1–12.9 | 13.0–16.7 | 16.8–18.4 | 18.5 or more | |
| N | 36 | 19 | 210 | 47 | 43 | |
| Girls | 5:1 | Less than 11.8 | 11.8–12.6 | 12.7–16.9 | 17–18.9 | 19 or more |
| 5:6 | Less than 11.7 | 11.7–12.6 | 12.7–16.9 | 17–19 | 19.1 or more | |
| N | 23 | 22 | 200 | 45 | 17 |
| Variable | Item/Task |
|---|---|
| Laterality | Grasps objects with both hands Grasps objects with the left hand Grasps objects with the right hand Hits objects with the left leg Hits objects with the right leg Throws objects with the left hand Throws objects with the right hand |
| Dynamic Coordination | Is able to roll on a surface Jumps with both feet together Jumps with one footIs able to move side-ways Is able to walk backwards Runs freely without difficulty |
| Tonic Postural Control | Moves following the indicated rhythm Runs and is able to stop at a signal Lies down flat on the back |
| Motor Execution | Is able to use the materials correctly Is able to jump over obstacles Is able to circle around obstacles |
| Balance | Maintains balance by walking in a straight line Maintains balance by walking along a curved line Maintains balance by walking on a trestle Maintains balance by walking on a bench Is able to maintain a balanced posture |
| Respiratory Control | Is able to hold their breath until indicated Is able to inhale for a period of time Is able to exhale according to instructions |
| Body Image | Recognizes body parts (hands, feet, head) Recognizes the function of body parts Recognizes own image in the mirror and in photographs Imitates movements made by the teacher or classmates |
| Walks alternating arms and legs Climbs monkey bars alternating hands and legs Is able to use isolated parts of the body when instructed | |
| Visual-Motor Coordination | Is able to manage tasks that require fine motor skills Is able to cut paper Is able to mold plasticine Catches objects in the air with both hands Throws a ball in the indicated direction Is able to bounce a ball |
| Spatial Orientation | Knows how to position themselves with respect to an object Performs a task in the space intended for it |
| Emotional Control | Expresses themselves in an appropriate way, adapting to different contexts Expresses their emotions and feelings Tries to control disproportionate expression of emotions Shows confidence when performing activities that they are capable of doing Shows interest and desire to improve Concerned about classmates who need help to perform tasks |
| Social Relationships | Establishes relationships according to classroom norms Shares material with classmates Respects the teacher’s instructions Shows a positive attitude when playing in a group Gets angry when loses in a game |
| Kruskal-Wallis Test | Classification | Descriptive Statistics | |||||||
|---|---|---|---|---|---|---|---|---|---|
| H | df | p | BMI | Mean (SD) | Range | Me | G1 | G2 | |
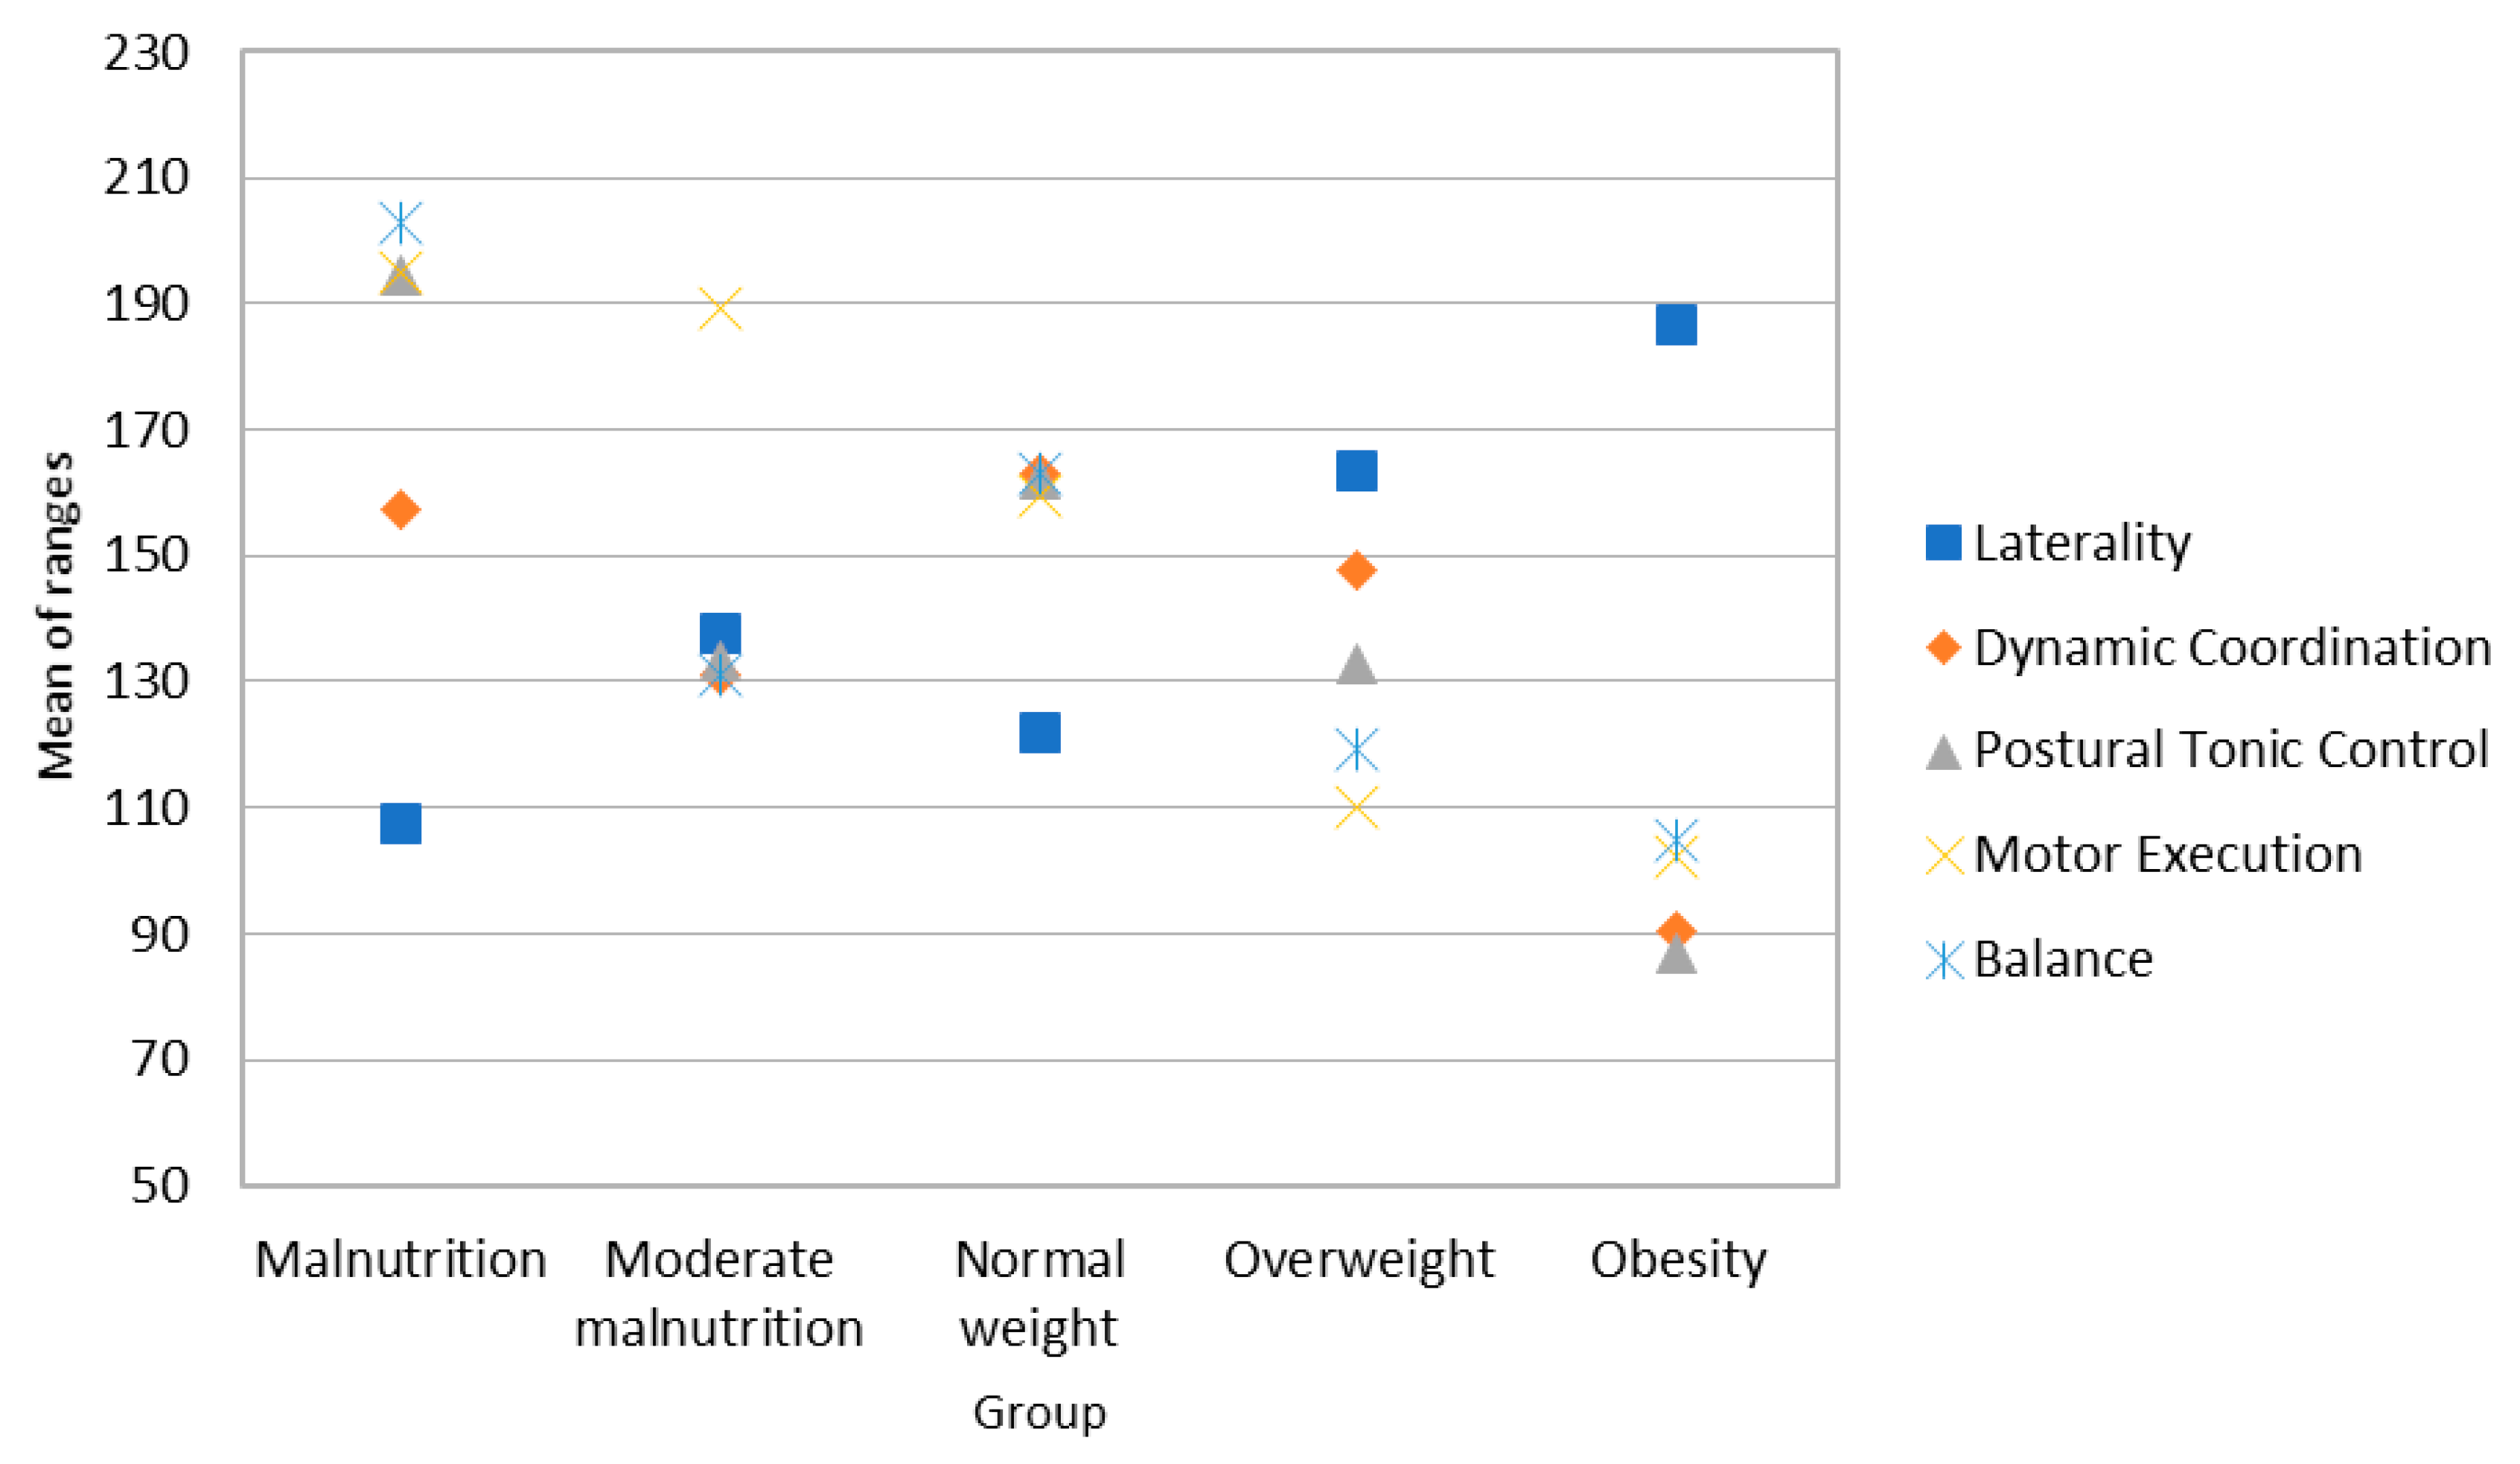
| LAT | 12.646 | 4 | 0.013 * | Malnutrition | 23.96 (3.52) | 107.35 | 23 | 1.892 | 4.262 |
| Moderate malnutrition | 25.14 (4.13) | 137.36 | 24 | 0.161 | −1.194 | ||||
| Normal weight | 27.14 (5.00) | 121.80 | 25 | 0.330 | −1.386 | ||||
| Overweight | 27.33 (5.16) | 163.29 | 27 | −0.127 | −1.125 | ||||
| Obesity | 28.53 (3.06) | 186.47 | 29 | −0.704 | 0.052 | ||||
| DC | 13.022 | 4 | 0.011 * | Malnutrition | 26.87 (3.95) | 157.52 | 27 | −1.951 | 3.915 |
| Moderate malnutrition | 26.32 (2.93) | 131.25 | 26 | −0.195 | −0.647 | ||||
| Normal weight | 27.41 (2.89) | 162.91 | 29 | −1.260 | −1.201 | ||||
| Overweight | 26.36 (4.36) | 147.78 | 29 | −1.158 | 1.034 | ||||
| Obesity | 25.24 (2.36) | 90.32 | 25 | −0.739 | −0.572 | ||||
| TPC | 22.596 | 4 | 0.000 * | Malnutrition | 13.79 (2.11) | 194.57 | 15 | −2.762 | 8.405 |
| Moderate malnutrition | 13.89 (1.51) | 133.30 | 14 | −0.887 | −0.036 | ||||
| Normal weight | 13.93 (1.47) | 162.07 | 15 | −1.690 | 3.375 | ||||
| Overweight | 14.26 (1.68) | 132.86 | 14 | −1.096 | 0.362 | ||||
| Obesity | 13.55 (1.47) | 86.94 | 13 | −0.519 | −0.564 | ||||
| ME | 27.708 | 4 | 0.000 * | Malnutrition | 13.87 (1.86) | 195.04 | 15 | −1.953 | 3.737 |
| Moderate malnutrition | 13.82 (1.65) | 189.23 | 15 | −1.495 | 2.052 | ||||
| Normal weight | 13.16 (1.98) | 159.67 | 14 | −0.790 | −0.303 | ||||
| Overweight | 11.87 (2.33) | 110.12 | 12 | −0.383 | −0.278 | ||||
| Obesity | 12.00 (1.36) | 102.38 | 12 | 0.166 | −0.082 | ||||
| BAL | 23.643 | 4 | 0.000 * | Malnutrition | 23.04 (3.73) | 203.04 | 25 | −2.410 | 6.183 |
| Moderate malnutrition | 20.36 (4.11) | 131.09 | 20 | −0.513 | −0.419 | ||||
| Normal weight | 21.78 (3.41) | 162.84 | 20 | −0.783 | −0.011 | ||||
| Overweight | 20.18 (3.35) | 119.34 | 20 | −0.116 | −0.726 | ||||
| Obesity | 19.82 (2.09) | 105.00 | 20 | −0.426 | 0.584 | ||||
| SUM | 12.345 | 4 | 0.015 * | Malnutrition | 102.00 (9.70) | 158.98 | 104 | −1.894 | 4.451 |
| Moderate malnutrition | 99.18 (8.57) | 124.27 | 100.5 | −0.939 | 1.078 | ||||
| Normal weight | 103.41 (10.28) | 164.79 | 105 | −0.512 | 0.317 | ||||
| Overweight | 99.02 (12.86) | 136.22 | 103 | −1.215 | 1.526 | ||||
| Obesity | 98.59 (6.06) | 105.82 | 100 | −0.843 | 2.035 | ||||
| Kruskal-Wallis Test | Classification | Descriptive Statistics | |||||||
|---|---|---|---|---|---|---|---|---|---|
| H | df | p | BMI | Mean (SD) | Range | Me | G1 | G2 | |
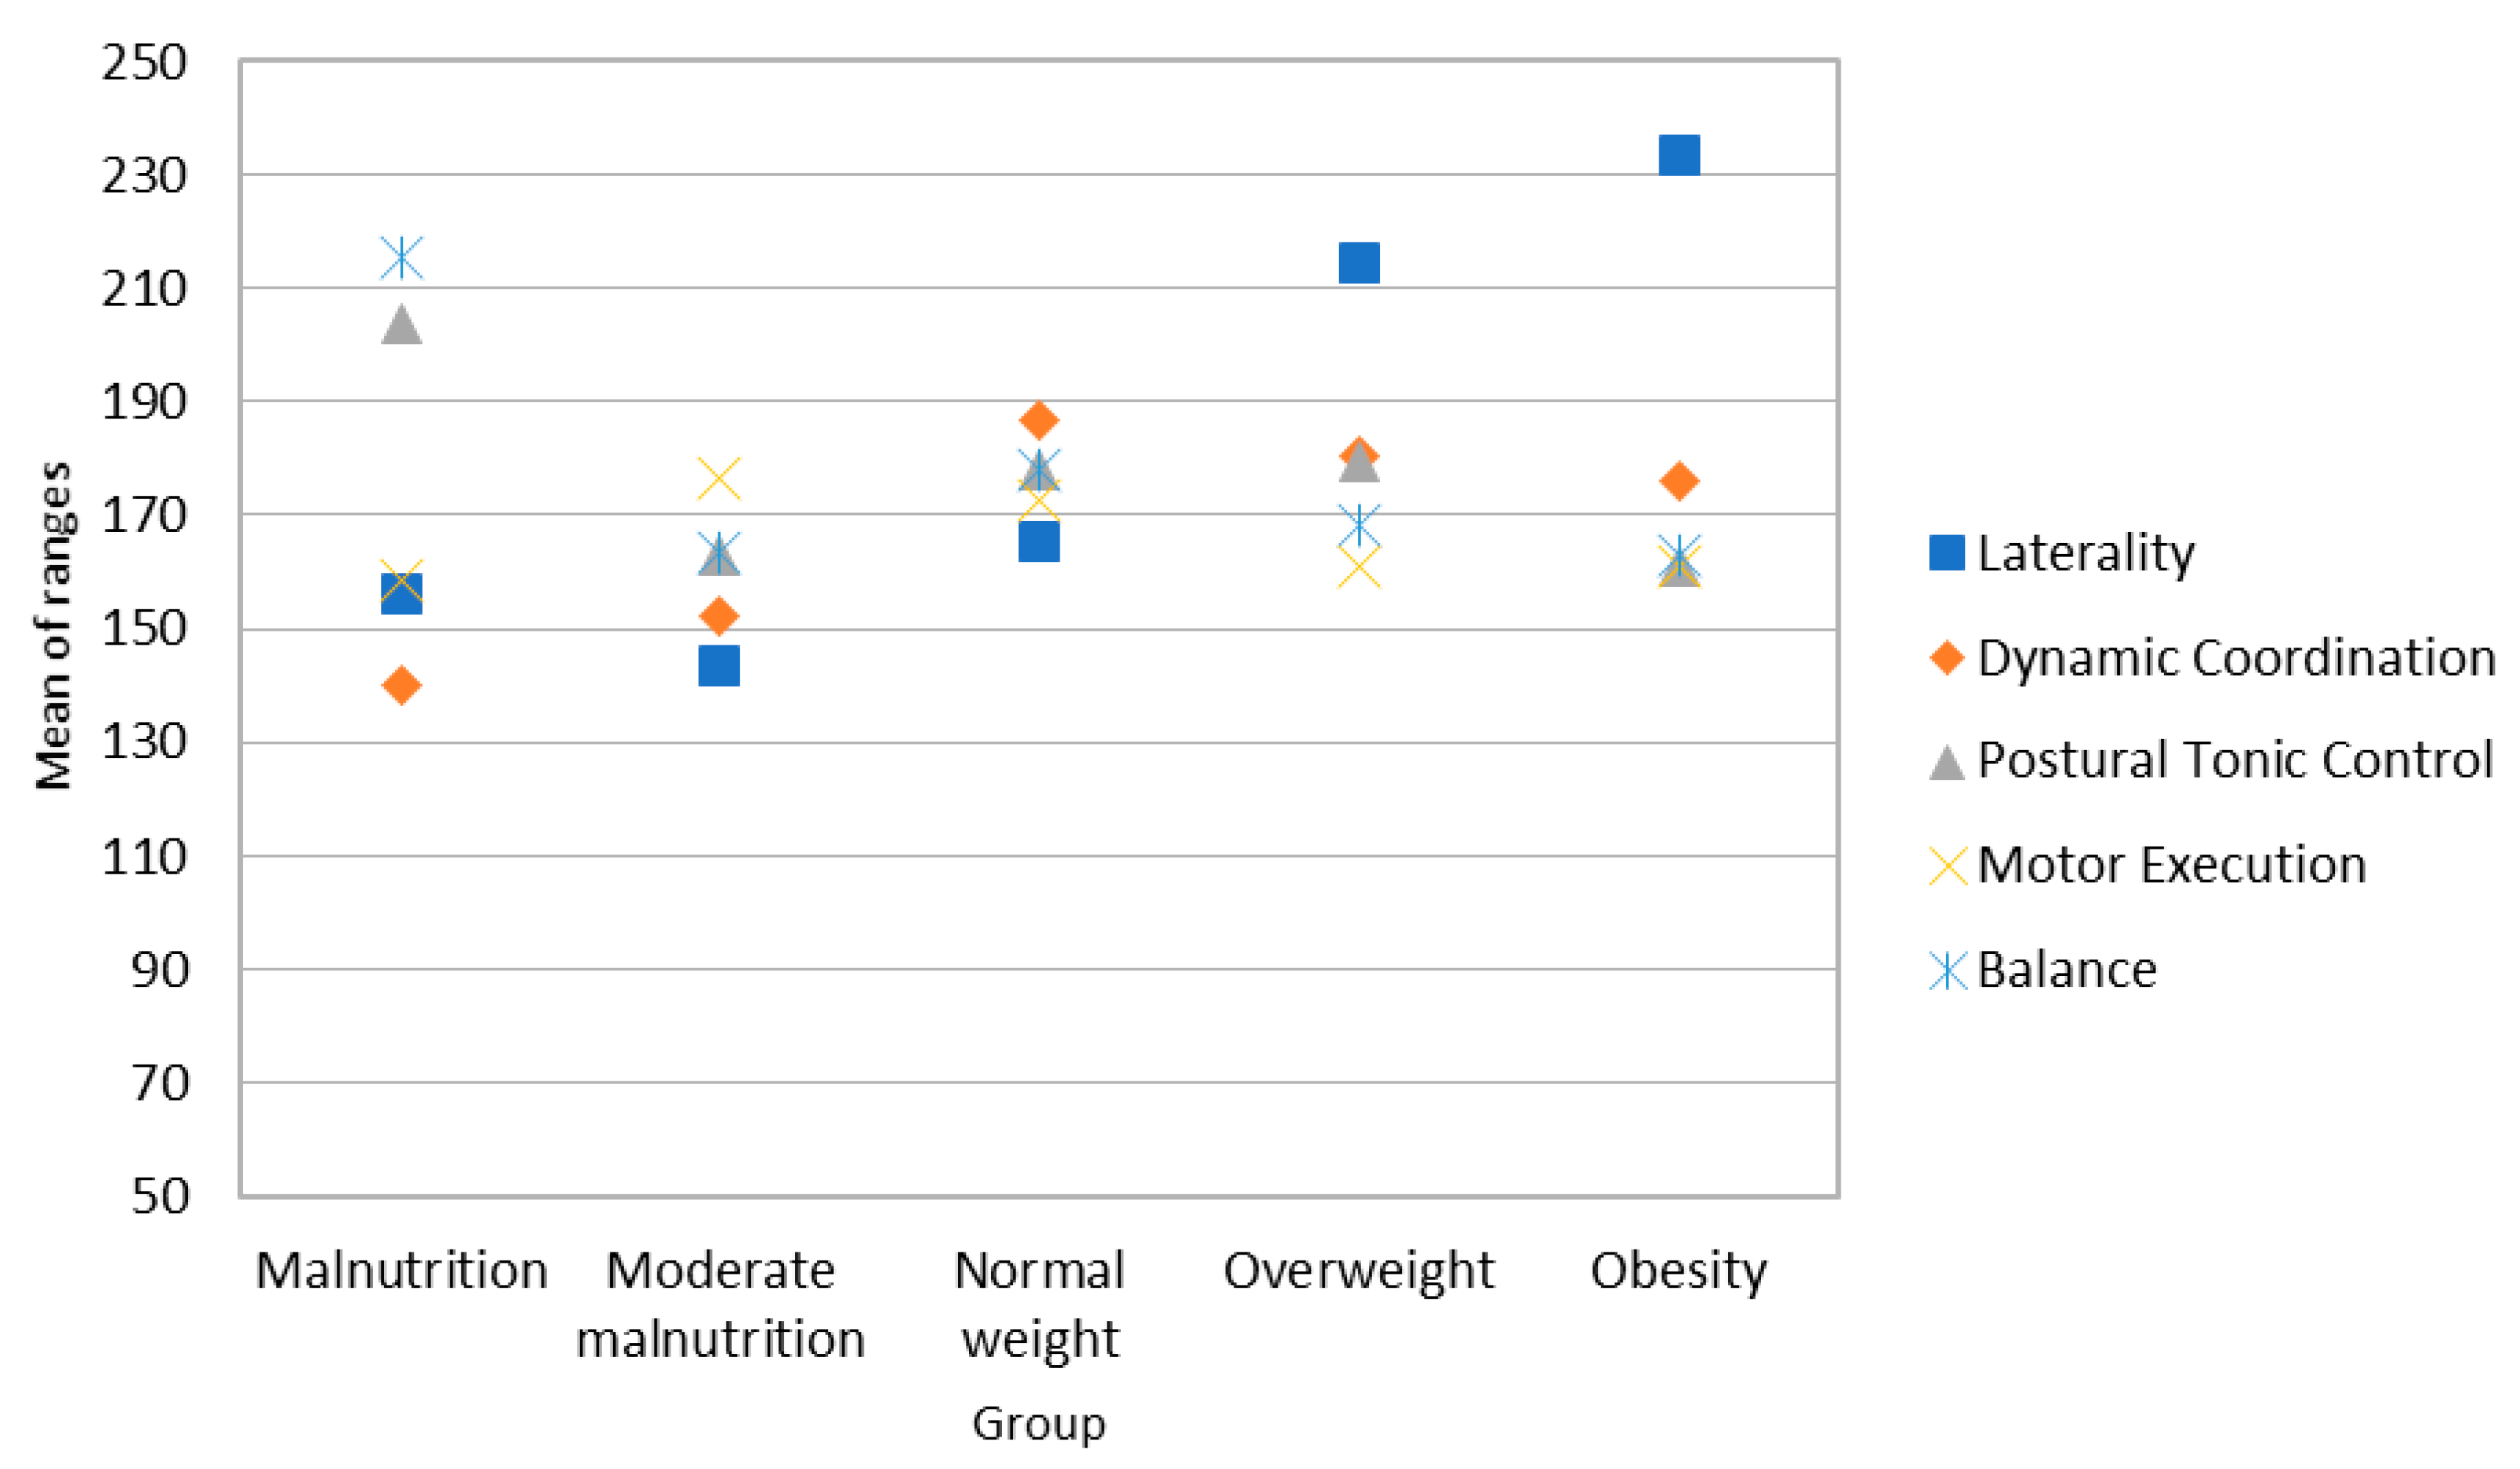
| LAT | 26.005 | 4 | 0.000 * | Malnutrition | 25.72 (5.39) | 156.06 | 23 | 0.327 | 0.148 |
| Moderate malnutrition | 25.42 (4.61) | 143.55 | 24 | 0.492 | −0.597 | ||||
| Normal weight | 26.40 (5.17) | 165.35 | 24 | 0.149 | −0.482 | ||||
| Overweight | 28.94 (4.88) | 214.71 | 30 | −0.421 | −1.042 | ||||
| Obesity | 29.63 (4.11) | 233.27 | 30 | −0.447 | −0.513 | ||||
| DC | 0.021 | 4 | 0.091 | Malnutrition | 25.75 (3.72) | 139.96 | 26 | −0.576 | −0.507 |
| Moderate malnutrition | 25.79 (4.42) | 152.45 | 27 | −1.026 | 0.016 | ||||
| Normal weight | 27.28 (3.28) | 186.70 | 28 | −1.401 | 1.609 | ||||
| Overweight | 27.45 (2.70) | 180.33 | 29 | −1.005 | −0.038 | ||||
| Obesity | 27.23 (2.73) | 176.13 | 28 | −0.513 | −1.245 | ||||
| TPC | 4.470 | 4 | 0.346 | Malnutrition | 13.89 (2.08) | 203.89 | 15 | −1.919 | 2.663 |
| Moderate malnutrition | 13.21 (2.50) | 162.95 | 14 | −1.661 | 2.638 | ||||
| Normal weight | 13.76 (1.73) | 178.05 | 14.5 | −1.786 | 3.477 | ||||
| Overweight | 13.96 (1.21) | 179.47 | 14 | −0.827 | −0.386 | ||||
| Obesity | 13.81 (1.05) | 161.10 | 14 | −0.252 | −1.221 | ||||
| ME | 5.814 | 4 | 0.213 | Malnutrition | 13.28 (1.68) | 203.89 | 15 | −1.877 | 3.311 |
| Moderate malnutrition | 11.89 (2.58) | 158.53 | 13 | 1.382 | 1.451 | ||||
| Normal weight | 12.80 (2.17) | 176.71 | 13 | −0.866 | 0.231 | ||||
| Overweight | 12.85 (1.84) | 172.43 | 13 | −0.644 | −0.192 | ||||
| Obesity | 12.86 (1.68) | 161.10 | 13 | −0.303 | −1.133 | ||||
| BAL | 6.710 | 4 | 0.152 | Malnutrition | 22.17 (4.23) | 215.35 | 25 | −1.643 | 1.143 |
| Moderate malnutrition | 20.89 (3.74) | 163.55 | 21 | −0.164 | −1.685 | ||||
| Normal weight | 21.34 (3.61) | 178.15 | 22 | −0.897 | 0.739 | ||||
| Overweight | 21.45 (2.91) | 168.52 | 22 | −0.515 | −1.058 | ||||
| Obesity | 21.14 (2.92) | 162.76 | 21 | −0.306 | 0.965 | ||||
| SUM | 5.008 | 4 | 0.287 | Malnutrition | 100.81 (13.13) | 169.68 | 102 | −1.472 | 3.339 |
| Moderate malnutrition | 97.21 (14.79) | 145.18 | 103 | −0.874 | 0.113 | ||||
| Normal weight | 101.59 (11.36) | 175.24 | 105 | −1.082 | 2.658 | ||||
| Overweight | 104.54 (8.78) | 200.20 | 103 | −0.759 | 1.658 | ||||
| Obesity | 104.67 (8.18) | 188.67 | 103 | 0.466 | −0.848 | ||||
| Kruskal-Wallis Test | Classification | Descriptive Statistics | |||||||
|---|---|---|---|---|---|---|---|---|---|
| H | df | p | BMI | Mean (SD) | Ranges | Me | G1 | G2 | |
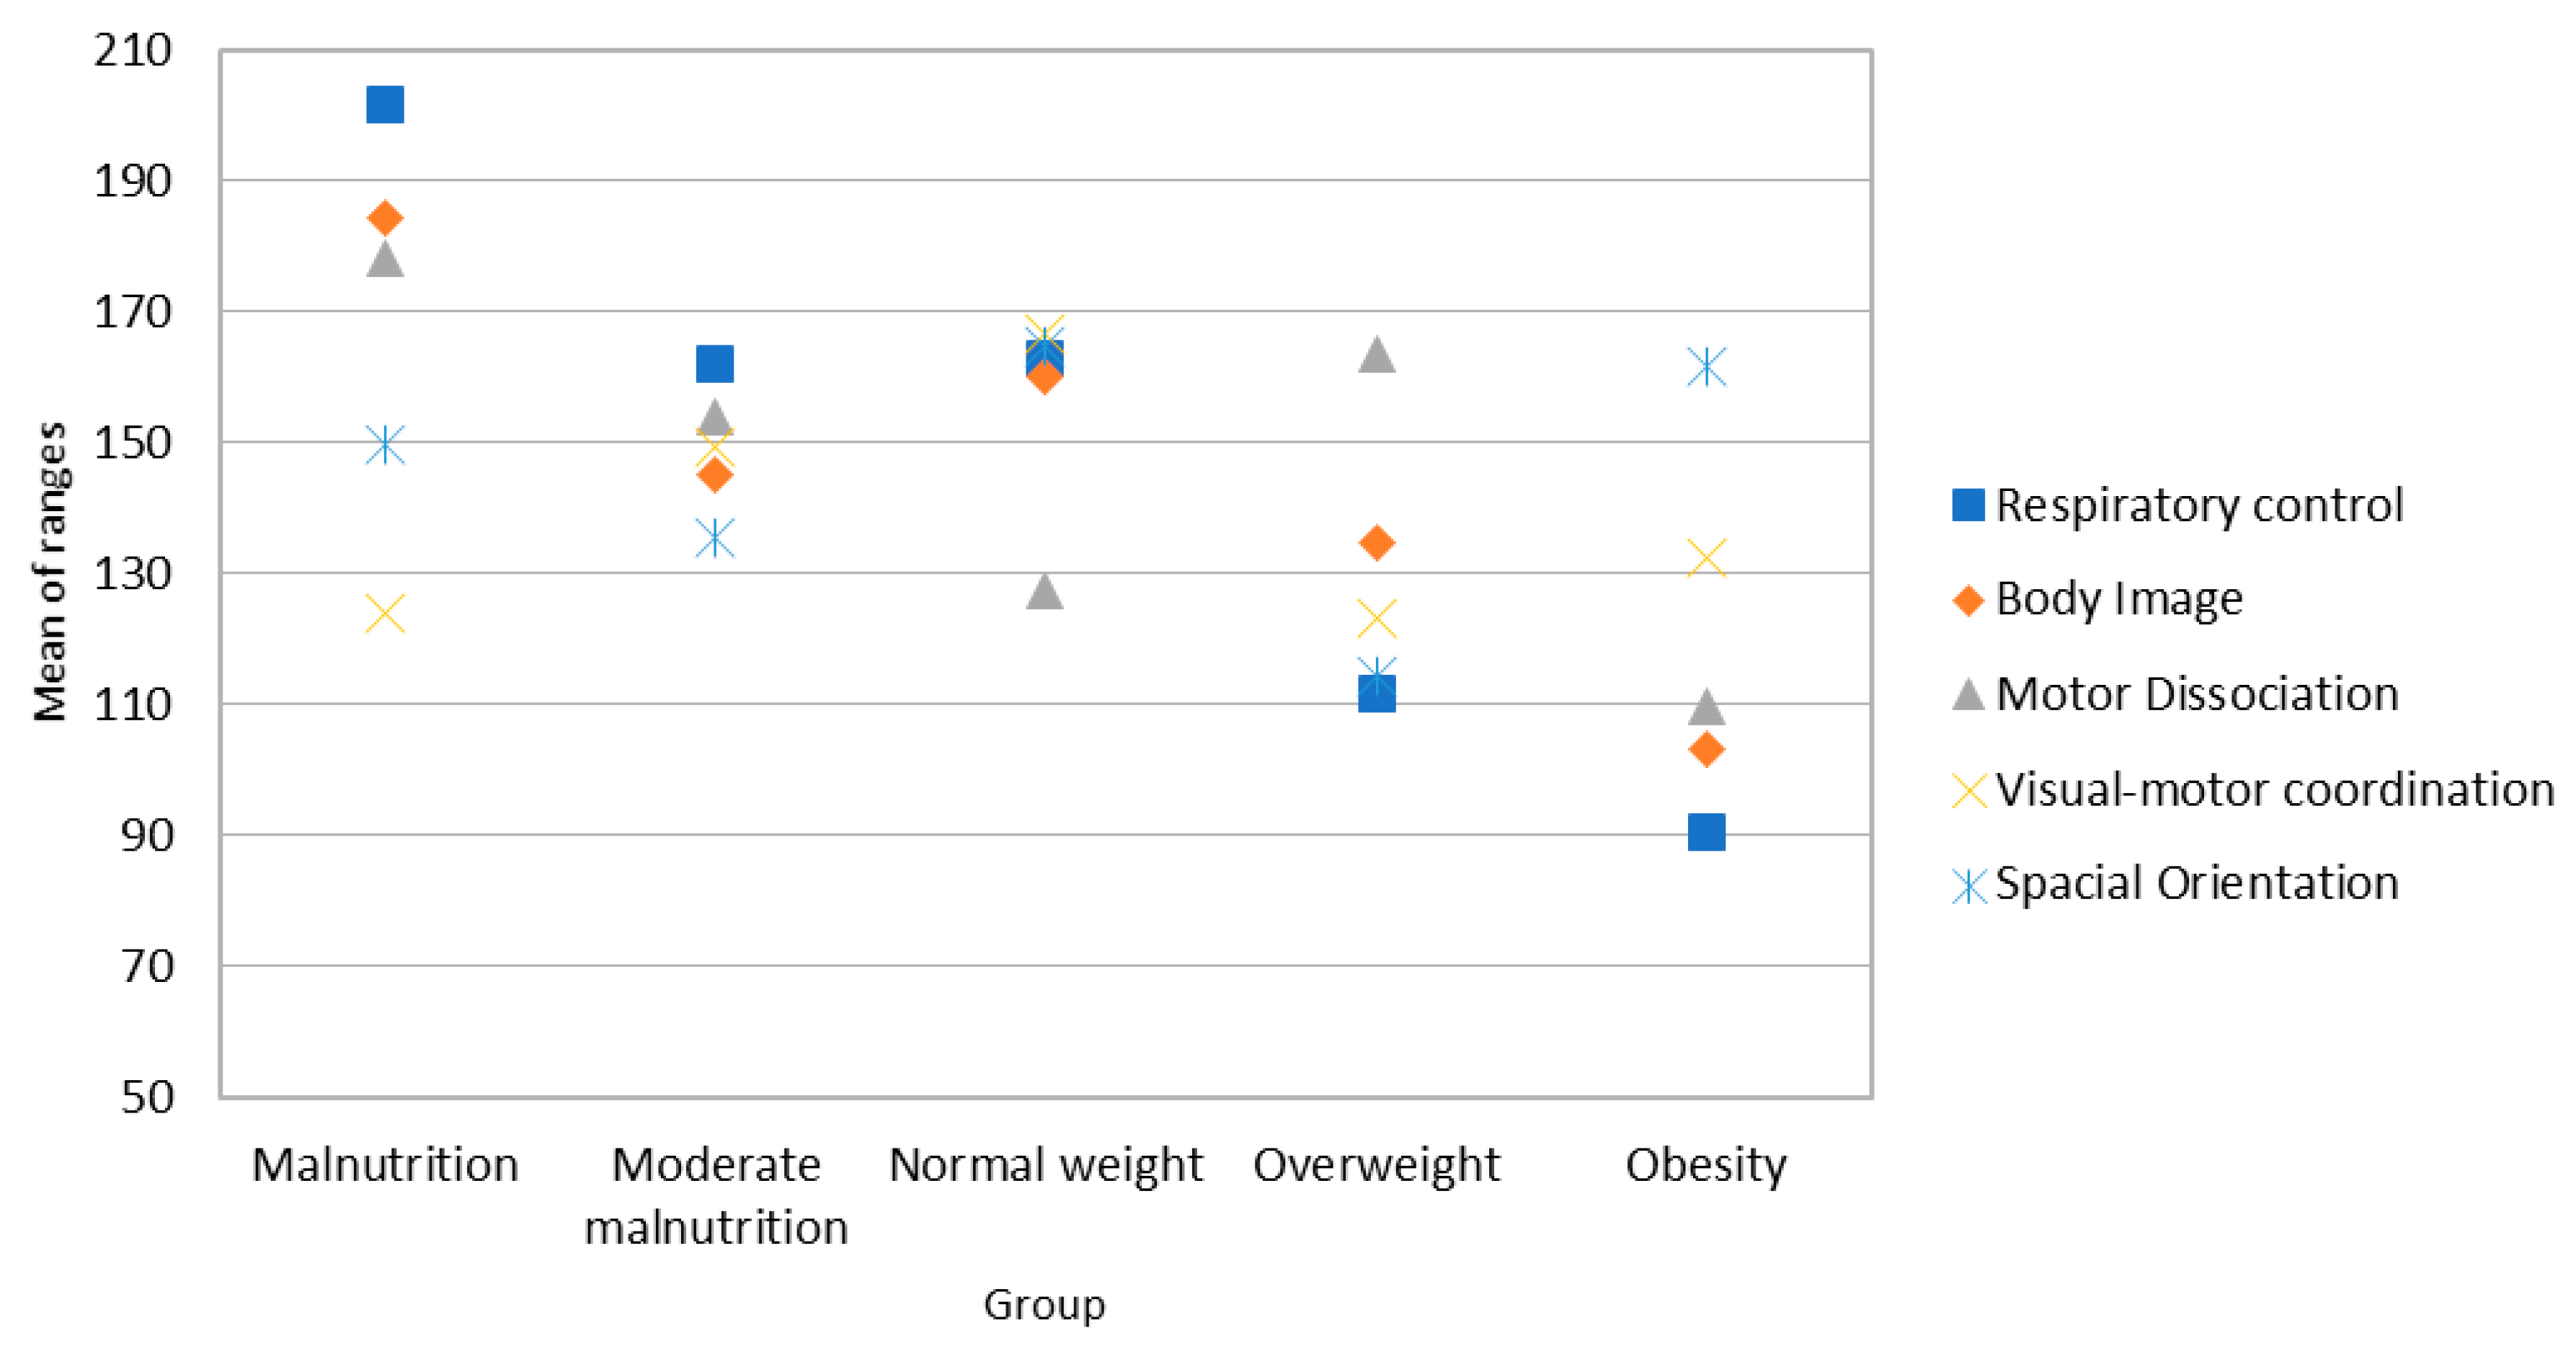
| RC | 30.757 | 4 | 0.000 * | Malnutrition | 14.09 (2.13) | 201.57 | 15 | −2.534 | 5.951 |
| Moderate malnutrition | 13.14 (2.69) | 161.89 | 14.5 | −1.812 | 2.962 | ||||
| Normal weight | 13.30 (2.25) | 162.61 | 14.5 | −1.440 | 1.830 | ||||
| Overweight | 11.82 (2.72) | 111.56 | 12 | −0.326 | −1.300 | ||||
| Obesity | 11.76 (1.60) | 90.53 | 12 | 0.021 | 0.069 | ||||
| BI | 16.380 | 4 | 0.003 * | Malnutrition | 18.27 (3.25) | 184.30 | 20 | −4.641 | 1.890 |
| Moderate malnutrition | 18.74 (2.48) | 145.09 | 20 | −2.108 | 4.031 | ||||
| Normal weight | 19.22 (2.28) | 160.17 | 20 | −0.179 | 2.900 | ||||
| Overweight | 18.44 (2.75) | 134.70 | 20 | −2.119 | 3.633 | ||||
| Obesity | 18.35 (1.49) | 103.03 | 18 | −0.184 | −1.498 | ||||
| MD | 18.730 | 4 | 0.00 * | Malnutrition | 13.78 (2.27) | 178.20 | 15 | −2.470 | 6.103 |
| Moderate malnutrition | 13.23 (2.52) | 153.83 | 14 | −1.883 | 3.327 | ||||
| Normal weight | 13.70 (1.82) | 127.47 | 15 | −1.117 | 0.640 | ||||
| Overweight | 12.42 (2.17) | 163.49 | 12 | −0.559 | −0.104 | ||||
| Obesity | 13.18 (1.46) | 109.53 | 14 | −1.016 | 1.063 | ||||
| VC | 13.416 | 4 | 0.009 * | Malnutrition | 25.26 (3.34) | 123.78 | 25 | −0.559 | 1.348 |
| Moderate malnutrition | 25.73 (4.26) | 149.14 | 26.5 | −1.593 | 0.491 | ||||
| Normal weight | 26.78 (3.25) | 166.74 | 27 | 0.313 | 5.658 | ||||
| Overweight | 24.93 (3.73) | 123.29 | 26 | −0.951 | 0.498 | ||||
| Obesity | 25.88 (2.38) | 132.59 | 27 | −0.268 | −1.188 | ||||
| SO | 16.404 | 4 | 0.003 | Malnutrition | 9.30 (0.87) | 149.89 | 9 | −1.116 | 0.582 |
| Moderate malnutrition | 8.91 (1.45) | 135.39 | 9 | −1.984 | 4.194 | ||||
| Normal weight | 9.47 (1.54) | 164.82 | 10 | 5.599 | 6.251 | ||||
| Overweight | 8.56 (1.86) | 114.24 | 9 | −2.301 | 5.851 | ||||
| Obesity | 9.53 (0.51) | 161.59 | 10 | −0.130 | −2.267 | ||||
| SUM | 22.006 | 4 | 0.000 * | Malnutrition | 81.65 (9.06) | 161.72 | 84 | −2.947 | 1.043 |
| Moderate malnutrition | 79. 27(13.00) | 152.82 | 82 | −2.179 | 4.677 | ||||
| Normal weight | 82.46 (8.45) | 167.64 | 84 | −0.309 | 6.448 | ||||
| Overweight | 76.18 (10.78) | 109.21 | 79 | −1.201 | 1.051 | ||||
| Obesity | 78.71 (3.29) | 103.24 | 79 | −0.859 | 1.999 | ||||
| Kruskal-Wallis Test | Classification | Descriptive Statistics | |||||||
|---|---|---|---|---|---|---|---|---|---|
| H | df | p | BMI | Mean (SD) | Range | Me | G1 | G2 | |
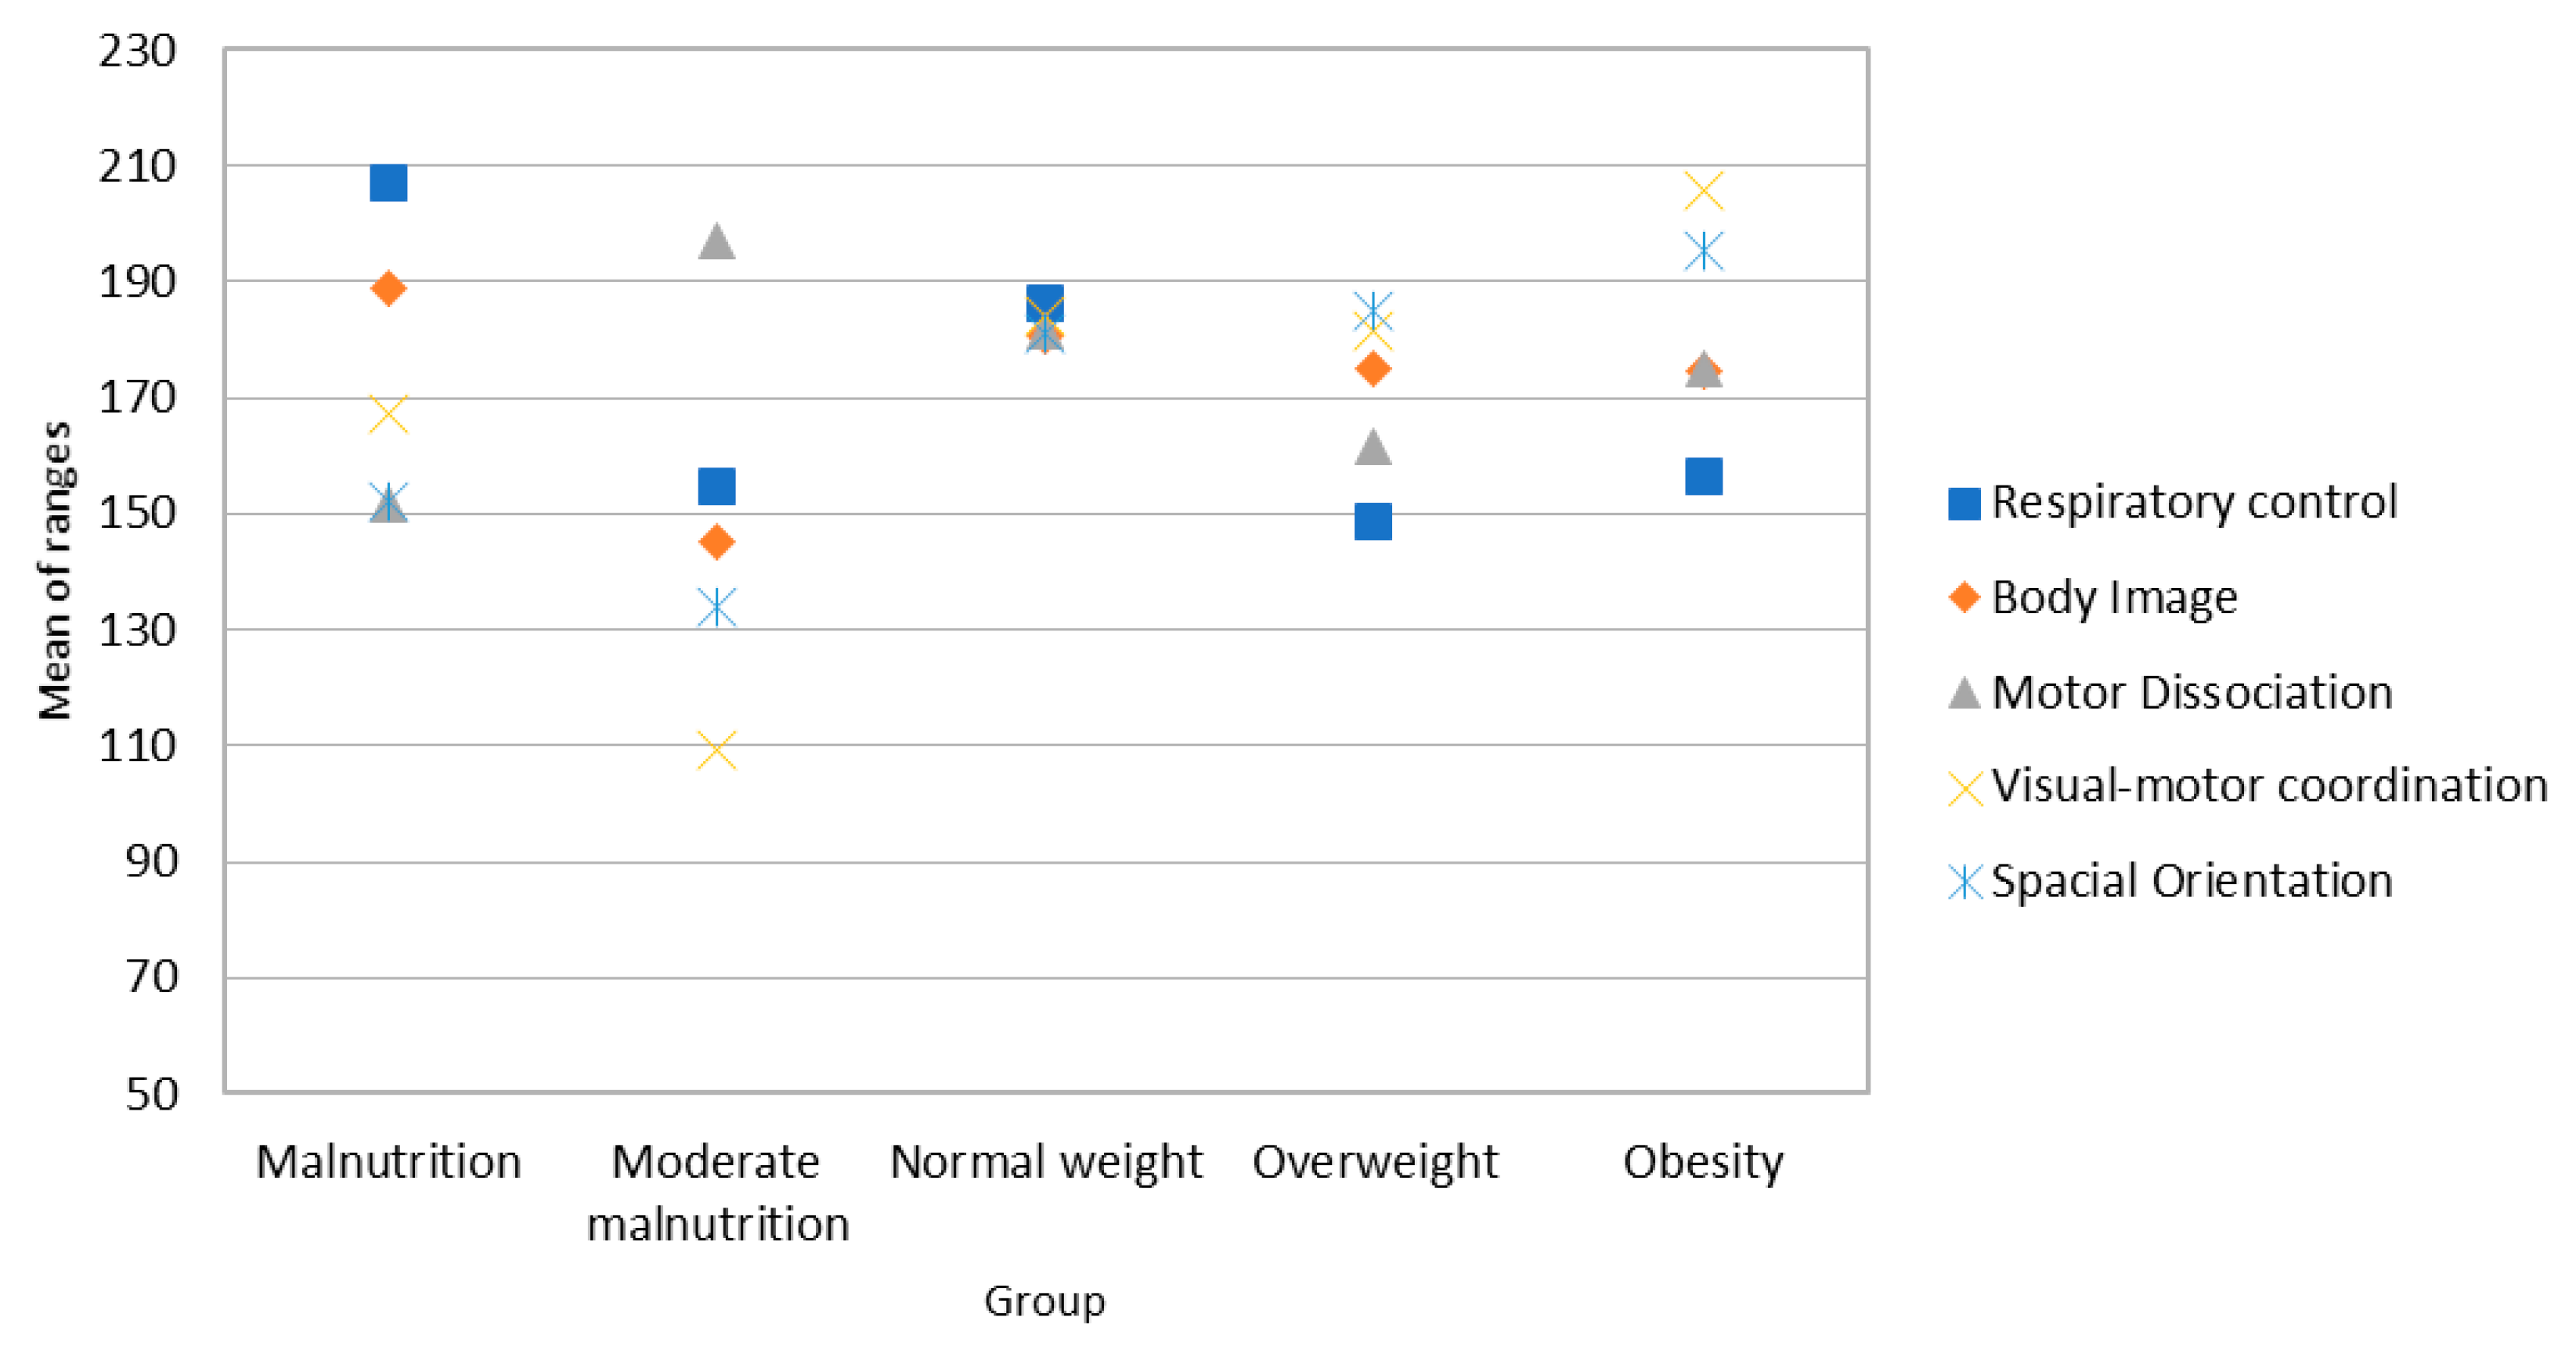
| RC | 11.995 | 4 | 0.017 * | Malnutrition | 13.31 (2.86) | 206.99 | 15 | −1.551 | 1.430 |
| Moderate malnutrition | 12.68 (2.16) | 154.76 | 13 | −0.207 | −1.551 | ||||
| Normal weight | 13.28 (2.19) | 186.15 | 14 | −1.312 | 1.097 | ||||
| Overweight | 12.70 (1.95) | 148.43 | 13 | −0.874 | 0.753 | ||||
| Obesity | 12.84 (2.06) | 156.51 | 13 | −0.799 | −0.062 | ||||
| BI | 3.620 | 4 | 0.460 | Malnutrition | 18.50 (3.29) | 188.78 | 20 | −2.350 | 4.933 |
| Moderate malnutrition | 17.84 (3.20) | 145.34 | 20 | −1.554 | 1.415 | ||||
| Normal weight | 18.99 (2.19) | 180.44 | 20 | −3.225 | 1.588 | ||||
| Overweight | 19.17 (1.30) | 175.23 | 20 | −1.487 | 1.353 | ||||
| Obesity | 19.01 (1.62) | 174.51 | 20 | −1.659 | 1.988 | ||||
| MD | 4.482 | 4 | 0.345 | Malnutrition | 13.42 (2.77) | 151.58 | 15 | −1.845 | 2.655 |
| Moderate malnutrition | 13.00 (2.44) | 196.89 | 14 | −1.791 | 3.179 | ||||
| Normal weight | 13.57 (1.94) | 181.48 | 14 | −2.194 | 6.188 | ||||
| Overweight | 13.60 (1.39) | 161.48 | 14 | −1.731 | 1.941 | ||||
| Obesity | 13.81 (1.29) | 174.93 | 14 | −1.579 | 2.584 | ||||
| VC | 20.535 | 4 | 0.000 * | Malnutrition | 23.72 (4.03) | 167.32 | 24 | 0.021 | −1.013 |
| Moderate malnutrition | 25.05 (5.67) | 109.34 | 28 | −1.187 | 0.181 | ||||
| Normal weight | 26.45 (3.97) | 184.26 | 28 | −1.724 | 3.549 | ||||
| Overweight | 26.96 (2.58) | 181.57 | 27 | −1.287 | 1.847 | ||||
| Obesity | 27.65 (2.09) | 205.56 | 28 | −0.641 | −0.606 | ||||
| SO | 9.519 | 4 | 0.050 | Malnutrition | 8.83 (1.64) | 152.15 | 9 | −1.951 | 3.888 |
| Moderate malnutrition | 8.37 (2.11) | 134.00 | 9 | −1.768 | 3.586 | ||||
| Normal weight | 9.27 (1.18) | 181.28 | 10 | −2.085 | 5.246 | ||||
| Overweight | 9.49 (0.65) | 184.87 | 10 | −0.928 | −0.190 | ||||
| Obesity | 9.53 (0.76) | 195.56 | 10 | −1.950 | 3.956 | ||||
| SUM | 8.613 | 4 | 0.072 | Malnutrition | 77.78 (11.76) | 143.90 | 80 | −1.658 | 2.525 |
| Moderate malnutrition | 76.95 (11.08) | 149.63 | 82 | −1.257 | 0.519 | ||||
| Normal weight | 81.66 (9.71) | 188.22 | 85 | −2.032 | 4.858 | ||||
| Overweight | 81.91 (5.18) | 163.99 | 83 | −0.470 | −0.562 | ||||
| Obesity | 82.86 (5.72) | 184.50 | 83 | −0.346 | −0.870 | ||||
| Kruskal-Wallis Test | Classification | Descriptive Statistics | |||||||
|---|---|---|---|---|---|---|---|---|---|
| H | df | p | BMI | Mean (SD) | Range | Me | G1 | G2 | |
| EC | 7.887 | 4 | 0.096 | Malnutrition | 25.87 (2.91) | 126.54 | 27 | −0.983 | 1.044 |
| Moderate malnutrition | 26.23 (3.72) | 150.07 | 27.5 | −2.658 | 3.027 | ||||
| Normal weight | 26.73 (3.64) | 161.02 | 27.5 | −0.427 | 4.921 | ||||
| Overweight | 25.13 (4.49) | 130.38 | 27 | −1.177 | 0.890 | ||||
| Obesity | 27.29 (2.95) | 176.21 | 28 | −2.125 | 5.690 | ||||
| SR | 11.459 | 4 | 0.022 | Malnutrition | 19.70 (2.72) | 120.67 | 20 | −1.294 | 4.130 |
| Moderate malnutrition | 20.95 (2.53) | 166.59 | 21.5 | −0.754 | 0.232 | ||||
| Normal weight | 21.04 (2.92) | 164.19 | 21 | 1.162 | 1.577 | ||||
| Overweight | 19.67 (3.79) | 129.57 | 20 | −1.361 | 3.221 | ||||
| Obesity | 20.00 (2.29) | 127.56 | 21 | 0.177 | −1.140 | ||||
| SUM | 9.454 | 4 | 0.051 | Malnutrition | 45.57 (5.18) | 122.39 | 47 | −1.252 | 3.405 |
| Moderate malnutrition | 47.18 (5.69) | 158.98 | 47.5 | −1.594 | 2.822 | ||||
| Normal weight | 47.77 (6.03) | 163.33 | 49 | 0.484 | 1.459 | ||||
| Overweight | 44.80 (7.53) | 128.18 | 47 | −1.048 | 0.715 | ||||
| Obesity | 47.29 (4.22) | 151.59 | 47 | −1.146 | 1.782 | ||||
| ME | 27.708 | 4 | 0.000 * | Malnutrition | 13.87 (1.86) | 195.04 | 15 | −1.953 | 3.737 |
| Moderate malnutrition | 13.82 (1.65) | 189.23 | 15 | −1.495 | 2.052 | ||||
| Normal weight | 13.16 (1.98) | 159.67 | 14 | −0.790 | −0.303 | ||||
| Overweight | 11.87 (2.33) | 110.12 | 12 | −0.383 | −0.278 | ||||
| Obesity | 12.00 (1.36) | 102.38 | 12 | 0.166 | −0.082 | ||||
| Kruskal-Wallis Test | Classification | Descriptive Statistics | |||||||
|---|---|---|---|---|---|---|---|---|---|
| H | df | p | BMI | Mean (SD) | Range | Me | G1 | G2 | |
| EC | 6.014 | 4 | 0.096 | Malnutrition | 25.16 (4.69) | 146.63 | 25 | −1.354 | 1.808 |
| Moderate malnutrition | 26.69 (2.31) | 156.64 | 28 | −2.040 | 5.638 | ||||
| Normal weight | 26.07 (4.26) | 181.58 | 28 | −1.886 | 4.437 | ||||
| Overweight | 26.32 (3.29) | 177.16 | 27 | −1.366 | 1.922 | ||||
| Obesity | 27.16 (2.29) | 197.09 | 28 | −0.357 | −1.301 | ||||
| SR | 5.336 | 4 | 0.022 | Malnutrition | 19.69 (2.82) | 143.33 | 20 | −1.077 | 1.747 |
| Moderate malnutrition | 20.32 (3.66) | 165.37 | 20 | −0.939 | 2.181 | ||||
| Normal weight | 20.60 (3.14) | 184.40 | 21 | −1.269 | 3.118 | ||||
| Overweight | 20.91 (2.23) | 180.01 | 21 | 0.368 | −0.720 | ||||
| Obesity | 20.84 (2.01) | 179.17 | 21 | 0.179 | −2.282 | ||||
| SUM | 5.594 | 4 | 0.051 | Malnutrition | 45.03 (6.05) | 142.97 | 45 | −1.314 | 2.831 |
| Moderate malnutrition | 45.47 (7.99) | 163.29 | 45 | −1.031 | −1.576 | ||||
| Normal weight | 46.67 (6.81) | 183.15 | 49 | −1.845 | 4.751 | ||||
| Overweight | 47.23 (4.44) | 178.15 | 47 | −0.587 | 0.241 | ||||
| Obesity | 48.00 (3.59) | 188.49 | 48 | −0.006 | −0.936 | ||||
| ME | 27.708 | 4 | 0.000 * | Malnutrition | 13.87 (1.86) | 195.04 | 15 | −1.953 | 3.737 |
| Moderate malnutrition | 13.82 (1.65) | 189.23 | 15 | −1.495 | 2.052 | ||||
| Normal weight | 13.16 (1.98) | 159.67 | 14 | −0.790 | −0.303 | ||||
| Overweight | 11.87 (2.33) | 110.12 | 12 | −0.383 | −0.278 | ||||
| Obesity | 12.00 (1.36) | 102.38 | 12 | 0.166 | −0.082 | ||||
© 2019 by the authors. Licensee MDPI, Basel, Switzerland. This article is an open access article distributed under the terms and conditions of the Creative Commons Attribution (CC BY) license (http://creativecommons.org/licenses/by/4.0/).
Share and Cite
Gil Madrona, P.; Romero Martínez, S.J.; Sáez-Gallego, N.M.; Ordóñez Camacho, X.G. Psychomotor Limitations of Overweight and Obese Five-Year-Old Children: Influence of Body Mass Indices on Motor, Perceptual, and Social-Emotional Skills. Int. J. Environ. Res. Public Health 2019, 16, 427. https://0-doi-org.brum.beds.ac.uk/10.3390/ijerph16030427
Gil Madrona P, Romero Martínez SJ, Sáez-Gallego NM, Ordóñez Camacho XG. Psychomotor Limitations of Overweight and Obese Five-Year-Old Children: Influence of Body Mass Indices on Motor, Perceptual, and Social-Emotional Skills. International Journal of Environmental Research and Public Health. 2019; 16(3):427. https://0-doi-org.brum.beds.ac.uk/10.3390/ijerph16030427
Chicago/Turabian StyleGil Madrona, Pedro, Sonia J. Romero Martínez, Nieves María Sáez-Gallego, and Xavier G. Ordóñez Camacho. 2019. "Psychomotor Limitations of Overweight and Obese Five-Year-Old Children: Influence of Body Mass Indices on Motor, Perceptual, and Social-Emotional Skills" International Journal of Environmental Research and Public Health 16, no. 3: 427. https://0-doi-org.brum.beds.ac.uk/10.3390/ijerph16030427