Perceived Impact of Taiwan’s National Health Insurance Allocation Strategy: Health Professionals’ Perspective


Abstract
:1. Introduction
Taiwan NHI’s Risk Pooling and Allocation Strategy
2. Methods
2.1. Study Site and Sample Size
2.2. Structural Model and Instrument
2.3. Measures
2.4. Analysis
2.5. Ethical Statement
3. Results
3.1. Descriptive Statistics
3.2. Structural Equation Modeling
4. Discussion
5. Conclusions
Supplementary Materials
Author Contributions
Funding
Acknowledgments
Conflicts of Interest
References
- Saward, E.W. The effect on future physician requirements of an HMO policy after national health insurance. J. Community Health 1975, 1, 53–71. [Google Scholar] [CrossRef] [PubMed]
- Schwartz, W.B.; Aaron, H.J. Rationing hospital care. Lessons from Britain. N. Engl. J. Med. 1984, 310, 52–56. [Google Scholar] [CrossRef] [PubMed]
- Hurst, S.A.; Forde, R.; Reiter-Theil, S.; Slowther, A.M.; Perrier, A.; Pegoraro, R.; Danis, M. Physicians’ views on resource availability and equity in four European health care systems. BMC Health Serv. Res. 2007, 7, 137. [Google Scholar] [CrossRef] [PubMed]
- Liu, Y.; Hsiao, W.C.; Eggleston, K. Equity in health and health care: The Chinese experience. Soc. Sci. Med. 1999, 49, 1349–1356. [Google Scholar] [CrossRef]
- White-Means, S.I.; Osmani, A.R. Affordable Care Act and Disparities in Health Services Utilization among Ethnic Minority Breast Cancer Survivors: Evidence from Longitudinal Medical Expenditure Panel Surveys 2008(-)2015. Int. J. Environ. Res. Public Health 2018, 15, 1860. [Google Scholar] [CrossRef] [PubMed]
- Perneger, T.V.; Martin, D.P.; Bovier, P.A. Physicians’ attitudes toward health care rationing. Med. Decis. Mak. 2002, 22, 65–70. [Google Scholar] [CrossRef] [PubMed]
- Chen, F.J.; Laditka, J.N.; Laditka, S.B.; Xirasagar, S. Providers’ responses to global budgeting in Taiwan: What were the initial effects? Health Serv. Manag. Res. 2007, 20, 113–120. [Google Scholar] [CrossRef]
- Bureau of National Health Insurance National Health Insurance in Taiwan 2011. Bureau of National Health Insurance, Department of Health, Taiwan (R.O.C) Website. Available online: http://www.nhi.gov.tw/Resource/webdata/20774_1_NHI%20IN%20TAIWAN%202011%20ANNUAL%20REPORT.pdf (accessed on 24 February 2016).
- Kreng, V.B.; Yang, C.T. The equality of resource allocation in health care under the National Health Insurance System in Taiwan. Health Policy 2010, 100, 203–210. [Google Scholar] [CrossRef]
- Okunade, A.A.; Karakus, M.C.; Okeke, C. Determinants of health expenditure growth of the OECD countries: Jackknife resampling plan estimates. Health Care Manag. Sci. 2004, 7, 173–183. [Google Scholar] [CrossRef]
- Goddard, M.; Smith, P. Equity of access to health care services: Theory and evidence from the UK. Soc. Sci. Med. 2001, 53, 1149–1162. [Google Scholar] [CrossRef]
- Okunade, A.A.; Osmani, A.R. Technology, Productivity, and Costs in Healthcare. In Oxford Research Encyclopedia of Economics and Finance; Oxford University Press: Oxford, UK, 2018; pp. 1–21. [Google Scholar]
- Owili, P.O.; Hsu, Y.H.; Chern, J.Y.; Chiu, C.H.; Wang, B.; Huang, K.C.; Muga, M.A. Perceptions and attitudes of health professionals in kenya on national health care resource allocation mechanisms: A structural equation modeling. PLoS ONE 2015, 10, e0127160. [Google Scholar] [CrossRef] [PubMed]
- Roberts, E. Taiwan Tops the Expat Health Care Charts. Available online: http://www.telegraph.co.uk/news/health/expat-health/11190870/Taiwan-tops-the-expat-health-care-charts.html (accessed on 17 April 2015).
- Wu, T.Y.; Majeed, A.; Kuo, K.N. An overview of the healthcare system in Taiwan. Lond. J. Prim Care 2010, 3, 115–119. [Google Scholar] [CrossRef]
- National Health Insurance Administration. Ministry of Health and Welfare, National Health Insurance Annual Report 2014–2015; San-Kuei Huang: Taipei, Taiwan, 2014. [Google Scholar]
- Lee, Y.C.; Huang, Y.T.; Tsai, Y.W.; Huang, S.M.; Kuo, K.N.; McKee, M.; Nolte, E. The impact of universal National Health Insurance on population health: The experience of Taiwan. BMC Health Serv. Res. 2010, 10, 225. [Google Scholar] [CrossRef] [PubMed]
- Cheng, S.H.; Chiang, T.L. Disparity of medical care utilization among different health insurance schemes in Taiwan. Soc. Sci. Med. 1998, 47, 613–620. [Google Scholar] [CrossRef]
- Langenbrunner, J.; Langenbrunner, J.C.; Cashin, C.; O’Dougherty, S. Designing and Implementing Health Care Provider Payment Systems: How-To Manuals; World Bank Publications: Washington, DC, USA, 2009. [Google Scholar]
- Cheng, S.H.; Chen, C.C.; Chang, W.L. Hospital response to a global budget program under universal health insurance in Taiwan. Health Policy 2009, 92, 158–164. [Google Scholar] [CrossRef] [PubMed]
- Chen, S.H.; Chuang, H. Recent Trends in Taiwanese Medical Spending. Fisc. Stud. 2016, 37, 653–688. [Google Scholar] [CrossRef]
- Chien, T.C.; Chen, H.L. Testing Taiwan’s National Health Insurance Reforms in Internal Cost Control: From Providers’ Aspect. Asian J. Health Inf. Sci. 2008, 3, 69–87. [Google Scholar]
- Ger, L.P.; Ho, S.T.; Wang, J.J. Physicians’ knowledge and attitudes toward the use of analgesics for cancer pain management: A survey of two medical centers in Taiwan. J Pain Symptom Manag. 2000, 20, 335–344. [Google Scholar] [CrossRef]
- Chen, K.C.; Yang, Y.K.; Lee, I.H.; Yeh, T.L.; Lu, R.B.; Chen, P.S. Sexual dysfunction and physicians’ perception in medicated patients with major depression in Taiwan. Depress Anxiety 2008, 25, E56–E62. [Google Scholar] [CrossRef]
- Lee, W.C.; Wung, H.Y.; Liao, H.H.; Lo, C.M.; Chang, F.L.; Wang, P.C.; Fan, A.; Chen, H.H.; Yang, H.C.; Hou, S.M. Hospital safety culture in Taiwan: A nationwide survey using Chinese version Safety Attitude Questionnaire. BMC Health Serv. Res. 2010, 10, 234. [Google Scholar] [CrossRef]
- Giveon, S.M.; Liberman, N.; Klang, S.; Kahan, E. A survey of primary care physicians’ perceptions of their patients’ use of complementary medicine. Complement Med. 2003, 11, 254–260. [Google Scholar] [CrossRef]
- Hu, S.P.; Liu, J.F.; Shieh, M.J. Nutrition knowledge, attitudes and practices among senior medical students in Taiwan. J. Am. Coll. Nutr. 1997, 16, 435–438. [Google Scholar] [CrossRef] [PubMed]
- Raosoft Raosoft Sample Size Calculator. Available online: http://www.raosoft.com/samplesize.html (accessed on 10 April 2012).
- Ding, L.; Velicer, W.F.; Harlow, L.L. Effects of estimation methods, number of indicators per factor, and improper solutions on structural equation modeling fit indices. Struct. Equ. Model. A Multidiscip. J. 1995, 2, 119–143. [Google Scholar] [CrossRef]
- Anderson, J.C.; Gerbing, D.W. Structural equation modeling in practice: A review and recommended two-step approach. Psychol. Bull. 1988, 103, 411. [Google Scholar] [CrossRef]
- El-Ashry, M.T.; Gibbons, D.C. Water and Arid Lands of the Western United States: A World Resources Institute Book; Cambridge University Press: New York, NY, USA, 2009. [Google Scholar]
- Jöreskog, K.G.; Sörbom, D.; Inc, S. PRELIS 2 User’s Reference Guide: A Program for Multivariate Data Screening and Data Summarization: A Preprocessor for LISREL; Scientific Software International: Lincolnwood, IL, USA, 1996. [Google Scholar]
- Nunnally, J.C.; Bernstein, I.H. Psychometric Theory, 3rd ed.; McGraw-Hill: New York, NY, USA, 1994. [Google Scholar]
- Jöreskog, K.G.; Sörbom, D. LISREL 8: New Statistical Features; Scientific Software International: Lincolnwood, IL, USA, 2001. [Google Scholar]
- Schumacker, R.E.; Lomax, R.G. A Beginner’s Guide to Structural Equation Modeling, 3rd ed.; Taylor & Francis: New York, NY, USA, 2012. [Google Scholar]
- MacCallum, R.C.; Browne, M.W.; Sugawara, H.M. Power analysis and determination of sample size for covariance structure modeling. Psychol. Methods 1996, 1, 130. [Google Scholar] [CrossRef]
- Dredge, R. Hospital Global Budgeting. Health, Nutrition, and Population Family (HNP) Discussion Paper, World Bank’s Human Development Network; World Bank, 2004. [Google Scholar]
- Rachel Lu, J.F.; Chiang, T.L. Evolution of Taiwan’s health care system. Health Econ. Policy Law 2011, 6, 85–107. [Google Scholar] [CrossRef] [PubMed]


| Variables | (n = 299) | % |
|---|---|---|
| Gender | ||
| Male | 94 | 31.4 |
| Female | 205 | 68.6 |
| Age groups (years) | ||
| ≤30 | 172 | 57.5 |
| 31–40 | 100 | 33.4 |
| 41–50 | 22 | 7.4 |
| ≥51 | 5 | 1.7 |
| Years of experience | ||
| ≤5 | 161 | 53.8 |
| 6–10 | 69 | 23.7 |
| 11–15 | 47 | 15.7 |
| 16–20 | 17 | 5.7 |
| ≥21 | 5 | 1.7 |
| Specialty | ||
| Physician | 83 | 27.8 |
| Nurses | 141 | 47.2 |
| Pharmacist | 27 | 9.0 |
| Nutritionist | 5 | 1.7 |
| Other | 43 | 14.4 |
| Religious status | ||
| Non-believer | 168 | 56.2 |
| Believer | 131 | 43.8 |
| Religion (believers only) | ||
| Christianity | 60 | 45.8 |
| Buddhism | 50 | 38.2 |
| Other | 21 | 16.0 |
| Codes | Indicator | Standardized Estimate | Standard Error | t-Value (n = 300) |
|---|---|---|---|---|
| PPIAM | Perceived positive effect | |||
| Pec2_16 | Improved wages and living standards | 0.72 | 0.08 | 11.17 *** |
| Pef2_15 | Human resource increase | 0.75 | 0.05 | 14.40 *** |
| Peq2_13b | Distribution of resources equally | 0.80 | 0.24 | 4.25 *** |
| Pde2_3 | Modern equipment acquisition | 0.69 | 0.06 | 11.69 *** |
| PNIAM | Perceived negative effect | |||
| Nec2_12d | Unachievable universal coverage | 0.43 | 0.07 | 7.02 *** |
| Nef2_6 | Hospital length of stay increased | 0.91 | 0.21 | 1.61 |
| Nde2_7 | Scanty amenities | 0.93 | 0.10 | 10.94 *** |
| Neq2_12e | Cost of care increased | 0.38 | 0.07 | 6.12 *** |
| OPS | Satisfaction of health professionals | |||
| Sec3_3d | Wages and living standards | 0.49 | 0.09 | 6.81 *** |
| Sef3_3c | Performance of hospital | 0.79 | 0.06 | 18.83 *** |
| Shc3_1b | Available services | 0.60 | 0.09 | 8.71 *** |
| Seq3_3a | Service costs | 0.75 | 0.14 | 5.69 *** |
| Sjo3_2c | Available information | 0.85 | 0.05 | 15.97 *** |
| Sjo3_2a | Available resources | 0.71 | 0.06 | 12.45 *** |
| ARAM | Attitude toward allocation criteria | |||
| Aal4_10d | Hospital size consideration | 0.58 | 0.02 | 6.85 *** |
| Aeq4_9e | Cost of services consideration | 0.69 | 0.13 | 9.02 *** |
| Aec4_11a | Human resource consideration | 0.92 | 0.39 | 8.05 *** |
| Ade4_11b | Consider equipment and facilities | 0.91 | 0.27 | 17.23 *** |
| Ahc4_9b | Patient volume consideration | 0.61 | 0.18 | 7.42 *** |
| BNHCRAM | Characteristics of NHI’s allocation plan | |||
| Bpe4_7 | Improves overall performance | 0.85 | 0.23 | 11.35 *** |
| Bde4_6 | Supports economy and heath sector development | 0.77 | 0.23 | 11.35 *** |
| Bun4_5 | Cater for unmet needs | 0.87 | 0.16 | 9.06 *** |
| Beq4_4 | Improves equity | 0.77 | 0.09 | 14.09 *** |
| Bef4_3 | Improves allocative efficiency | 0.69 | 0.06 | 4.97 *** |
| Bhc4_2 | Meet health care needs and demand | 0.65 | 0.11 | 9.32 *** |
| Bcx4_1 | Less complex | 0.61 | 0.22 | 6.65 *** |
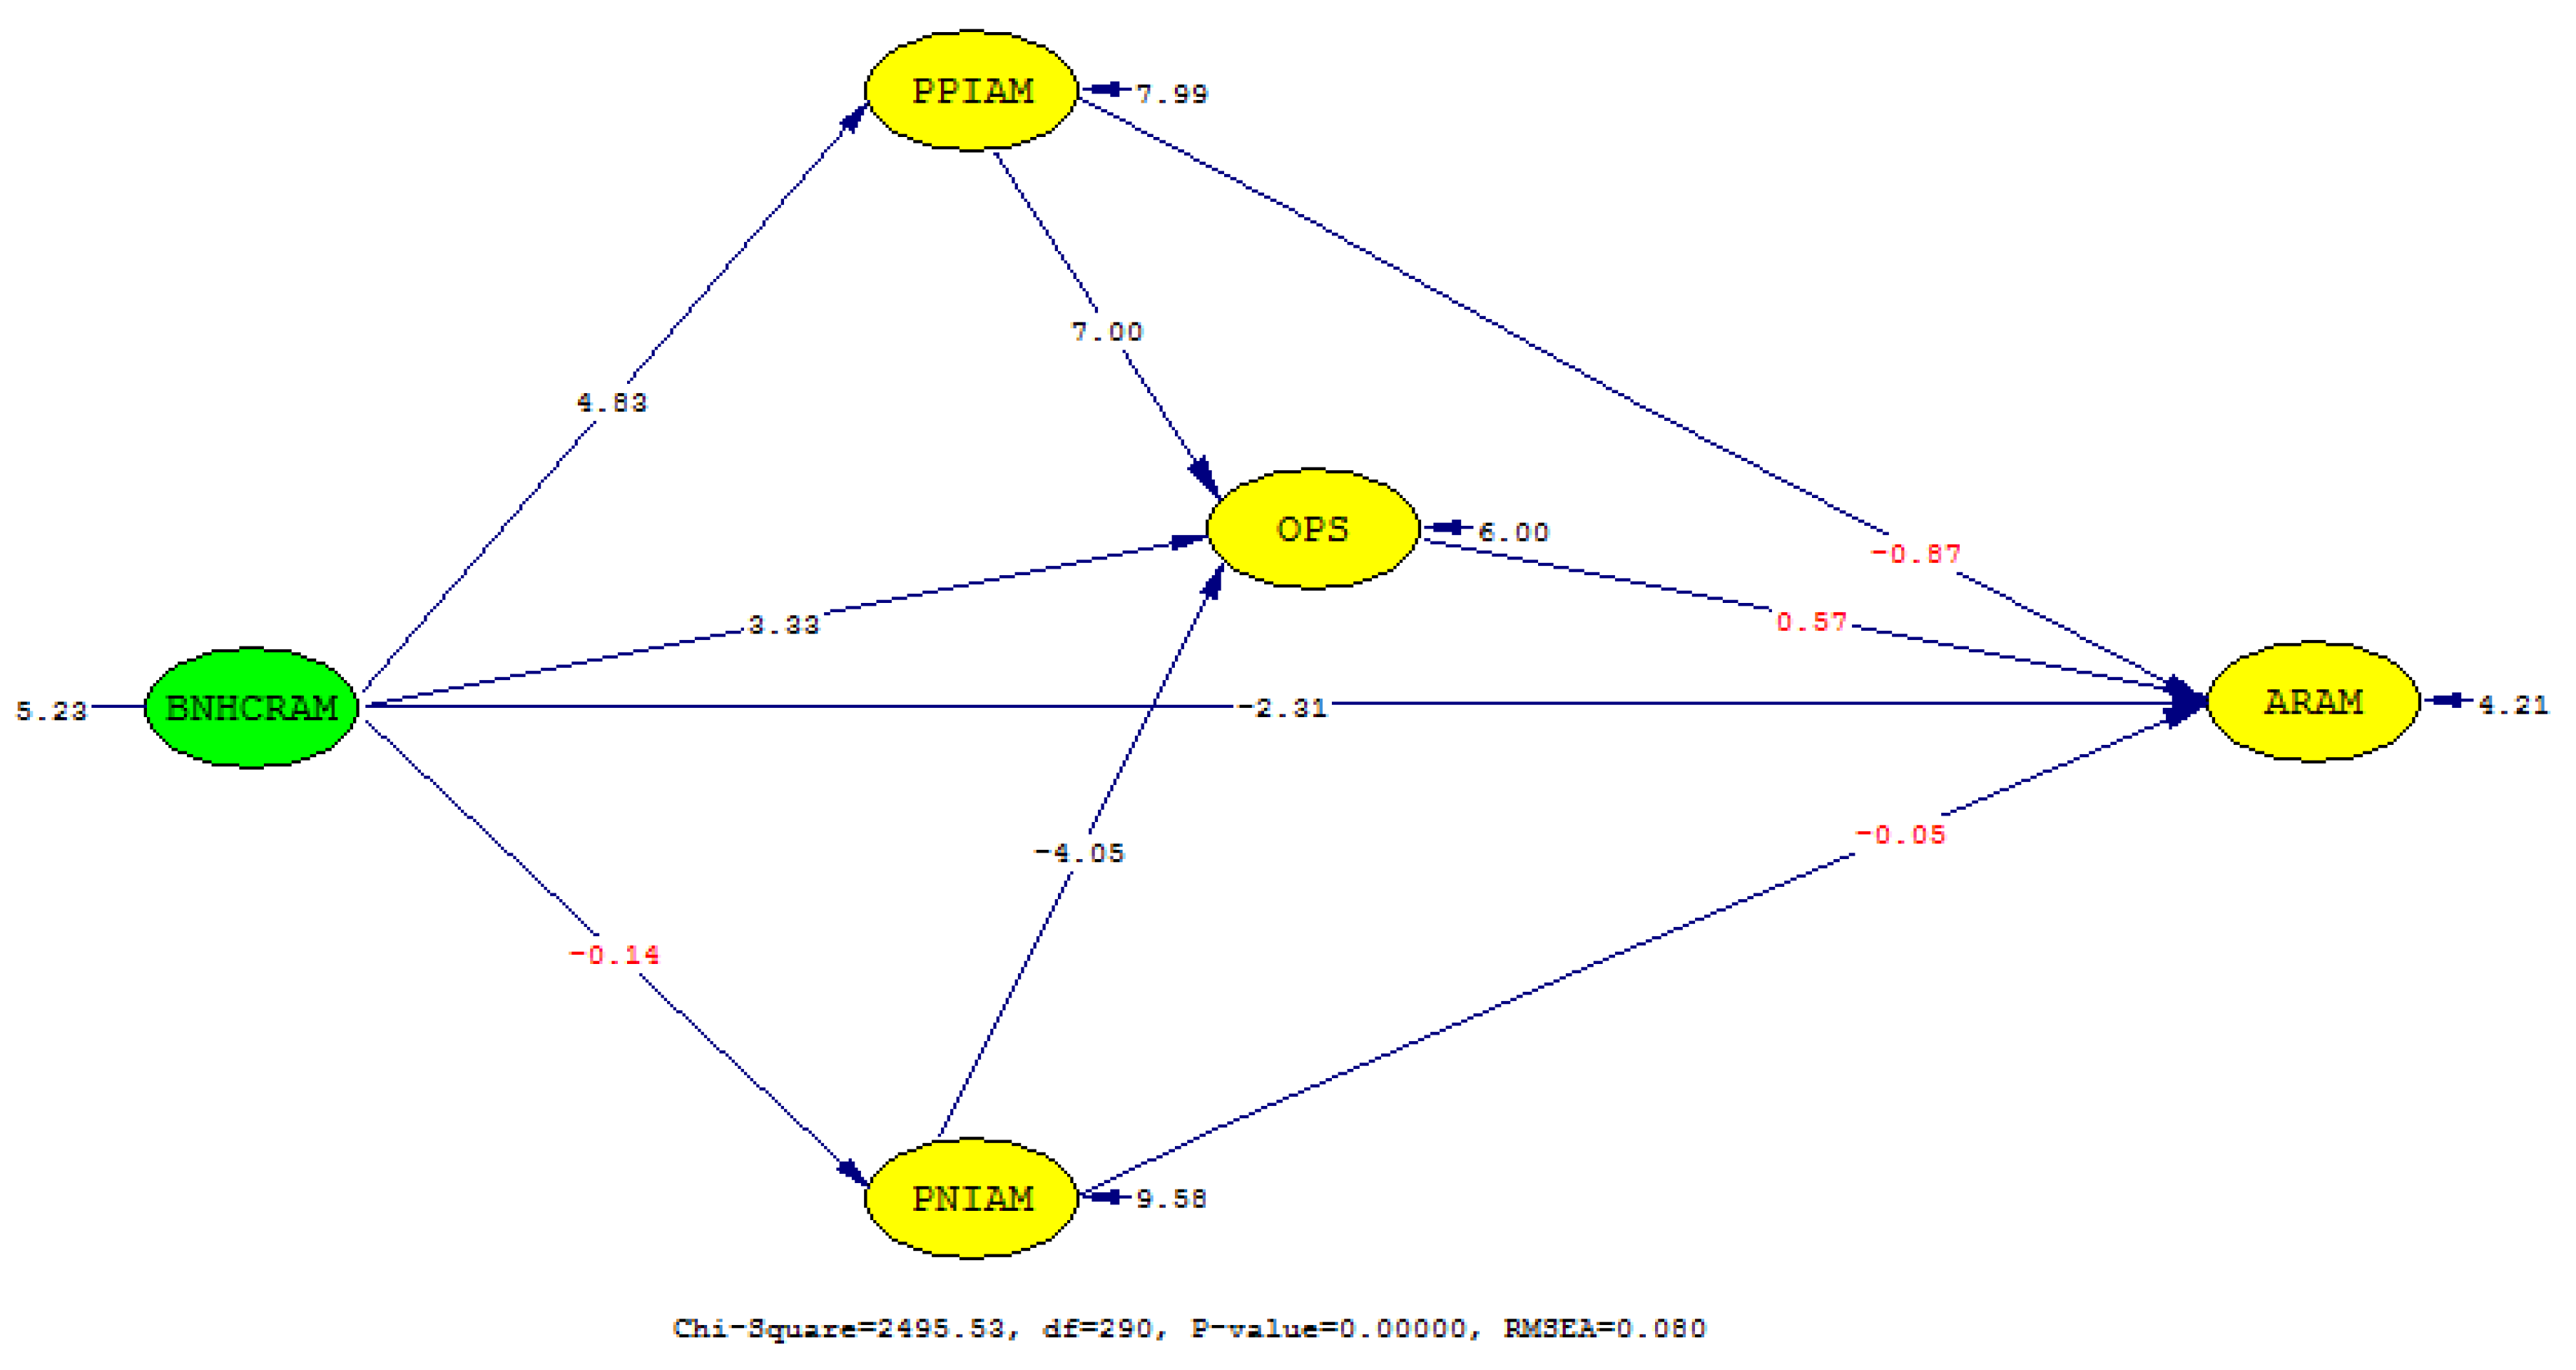
| No. | Path | Standardized Estimate | Standard Error | t-Value |
|---|---|---|---|---|
| 1 | BNHCRAM → PPIAM | 0.39 | 0.20 | 4.83 *** |
| 2 | BNHCRAM → PNIAM | −0.01 | 0.20 | −0.14 |
| 3 | PPIAM → OPS | 0.53 | 0.06 | 7.00 *** |
| 4 | PNIAM → OPS | −0.27 | 0.05 | −4.05 *** |
| 5 | BNHCRAM → OPS | 0.30 | 0.07 | 6.00 ** |
| 6 | PPIAM → ARAM | −0.10 | 0.02 | −0.87 |
| 7 | OPS → ARAM | 0.09 | 0.04 | 0.57 |
| 8 | PNIAM → ARAM | −0.001 | 0.01 | −0.05 |
| 9 | BNHCRAM → ARAM | −0.22 | 0.05 | −2.31 * |
© 2019 by the authors. Licensee MDPI, Basel, Switzerland. This article is an open access article distributed under the terms and conditions of the Creative Commons Attribution (CC BY) license (http://creativecommons.org/licenses/by/4.0/).
Share and Cite
Owili, P.O.; Muga, M.A.; Yang, Y.-T.; Hsu, Y.-H.E. Perceived Impact of Taiwan’s National Health Insurance Allocation Strategy: Health Professionals’ Perspective. Int. J. Environ. Res. Public Health 2019, 16, 467. https://0-doi-org.brum.beds.ac.uk/10.3390/ijerph16030467
Owili PO, Muga MA, Yang Y-T, Hsu Y-HE. Perceived Impact of Taiwan’s National Health Insurance Allocation Strategy: Health Professionals’ Perspective. International Journal of Environmental Research and Public Health. 2019; 16(3):467. https://0-doi-org.brum.beds.ac.uk/10.3390/ijerph16030467
Chicago/Turabian StyleOwili, Patrick Opiyo, Miriam Adoyo Muga, Ya-Ting Yang, and Yi-Hsin Elsa Hsu. 2019. "Perceived Impact of Taiwan’s National Health Insurance Allocation Strategy: Health Professionals’ Perspective" International Journal of Environmental Research and Public Health 16, no. 3: 467. https://0-doi-org.brum.beds.ac.uk/10.3390/ijerph16030467