Bicycle Facilities Safest from Crime and Crashes: Perceptions of Residents Familiar with Higher Crime/Lower Income Neighborhoods in Boston


Abstract
:1. Introduction
2. Materials and Methods
2.1. Survey Locations and Groups
2.2. Theory
2.3. Survey
2.4. Data Analysis
3. Results
3.1. Crime Perception Quantitative Data
3.2. Crash Perception Quantitative Data
3.3. Crime Perception Qualitative Comments
3.4. Crash Perception Qualitative Comment
3.5. If the Findings Are in Bicycle Facility Design Guidelines and CPTED Principles
4. Discussion
4.1. Crime Perception
4.2. Crash Perception
4.3. If the Findings Are in Bicycle Facility Design Guidelines and CPTED Principles
4.4. Reflections on the Relevance and Implications of the Findings
4.5. Limitations
5. Conclusions
Author Contributions
Funding
Conflicts of Interest
References
- Wen, L.M.; Rissel, C. Inverse associations between cycling to work, public transport, and overweight and obesity: Findings from a population based study in Australia. Prev. Med. 2008, 46, 29–32. [Google Scholar] [PubMed]
- Lusk, A.C.; Mekary, R.A.; Feskanich, D.; Willett, W.C. Bicycle riding, walking, and weight gain in premenopausal women. Arch. Intern. Med. 2010, 170, 1050–1056. [Google Scholar] [CrossRef]
- Menai, M.; Charreire, H.; Galan, P.; Simon, C.; Nazare, J.A.; Perchoux, C.; Weber, C.; Enaux, C.; Hercberg, S.; Fezeu, L.; et al. Differential Associations of Walking and Cycling with Body Weight, Body Fat and Fat Distribution - the ACTI-Cites Project. Obes. Facts 2018, 11, 221–231. [Google Scholar] [CrossRef]
- Eriksson, M.; Udden, J.; Hemmingsson, E.; Agewall, S. Impact of physical activity and body composition on heart function and morphology in middle-aged, abdominally obese women. Clin. Physiol. Funct. Imaging 2010, 30, 354–359. [Google Scholar] [CrossRef] [PubMed]
- Sadik-Khan, J.; Solomonow, S. Improving Public Health by Making Cities Friendly to Walking and Biking: Safer, More Active Transportation Starts With the Street. JAMA Intern. Med. 2017. [Google Scholar] [CrossRef] [PubMed]
- Andersen, L.B.; Schnohr, P.; Schroll, M.; Hein, H.O. All-cause mortality associated with physical activity during leisure time, work, sports, and cycling to work. Arch. Intern. Med. 2000, 160, 1621–1628. [Google Scholar] [CrossRef] [PubMed]
- Celis-Morales, C.A.; Lyall, D.M.; Welsh, P.; Anderson, J.; Steell, L.; Guo, Y.; Maldonado, R.; Mackay, D.F.; Pell, J.P.; Sattar, N.; et al. Association between active commuting and incident cardiovascular disease, cancer, and mortality: Prospective cohort study. BMJ 2017, 357, j1456. [Google Scholar] [CrossRef] [PubMed]
- U.S. Census Bureau. Commuting Characteristics by Sex 2011–2015 American Community Survey 5-Year Estimates. Available online: https://factfinder.census.gov/faces/tableservices/jsf/pages/productview.xhtml?src=bkmk (accessed on 4 April 2018).
- People for Bikes and Alliance for Biking and Walking. Building Equity Race, Ethnicity, Class, and Protected Bike Lanes: An Idea Book for Fairer Cities; People for Bikes and Alliance for Biking and Walking: Boulder, CO, USA, 2015. [Google Scholar]
- Sallis, J.F.; Conway, T.L.; Dillon, L.I.; Frank, L.D.; Adams, M.A.; Cain, K.L.; Saelens, B.E. Environmental and demographic correlates of bicycling. Prev. Med. 2013, 57, 456–460. [Google Scholar] [CrossRef] [Green Version]
- August, K.J.; Sorkin, D.H. Racial/ethnic disparities in exercise and dietary behaviors of middle-aged and older adults. J. Gener. Intern. Med. 2011, 26, 245–250. [Google Scholar] [CrossRef]
- Rosenberg, L.; Kipping-Ruane, K.L.; Boggs, D.A.; Palmer, J.R. Physical activity and the incidence of obesity in young african-american women. Am. J. Prev. Med. 2013, 45, 262–268. [Google Scholar] [CrossRef]
- Flegal, K.M.; Kruszon-Moran, D.; Carroll, M.D.; Fryar, C.D.; Ogden, C.L. Trends in Obesity Among Adults in the United States, 2005 to 2014. JAMA 2016, 315, 2284–2291. [Google Scholar] [CrossRef] [PubMed]
- Brown, C. Fear: A Silent Barrier to Bicycling in Black and Hispanic Communities. Available online: https://nacto.org/wp-content/uploads/2017/03/2016_Brown_Fear-A-Silent-Barrier-to-Bicycling-in-Black-and-Hispanic-Communities.pdf (accessed on 8 January 2019).
- Centers for Disease Control and Prevention. Neighborhood Safety and the Prevalence of Physical Inactivity—Selected States, 1996. Morb. Mortal. Wkly. Rep. 1999, 47, 143–146. [Google Scholar]
- Evenson, K.R.; Scott, M.M.; Cohen, D.A.; Voorhees, C.C. Girls’ perception of neighborhood factors on physical activity, sedentary behavior, and BMI. Obesity 2007, 15, 430–445. [Google Scholar] [CrossRef] [PubMed]
- U.S. Department of Health and Human Services. Healthy People 2010, Understanding and Improving Health, 2nd ed.; U.S. Department of Health and Human Services: Washington, DC, USA, 2000. [Google Scholar]
- Foster, S.; Giles-Corti, B. The built environment, neighborhood crime and constrained physical activity: An exploration of inconsistent findings. Prev. Med. 2008, 47, 241–251. [Google Scholar] [CrossRef] [PubMed]
- Appleyard, B.; Ferrell, C. A105 The Meaning of “Mean Streets” for Sustainable & Active Travel: Crime, (Pedestrian/Bike) Casualities and Mode Choice. J. Transp. Health 2015, 2, S5–S63. [Google Scholar]
- Jacobs, J. The Death and Life of Great American Cities; Vintage Books: New York, NY, USA, 1961. [Google Scholar]
- Jeffrey, C.R. Crime Prevention Through Environmental Design; Sage Publications: Beverly Hills, CA, USA, 1971. [Google Scholar]
- Jeffrey, C.R. Criminology: An Interdisciplinary Approach; Prentice-Hall: Engelwood Cliffs, NJ, USA, 1990. [Google Scholar]
- Newman, O. Defensible Space: Crime Prevention Through Urban Design; Macmillan: New York, NY, USA, 1972. [Google Scholar]
- Kelling, G.; Coles, C. Fixing Broken Windows: Restoring Order and Reducing Crime in Our Communities; Simon & Schuster: New York, NY, USA, 1996. [Google Scholar]
- Winters, M.; Brauer, M.; Setton, E.M.; Teschke, K. Built environment influences on healthy transportation choices: Bicycling versus driving. J. Urban Health 2010, 87, 969–993. [Google Scholar] [CrossRef]
- Yu, C.Y. Environmental supports for walking/biking and traffic safety: Income and ethnicity disparities. Prev. Med. 2014, 67, 12–16. [Google Scholar] [CrossRef]
- American Association of State Highway and Transportation Officials. Guide for the Development of Bicycle Facilities; American Association of State Highway and Transportation Officials: Washington, DC, USA, 2012; Volume 4. [Google Scholar]
- Forester, J. Effective Cycling; Custom Cycle Fitments: Berkeley, CA, USA, 1976. [Google Scholar]
- League of American Bicyclists. Our Classes. Available online: https://www.bikeleague.org/content/find-take-class (accessed on 16 August 2018).
- Pucher, J.; Buehler, R. Making Cycling Irresistible: Lessons from the Netherlands, Denmark, and Germany. Transp. Rev. 2008, 28, 1–34. [Google Scholar] [CrossRef]
- CROW. Design Manual for Bicycle Traffic; National Information and Technology Platform for Infrastructure, Traffic, Transport, and Public Space: Amsterdam, The Netherlands, 2006. [Google Scholar]
- Verkeersnet.nl. Fietsersbond: Veel Meer Fietspad dan Bekend in Ons Land. Available online: http://www.verkeersnet.nl/1782/fietsersbond-veel-meer-fietspad-dan-bekend-in-ons-land/ (accessed on 21 April 2018).
- Lusk, A.C.; Morency, P.; Miranda-Moreno, L.F.; Willett, W.C.; Dennerlein, J.T. Bicycle guidelines and crash rates on cycle tracks in the United States. Am. J. Public Health 2013, 103, 1240–1248. [Google Scholar] [CrossRef]
- Thomas, B.; DeRobertis, M. The safety of urban cycle tracks: A review of the literature. Accid. Anal. Prev. 2013, 52, 219–227. [Google Scholar] [CrossRef]
- Teschke, K.; Harris, M.A.; Reynolds, C.C.; Winters, M.; Babul, S.; Chipman, M.; Cusimano, M.D.; Brubacher, J.R.; Hunte, G.; Friedman, S.M.; et al. Route Infrastructure and the Risk of Injuries to Bicyclists: A Case-Crossover Study. Am. J. Public Health 2012, 102, 2336–2343. [Google Scholar] [CrossRef] [PubMed] [Green Version]
- Buehler, R.; Pucher, J. Trends in Walking and Cycling Safety: Recent Evidence From High-Income Countries, With a Focus on the United States and Germany. Am. J. Public Health 2017, 107, 281–287. [Google Scholar] [CrossRef] [PubMed] [Green Version]
- Li, H.; Graham, D.J.; Liu, P. Safety effects of the London cycle superhighways on cycle collisions. Accid. Anal. Prev. 2017, 99, 90–101. [Google Scholar] [CrossRef]
- Manton, R.; Rau, H.; Fahy, F.; Sheahan, J.; Clifford, E. Using mental mapping to unpack perceived cycling risk. Accid. Anal. Prev. 2016, 88, 138–149. [Google Scholar] [CrossRef]
- Lusk, A.C.; Furth, P.G.; Morency, P.; Miranda-Moreno, L.F.; Willett, W.C.; Dennerlein, J.T. Risk of injury for bicycling on cycle tracks versus in the street. Inj. Prev. 2011, 17, 131–135. [Google Scholar] [CrossRef] [PubMed] [Green Version]
- Winters, M.; Teschke, K. Route preferences among adults in the near market for bicycling: Findings of the cycling in cities study. Am. J. Health Promot. 2010, 25, 40–47. [Google Scholar] [CrossRef] [PubMed]
- Lusk, A.; Anastasio, A.; Shaffer, N.; Wu, J.; Li, Y. Biking practices and preferences in a lower income, primarily minority neighborhood: Learning what residents want. Prev. Med. Rep. 2017, 7, 232–238. [Google Scholar] [CrossRef]
- PeopleforBikes. Protected Bike Lanes Updated 05 05 2017. Available online: https://docs.google.com/spreadsheets/d/11H0gArHxo6kMop1I18yMcq7ArbNrwaGBLmIXgqI1Gjk/edit#gid=3 (accessed on 21 May 2018).
- Pucher, J.; Buehler, R. Safer Cycling Through Improved Infrastructure. Am. J. Public Health 2016, 106, 2089–2091. [Google Scholar] [CrossRef]
- Schultheiss, W.; Sanders, R.; Toole, J. A Historical Perspective on the AASHTO Guide for the Development of Bicycle Facilities and the Impact of the Vehicular Cycling Movement. Transp. Res. Board 2018. [Google Scholar] [CrossRef]
- Greibe, P.; Skallebaek Buck, T. Capacity and Behavior on One-way Cycle Tracks of Different Widths. Transp. Res. Procedia 2016, 15, 122–136. [Google Scholar] [CrossRef]
- Lusk, A.C.; Asgarzadeh, M.; Farvid, M.S. Database improvements for motor vehicle/bicycle crash analysis. Inj. Prev. 2015, 21, 221–230. [Google Scholar] [CrossRef] [PubMed] [Green Version]
- Ratanavaraha, V.; Jommonkwao, S. The efficienty testing of Shoulder Rumble Strips (SRS) on noise alerting drivers in Thailand: A comparison among three SRS. Adv. Transp. Stud. Int. J. 2015, 36, 109–118. [Google Scholar]
- Taylor, S.E.; Klein, L.C.; Lewis, B.P.; Gruenewald, T.L.; Gurung, R.A.; Updegraff, J.A. Biobehavioral responses to stress in females: Tend-and-befriend, not fight-or-flight. Psychol. Rev. 2000, 107, 411–429. [Google Scholar] [CrossRef] [PubMed]
- Jaffe, E. The Poor Bike, The Rich Bike-Share. Available online: https://www.citylab.com/transportation/2015/10/the-poor-bike-the-rich-bike-share/413119/ (accessed on 15 August 2018).
- Boston Police Department and Suffolk County District Attorney’s Office. Murders in Boston During 2010. Available online: http://www.boston.com/news/local/massachusetts/2010_murders_in_boston/ (accessed on 5 May 2011).
- City-Data.com. Boston, Massachusetts (MA) Poverty Rate Data—Information about Poor and Low Income Residents. Available online: http://www.city-data.com/poverty/poverty-Boston-Massachusetts.html (accessed on 20 January 2019).
- Sperling’s Best Places. Economy in Mattapan (Zip 02126) Massachusetts. Available online: http://www.bestplaces.net/economy/zip-code/massachusetts/mattapan/02126 (accessed on 20 January 2019).
- Boston Public Health Commission. Health-of-Boston Report Chapter 1: Demographics. Available online: http://www.bphc.org/healthdata/health-of-boston-report/Documents/HOB-2014-2015/1_Demographics_HOB%202014-2015.pdf (accessed on 21 June 2018).
- Bernasco, W. Offenders on Offending: Learning about Crime from Criminals; Routledge: New York, NY, USA, 2011; p. 311. [Google Scholar]
- Cozens, P.; Hillier, D.; Prescott, G. Defensible Space: Burglars and Police Evaluate Urban Residential Design. Secur. J. 2011, 14, 43–62. [Google Scholar] [CrossRef]
- Stokols, D. Establishing and maintaining healthy environments. Toward a social ecology of health promotion. Am. Psychol. 1992, 47, 6–22. [Google Scholar] [CrossRef]
- Maslow, A. A Theory of Human Motivation. Psychol. Rev. 1943, 50, 370–396. [Google Scholar] [CrossRef]
- Winters, P.; Tucker, L. Creative Solutions for Assessing Level of Service Equally Across Modes. Transp. Res. Record 2004, 1883, 185–191. [Google Scholar] [CrossRef]
- National Association of City Transportation Officials. NACTO Urban Bikeway Design Guide. Available online: http://nacto.org/cities-for-cycling/design-guide/ (accessed on 1 June 2018).
- National Association of City Transporation Officials. Designing for All Ages & Abilities—NEW. Available online: https://nacto.org/publication/urban-bikeway-design-guide/designing-ages-abilities-new/ (accessed on 27 August 2018).
- Lewin, J. How Jane Jacobs Fought ‘Urban Renewal’ in the West Village and Won. Available online: http://www.nydailynews.com/new-york/jane-jacobs-fought-urban-renewal-west-village-article-1.2962679# (accessed on 20 September 2018).
- Jacobs, J. Downtown Is for People. Available online: http://innovationecosystem.pbworks.com/w/file/fetch/63349251/DowntownisforPeople.pdf (accessed on 20 September 2018).
- Sohn, D. Residential crimes and neighbourhood built environment: Assessing the effectiveness of crime prevention through environmental design (CPTED). Cities 2016, 52, 86–93. [Google Scholar] [CrossRef]
- Brantingham, P.; Brantingham, P. Nodes, Paths and Edges: Considerations of the Complexity of Crime and the Physical Environment. J. Environ. Psychol. 1993, 13, 3–28. [Google Scholar] [CrossRef]
- Ridgeway, G. An Examination of Racial Disparities in Bicycle Stops and Citations Made by the Tampa Police Department. Available online: https://assets.documentcloud.org/documents/2812648/An-Examination-of-Racial-Disparities-in-Bicycle.pdf (accessed on 20 December 2016).
- Hoffman, M.R.; Kmiecik, A. Bicycle Citations and Related Arrests in Minneapolis 2009–2015. Available online: https://d3n8a8pro7vhmx.cloudfront.net/mplsbike/pages/3970/attachments/original/1476137957/MBC_Police_Citations_Report_Final2_small.pdf?1476137957 (accessed on 20 December 2016).
- Kaplan, S.; Kaplan, R. Health, supportive environments, and the Reasonable Person Model. Am. J. Public Health 2003, 93, 1484–1489. [Google Scholar] [CrossRef]
- Powell, L.M.; Slater, S.; Chaloupka, F.J.; Harper, D. Availability of physical activity-related facilities and neighborhood demographic and socioeconomic characteristics: A national study. Am. J. Public Health 2006, 96, 1676–1680. [Google Scholar] [CrossRef] [PubMed]
- Roberts, L. ‘Bike Lanes are White Lanes!’: The Social Implications of Urban Active Transportation Planning in the Built Environment of Portland, OR; Lewis & Clark College: Portland, OR, USA, 2014. [Google Scholar]
- Mekuria, M.; Furth, P.G.; Nixon, H. Low-Stress Bicycling and Network Connectivity; California Department of Transportation: San Jose, CA, USA, 2012. [Google Scholar]
- Nassauer, J. Messy ecosystems, orderly frames. Landsc. J. 1995, 14, 161–170. [Google Scholar] [CrossRef]
- Appleyard, D.; Lintell, M. The environmental quality of city streets: The residents’ viewpoint. J. Am. Inst. Plan. 1972, 38, 84–101. [Google Scholar] [CrossRef]
- Chen, L.; Chen, C.; Srinivasan, R.; McKnight, C.E.; Ewing, R.; Roe, M. Evaluating the Safety Effects of Bicycle Lanes in New York City. Am. J. Public Health 2012, 102, 1120–1127. [Google Scholar] [CrossRef] [PubMed] [Green Version]
- Guo, Z. Residential Street Parking and Car Ownership: A Study of Households With Off-Street Parking in the New York City Region. J. Am. Plan. Assoc. 2013, 79, 32–48. [Google Scholar] [CrossRef]
- Henderson, J. Level of Service: The politics of reconfiguring urban streets in San Francisco, CA. J. Transp. Geogr. 2011, 19, 1138–1144. [Google Scholar] [CrossRef]
- Andersen, M. How Protected Bike Lanes Helped Denmark Win Its War on Inequality. Available online: http://www.peopleforbikes.org/blog/entry/does-better-biking-help-poor-people-denmark-shows-the-slow-huge-payoff (accessed on 21 June 2018).
- Tester, J.M. The built environment: Designing communities to promote physical activity in children. Pediatrics 2009, 123, 1591–1598. [Google Scholar]
- Lusk, A. Bus and Bus Stop Designs Related to Perceptions of Crime; FTA MI-26-7004-2001.1; Ann Arbor Transportation Authority; Great Lakes Center for Truck and Transit Research; Taubman College of Architecture and Urban Planning—Environment and Behavior—University of Michigan, U.S. Department of Transportation; Federal Transit Administration, Office of Research, Demonstration and Innovation: Washington, DC, USA, 2001; pp. 1–102. [Google Scholar]
- Reynolds, C.C.; Harris, M.A.; Teschke, K.; Cripton, P.A.; Winters, M. The impact of transportation infrastructure on bicycling injuries and crashes: A review of the literature. Environ. Health 2009, 8, 47. [Google Scholar] [CrossRef]
- De Rome, L.; Boufous, S.; Georgeson, T.; Senserrick, T.; Richardson, D.; Ivers, R. Bicycle crashes in different riding environments in the Australian capital territory. Traffic Inj. Prev. 2014, 15, 81–88. [Google Scholar] [CrossRef]
- Garrard, J. Healthy revolutions: Promoting cycling among women. Health Promot. J. Aust. 2003, 14, 213–215. [Google Scholar] [CrossRef]
- Garrard, J.; Rose, G.; Lo, S.K. Promoting transportation cycling for women: The role of bicycle infrastructure. Prev. Med. 2008, 46, 55–59. [Google Scholar] [CrossRef] [PubMed]
- Aldred, R.; Elliott, B.; Woodcock, J.; Goodman, A. Cycling provision separated from motor traffic: A systematic review exploring whether stated preferences vary by gender and age. Transp. Rev. 2017, 37, 29–55. [Google Scholar] [CrossRef]
- Heesch, K.C.; Sahlqvist, S.; Garrard, J. Gender differences in recreational and transport cycling: A cross-sectional mixed-methods comparison of cycling patterns, motivators, and constraints. Int. J. Behav. Nutr. Phys. Act. 2012, 9, 106. [Google Scholar] [CrossRef] [PubMed]
- Wheeler, N.; Conrad, R.; Figliozzi, M. A Statistical Analysis of Bicycle Rider Performance:The impact of gender on riders’ performance at signalized intersections. In Proceedings of the 89th Annual Meeting of the Transportation Research Board, Washington, DC, USA, 10–14 January 2010. [Google Scholar]
- Appleyard, D.; Lynch, K.; Meyer, J. The View From the Road; The MIT. Press: Cambridge, MA, USA, 1964. [Google Scholar]
- Lynch, K. The Image of the City; The MIT Press: Cambridge, MA, USA, 1960. [Google Scholar]
- Kaplan, S.; Kaplan, R. Humanscape: Environments for People; Ulrich’s Books: Ann Arbor, MI, USA, 1982. [Google Scholar]
- Alexander, C.; Ishikawa, S.; Silverstein, M.; Jacobson, M.; Fiksdahl-King, I.; Angel, S. A Pattern Language; Oxford University Press: New York, NY, USA, 1977. [Google Scholar]
- Lusk, A.; Wen, X.; Zhou, L. Gender and used/preferred differences of bicycle routes, parking, intersection signals, and bicycle type: Professional middle class preferences in Hangzhou, China. J. Transp. Health 2014, 1, 124–133. [Google Scholar] [CrossRef] [Green Version]
- Mason, J.; Fulton, L.; McDonald, Z. A Global High Shift Cycling Scenario: The Potential for Dramatically Increasing Bicycle and E-Bike Use in Cities Around the World, with Estimated Energy, CO2, and Cost Impacts. Available online: https://3gozaa3xxbpb499ejp30lxc8-wpengine.netdna-ssl.com/wp-content/uploads/2015/11/A-Global-High-Shift-Cycling-Scenario_Nov-2015.pdf (accessed on 16 January 2018).
- Mukherjee, D. Manage Storm Water by Using Porous Pavement. J. Mech. Civ. Eng. 2010, 11, 1–3. [Google Scholar] [CrossRef]
- Lusk, A.; Silva Filho, D.; Dobbert, L. Pedestrian and cyclists preferences for tree locations by sidewalks and cycle tracks and associated benefits: Worldwide implications from a study in Boston, MA. Cities 2018. [Google Scholar] [CrossRef]
- Broaddus, A. Tale of Two Ecosuburbs in Freiburg, Germany: Encouraging Transit and Bicycle Use by Restricting Parking Provision. Transp. Res. Record J. Transp. Res. Board 2010, 114–129. [Google Scholar] [CrossRef]
- Lusk, A. A History of Bicycle Environments in China: Comparisons with the US and the Netherlands. Harv. Asia Q. 2012, 14, 16–27. [Google Scholar]
- Day, S.; Wiseman, P.; Dickinson, S.; Harris, J. Tree Root Ecology in the Urban Environment and Implications for a Sustainable Rhizosphere. Aboric. Urban For. 2010, 36, 193–204. [Google Scholar]
- Lusk, A. Designing Greener Streets Starts with Finding Room for Bicycles and Trees. Available online: https://theconversation.com/designing-greener-streets-starts-with-finding-room-for-bicycles-and-trees-101064 (accessed on 13 October 2018).
- Lusk, A.; Li, Y. Bicycling, Health and Weather-Related Disasters: Potential Data to Better Predict Risk. Available online: https://cdn1.sph.harvard.edu/wp-content/uploads/sites/1008/2012/08/Bicycling-health-and-weather-related-disasters_English.pdf (accessed on 6 February 2018).
- Brann, S. Bicycles: Ultimate Natural Disaster Response Tools. Available online: http://www.bikearlington.com/bicycles-ultimate-natural-disaster-response-tools/ (accessed on 10 October 2018).
- Baart, F. Evacuate by Bike, 5 Times More Efficient. Available online: https://www.linkedin.com/pulse/evacuate-bike-5-times-more-efficient-fedor-baart/ (accessed on 10 October 2018).
- Weingroff, R. Highway History The Greatest Decade 1956–1966. Available online: https://www.fhwa.dot.gov/infrastructure/50interstate2.cfm (accessed on 13 July 2018).
- Goodyear, S. Bike Lane Backlash, Even in Portland. Available online: https://www.citylab.com/transportation/2011/09/portland-bike-lanes-open-racial-wounds/138/ (accessed on 13 July 2018).


| Facility | Description |
|---|---|
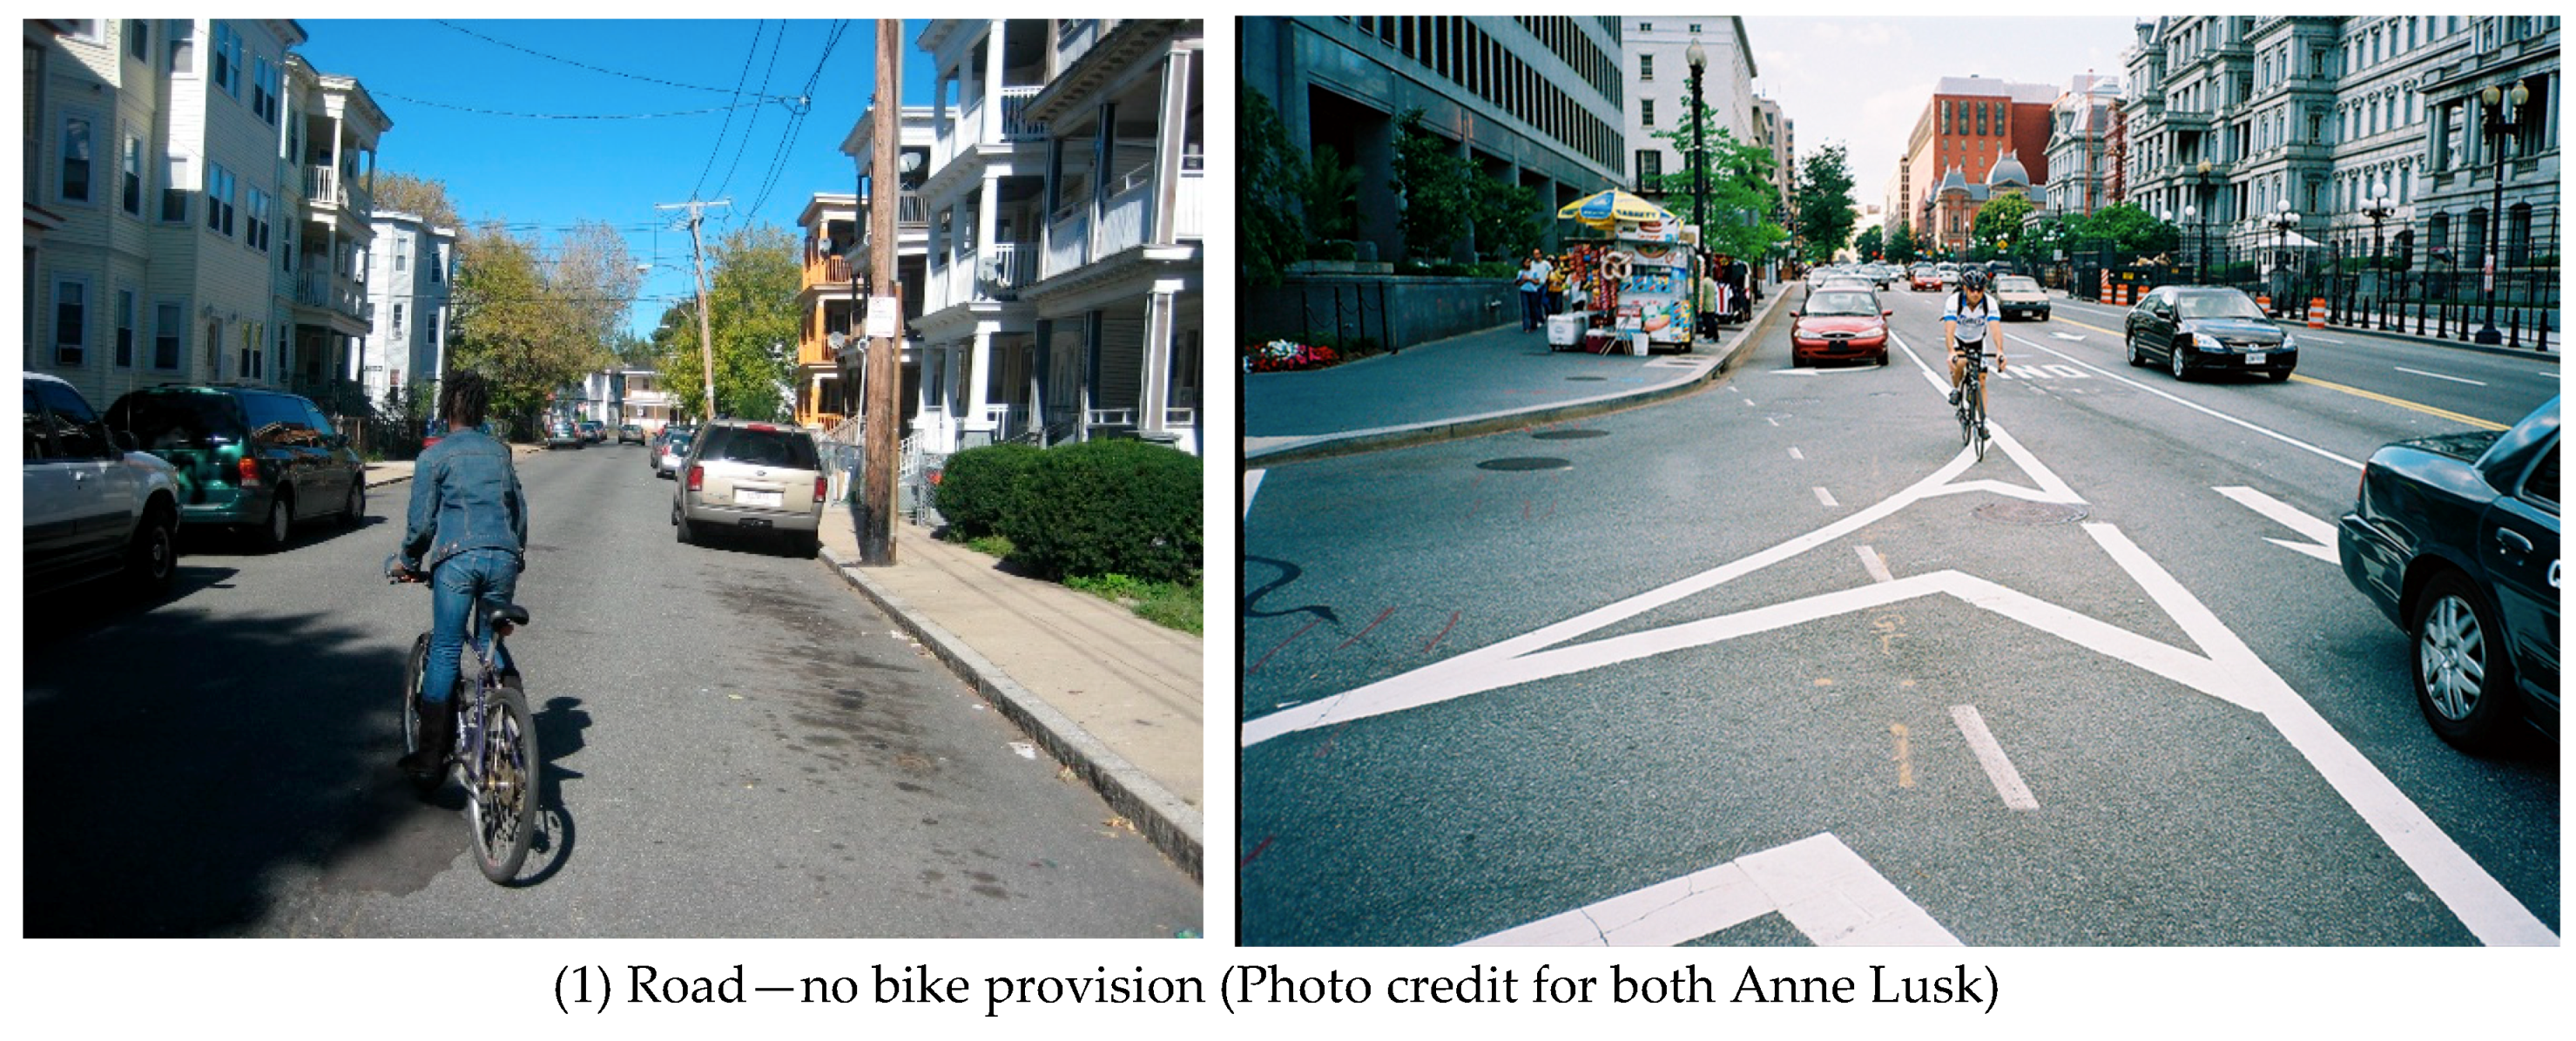
| (1) Road with no bicycle provision | Bicyclists are, by law, allowed to ride on all roads except interstate highways. The roads can be narrow one- or two-way neighborhood roads or multi-lane roads. The roads can also have parallel-parked cars. |
| (2) Road with sharrows (bicycle stencil and a double chevron) | A sharrow, shared lane marking, is to alert drivers that bicyclists will bicycle in that location in that travel lane. The sharrow also indicates to bicyclists the best position for riding within the lane. Sometimes, the sharrow is near the middle of the lane to avoid an opening car door. |
| (3) Painted bike lane | A painted bike lane is a portion of the roadway that can include a bicycle stencil and an arrow. A painted bike lane can also be beside parallel-parked cars or beside a curb. A bicycle lane has no physical separation to prevent drivers from driving into or parking in the space. |
| (4) One-way cycle track | A one-way cycle track has a barrier, such as bollards or parked cars, to prevent drivers from entering or parking within the cycle track. A cycle track is for the exclusive use by bicyclists and, unlike a shared use path, not shared with pedestrians. A one-way cycle track can be level with the road, level with the sidewalk, or travel through a park. |
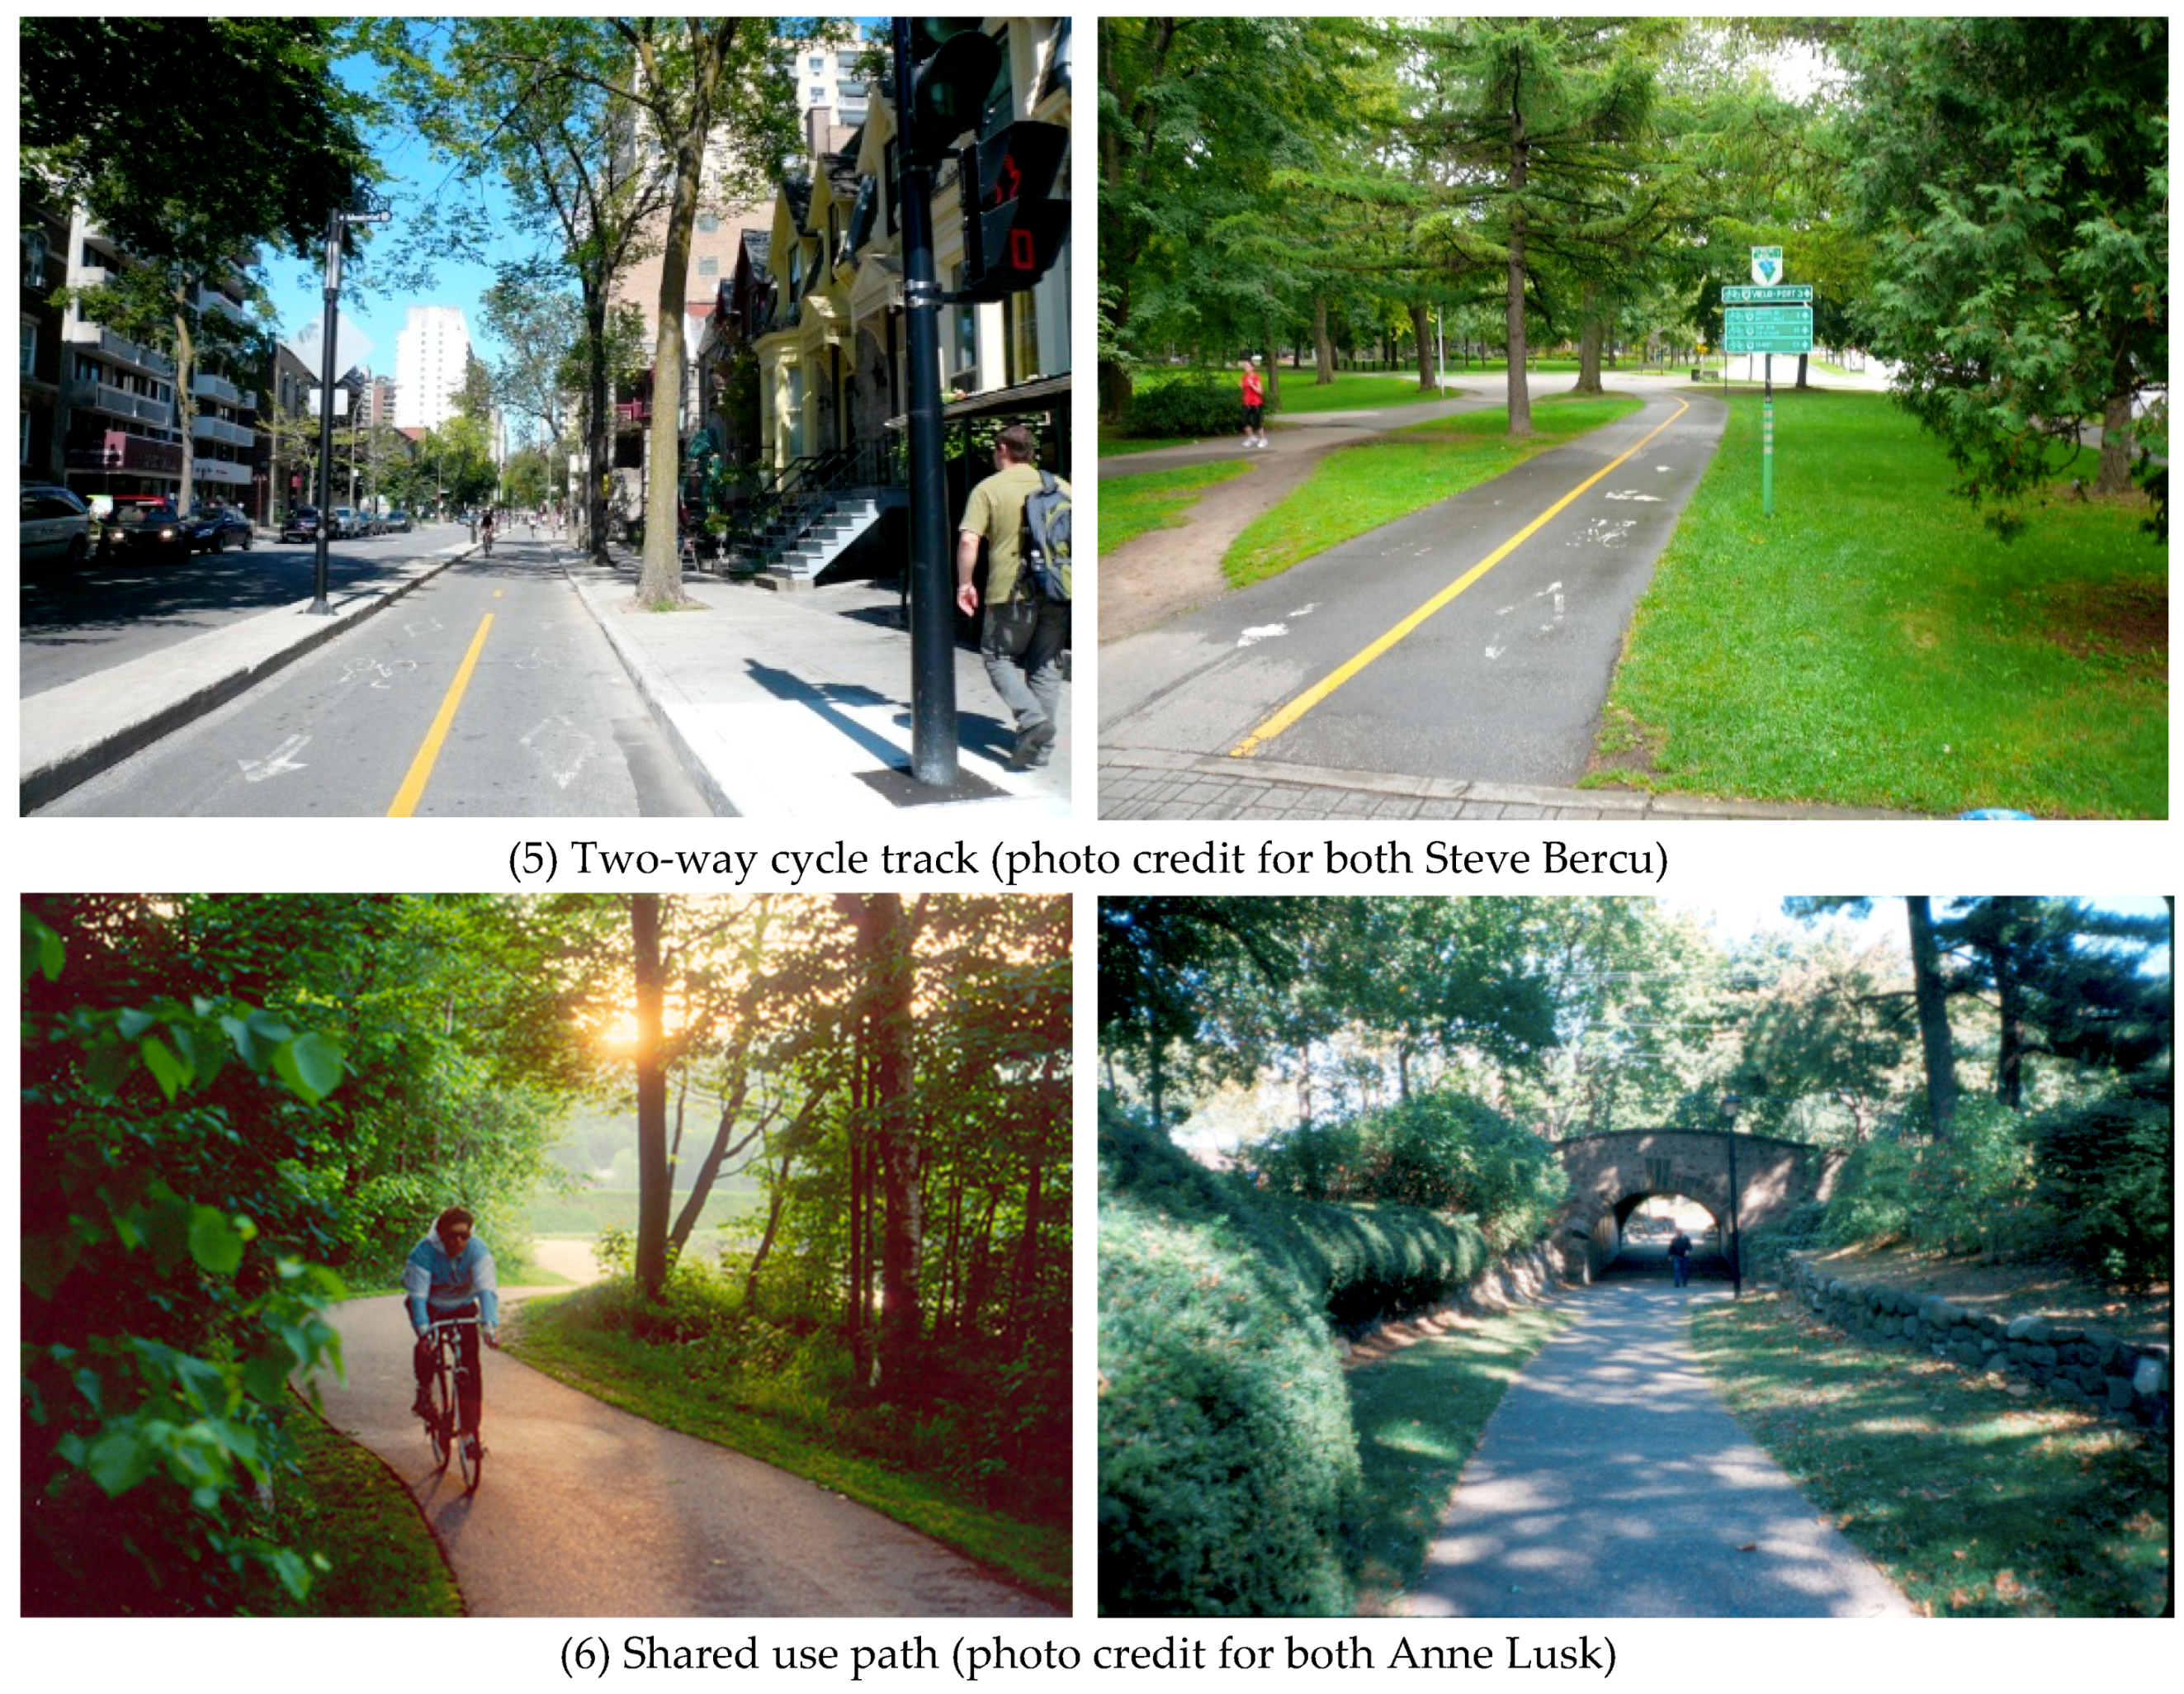
| (5) Two-way cycle track | A two-way cycle track has a barrier, such as bollards or parked cars, to prevent drivers from entering or parking within the cycle track. The two-way cycle track has bicycle stencils and arrows with a line in the middle to indicate that bicyclists will be riding in two directions. |
| (6) Shared-use path | Shared use paths are asphalt/hard surface paths shared by walkers, bikers, joggers, in-line skaters, wheelchair users, baby carriage pushers, and scooters. These paths can be adjacent to roads, run through parks, or parallel property or waterways. |
| Area | Groups | N | Age Mean ± SDs (Min–Max) | Sex (Female, %) | Bicycle (Yes, %) |
|---|---|---|---|---|---|
| Total | 212 | 36.6 ± 14.0 (18–79) | 42.5 | 87.3 | |
| Commty. 1 | 1 | 18 | 33.9 ± 9.8 (18–53) | 50.0 | 77.8 |
| 2 | 21 | 45.8 ± 13.5 (22–66) | 95.2 | 76.2 | |
| 3 | 11 | 31.3 ± 14.4 (18–65) | 27.3 | 100 | |
| 4 | 14 | 40.8 ± 14.5 (18–60) | 85.7 | 92.9 | |
| 5 | 16 | 32.6 ± 11.5 (21–52) | 56.3 | 93.8 | |
| 6 | 10 | 29.8 ± 11.7 (18–46) | 40.0 | 70.0 | |
| 7 | 17 | 46.8 ± 21.1 (19–79) | 35.3 | 82.3 | |
| 8 | 9 | 38.7 ± 12.7 (22–57) | 44.4 | 100 | |
| All | 116 | 38.3 ± 15.1 (18–79) | 57.8 | 85.3 | |
| Street 2 | 9 | 14 | 34.5 ± 10.0 (22–60) | 100 | 92.9 |
| 10 | 21 | 32.0 ± 9.0 (18–52) | 0 | 95.2 | |
| 11 | 13 | 36.6 ± 7.9 (25–54) | 23.1 | 92.3 | |
| 12 | 20 | 21.9 ± 4.7 (18–38) | 25.0 | 95.0 | |
| 13 | 28 | 44.9 ± 11.9 (25–67) | 3.6 | 78.6 | |
| All | 96 | 34.5 ± 12.2 (18–67) | 24.0 | 89.6 |
| Bicycle Facility | All | One Way Cycle Track | Two Way Cycle Track | Road | Shared-Use Path | Bike Lane | Sharrow | |||||||
|---|---|---|---|---|---|---|---|---|---|---|---|---|---|---|
| Mean | Std | Mean | Std | Mean | Std | Mean | Std | Mean | Std | Mean | Std | Mean | Std | |
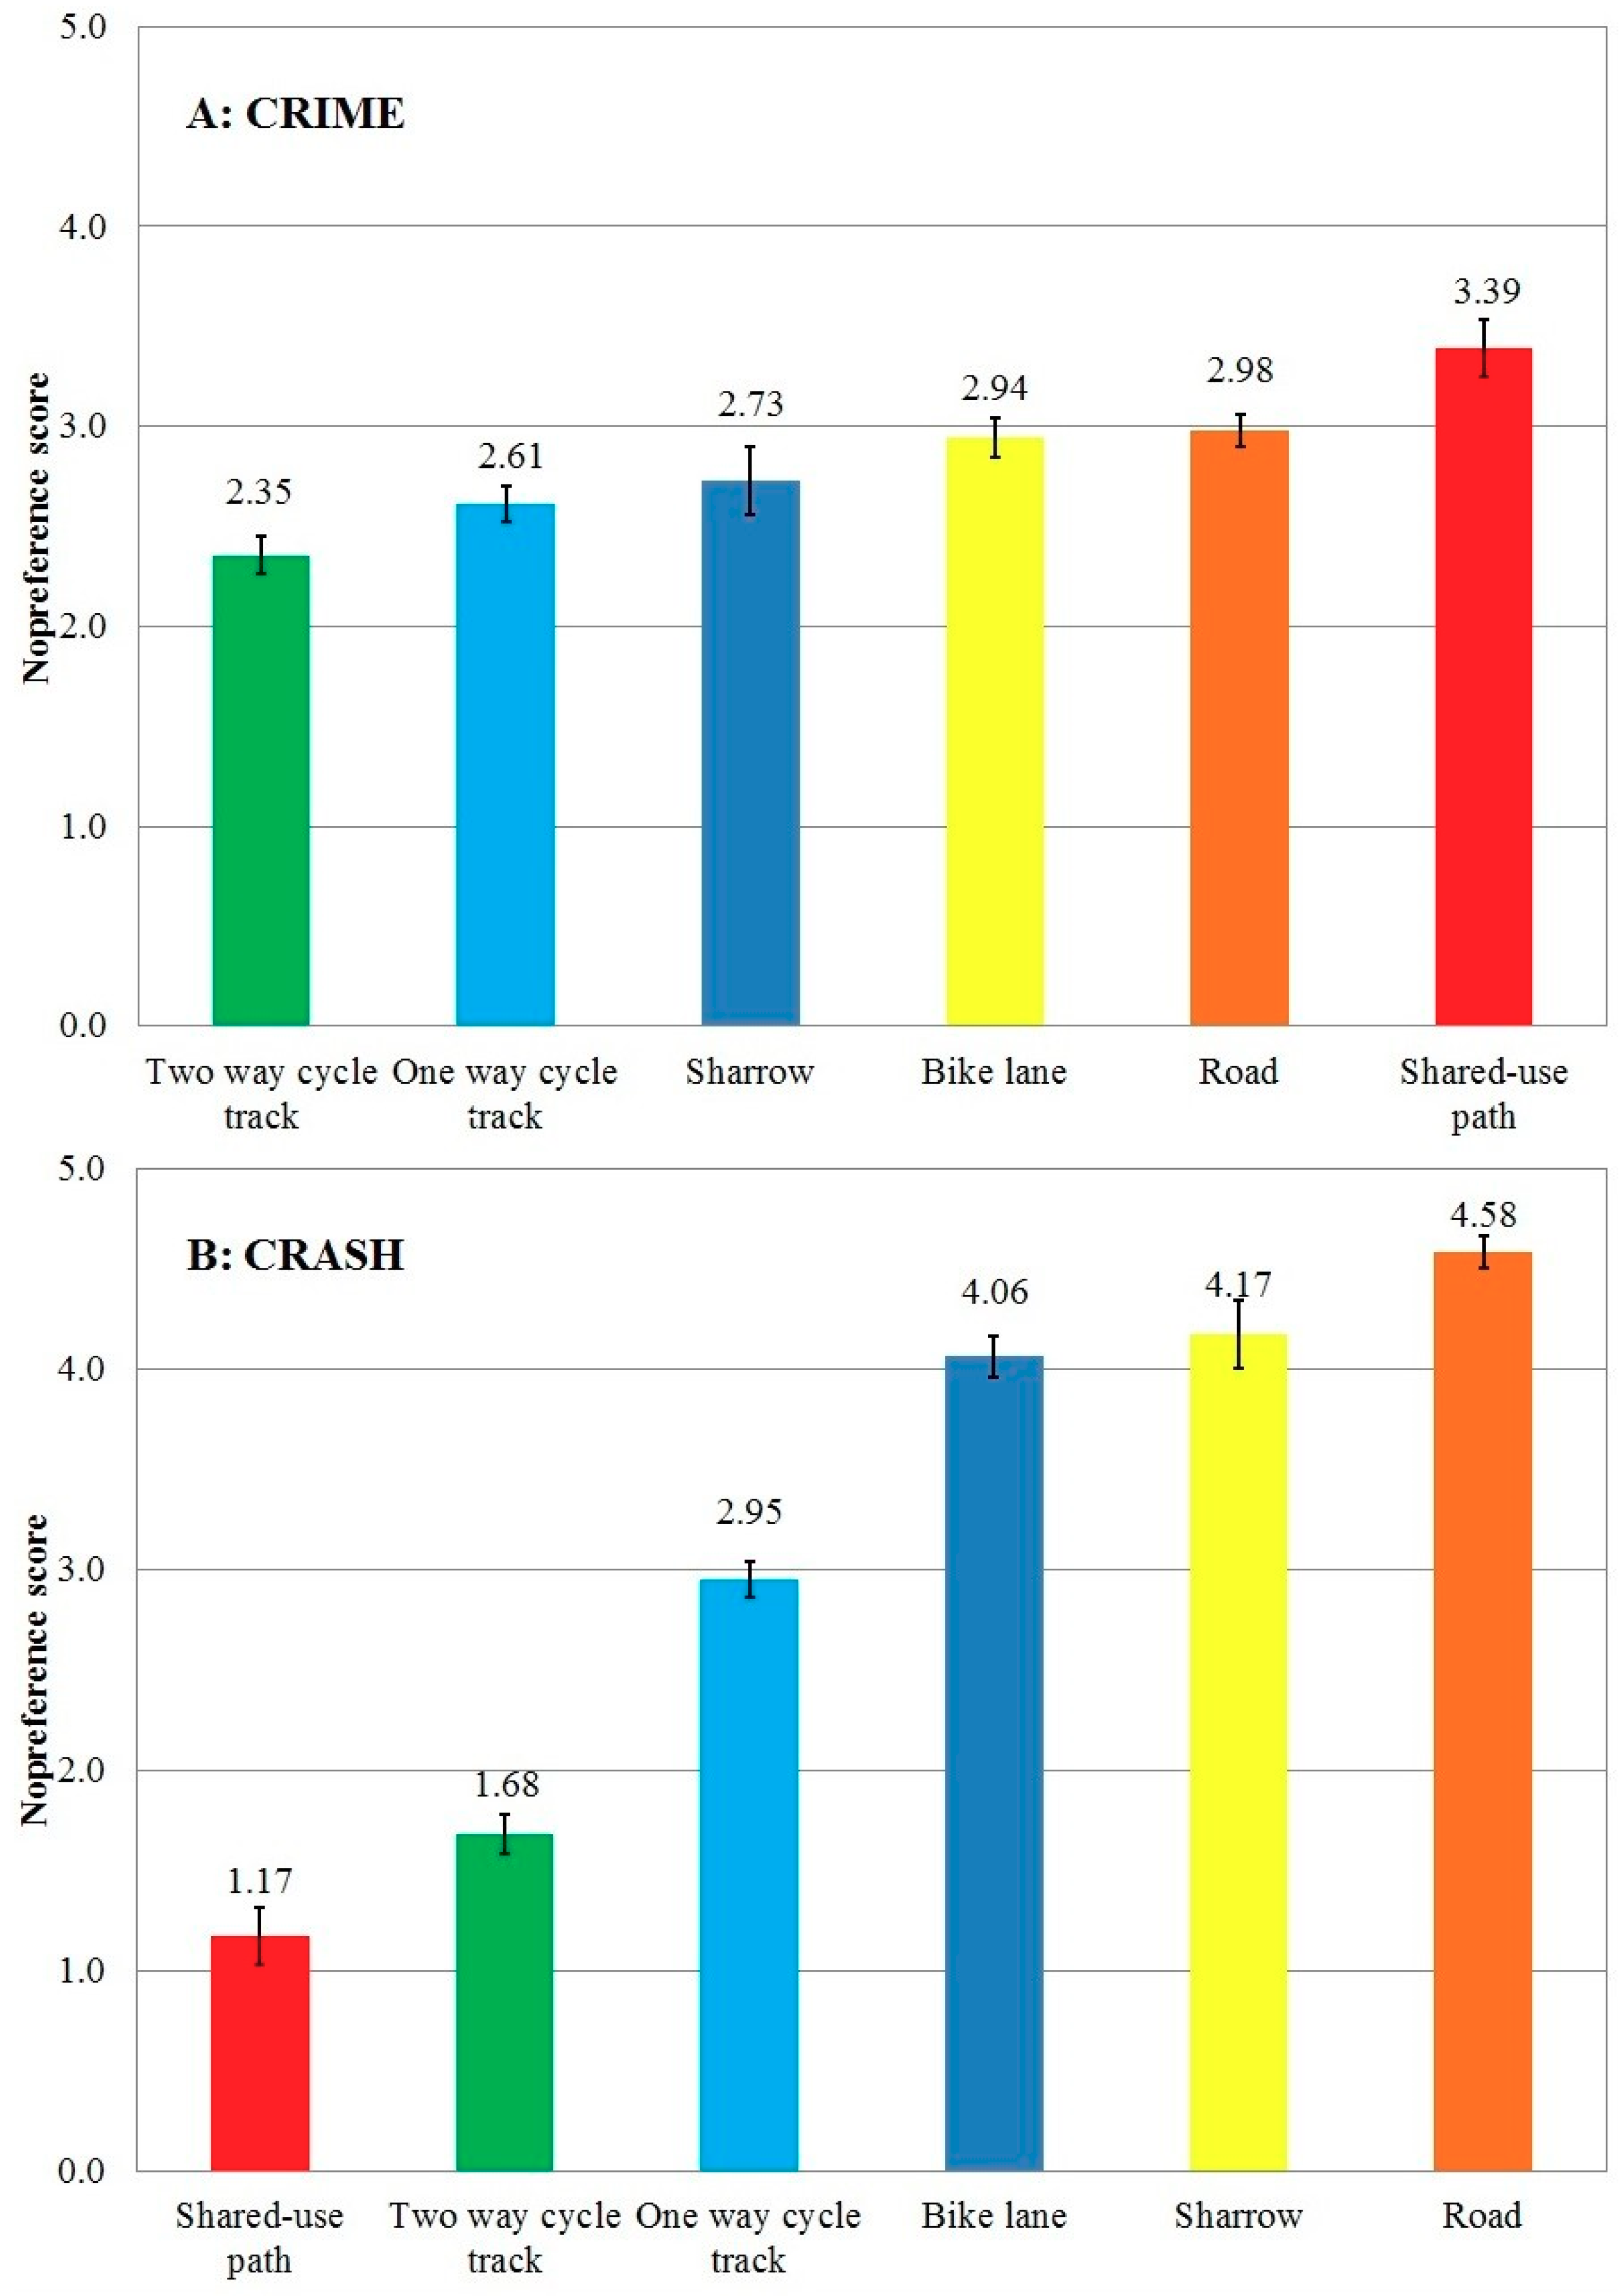
| All | 2.79 | 1.73 | 2.61 | 1.63 | 2.35 | 1.69 | 2.98 | 1.79 | 3.38 | 1.99 | 2.94 | 1.62 | 2.73 | 1.50 |
| Sex | ||||||||||||||
| Female | 2.86 | 1.74 | 2.54 | 1.62 | 2.38 | 1.68 | 3.07 | 1.79 | 3.68 | 1.90 | 3.04 | 1.67 | 2.78 | 1.47 |
| Male | 2.75 | 1.72 | 2.67 | 1.64 | 2.33 | 1.69 | 2.91 | 1.78 | 3.14 | 2.02 | 2.85 | 1.57 | 2.69 | 1.53 |
| p value | <0.0001 * | 0.67 | 0.06 | 0.001 * | 0.0007 * | 0.001 * | 0.37 | |||||||
| Age | ||||||||||||||
| <25 years | 2.84 | 1.76 | 2.72 | 1.65 | 2.44 | 1.74 | 3.03 | 1.79 | 3.38 | 2.04 | 2.92 | 1.65 | 2.73 | 1.61 |
| 25–34 years | 2.80 | 1.74 | 2.60 | 1.62 | 2.29 | 1.69 | 3.07 | 1.77 | 3.32 | 2.03 | 2.95 | 1.64 | 2.77 | 1.53 |
| 35–44 years | 2.74 | 1.68 | 2.59 | 1.57 | 2.28 | 1.56 | 2.85 | 1.85 | 3.40 | 1.93 | 2.92 | 1.49 | 2.70 | 1.43 |
| 45–54 years | 2.69 | 1.89 | 2.41 | 1.84 | 2.28 | 1.85 | 2.97 | 1.88 | 3.09 | 2.20 | 2.87 | 1.83 | 2.71 | 1.58 |
| ≥55 | 2.88 | 1.55 | 2.68 | 1.45 | 2.49 | 1.59 | 2.92 | 1.58 | 3.76 | 1.62 | 3.06 | 1.47 | 2.71 | 1.29 |
| p value | 0.64 | 0.54 | 0.54 | 0.12 | 0.42 | 0.64 | 0.53 | |||||||
| Bicycle | ||||||||||||||
| Can ride 1 | 2.76 | 1.71 | 2.59 | 1.60 | 2.37 | 1.67 | 2.92 | 1.76 | 3.39 | 1.98 | 2.89 | 1.59 | 2.67 | 1.48 |
| Can’t ride 2 | 3.11 | 1.95 | 2.83 | 1.88 | 2.19 | 1.87 | 3.67 | 1.90 | 3.27 | 2.13 | 3.48 | 1.80 | 3.36 | 1.61 |
| p value | <0.0001 * | 0.04 * | 0.23 | <0.0001 * | 0.17 | 0.001 * | 0.007 * | |||||||
| Group type | ||||||||||||||
| Commty 3 | 2.62 | 1.64 | 2.42 | 1.55 | 2.21 | 1.55 | 2.73 | 1.71 | 3.42 | 1.91 | 2.72 | 1.53 | 2.58 | 1.39 |
| Street 4 | 3.01 | 1.81 | 2.84 | 1.70 | 2.53 | 1.82 | 3.29 | 1.84 | 3.32 | 2.08 | 3.20 | 1.68 | 2.92 | 1.62 |
| p value | <0.0001 * | <0.0001 * | 0.0002 * | <0.0001 * | 0.40 | <0.00001 * | 0.009 * | |||||||
| Bicycle Facility | All | One Way Cycle Track | Two Way Cycle Track | Road | Shared-Use Path | Bike Lane | Sharrow | |||||||
|---|---|---|---|---|---|---|---|---|---|---|---|---|---|---|
| Mean | Std | Mean | Std | Mean | Std | Mean | Std | Mean | Std | Mean | Std | Mean | Std | |
| All | 3.24 | 2.12 | 2.96 | 1.92 | 1.68 | 1.76 | 4.59 | 1.57 | 1.16 | 1.64 | 4.06 | 1.70 | 4.16 | 1.66 |
| Sex | ||||||||||||||
| Female | 3.33 | 2.19 | 2.92 | 1.95 | 1.59 | 1.77 | 4.85 | 1.51 | 0.99 | 1.50 | 4.26 | 1.67 | 4.44 | 1.47 |
| Male | 3.17 | 2.06 | 2.99 | 1.90 | 1.75 | 1.76 | 4.38 | 1.59 | 1.30 | 1.73 | 3.89 | 1.72 | 3.95 | 1.77 |
| p value | <0.0001 * | 0.38 | 0.57 | 0.009 * | 0.003 * | 0.009 * | 0.0008 * | |||||||
| Age | ||||||||||||||
| <25 years | 3.24 | 2.11 | 2.97 | 1.88 | 1.81 | 1.88 | 4.59 | 1.55 | 1.09 | 1.76 | 3.98 | 1.70 | 4.11 | 1.61 |
| 25–34 years | 3.26 | 2.10 | 3.00 | 1.91 | 1.68 | 1.69 | 4.59 | 1.52 | 1.09 | 1.59 | 4.11 | 1.73 | 4.07 | 1.67 |
| 35–44 years | 3.20 | 2.18 | 2.96 | 2.03 | 1.37 | 1.64 | 4.66 | 1.59 | 1.14 | 1.60 | 4.08 | 1.61 | 4.18 | 1.79 |
| 45–54 years | 3.22 | 2.14 | 2.82 | 1.91 | 1.69 | 1.81 | 4.48 | 1.71 | 1.46 | 1.81 | 4.05 | 1.83 | 4.27 | 1.60 |
| ≥55 | 3.30 | 2.03 | 2.97 | 1.83 | 1.95 | 1.75 | 4.57 | 1.54 | 1.17 | 1.35 | 4.05 | 1.70 | 4.33 | 1.64 |
| p value | 0.52 | 0.66 | 0.91 | 0.08 | 0.42 | 0.92 | 0.68 | |||||||
| Bicycle | ||||||||||||||
| Can ride 1 | 3.23 | 2.11 | 2.96 | 1.91 | 1.68 | 1.74 | 4.57 | 1.56 | 1.12 | 1.60 | 4.04 | 1.71 | 4.10 | 1.68 |
| Can’t ride 2 | 3.40 | 2.23 | 2.94 | 2.02 | 1.65 | 1.98 | 4.81 | 1.67 | 1.57 | 2.02 | 4.29 | 1.61 | 4.82 | 1.26 |
| p value | 0.18 | 0.79 | 0.78 | 0.54 | 0.02 * | 0.59 | 0.08 | |||||||
| Group type | ||||||||||||||
| Commty 3 | 3.12 | 2.07 | 2.75 | 1.82 | 1.52 | 1.67 | 4.53 | 1.56 | 1.17 | 1.58 | 3.91 | 1.66 | 4.05 | 1.62 |
| Street 4 | 3.39 | 2.16 | 3.21 | 2.00 | 1.88 | 1.85 | 4.66 | 1.59 | 1.15 | 1.72 | 4.24 | 1.75 | 4.30 | 1.70 |
| p value | <0.0001 * | 0.009 * | 0.002 * | 0.0002 * | 0.48 | 0.009 * | 0.0004 * | |||||||
| Bicycle Facility Design Variable—Perception of Crime or Crash Times the Design Variable Was Mentioned during the 13 Group Sessions | One-Way Cycle Track | Two-Way Cycle Track | Road | Shared-Use Path | Bike Lane | Shar-row | Total |
|---|---|---|---|---|---|---|---|
| Surface/bicyclist’s right-of-way—High Risk of Crime (bicyclist vulnerable) | |||||||
| Bad condition of road surface (potholes, uneven color, oil on road where cars stop at intersection—low vehicle maintenance, litter in street—old newspapers, etc.) | 1 | 3 | 4 | ||||
| Narrowness of lane | 2 | 2 | 4 | ||||
| Faded lines and symbols (bike stencil and arrows) | 1 | 1 | 2 | ||||
| Surface/bicyclist’s right-of-way—Low Risk of Crime (bicyclist less vulnerable) | |||||||
| Two-way cycle track so know how to get back home | 2 | 2 | |||||
| Surface/bicyclist’s right-of-way—High Risk Crash (more likely hit by vehicle) | |||||||
| No bike signs/stencils for bikers | 1 | 16 | 1 | 1 | 19 | ||
| Too narrow right-of-way | 6 | 2 | 1 | 9 | |||
| Sharrow nearer middle of road | 4 | 4 | |||||
| Narrow cycle track with curbs on both sides | 1 | 2 | 3 | ||||
| No section between parallel parked cars and cycle tracks for parked car doors to open | 1 | 1 | 2 | ||||
| Surface/bicyclist’s right-of-way—Low Risk Crash (less likely hit by vehicle) | |||||||
| Median for cycle track (raised island, delineator posts, diagonal paint lines, etc.) | 16 | 7 | 23 | ||||
| Paint or color (red) designating location for bicyclists (lane, cycle track) | 6 | 1 | 1 | 1 | 9 | ||
| Wide right-of-way (road, cycle track, etc.) | 2 | 2 | 4 | ||||
| Bike symbol stencil/arrows for bikers | 3 | 1 | 4 | ||||
| One way cycle track | 2 | 2 | |||||
| Context of bicyclist—High Risk of Crime (bicyclist vulnerable) | |||||||
| Secluded/no people around (few people driving on wide streets) | 2 | 8 | 5 | 12 | 2 | 1 | 30 |
| Building types associated with crime (triple deckers, projects, solid walls, warehouses, closed storefronts, abandoned buildings, check cashier business, etc.) | 3 | 4 | 10 | 9 | 1 | 27 | |
| Dark (little sunlight and no street lights or lights from houses) | 3 | 10 | 1 | 6 | 4 | 1 | 25 |
| Too many trees, bushes, dense foliage, high grass | 1 | 8 | 4 | 6 | 3 | 22 | |
| Hiding spots, cuts (spaces between buildings) | 1 | 8 | 3 | 6 | 1 | 19 | |
| Houses, front steps, balconies not painted or maintained, graffiti, dirty signs, telephone poles leaning, oil on road where parallel parked cars park (low maintenance on cars) | 6 | 1 | 2 | 9 | |||
| Too many people in crowds, tourist area | 4 | 2 | 2 | 1 | 9 | ||
| Side street (few cars, few eyes on street) | 1 | 1 | 1 | 1 | 1 | 5 | |
| Narrow right-of-way or closed in | 1 | 4 | 5 | ||||
| Only residential buildings or homes (everyone at work so no one sees crime) | 2 | 1 | 3 | ||||
| McDonalds/fast food | 3 | 3 | |||||
| Jumbled bike racks with too many bikes (can steal and not be noticed) | 3 | 3 | |||||
| Low end stores and low end cars | 1 | 1 | 2 | ||||
| Adjacent fence or knoll | 1 | 1 | 2 | ||||
| Parallel parked cars (can hide between parked cars and also run away) | 1 | 1 | 2 | ||||
| Lots of cars driving or parked | 1 | 1 | 2 | ||||
| Context of Bicyclist—Low Risk of Crime (bicyclist less vulnerable) | |||||||
| People out walking/driving and people watching from second story windows (see and report a crime) | 6 | 7 | 6 | 3 | 22 | ||
| Clean and nice signs, clean sidewalks | 4 | 4 | 5 | 1 | 14 | ||
| Open areas with good sight lines and not dark alleys | 7 | 2 | 3 | 1 | 13 | ||
| Balconies on houses, windows overlooking street from second story | 3 | 4 | 1 | 2 | 10 | ||
| A lot going on, sidewalk cafes with people sitting | 4 | 2 | 1 | 1 | 8 | ||
| Lots of light during day and at night | 3 | 2 | 2 | 1 | 8 | ||
| Commercial areas because have surveillance cameras | 1 | 2 | 3 | 1 | 7 | ||
| Mixed areas with residences and businesses | 1 | 1 | 1 | 2 | 5 | ||
| Flowers—nice plants | 3 | 1 | 1 | 5 | |||
| No trees or limbed up trees | 1 | 3 | 4 | ||||
| High end stores and high end cars | 2 | 2 | |||||
| Lots of little shops | 2 | 2 | |||||
| Context of bicyclist—High Risk of Crash (more likely hit by vehicle) | |||||||
| Drivers going in different directions around the bicyclists, don’t know direction of drivers | 5 | 10 | 11 | 4 | 30 | ||
| Close to cars in motion | 11 | 10 | 3 | 24 | |||
| Painted lane/cycle track—could get doored on both sides (driver exiting parallel parked car and passenger exiting car stopped in travel lane—van in lane) | 4 | 2 | 13 | 1 | 20 | ||
| Bike facility around bus stop, sharing road with buses, buses on both sides of bicyclist | 9 | 9 | 18 | ||||
| Road encourages high speeds of vehicles, road rage, and drivers honking | 1 | 4 | 3 | 8 | |||
| Confusing paint | 5 | 1 | 1 | 7 | |||
| Able to be hit from behind | 2 | 1 | 1 | 4 | |||
| Too many intersection coming together | 3 | 3 | |||||
| Context of bicyclist—Low Risk of Crash (less likely hit by vehicle) | |||||||
| More people around to call in crash with cell phone, get license number, stop driver, witness crash, cameras | 2 | 1 | 3 | 2 | 8 | ||
| Not a lot of car traffic | 2 | 1 | 1 | 1 | 5 | ||
| High end cars on road | 1 | 1 | 1 | 3 | |||
| Bike signal at intersection | 2 | 2 | |||||
| Few people out walking (peds get hit) | 1 | 1 | 2 |
© 2019 by the authors. Licensee MDPI, Basel, Switzerland. This article is an open access article distributed under the terms and conditions of the Creative Commons Attribution (CC BY) license (http://creativecommons.org/licenses/by/4.0/).
Share and Cite
Lusk, A.C.; Willett, W.C.; Morris, V.; Byner, C.; Li, Y. Bicycle Facilities Safest from Crime and Crashes: Perceptions of Residents Familiar with Higher Crime/Lower Income Neighborhoods in Boston. Int. J. Environ. Res. Public Health 2019, 16, 484. https://0-doi-org.brum.beds.ac.uk/10.3390/ijerph16030484
Lusk AC, Willett WC, Morris V, Byner C, Li Y. Bicycle Facilities Safest from Crime and Crashes: Perceptions of Residents Familiar with Higher Crime/Lower Income Neighborhoods in Boston. International Journal of Environmental Research and Public Health. 2019; 16(3):484. https://0-doi-org.brum.beds.ac.uk/10.3390/ijerph16030484
Chicago/Turabian StyleLusk, Anne C., Walter C. Willett, Vivien Morris, Christopher Byner, and Yanping Li. 2019. "Bicycle Facilities Safest from Crime and Crashes: Perceptions of Residents Familiar with Higher Crime/Lower Income Neighborhoods in Boston" International Journal of Environmental Research and Public Health 16, no. 3: 484. https://0-doi-org.brum.beds.ac.uk/10.3390/ijerph16030484