1. Introduction
After entering the 21st century, in order to achieve environmental sustainability, environmental protection technology and information technology of construction machinery are put forward, which makes construction machinery enter a new stage of development. European and American markets have put forward stricter requirements for noise control of construction machinery products. Gear pumps are the units that perform the energy conversion from the mechanical energy to the pressure energy of oil. They are extensively used in construction machineries due to their advantages such as small size, light weight, insensitivity to oil pollution, reliable operation, good performance, and low production costs [
1,
2]. However, their significant disadvantage is relatively high noise emission [
3]. Construction noise can cause a series of detrimental health effects on human beings, such as noise-induced hearing loss [
4], arrhythmia, dyslipidemia, cancer, thyroid gland disorders and psychic disorders, and so on [
5]. Therefore, the construction noise level must be reduced in order to develop environmental sustainability and improve the market competitiveness of construction machinery.
The causes of noise generation are as follows [
6]: (1) Pressure shock and cavitation arising from the trapped volume between meshing teeth; (2) the noise caused by some manufacturing errors of gears during gear meshing; (3) flow pulsation and pressure pulsation caused by the volume change of the suction chamber and discharge chamber.
In addition to sustainable development needs, reducing noise levels can also increase the life and reliability of equipment. At present, many scholars are studying the noise generation mechanism and noise reduction strategy of gear pump. Many studies have shown that pressure and flow pulsations are the main causes of noise generation, not the noise radiation of the pump itself. The intrinsic noise of gear pumps mainly depends on the vibrations and dynamic load on the gears. These dynamic loads are transmitted through the bearings in pump housing and generate noise [
7]. Mucchi [
8] thought that the noise levels are the consequence of the dynamic forces within the gear pump system, related with the flow and pressure ripple as well as the variable meshing stiffness and gear errors. Zhao [
9] believed that in the design of the involute tooth profile of the traditional external gear pump, the inherent cause of significant flow inhomogeneity leads to undesired noise emissions and mechanical vibrations for involute teeth design of the traditional external gear pump. Therefore, continuous-contact helical gear pumps were proposed and successfully commercialized to replace the traditional gear pumps in the recent past. However, the high manufacturing cost of helical gear restricts its popularization and application in construction machinery. Some scholars have also carried out research work on noise reduction of piston pumps [
10,
11].
Independent component analysis (ICA) is a technique recently used in data analysis and signal processing. It is used in many fields: Blind source separation [
12], image restoration of blurred images [
13], brain magnetic resonance image analysis [
14], telecommunications [
15], financial data analysis [
16], facial identification [
17], and so on. In this paper, ICA methods were used in the signal processing of gear pumps. The purpose of using ICA signal separation is to verify the effectiveness of gear pumps before and after optimization.
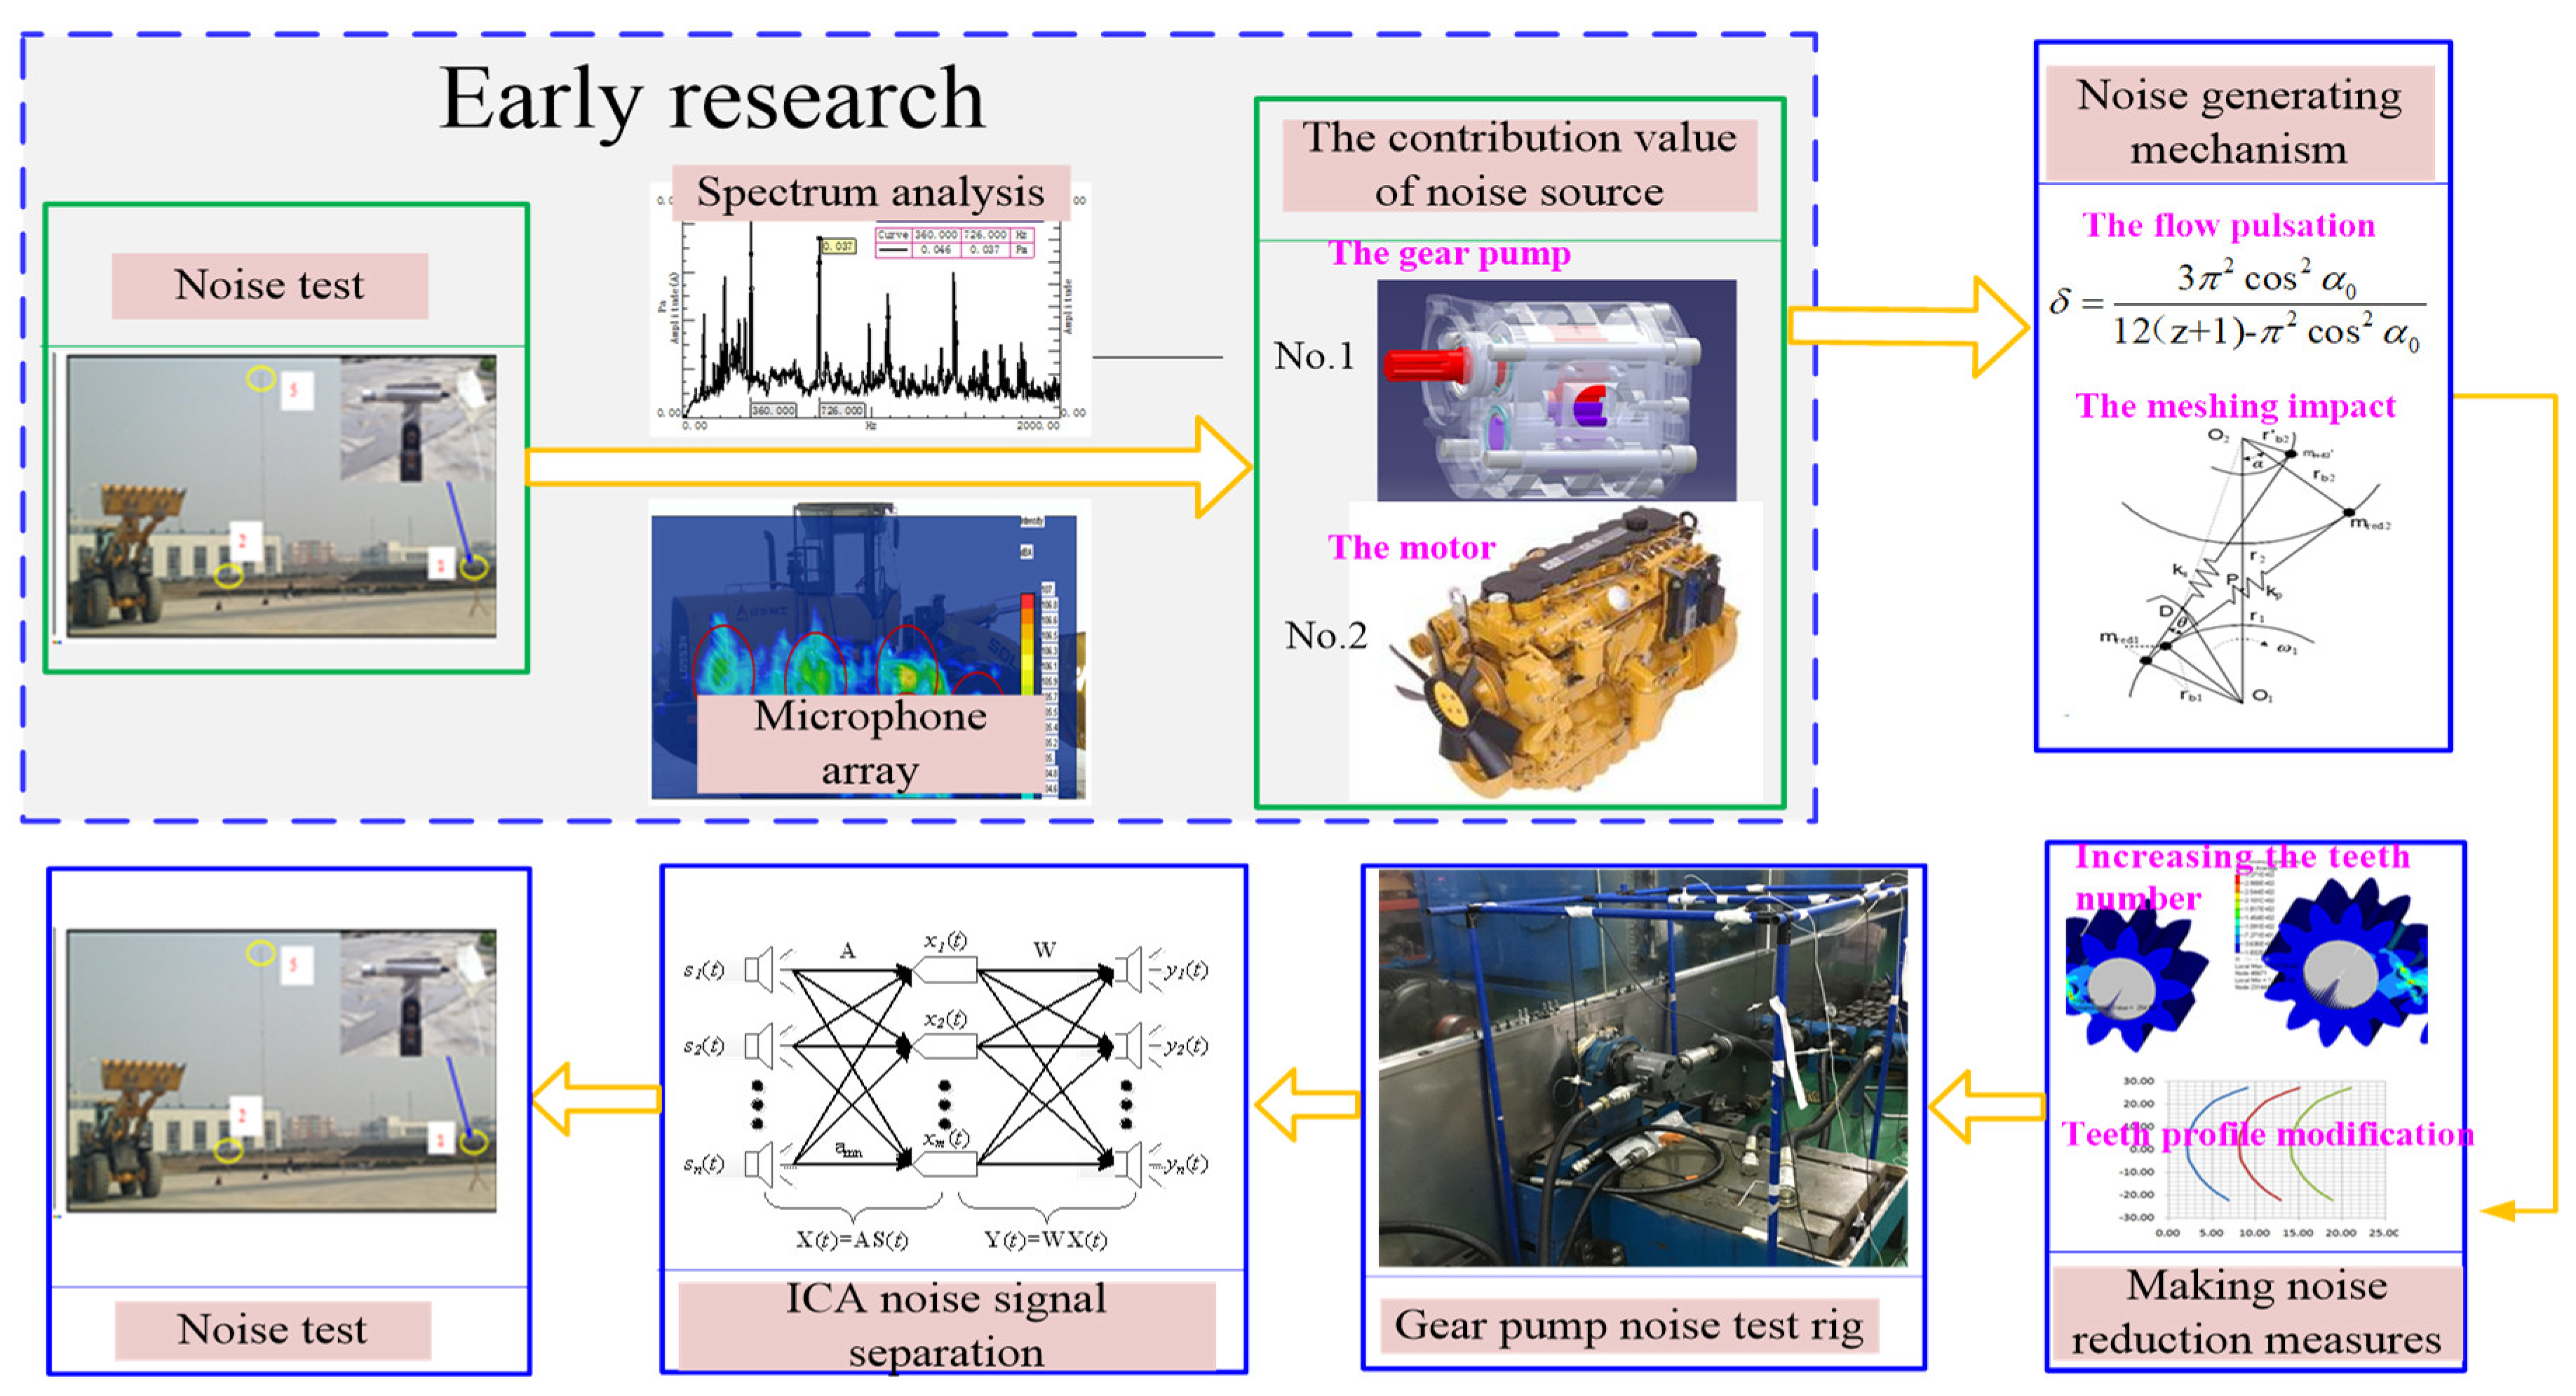
In order to avoid the deviation of gear pump noise caused by other components in the whole machine noise test, the following two effective measures were adopted in this paper: The noise test rig of the gear pump was set up to avoid the influence of other noise sources, and the noise signals of gear pumps were separated by using the ICA model. The noise generation mechanism of the gear pump was analyzed by combining theoretical analysis with the finite element analysis (FEA) method. A noise reduction strategy of gear pumps was put forward based on the above analysis. Finally, noise tests were carried out to verify the effectiveness of noise reduction.
3. Methodology
The gear pump studied is shown in
Figure 2. With the meshing transmission between the driving wheel and the driven wheel, the meshing volume between the teeth also changes. When the meshing teeth on the inlet side are separated gradually, the volume of the inlet port increases and the pressure decreases, and the liquid in the suction pipe is sucked into the pump. It is then carried around the sides of the gears by the teeth. Last, the fluid in the pump is delivered to the output port and then into the working oil circuit. Then, new fluid is sucked from the inlet port and discharged with the meshing of the gears. Through these operations, the oil suction and oil discharge of the gear pump in the hydraulic system can be completed, so as to provide power for the hydraulic system.
3.1. The Noise Generation Mechanism of the Gear Pump
There are many factors that cause the noise generation of gear pumps. However, considering the manufacturing cost, and not changing the volume structure of the gear pump, this paper will mainly consider the influence of flow pulsation and meshing impact on noise generation.
3.1.1. The Flow Pulsation
Usually, gear meshing makes a significant contribution to pressure and flow ripples. Ripples are main sources of vibrations, noise, and efficiency loss of gear machineries [
18]. The instantaneous flow rate of gear pumps is uneven and varies with time. However, when the hydraulic pump rotates continuously, the instantaneous flow varies, according to the same rule. This phenomenon is called the flow pulsation of the gear pump. The flow pulsation of the gear pump determines the performance of the hydraulic system. If the flow pulsation of a gear pump is large, it will not only make the stability and uniformity of the working element worse, but also cause the vibration of the whole hydraulic system and emit a higher decibel noise. Therefore, for noise reduction measures of gear pumps, we should first consider reducing the flow pulsation.
The flow pulsation formula is expressed as follows [
19]:
where
Qmax and
Qmin represent the maximum and minimum instantaneous flow,
Q represents the average flow rate of the gear pump,
i represents the speed drive ratio between the gear pump and motor,
n represents the speed of the motor, and
q represents the output volume of the gear pump.
By further calculation, the flow pulsation of the gear pump with side gap meshing is as follows:
and the flow pulsation of the gear pump without side gap meshing is as follows:
where
α0 represents the pressure angle of the meshing gears and
z represents the teeth number of the gears.
From the above formula, it can be seen that increasing the pressure angle and the teeth number of the gear can reduce the pulsating flow.
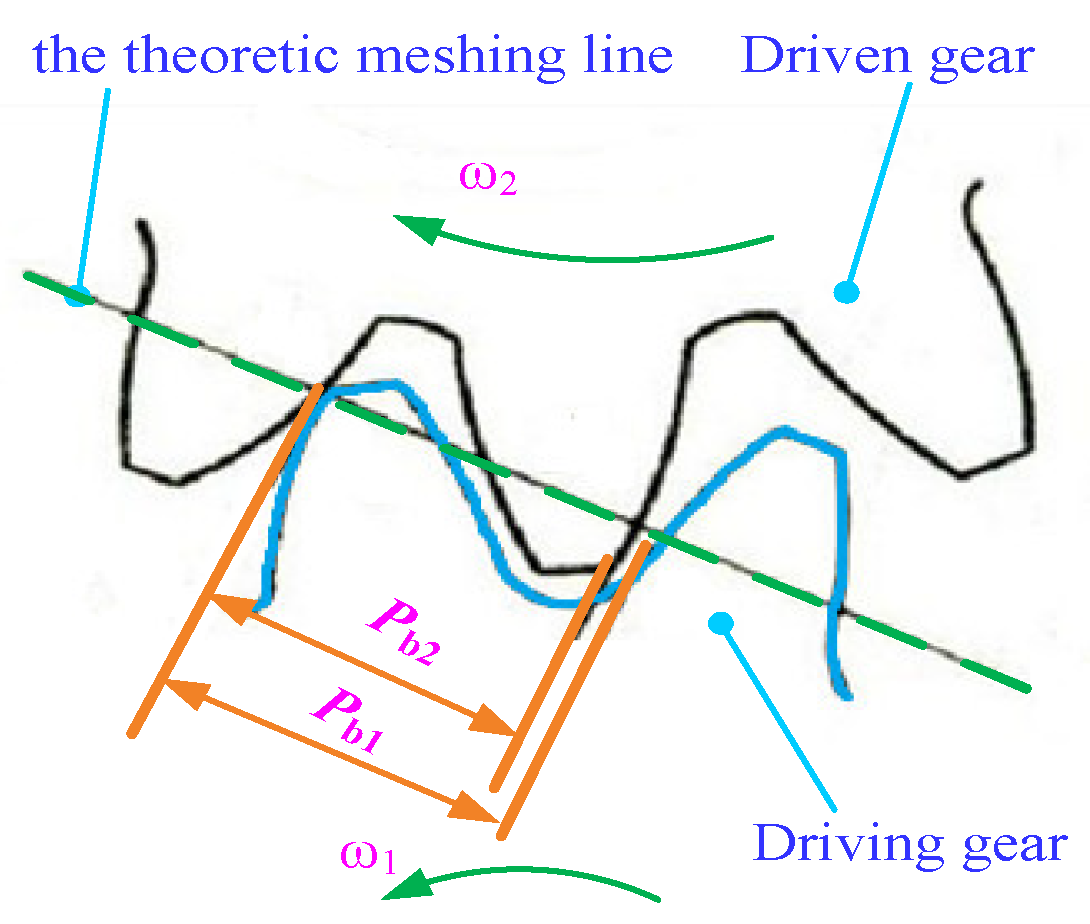
3.1.2. The Meshing Impact of Gear Teeth
Besides the flow pulsation of gear pumps, the meshing impact of gear teeth also produces noise due to the meshing characteristics of gears. As shown in
Figure 3, for a pair of gears, the base pitch of the driving gear (Pb1) is different from that of the driven gear (Pb2) due to the profile error, installation error and bearing deformation during meshing transmission. Different base pitch can cause change of the instantaneous transmission ratio when it enters or exits meshing, which causes vibration and noise.
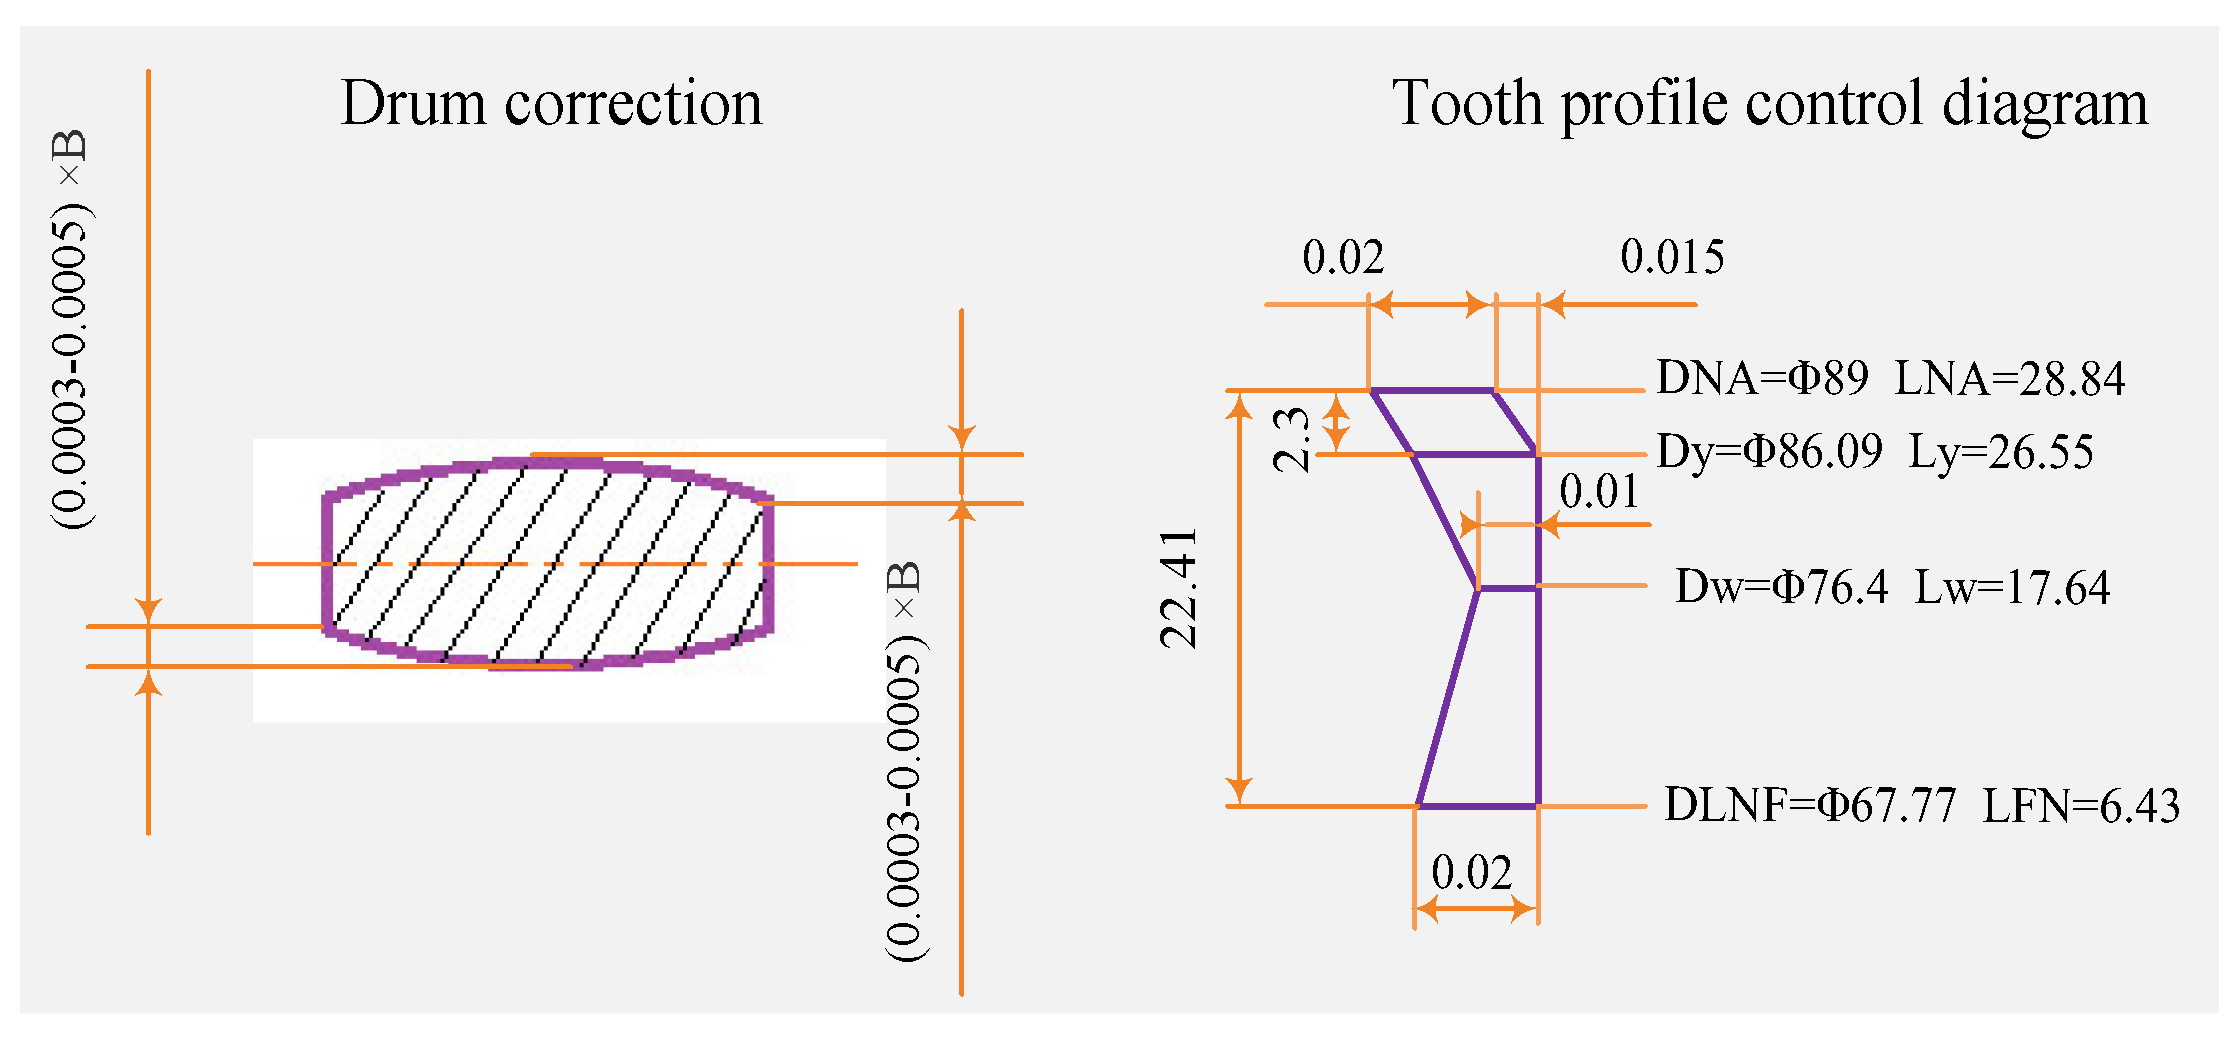
The noise reduction measures of the gear meshing impact should start with reducing impact energy and making gear meshing more stable. The main noise reduction method in this paper was to improve the gear processing accuracy by profile modification. Drum profile modification is the most widely used method. In most cases, the drum shape under the centrosymmetric condition can effectively compensate for the unbalanced load of gears, except for the excessive skewness or the small load. The factors to be considered in drum profile modification include drum shape and drum center position.
Generally, the teeth number of gear pumps is between 6 and 30. In the application of the loader, the requirement of displacement uniformity of gear pumps is not high, but there are certain requirements for installation size of a gear pump and the radial force on the gear to ensure the service life of the bearing and gear pump.
3.2. The Noise Reduction Strategy
Noise is emitted from the sound source, radiated to the outside, and then transmitted to the receiver through a certain sound transmission way. According to the mechanism of noise generation, noise can be controlled through three aspects: Noise source, the sound transmission path, and the receiver. So, the following noise reduction strategies can be adopted [
20].
3.2.1. Reducing Noise at the Sound Source
It is most fundamental and effective to control noise directly at the sound source. The following methods can be used to reduce noise: Developing and selecting low noise equipment, optimizing production and processing technology, selecting the appropriate materials and structures, or improving the machining and assembly precision of parts.
In this paper, noise reduction of the hydraulic gear pump was mainly achieved by increasing the teeth number of the gear pump and modifying the profile of gears. This is a method to reduce the noise of the sound source.
3.2.2. Control Noise in the Transmission Path
When the pressure of technical and economic cost exists in noise source control, the transmission path becomes the preferred measure. Usually, in construction machinery, sound insulation, sound absorption, vibration damping, and noise elimination are often adopted to achieve noise control in the transmission path.
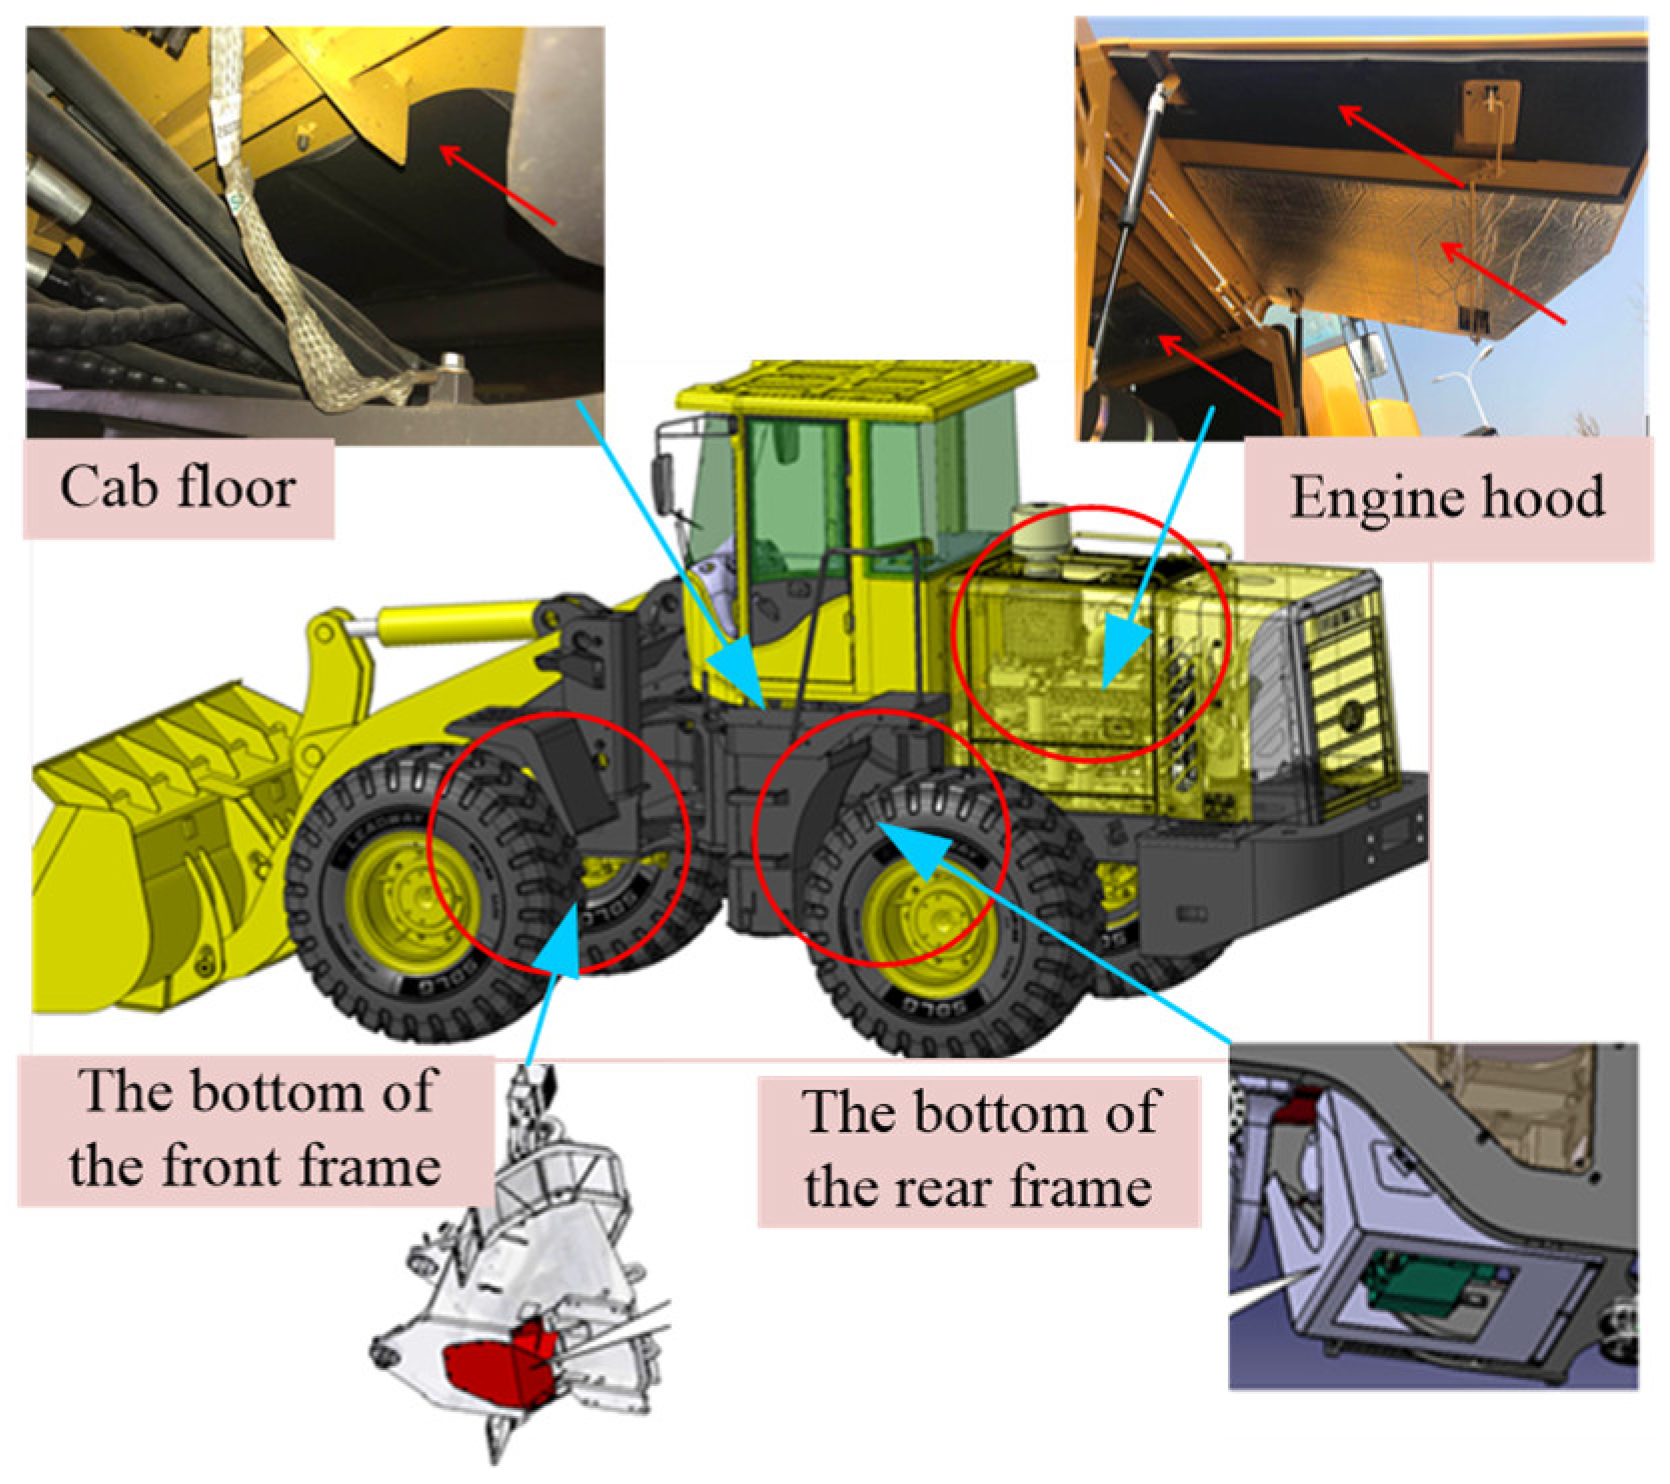
In the previous study, some sponges were pasted onto noise sources for noise reduction (as shown in
Figure 4). This is a noise control method from the transmission path.
3.2.3. Control Noise at the Receiver
Operators can be protected by wearing earplugs, and equipment and instruments can be protected by sound insulation and vibration isolation. However, in engineering machinery, it is difficult for drivers to take corresponding protective measures.
3.3. Noise Measurement of the Test Rig
The measurement and calculation methods refer to the national standard (GB/T 3767-1996), “Acoustics—Determination of sound power levels of noise sources using sound pressure—Engineering method in an essentially free field over a reflecting plane” [
21].
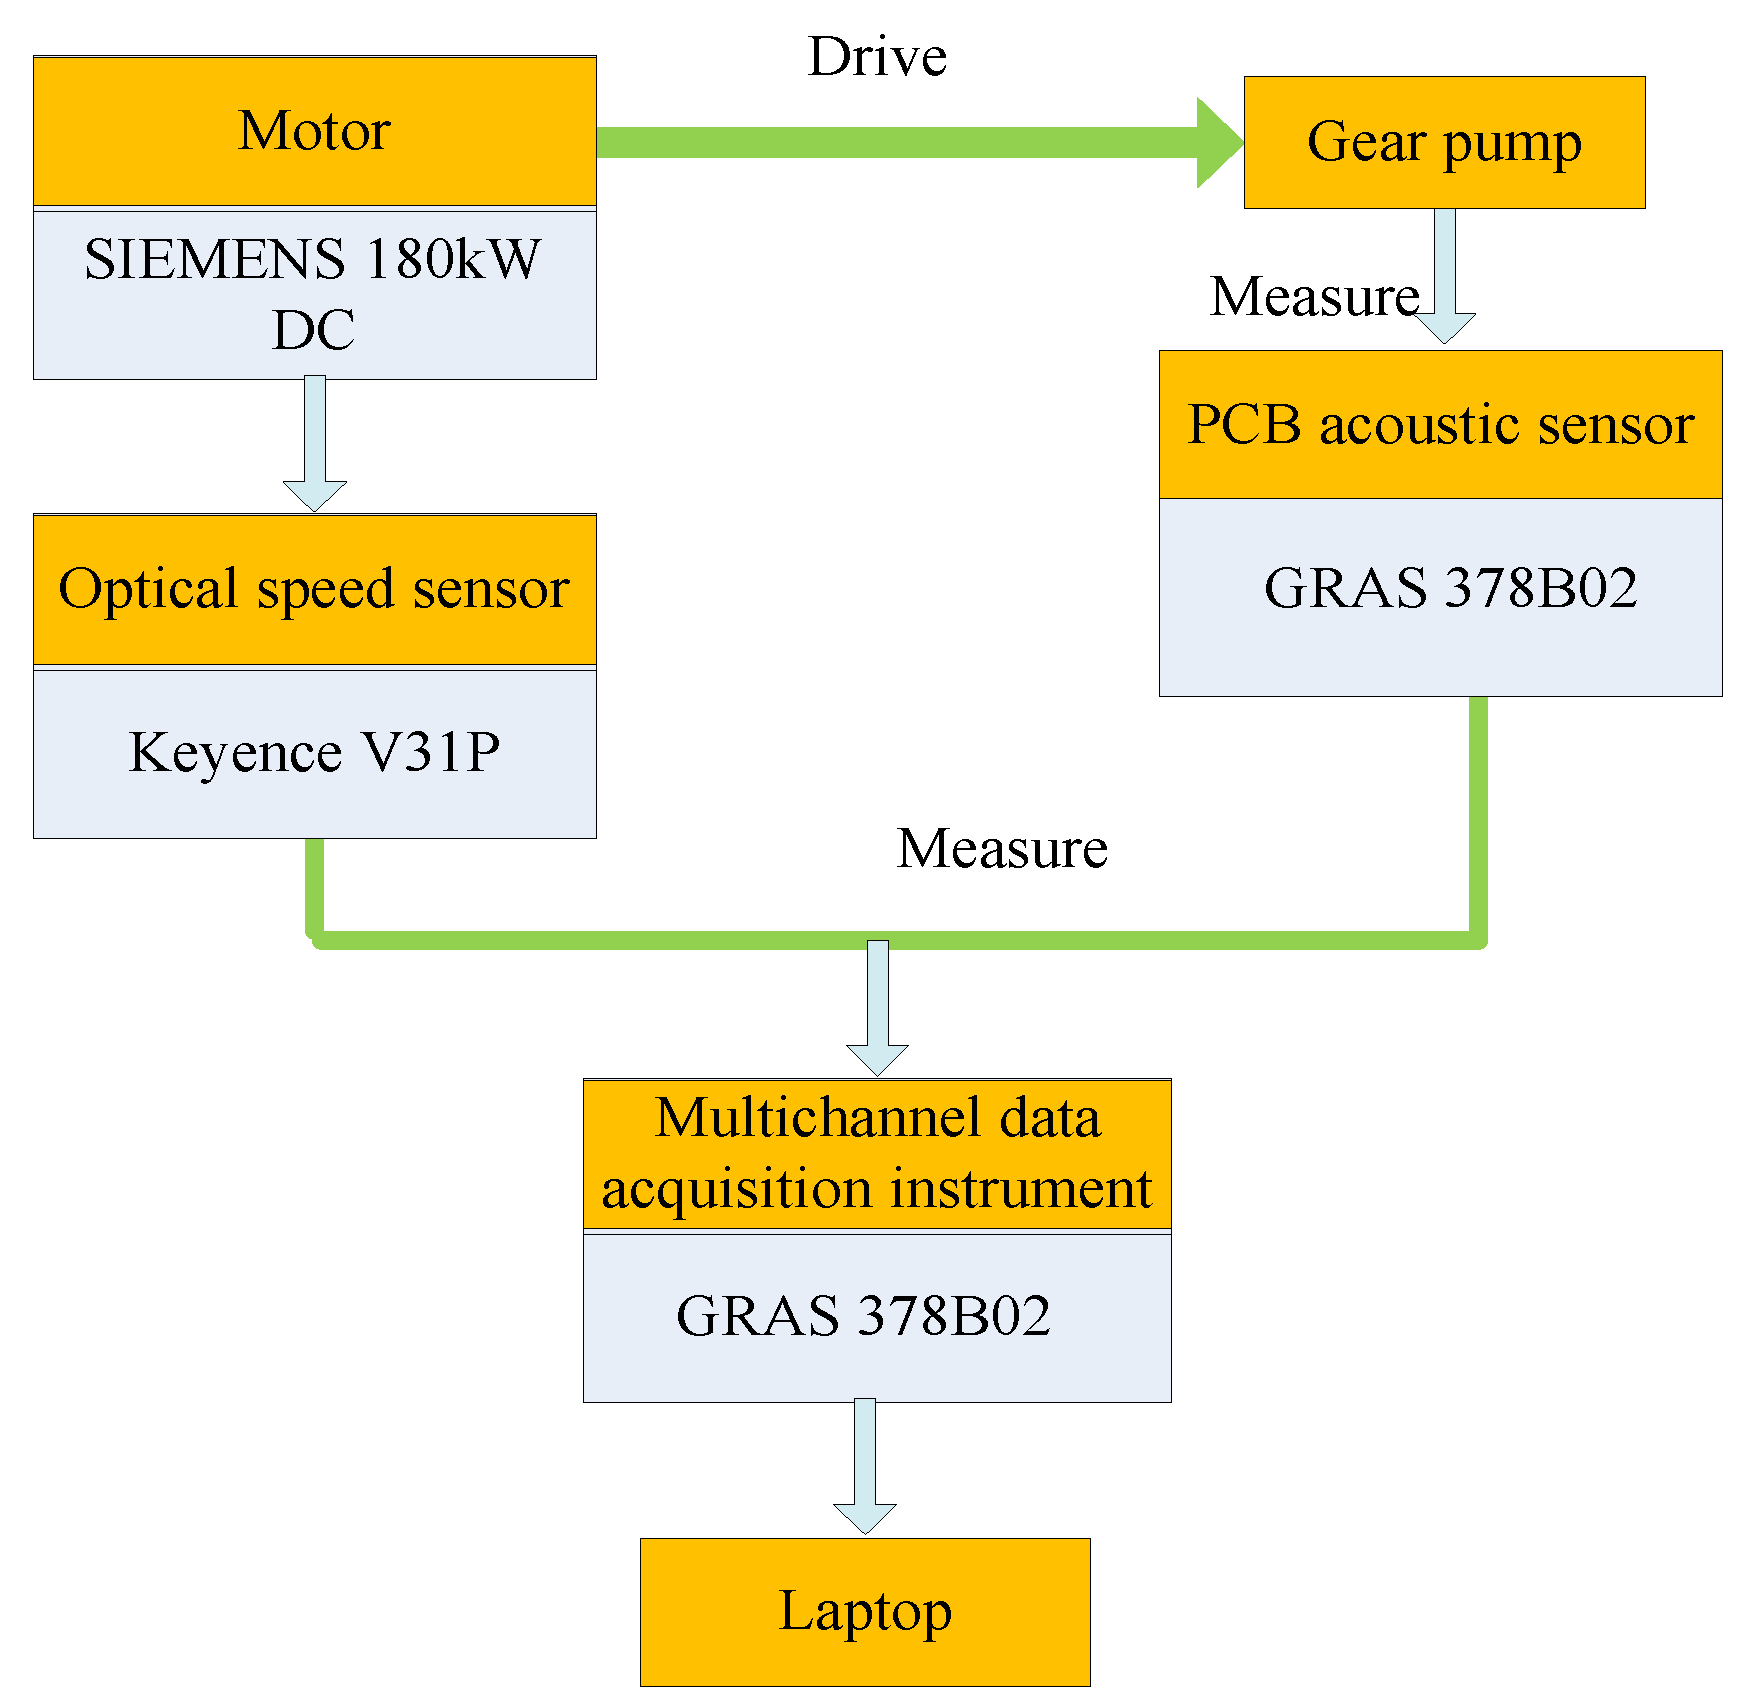
Figure 5 shows a schematic diagram of noise measurement of a gear pump. The gear pump is driven by a motor (model: SIEMENS 180kW DC (Siemens, Munich, Bayern, Germany)), and the motor speed is measured by an optical speed sensor (model: PZ-V31P, Keyence, Japan). Noise signals are measured by six acoustic sensors (model: PCB-378B02, GRAS, Denmark). Multi-channel data acquisition instrument (model: scada02, LMS, Belgium) and a Laptop are used to collect and analyze the signals.
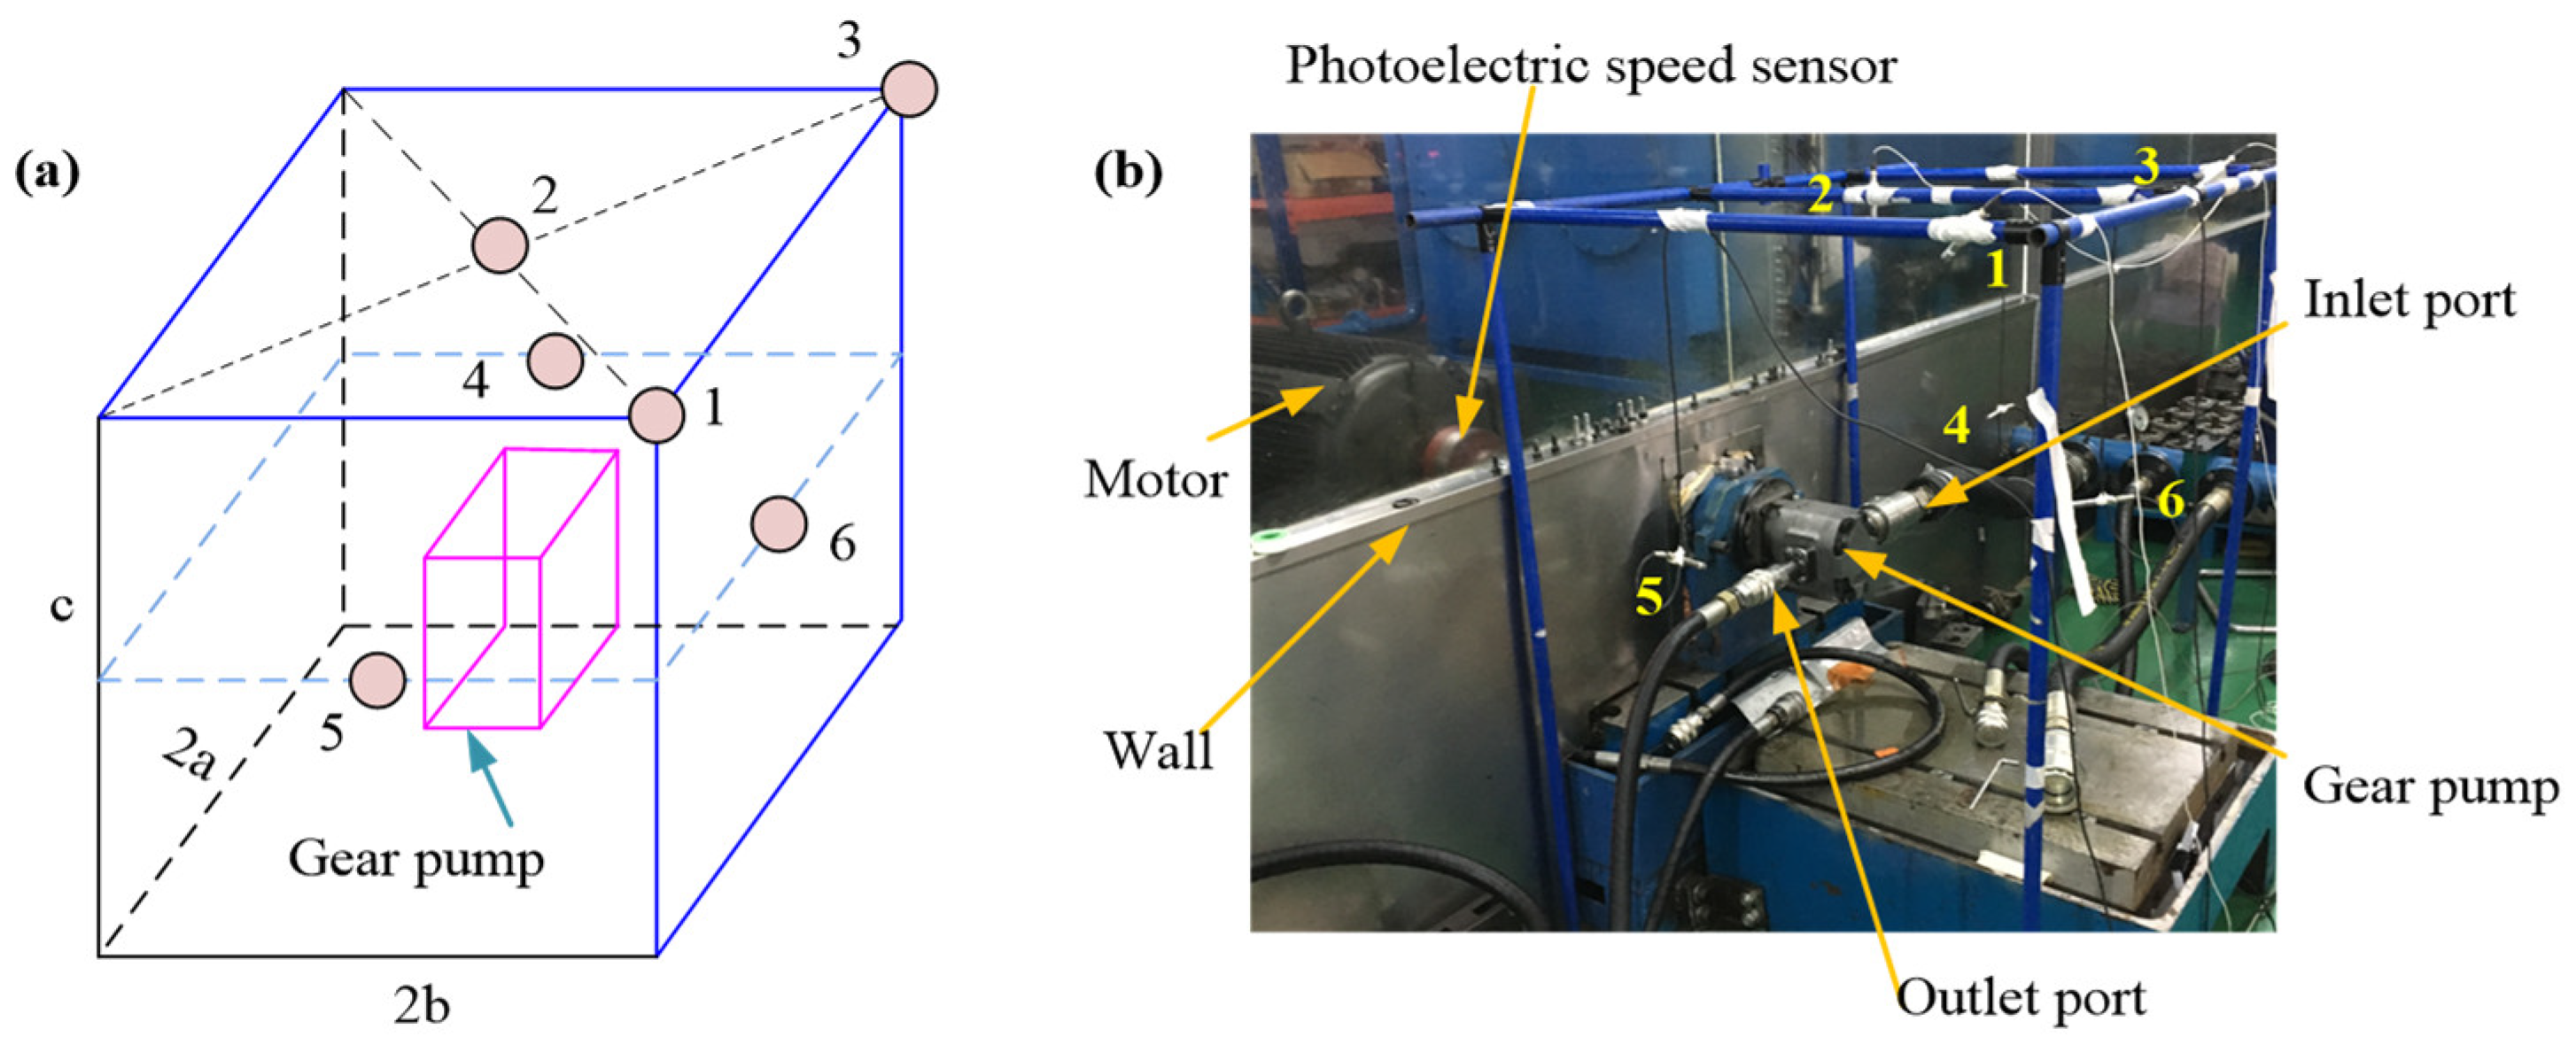
The test rig for noise measurement is shown in
Figure 6, where (a) represents the layout of acoustic sensors (2a = 0.9 m, 2b = 1.18 m, c = 1.12 m), and (b) represents the test site. In order to reduce the influence of motor noise on gear pump noise, a partition wall is used between the motor and gear pump.
During the test, the motor speed was set to 2200 rpm, which is the same as the rated speed of a gear pump when it works normally. At the same time, the relief valve was adjusted to make the normal working pressure 20 MPa. Under this pressure, the radiation sound pressure of the test pump was measured. The original normal gear pump was selected in the test.
By calculating the sound power of the gear pump, it was concluded that the acoustic power of the sampling pump (2200 r/min, working pressure 20 MPa, and oil temperature 50 °C) was 100.6 dB (A). Adjust the relief valve to normal working pressure of 20 MPa.
3.4. Noise Signal Separation Based on the ICA Model
In this test, the noise signal obtained includes not only the noise of the gear pump, but also the noise of the motor and other accessories. The ICA algorithm is used to separate the desired noise signal from the mixed noise.
The transmission process of the gear pump is complex, and there is a time delay, a path effect, and reflective reverberation in the propagation process. Therefore, the traditional time domain of the ICA algorithm is not suitable for the separation of noise signals. In order to solve this problem, this paper extended the separation algorithm to the frequency domain.
3.4.1. The ICA Model
Suppose there are
n unknown independent statistical sources, which are transmitted by unknown channels and eventually accepted by
m receivers. Considering the influence of the path delay and reverberation in signal transmission, the received signal of the receiver (
xi(t)) is no longer a simple linear instantaneous mixing but a linear convolution mixing:
where
hij is the response function between the
jth source signal and the
ith receiver,
sj(t − p), is the delay function of the
jth source signal to the
ith receiver through different channels. The model is a convolution mixed model expressed as:
where
X(
t) = [
x1(
t),
x2(
t), …
xm(
t)]
T is the mixed matrix obtained by the receivers,
S(
t) = [
S1(
t),
S2(
t), …
Sm(
t)]
T is the source signal matrix, and
H(t) is the mixture matrix in the time domain.
At present, the ICA algorithm based on the linear instantaneous mixed model is not suitable for convolutional mixing. Therefore, this paper used Fourier transform to transform the convolution mixing problem from the time domain to the frequency domain. The formula is as follows:
where
X(
f) = [
x1(
f),
x2(
f), …
xm(
f)]
T is the observed signal matrix in the frequency domain,
H(f) is the
m×
n hybrid matrix, and
S(
f) = [
s1(
f),
s2(
f), …
sn(
f)]
T is the source signal matrix. In the process of signal separation, we need to find a linear separation matrix
W to obtain the estimated signal from the source signal. Hence, the separation of ICA can be expressed as:
where
Y(
f) is the estimation of signal sources in the frequency domain.
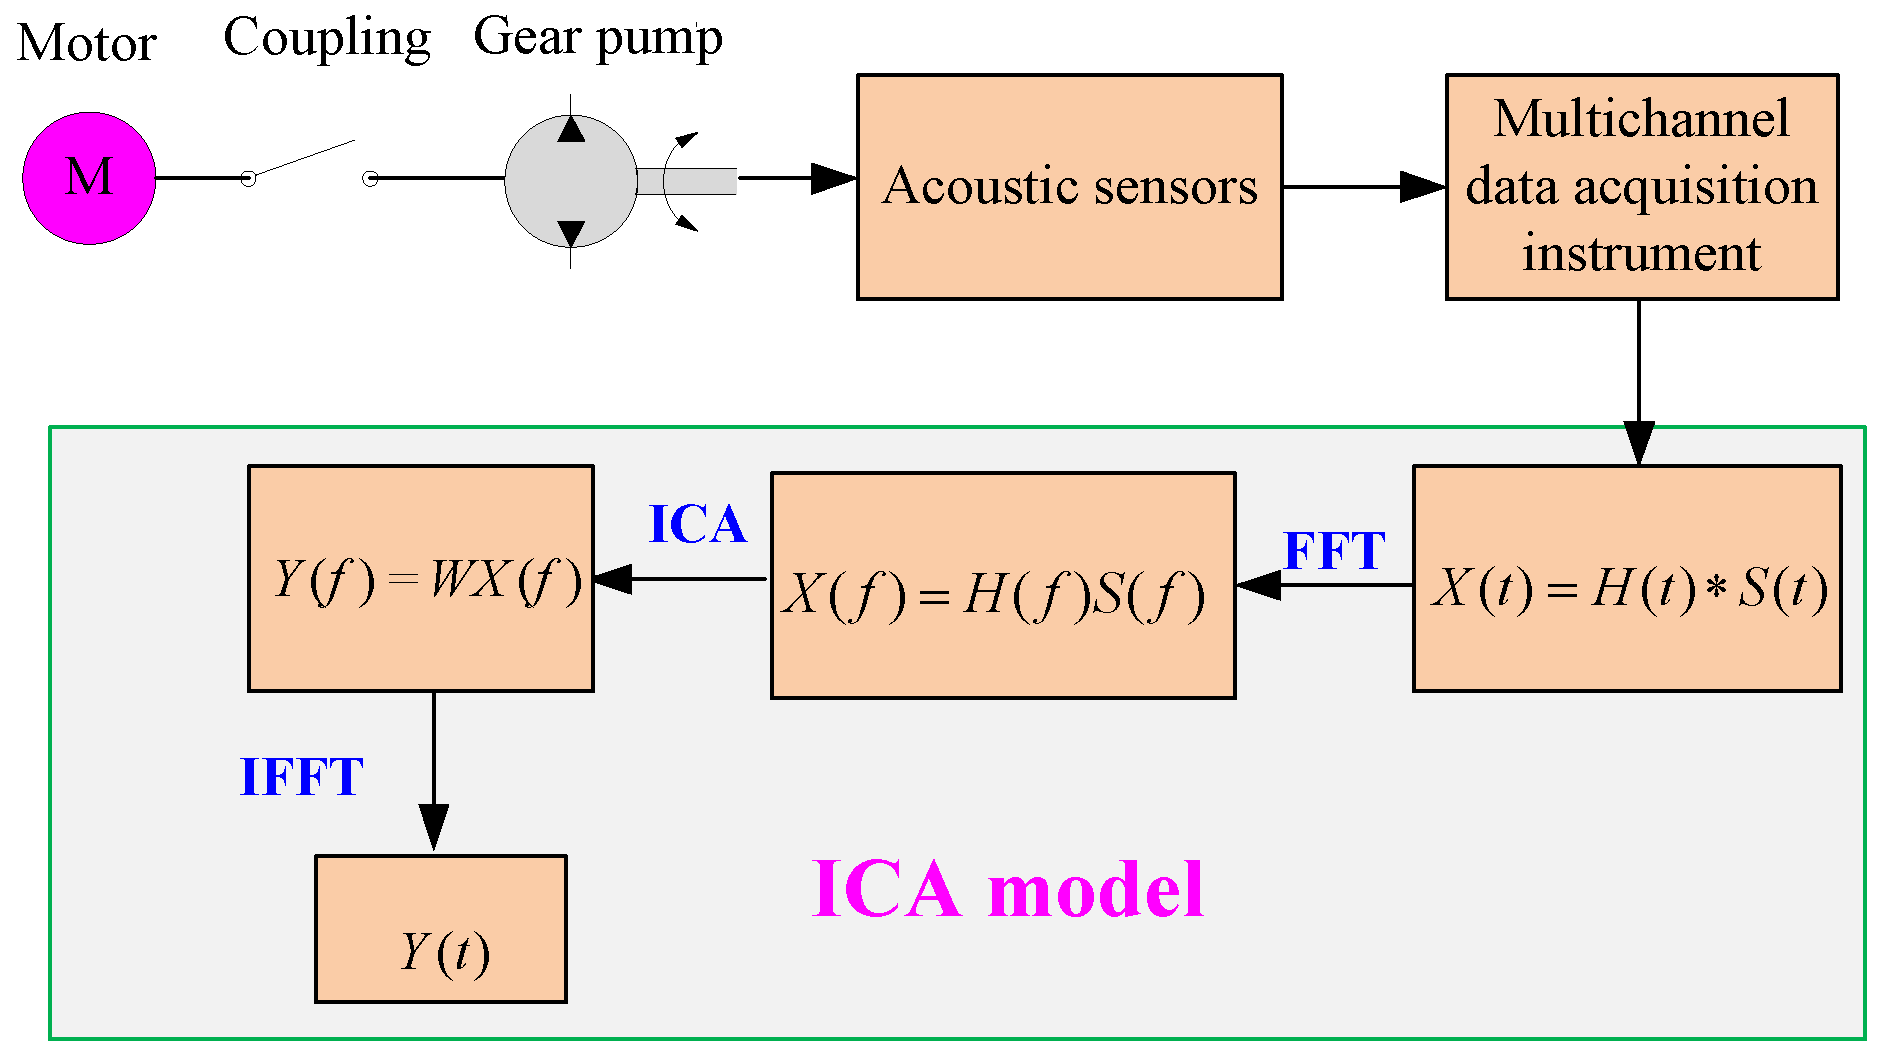
The separation process of the mixed signals based on the ICA model is shown in
Figure 7.
The specific description is as follows: The mixed signals are collected by a data acquisition instrument and converted into the frequency domain by fast Fourier transform (FFT). The ICA algorithm is used to separate mixed frequency domain signals into various source signals. Fast Fourier inverse transformation (IFFT) is used to transform the frequency domain signals into time domain signals.
3.4.2. Spectrum Analysis
The noise data of six measurement points are analyzed by 1/3 octave, the frequency spectrum and the weighted average.
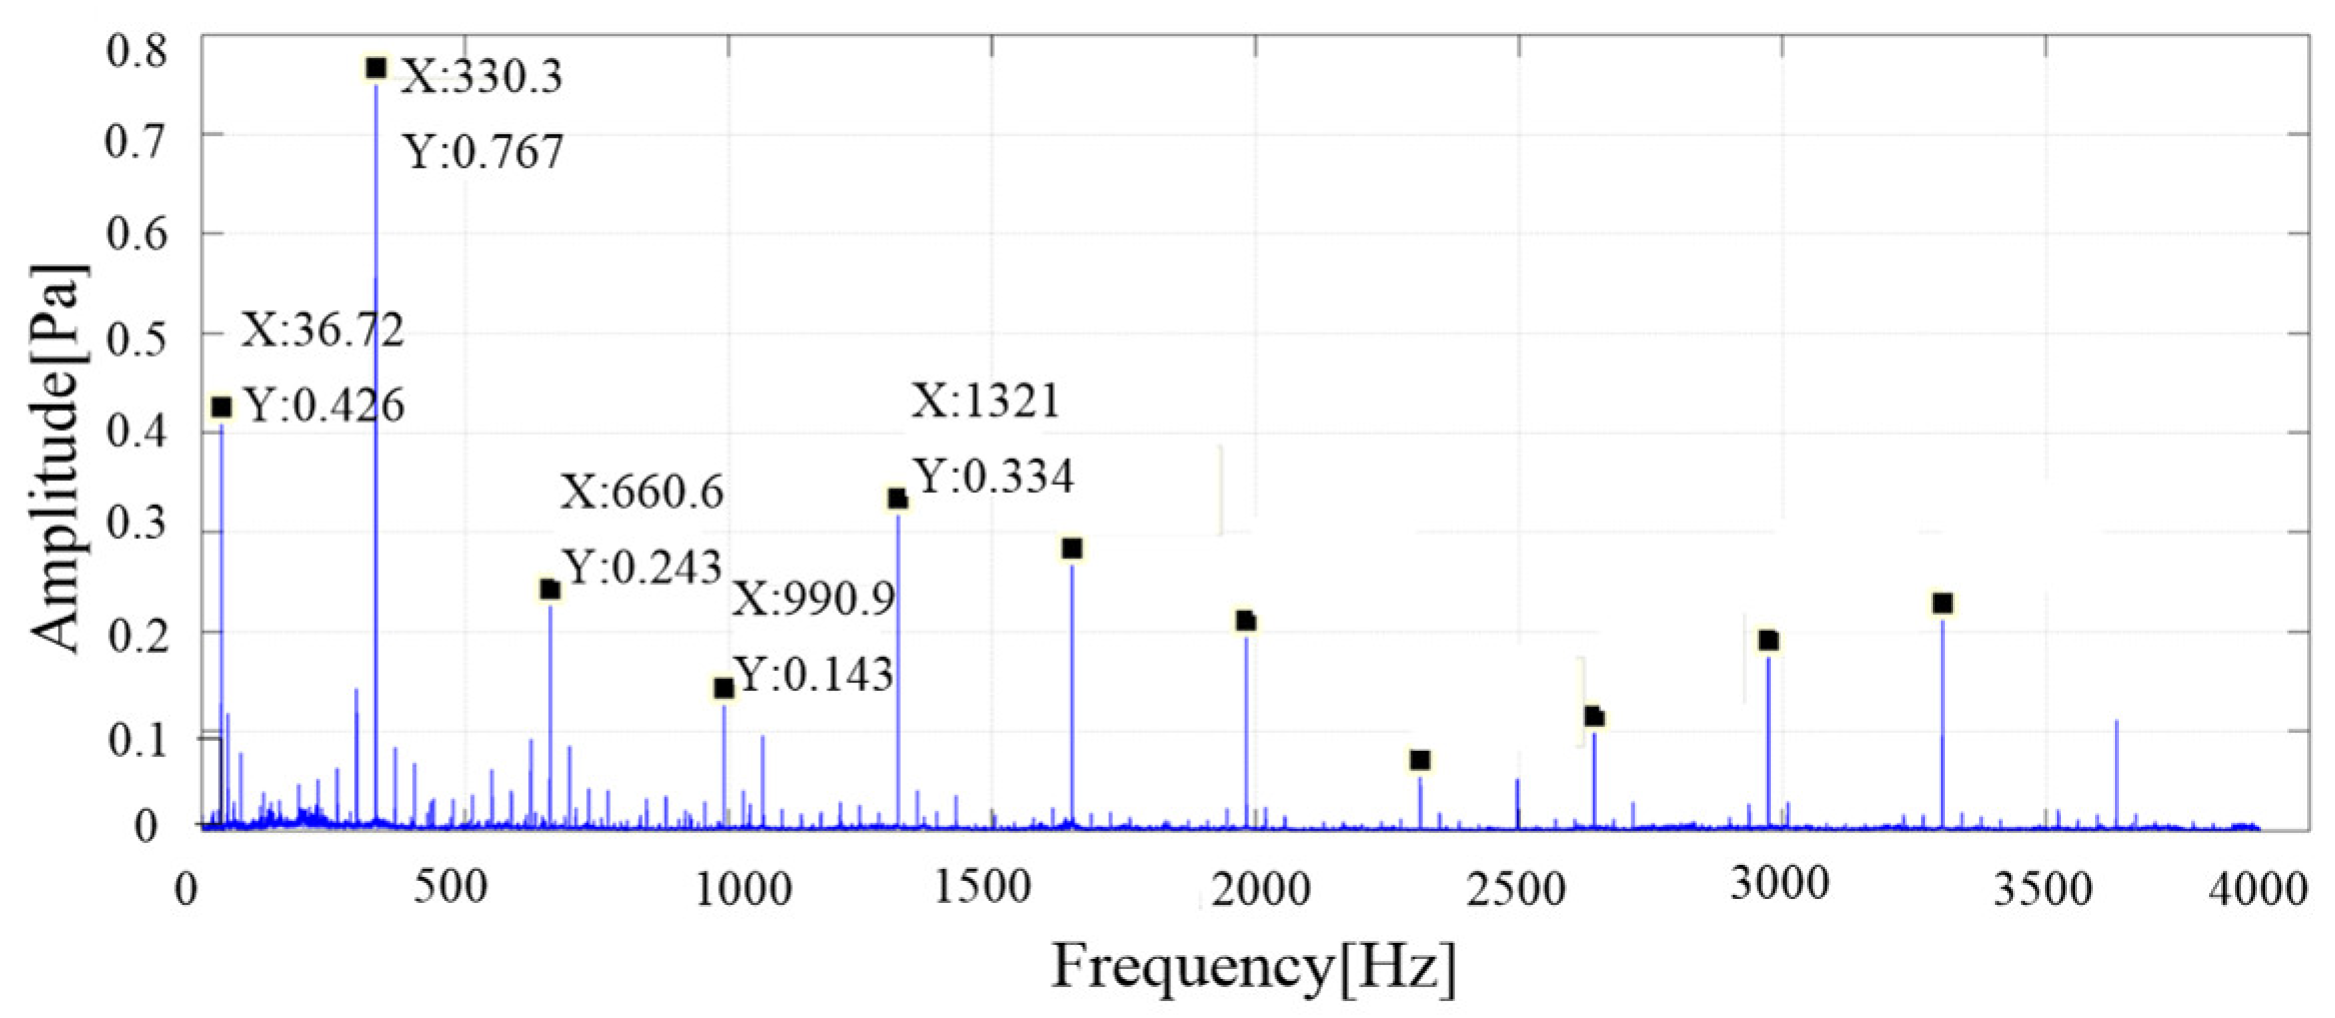
Figure 8 shows the average value of the sound pressure spectrum, which provides a theoretical basis for noise source analysis.
The maximum peak frequency in the figure is close to 330 Hz, which is consistent with the meshing frequency of the gear pump (calculated according to Formula (8), the teeth number z is 9). The second is the larger peak frequency of 36.7 Hz, which is the basic frequency of the motor (calculated according to Formula (9)). Other prominent frequency components are integral multiple frequencies of the fundamental frequency of the gear pump:
where
n is the motor speed, and
z is the teeth number of the gear pump
3.4.3. Noise Extraction from the Mixed Noise
In this paper, the ICA model was used to deal with the noise data of six measurement points. The noise signal of the gear pump was extracted to obtain a more accurate measurement value, and the noise level of the gear pump before and after optimization were compared.
The time-domain signals of six measuring points were processed by fast Fourier transform to obtain frequency-domain signals, and then the frequency-domain signals were pretreated by means processing, whitening, the eigenvalue decomposition method, and so on. It was estimated that there were three independent sources.
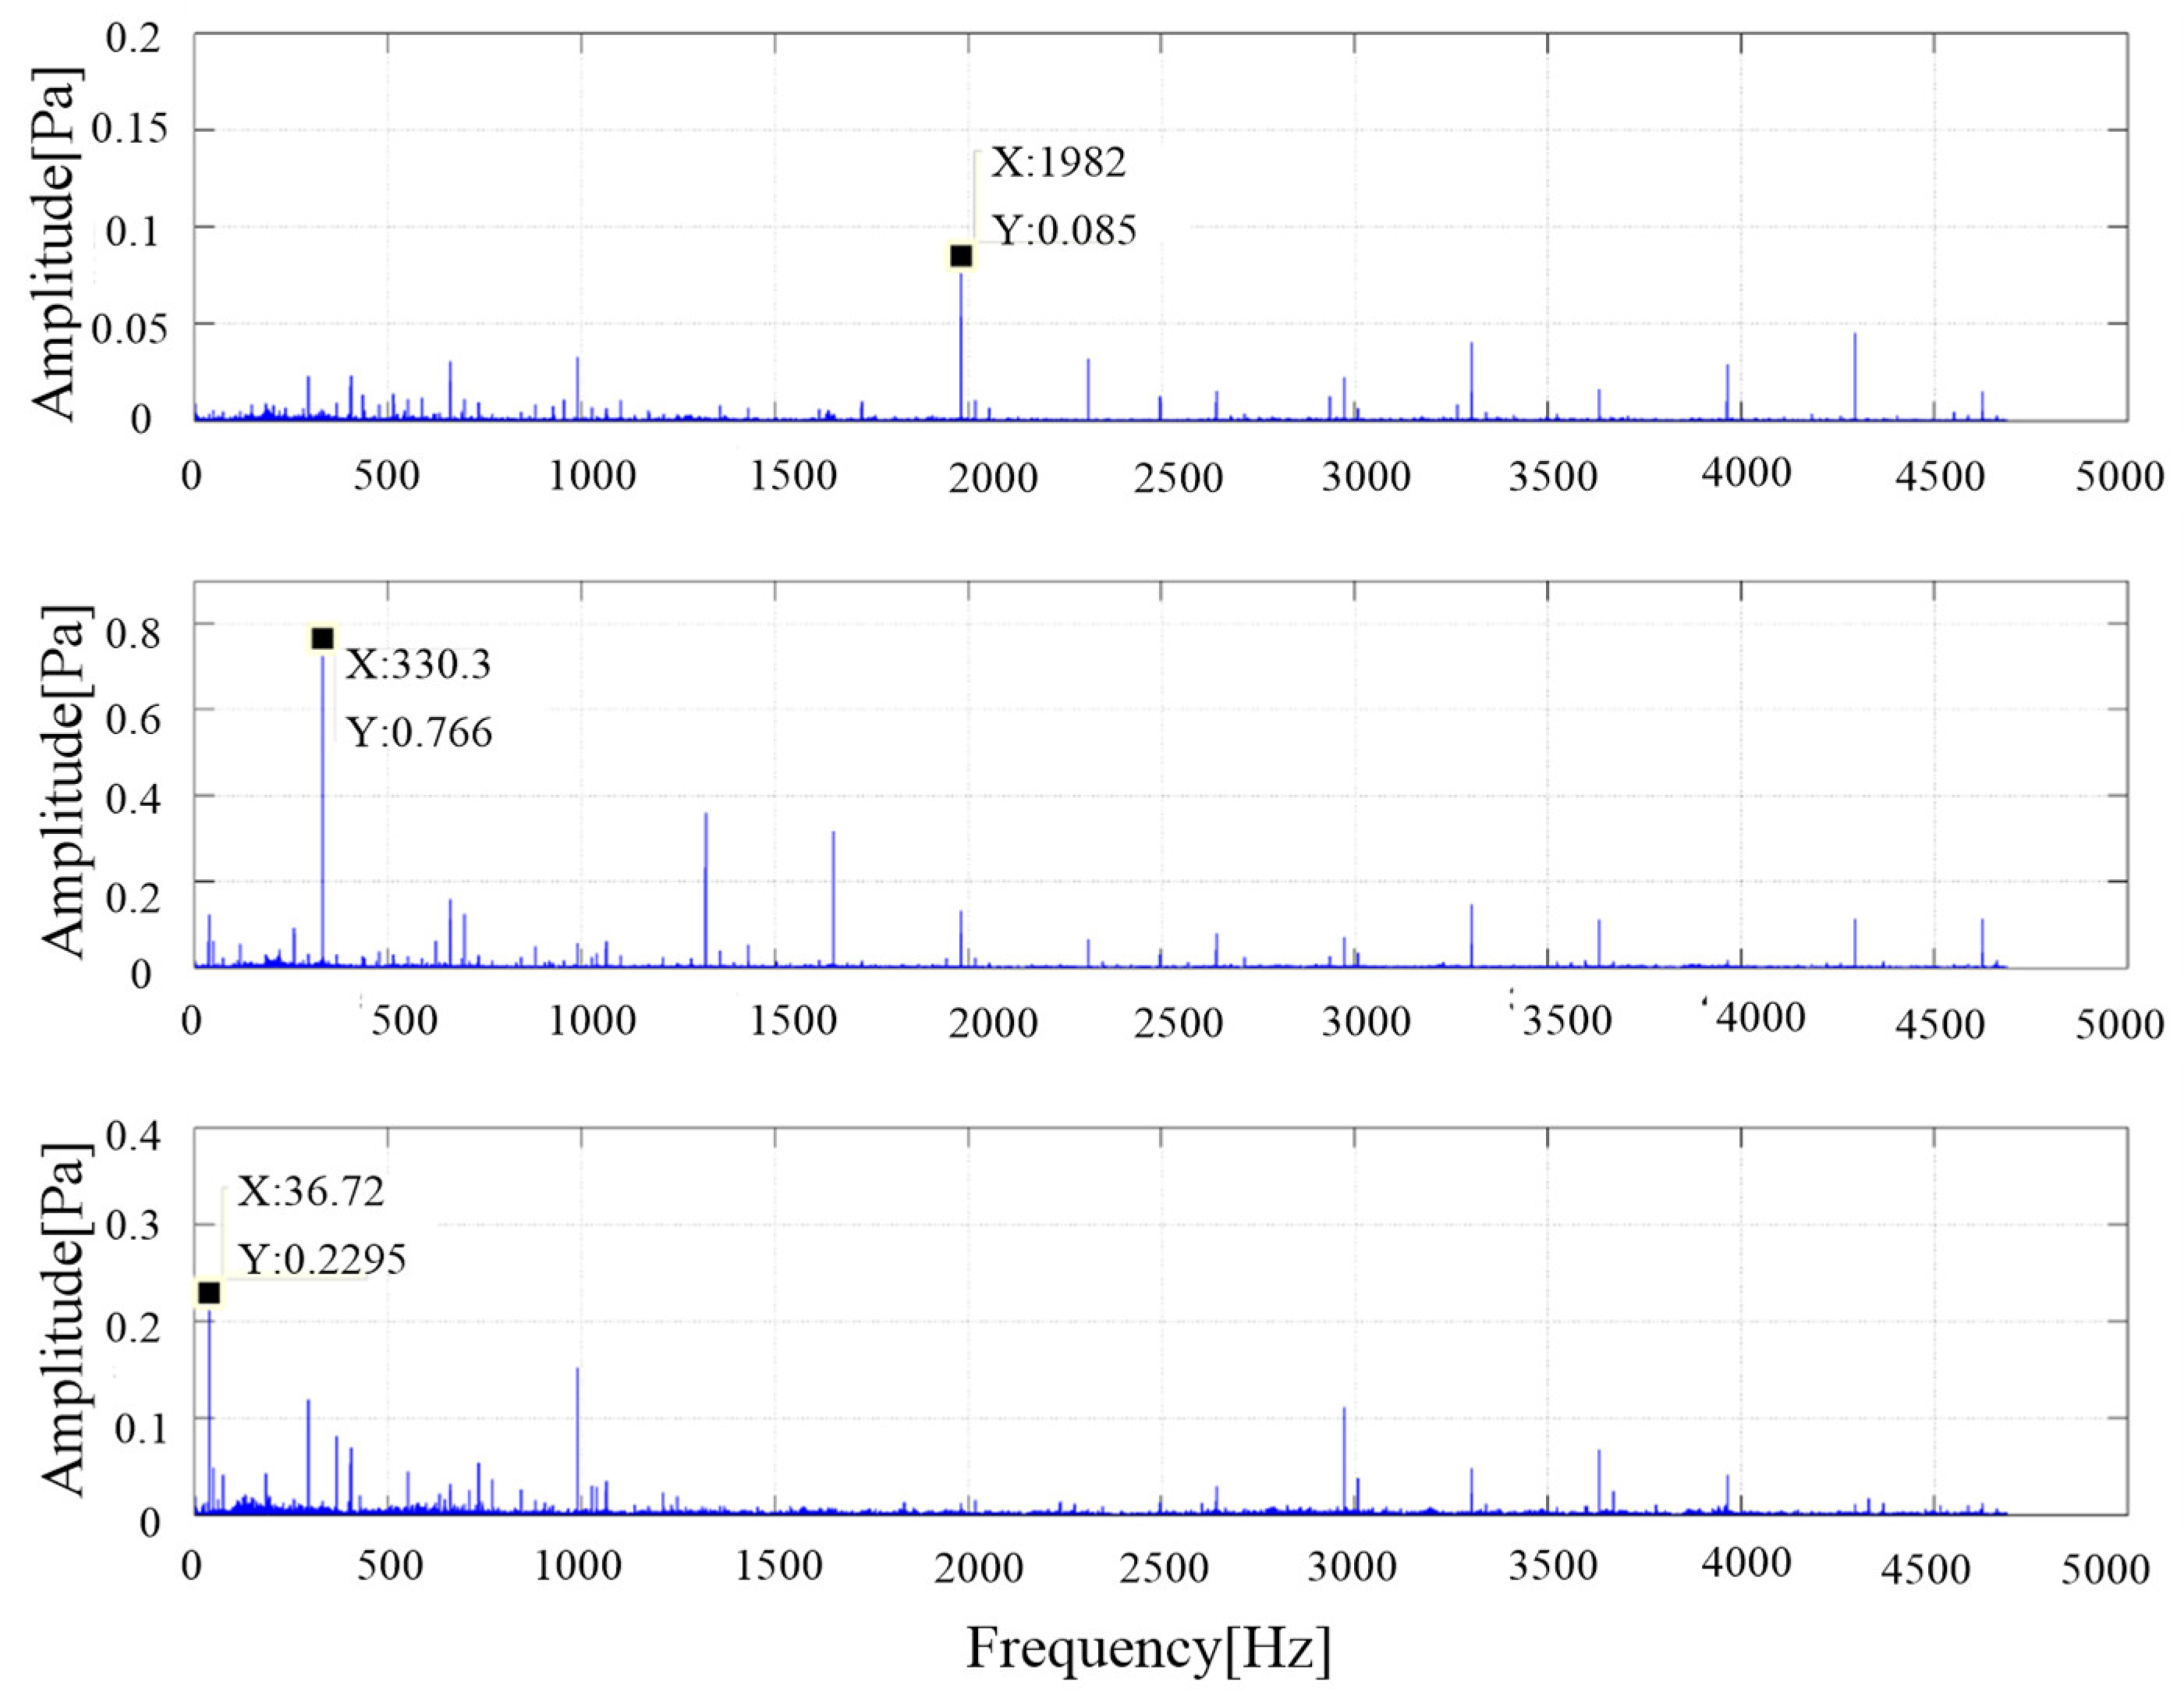
Figure 9 is the spectrum of three source signals separated by the ICA model.
As can be seen from the figure, the main peak frequency of signal 1 was 1982 Hz, and the amplitude was only 0.0852. The frequencies were mainly concentrated in the middle and high frequency bands. It was estimated that the noise may be caused by accessories such as relief valves. The main peak frequency of signal 2 was 330.3 Hz (meshing frequency of the gear pump). The amplitude of signal 2 was obviously larger than that of the other two signals, including medium and high frequencies such as 1321 Hz (4 × 330.3, four order) and 1652 (5 × 330.3, five order), and so on. Therefore, it can be inferred that the main noise comes from gear pump.
The corresponding frequency of signal 3 was 36.5 Hz, which is consistent with the motor speed, and the amplitude was about 0.23. Therefore, it can be deduced that the noise comes from motor.
IFFT was used to transform signal 2 in the time domain to get the noise signal of the gear pump. The final sound pressure was 87.6 dB (A) by calculation.


