Validity of Self-Reported Body Mass, Height, and Body Mass Index in Female Students: The Role of Physical Activity Level, Menstrual Cycle Phase, and Time of Day

 ,
,  and
and 
Abstract
:1. Introduction
2. Materials and Methods
2.1. Participants
2.2. Procedures
2.3. Statistical and Data Analysis
3. Results
4. Discussion
5. Conclusions
Author Contributions
Funding
Acknowledgments
Conflicts of Interest
References
- Olmsted, M.P.; McFarlane, T. Body weight and body image. BMC Womens Health 2004, 4 (Suppl. 1), S5. [Google Scholar] [CrossRef]
- Seijo, M.; Minckas, N.; Cormick, G.; Comandé, D.; Ciapponi, A.; BelizÁn, J.M. Comparison of self-reported and directly measured weight and height among women of reproductive age: A systematic review and meta-analysis. Acta Obstet. Gynecol. Scand. 2018, 97, 429–439. [Google Scholar] [CrossRef]
- Nieto-García, F.J.; Bush, T.L.; Keyl, P.M. Body mass definitions of obesity: Sensitivity and specificity using self-reported weight and height. Epidemiology 1990, 1, 146–152. [Google Scholar] [CrossRef]
- Fedewa, M.V.; Das, B.M.; Evans, E.M.; Dishman, R.K. Change in weight and adiposity in college students: A systematic review and meta-analysis. Am. J. Prev. Med. 2014, 47, 641–652. [Google Scholar] [CrossRef] [PubMed]
- Gropper, S.S.; Simmons, K.P.; Connell, L.J.; Ulrich, P.V. Changes in body weight, composition, and shape: A 4-year study of college students. Appl. Physiol. Nutr. Metab. Physiol. Appl. Nutr. Metab. 2012, 37, 1118–1123. [Google Scholar] [CrossRef]
- Atkinson, G.; Reilly, T. Circadian variation in sports performance. Sports Med. 1996, 21, 292–312. [Google Scholar] [CrossRef]
- Floyd, B.; Jayasinghe, L.; Dey, C. Factors influencing diurnal variation in height among adults. Homo 2017, 68, 236–241. [Google Scholar] [CrossRef]
- Ekmekcioglu, C.; Touitou, Y. Chronobiological aspects of food intake and metabolism and their relevance on energy balance and weight regulation. Obes. Rev. 2011, 12, 14–25. [Google Scholar] [CrossRef] [PubMed]
- Rosenberg, M. Weight change with oral contraceptive use and during the menstrual cycle. Results of daily measurements. Contraception 1998, 58, 345–349. [Google Scholar] [CrossRef]
- Savane, F.R.; Navarrete-Muñoz, E.M.; de la Hera, M.G.; Gimenez-Monzo, D.; Gonzalez-Palacios, S.; Valera-Gran, D.; Sempere-Orts, M.; Vioque, J. Validation of self-reported weight and height university population and factors associated with differences between self reported and measured antropometrics. Nutr. Hosp. 2013, 28, 1633–1638. [Google Scholar]
- Mozumdar, A.; Liguori, G. Correction equations to adjust self-reported height and weight for obesity estimates among college students. Res. Q. Exerc. Sport 2011, 82, 391–399. [Google Scholar] [CrossRef]
- Pengpid, S.; Peltzer, K. Vigorous physical activity, perceived stress, sleep and mental health among university students from 23 low- and middle-income countries. Int. J. Adolesc. Med. Health 2018. [Google Scholar] [CrossRef] [PubMed]
- Julian, R.; Hecksteden, A.; Fullagar, H.H.; Meyer, T. The effects of menstrual cycle phase on physical performance in female soccer players. PLoS ONE 2017, 12, e0173951. [Google Scholar] [CrossRef]
- Tounsi, M.; Jaafar, H.; Aloui, A.; Souissi, N. Soccer-related performance in eumenorrheic Tunisian high-level soccer players: Effects of menstrual cycle phase and moment of day. J. Sports Med. Phys. Fitness 2018, 58, 497–502. [Google Scholar]
- Janse de Jonge, X.A. Effects of the menstrual cycle on exercise performance. Sports Med. 2003, 33, 833–851. [Google Scholar] [CrossRef] [PubMed]
- Burrows, M.; Bird, S. The physiology of the highly trained female endurance runner. Sports Med. 2000, 30, 281–300. [Google Scholar] [CrossRef]
- Bland, J.M.; Altman, D.G. Statistical methods for assessing agreement between two methods of clinical measurement. Lancet 1986, 1, 307–310. [Google Scholar] [CrossRef]
- Cohen, J. Statistical Power Analysis for the Behavioral Sciences, 2nd ed.; Lawrence Erlbaum Associates: Hillsdale, NJ, USA, 1988. [Google Scholar]
- Batterham, A.M.; Hopkins, W.G. Making meaningful inferences about magnitudes. Int. J. Sports Physiol. Perform. 2006, 1, 50–57. [Google Scholar] [CrossRef] [PubMed]
- Wane, S.; Van Uffelen, J.G.Z.; Brown, W. Determinants of weight gain in young women: A review of the literature. J. Womens Health 2010, 19, 1327–1340. [Google Scholar] [CrossRef] [PubMed]
- Lim, L.L.Y.; Seubsman, S.A.; Sleigh, A. Validity of self-reported weight, height, and body mass index among university students in Thailand: Implications for population studies of obesity in developing countries. Popul. Health Metr. 2009, 7, 15. [Google Scholar] [CrossRef]
- Stommel, M.; Schoenborn, C.A. Accuracy and usefulness of BMI measures based on self-reported weight and height: Findings from the nhanes & nhis 2001–2006. BMC Public Health 2009, 9, 421. [Google Scholar]
- Korn, L.; Gonen, E.; Shaked, Y.; Golan, M. Health perceptions, self and body image, physical activity and nutrition among undergraduate students in Israel. PLoS ONE 2013, 8, e58543. [Google Scholar] [CrossRef] [PubMed]
- Castillo, I.; Molina-Garcia, J. [Adiposity and psychological well-being: Effects of physical activity on university students in Valencia, Spain]. Rev. Panam. Salud Publica Pan Am. J. Public Health 2009, 26, 334–340. [Google Scholar]
- Craig, C.L.; Marshall, A.L.; Sjostrom, M.; Bauman, A.E.; Booth, M.L.; Ainsworth, B.E.; Pratt, M.; Ekelund, U.; Yngve, A.; Sallis, J.F.; et al. International physical activity questionnaire: 12-country reliability and validity. Med. Sci. Sports Exerc. 2003, 35, 1381–1395. [Google Scholar] [CrossRef]
- Strath, S.J.; Kaminsky, L.A.; Ainsworth, B.E.; Ekelund, U.; Freedson, P.S.; Gary, R.A.; Richardson, C.R.; Smith, D.T.; Swartz, A.M. Guide to the assessment of physical activity: Clinical and research applications: A scientific statement from the American heart association. Circulation 2013, 128, 2259–2279. [Google Scholar] [CrossRef]
- Lee, P.H.; Macfarlane, D.J.; Lam, T.H.; Stewart, S.M. Validity of the international physical activity questionnaire short form (ipaq-sf): A systematic review. Int. J. Behav. Nutr. Phys. Act. 2011, 8, 115. [Google Scholar] [CrossRef]
- Haghighizadeh, M.H.; Karandish, M.; Ghoreishi, M.; Soroor, F.; Shirani, F. Body weight changes during the menstrual cycle among university students in Ahvaz, Iran. Pak. J. Biol. Sci. PJBS 2014, 17, 915–919. [Google Scholar]
- Ohara, K.; Okita, Y.; Kouda, K.; Mase, T.; Miyawaki, C.; Nakamura, H. Cardiovascular response to short-term fasting in menstrual phases in young women: An observational study. BMC Womens Health 2015, 15, 67. [Google Scholar] [CrossRef]
- Davidsen, L.; Vistisen, B.; Astrup, A. Impact of the menstrual cycle on determinants of energy balance: A putative role in weight loss attempts. Int. J. Obes. 2007, 31, 1777–1785. [Google Scholar] [CrossRef]
- Gunnare, N.A.; Silliman, K.; Morris, M.N. Accuracy of self-reported weight and role of gender, body mass index, weight satisfaction, weighing behavior, and physical activity among rural college students. Body Image 2013, 10, 406–410. [Google Scholar] [CrossRef] [PubMed]


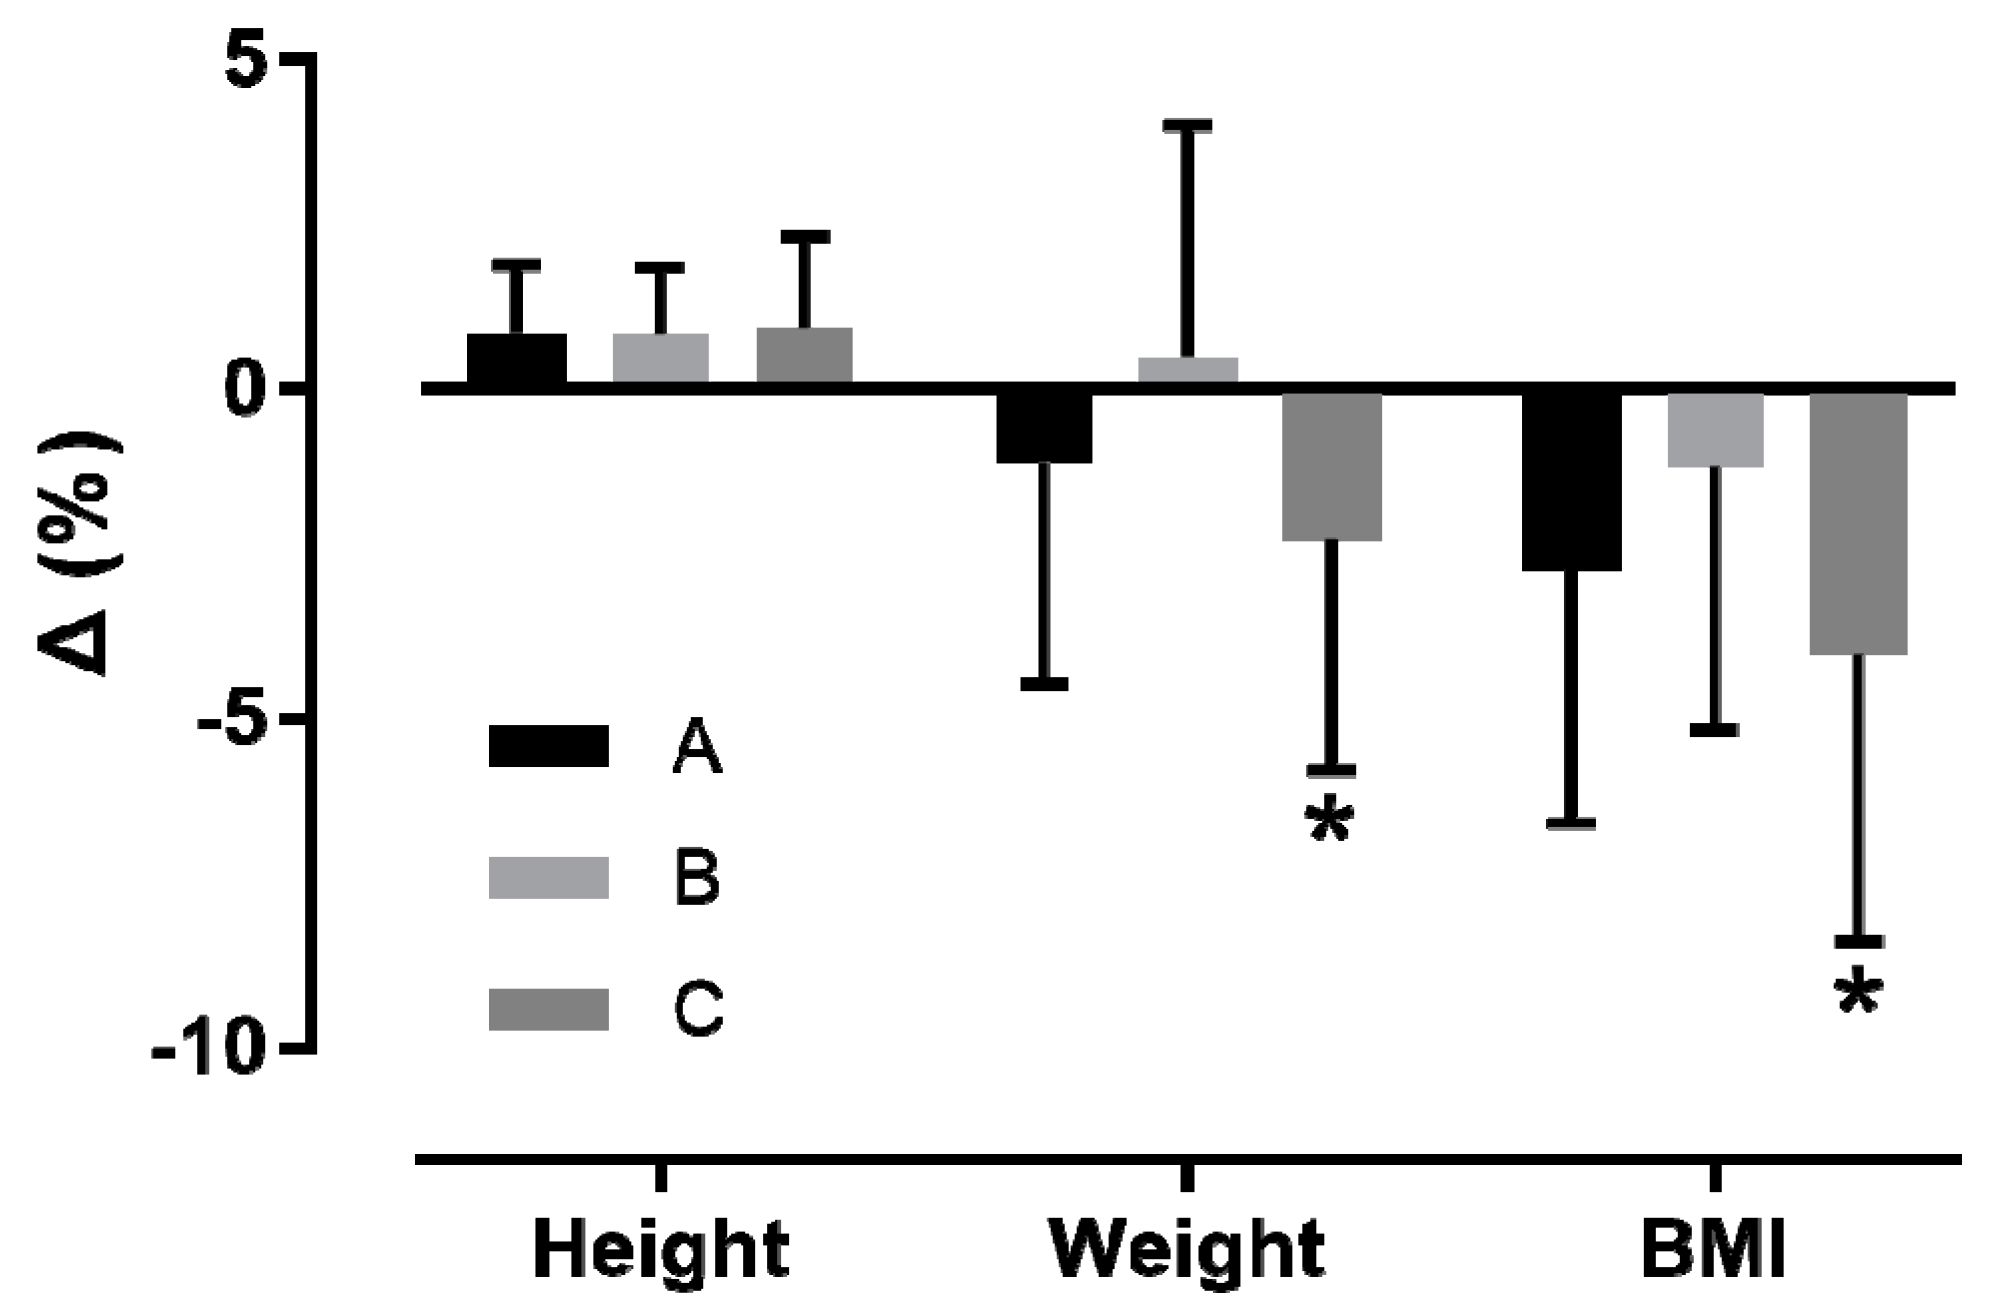
| Total (n = 93) | Q1 (n = 23) | Q2 (n = 23) | Q3 (n = 23) | Q4 (n = 24) | |
|---|---|---|---|---|---|
| Time of day | A:36, B:20, C:37 | A:8, B:3, C:12 | A:9, B:2, C:12 | A:10, B:5, C:8 | A:9, B:10, C:5 |
| Age (years) | 21.8 ± 4.7 | 21.3 ± 3.2 | 21.8 ± 5.0 | 20.7 ± 1.5 | 23.3 ± 6.9 |
| IPAQ (MET × min) | 2702 ± 2264 | 3189 ± 2206 | 2448 ± 2808 | 3729 ± 2301 | 1592 ± 1253 |
| Menstrual cycle phase | early FP:12, mid LP:11 | early FP:3, mid LP:3 | early FP:0, mid LP:5 | early FP:4, mid LP:2 | early FP:5, mid LP:1 |
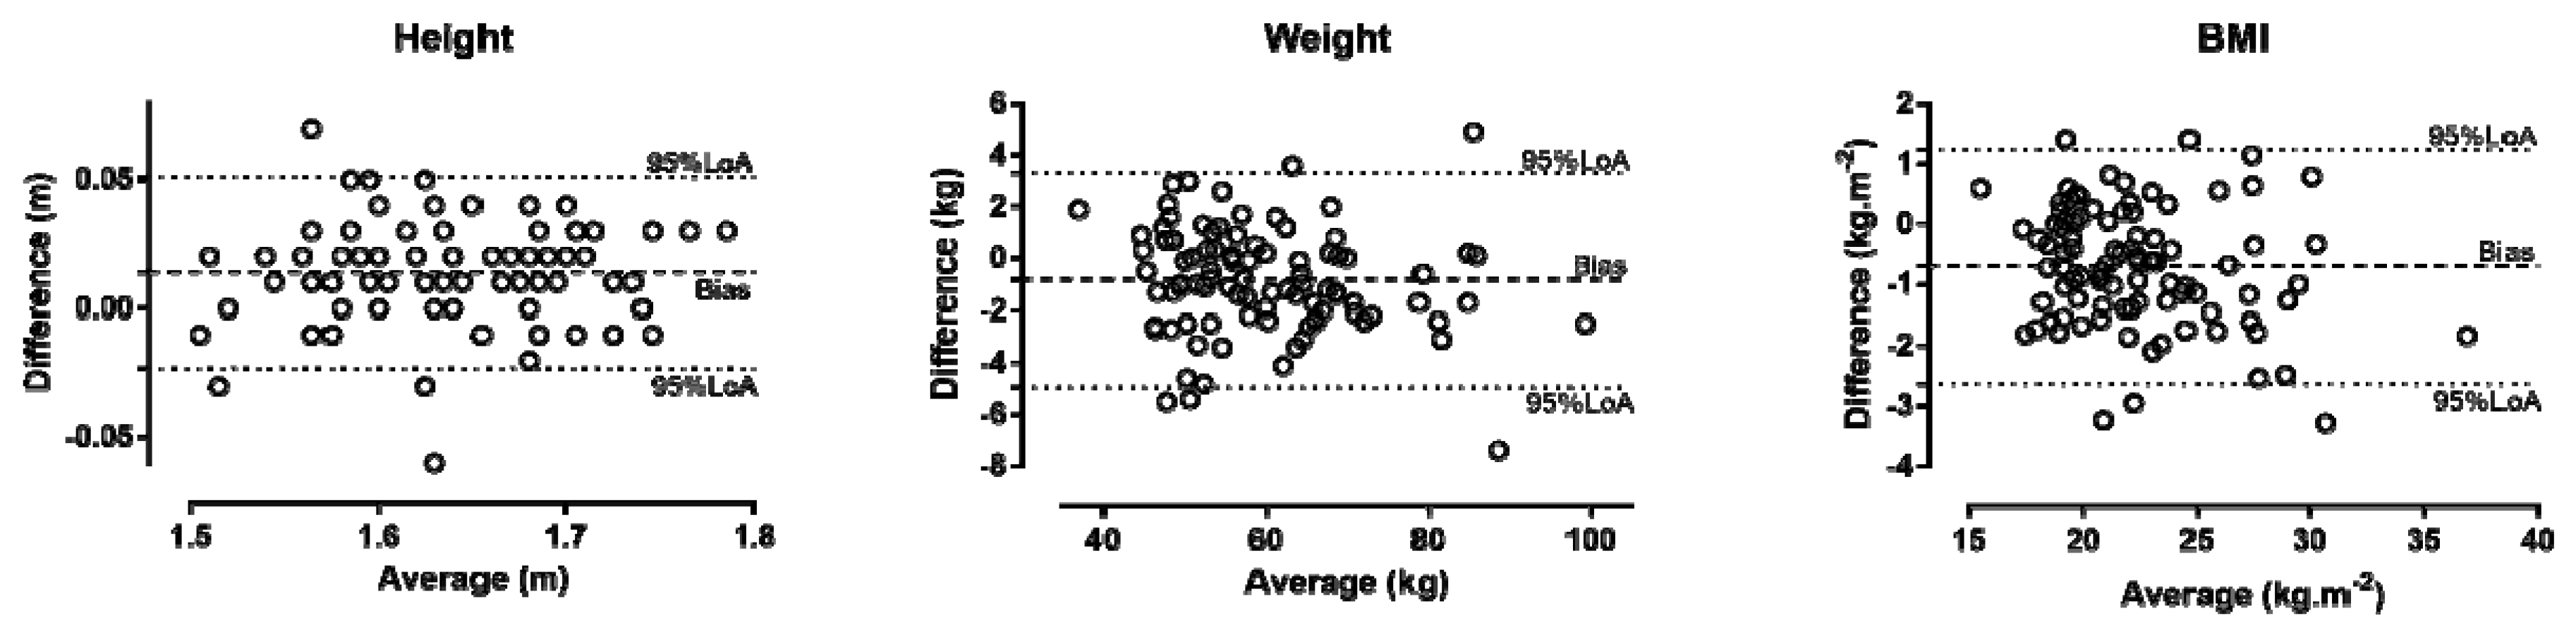
| Height | |||||
| Measured height (m) | 1.63 ± 0.06 | 1.62 ± 0.06 | 1.65 ± 0.06 | 1.62 ± 0.06 | 1.63 ± 0.07 |
| Reported height (m) | 1.64 ± 0.06 | 1.64 ± 0.06 | 1.66 ± 0.05 | 1.63 ± 0.06 | 1.63 ± 0.08 |
| Δheight (m) | 0.01 ± 0.02 | 0.03 ± 0.02 | 0.02 ± 0.01 | 0.01 ± 0.01 | 0 ± 0.02 |
| %Δheight | 0.9 ± 1.2 | 1.7 ± 1.2 | 1.0 ± 0.6 | 0.7 ± 0.8 | 0.1 ± 1.3 |
| Weight | |||||
| Measured weight (kg) | 60.5 ± 11.9 | 61.1 ± 12.5 | 65.6 ± 13.1 | 58.2 ± 10.0 | 57.3 ± 10.8 |
| Reported weight (kg) | 59.7 ± 11.6 | 58.0 ± 12.3 | 64.0 ± 12.8 | 58.0 ± 9.7 | 58.8 ± 11.1 |
| Δweight (kg) | −0.8 ± 2.1 | −3.0 ± 1.7 | −1.6 ± 0.8 | −0.2 ± 1.2 | 1.5 ± 1.3 |
| %Δweight | −1.2 ± 3.6 | −5.1 ± 2.8 | −2.4 ± 1.2 | −0.2 ± 2.1 | 2.6 ± 2.2 |
| BMI | |||||
| Measured BMI (kg/m2) | 22.7 ± 3.8 | 23.3 ± 3.9 | 24.2 ± 4.4 | 22.0 ± 3.2 | 21.5 ± 3.3 |
| Reported BMI (kg/m2) | 22.0 ± 3.6 | 21.3 ± 3.6 | 23.1 ± 4.2 | 21.7 ± 3.1 | 22.1 ± 3.4 |
| ΔBMI (kg/m2) | −0.7 ± 1.0 | −1.9 ± 0.6 | −1.1 ± 0.3 | −0.4 ± 0.2 | 0.5 ± 0.4 |
| %ΔBMI | −2.9 ± 4.2 | −8.2 ± 2.1 | −4.4 ± 0.7 | −1.6 ± 0.9 | 2.4 ± 1.8 |
© 2019 by the authors. Licensee MDPI, Basel, Switzerland. This article is an open access article distributed under the terms and conditions of the Creative Commons Attribution (CC BY) license (http://creativecommons.org/licenses/by/4.0/).
Share and Cite
Kintziou, E.; Nikolaidis, P.T.; Kefala, V.; Rosemann, T.; Knechtle, B. Validity of Self-Reported Body Mass, Height, and Body Mass Index in Female Students: The Role of Physical Activity Level, Menstrual Cycle Phase, and Time of Day. Int. J. Environ. Res. Public Health 2019, 16, 1192. https://0-doi-org.brum.beds.ac.uk/10.3390/ijerph16071192
Kintziou E, Nikolaidis PT, Kefala V, Rosemann T, Knechtle B. Validity of Self-Reported Body Mass, Height, and Body Mass Index in Female Students: The Role of Physical Activity Level, Menstrual Cycle Phase, and Time of Day. International Journal of Environmental Research and Public Health. 2019; 16(7):1192. https://0-doi-org.brum.beds.ac.uk/10.3390/ijerph16071192
Chicago/Turabian StyleKintziou, Eleni, Pantelis T. Nikolaidis, Vasiliki Kefala, Thomas Rosemann, and Beat Knechtle. 2019. "Validity of Self-Reported Body Mass, Height, and Body Mass Index in Female Students: The Role of Physical Activity Level, Menstrual Cycle Phase, and Time of Day" International Journal of Environmental Research and Public Health 16, no. 7: 1192. https://0-doi-org.brum.beds.ac.uk/10.3390/ijerph16071192