Lifestyle Habits Predict Academic Performance in High School Students: The Adolescent Student Academic Performance Longitudinal Study (ASAP)


Abstract
:1. Introduction
1.1. Physical Activity
1.2. Sleeping Habits
1.3. Screen Time
1.4. Eating Habits
1.5. Cognitive Control
2. Materials and Methods
2.1. Overview
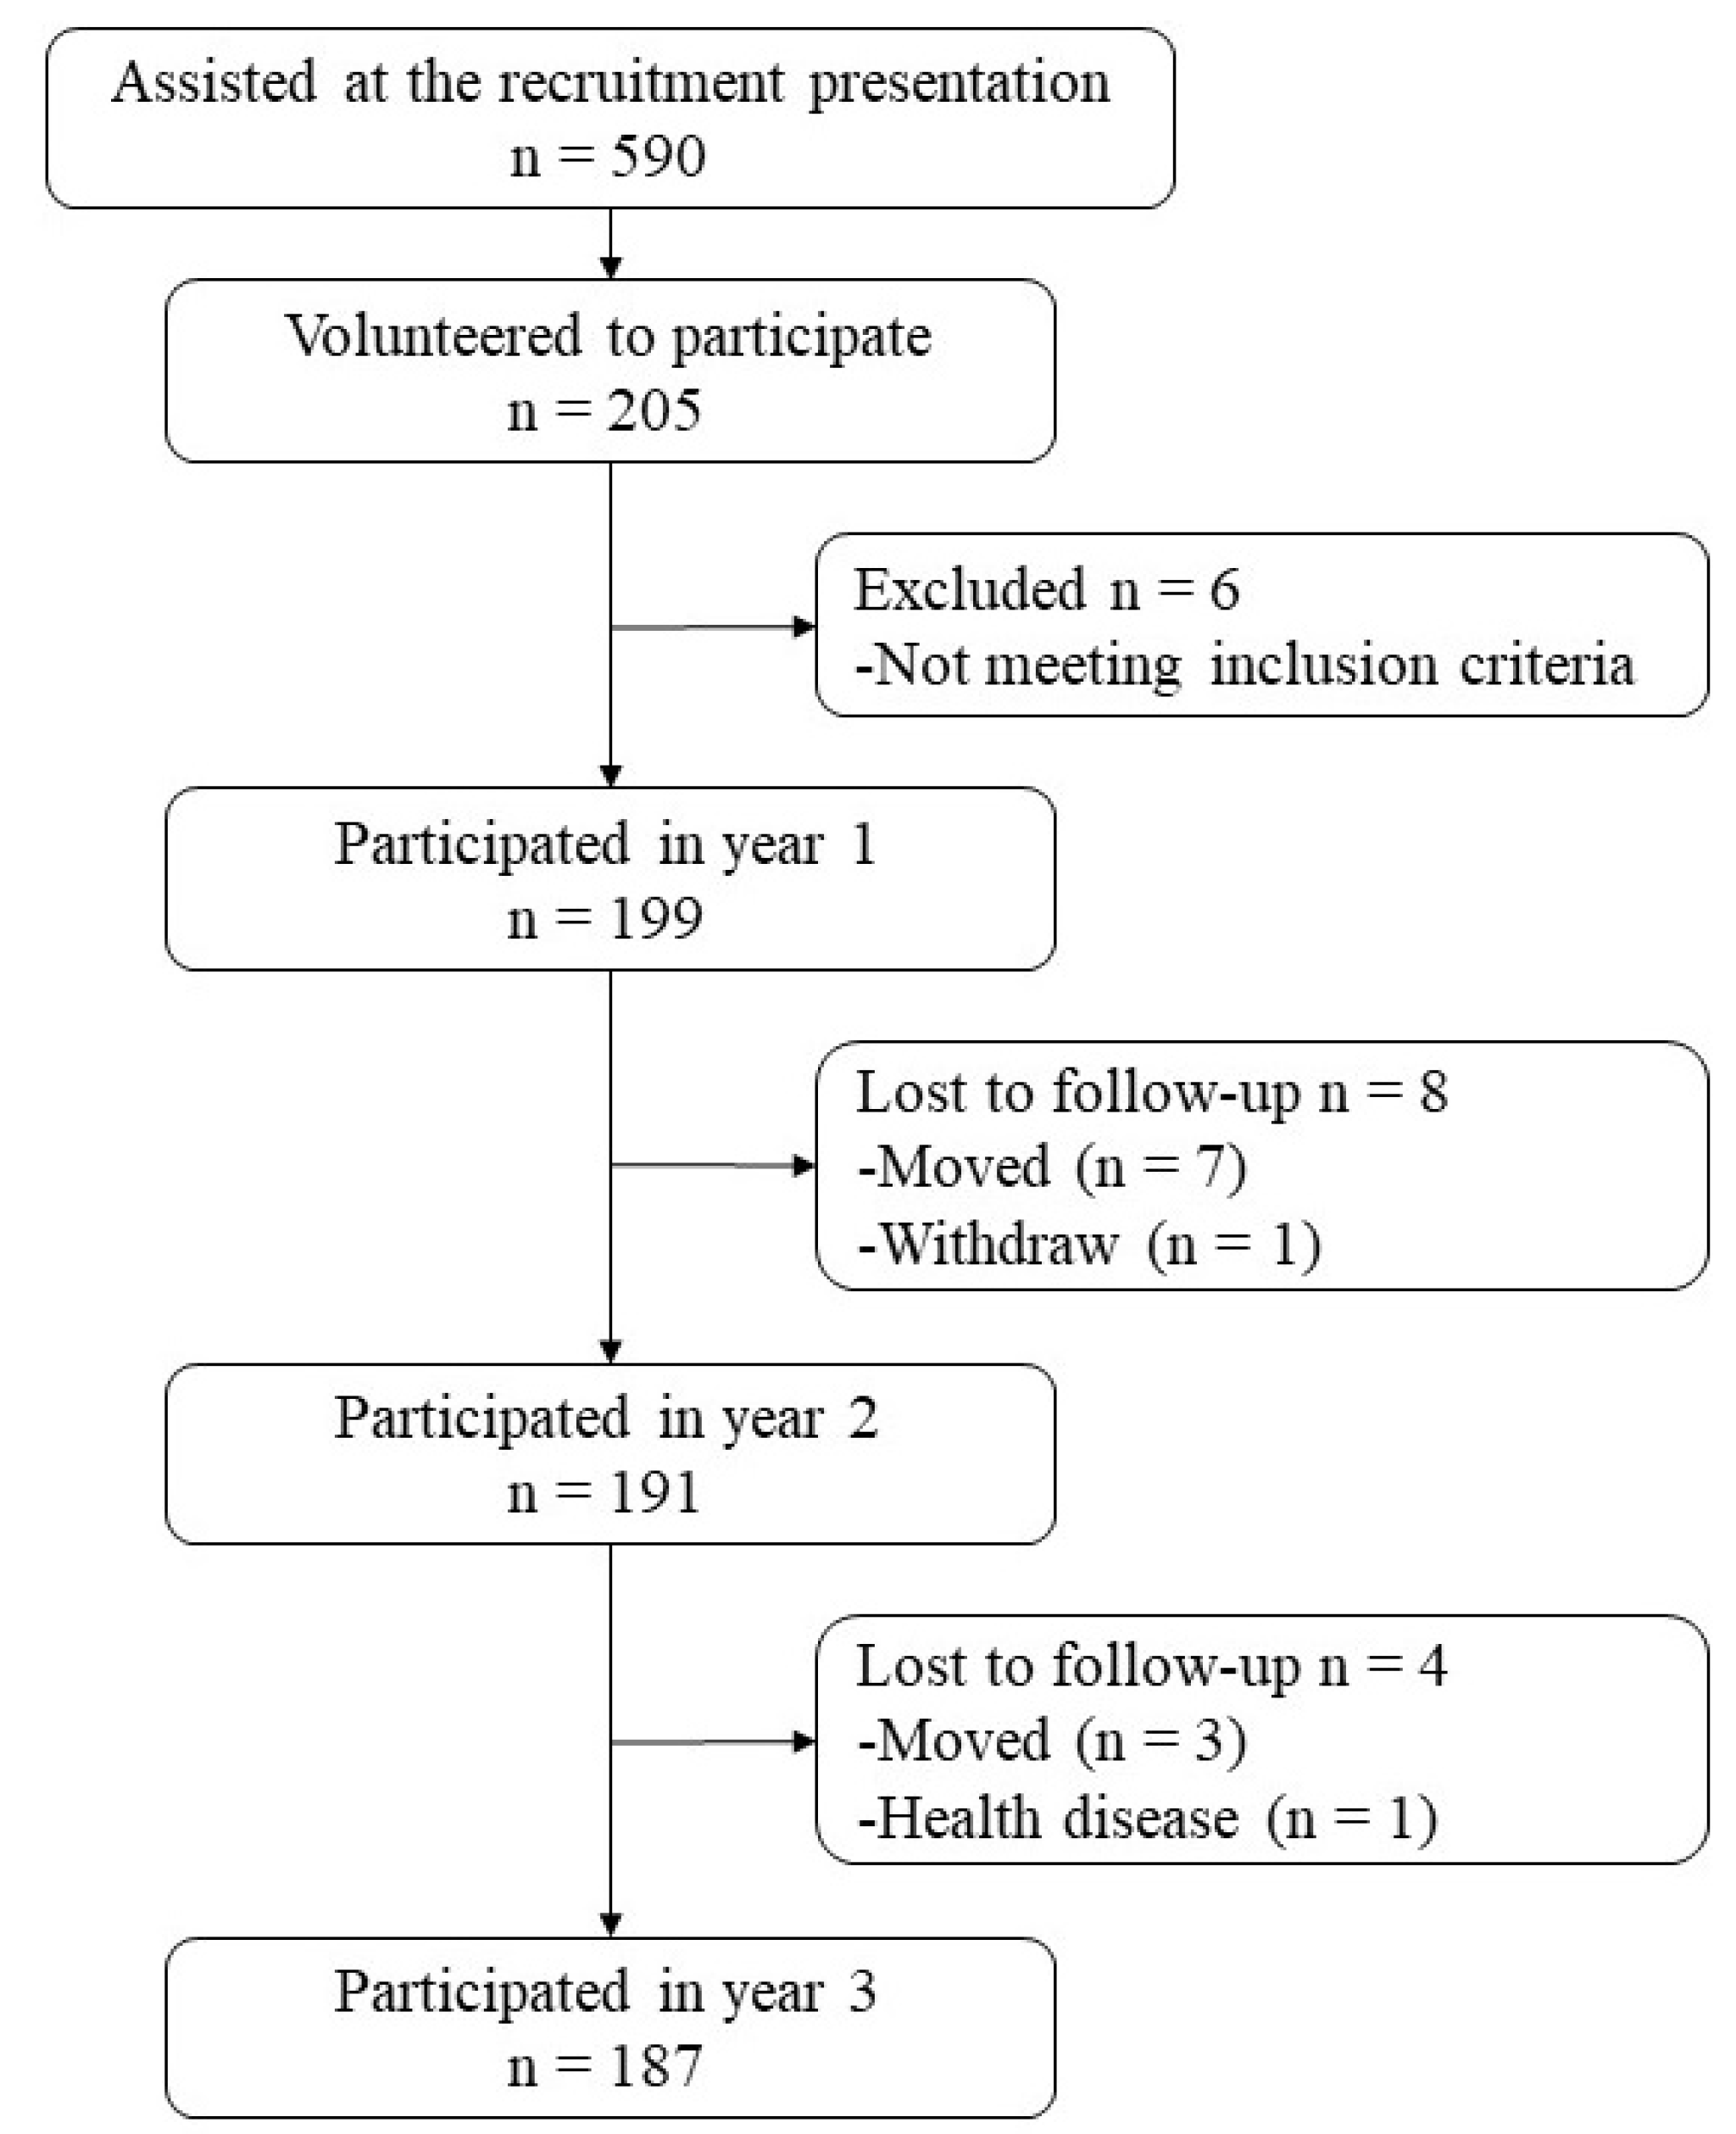
2.2. Participants
2.3. Demographic Variables
2.4. Academic Performance
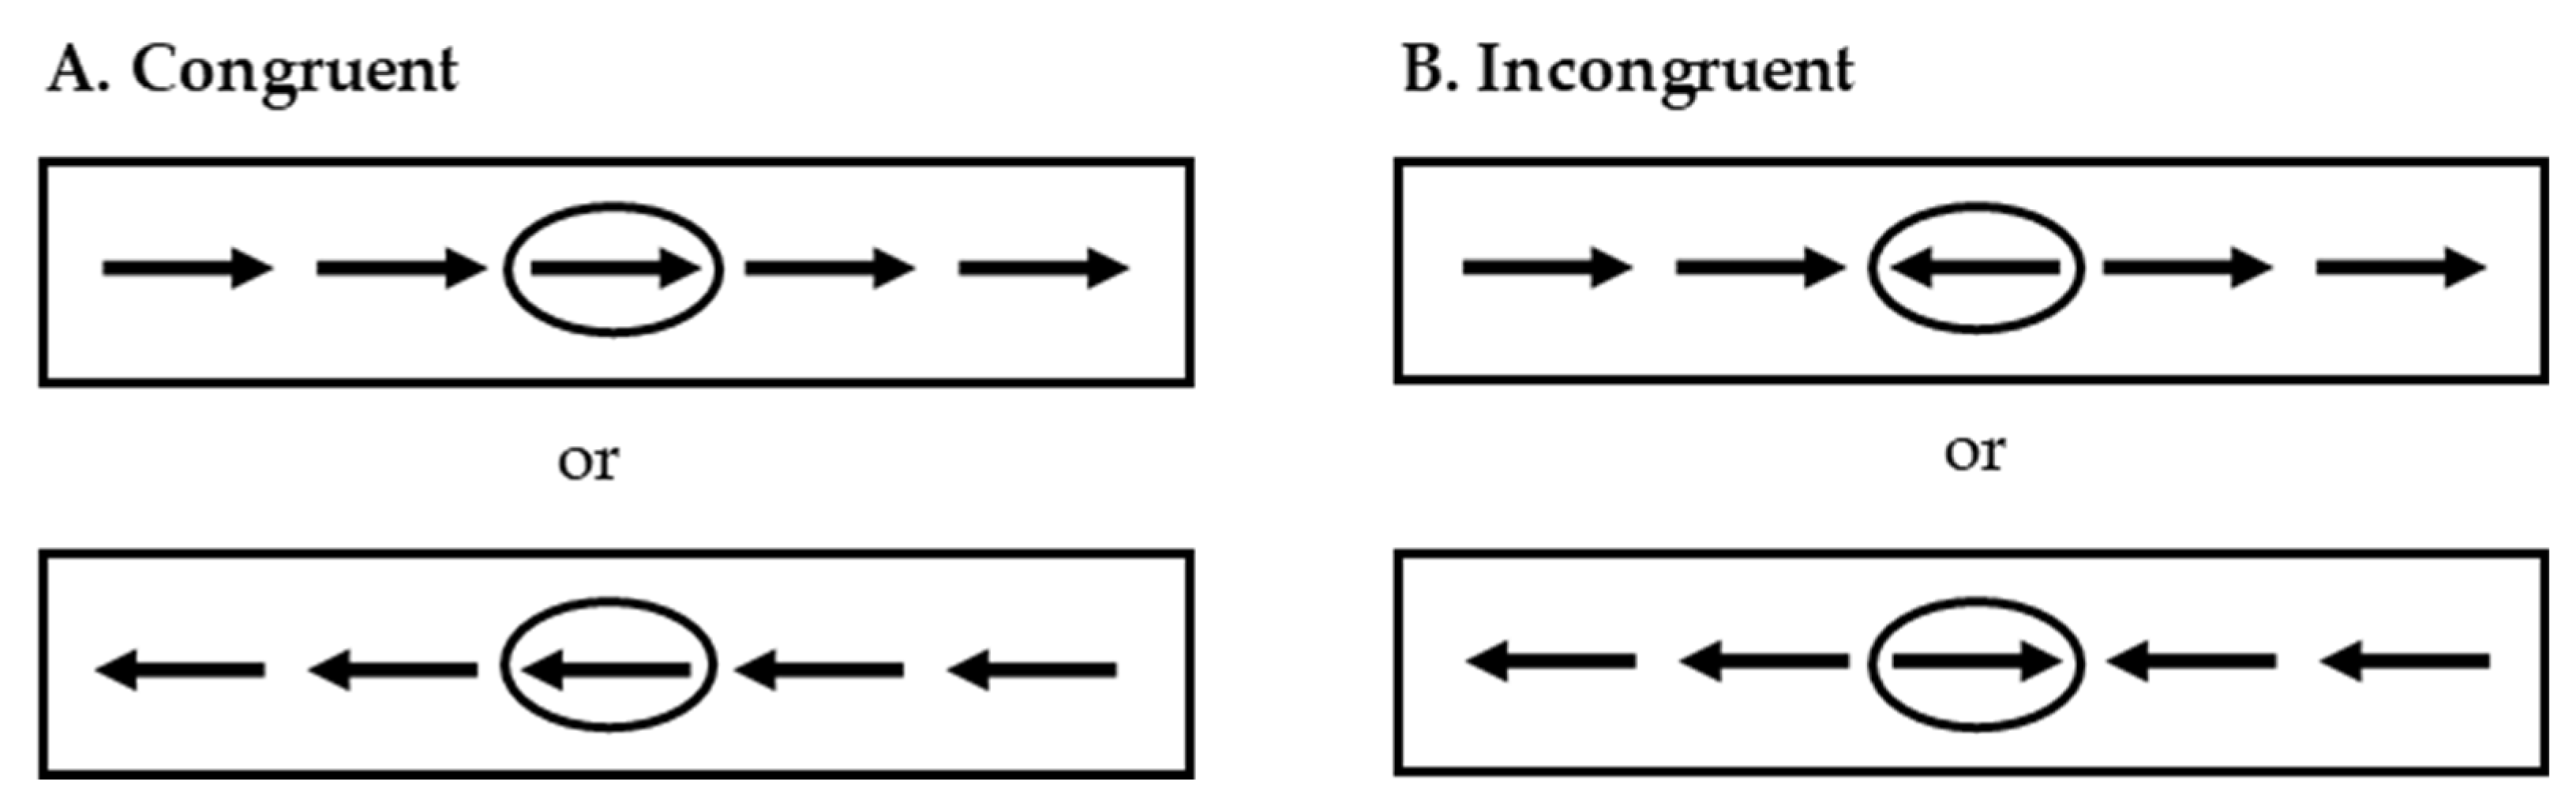
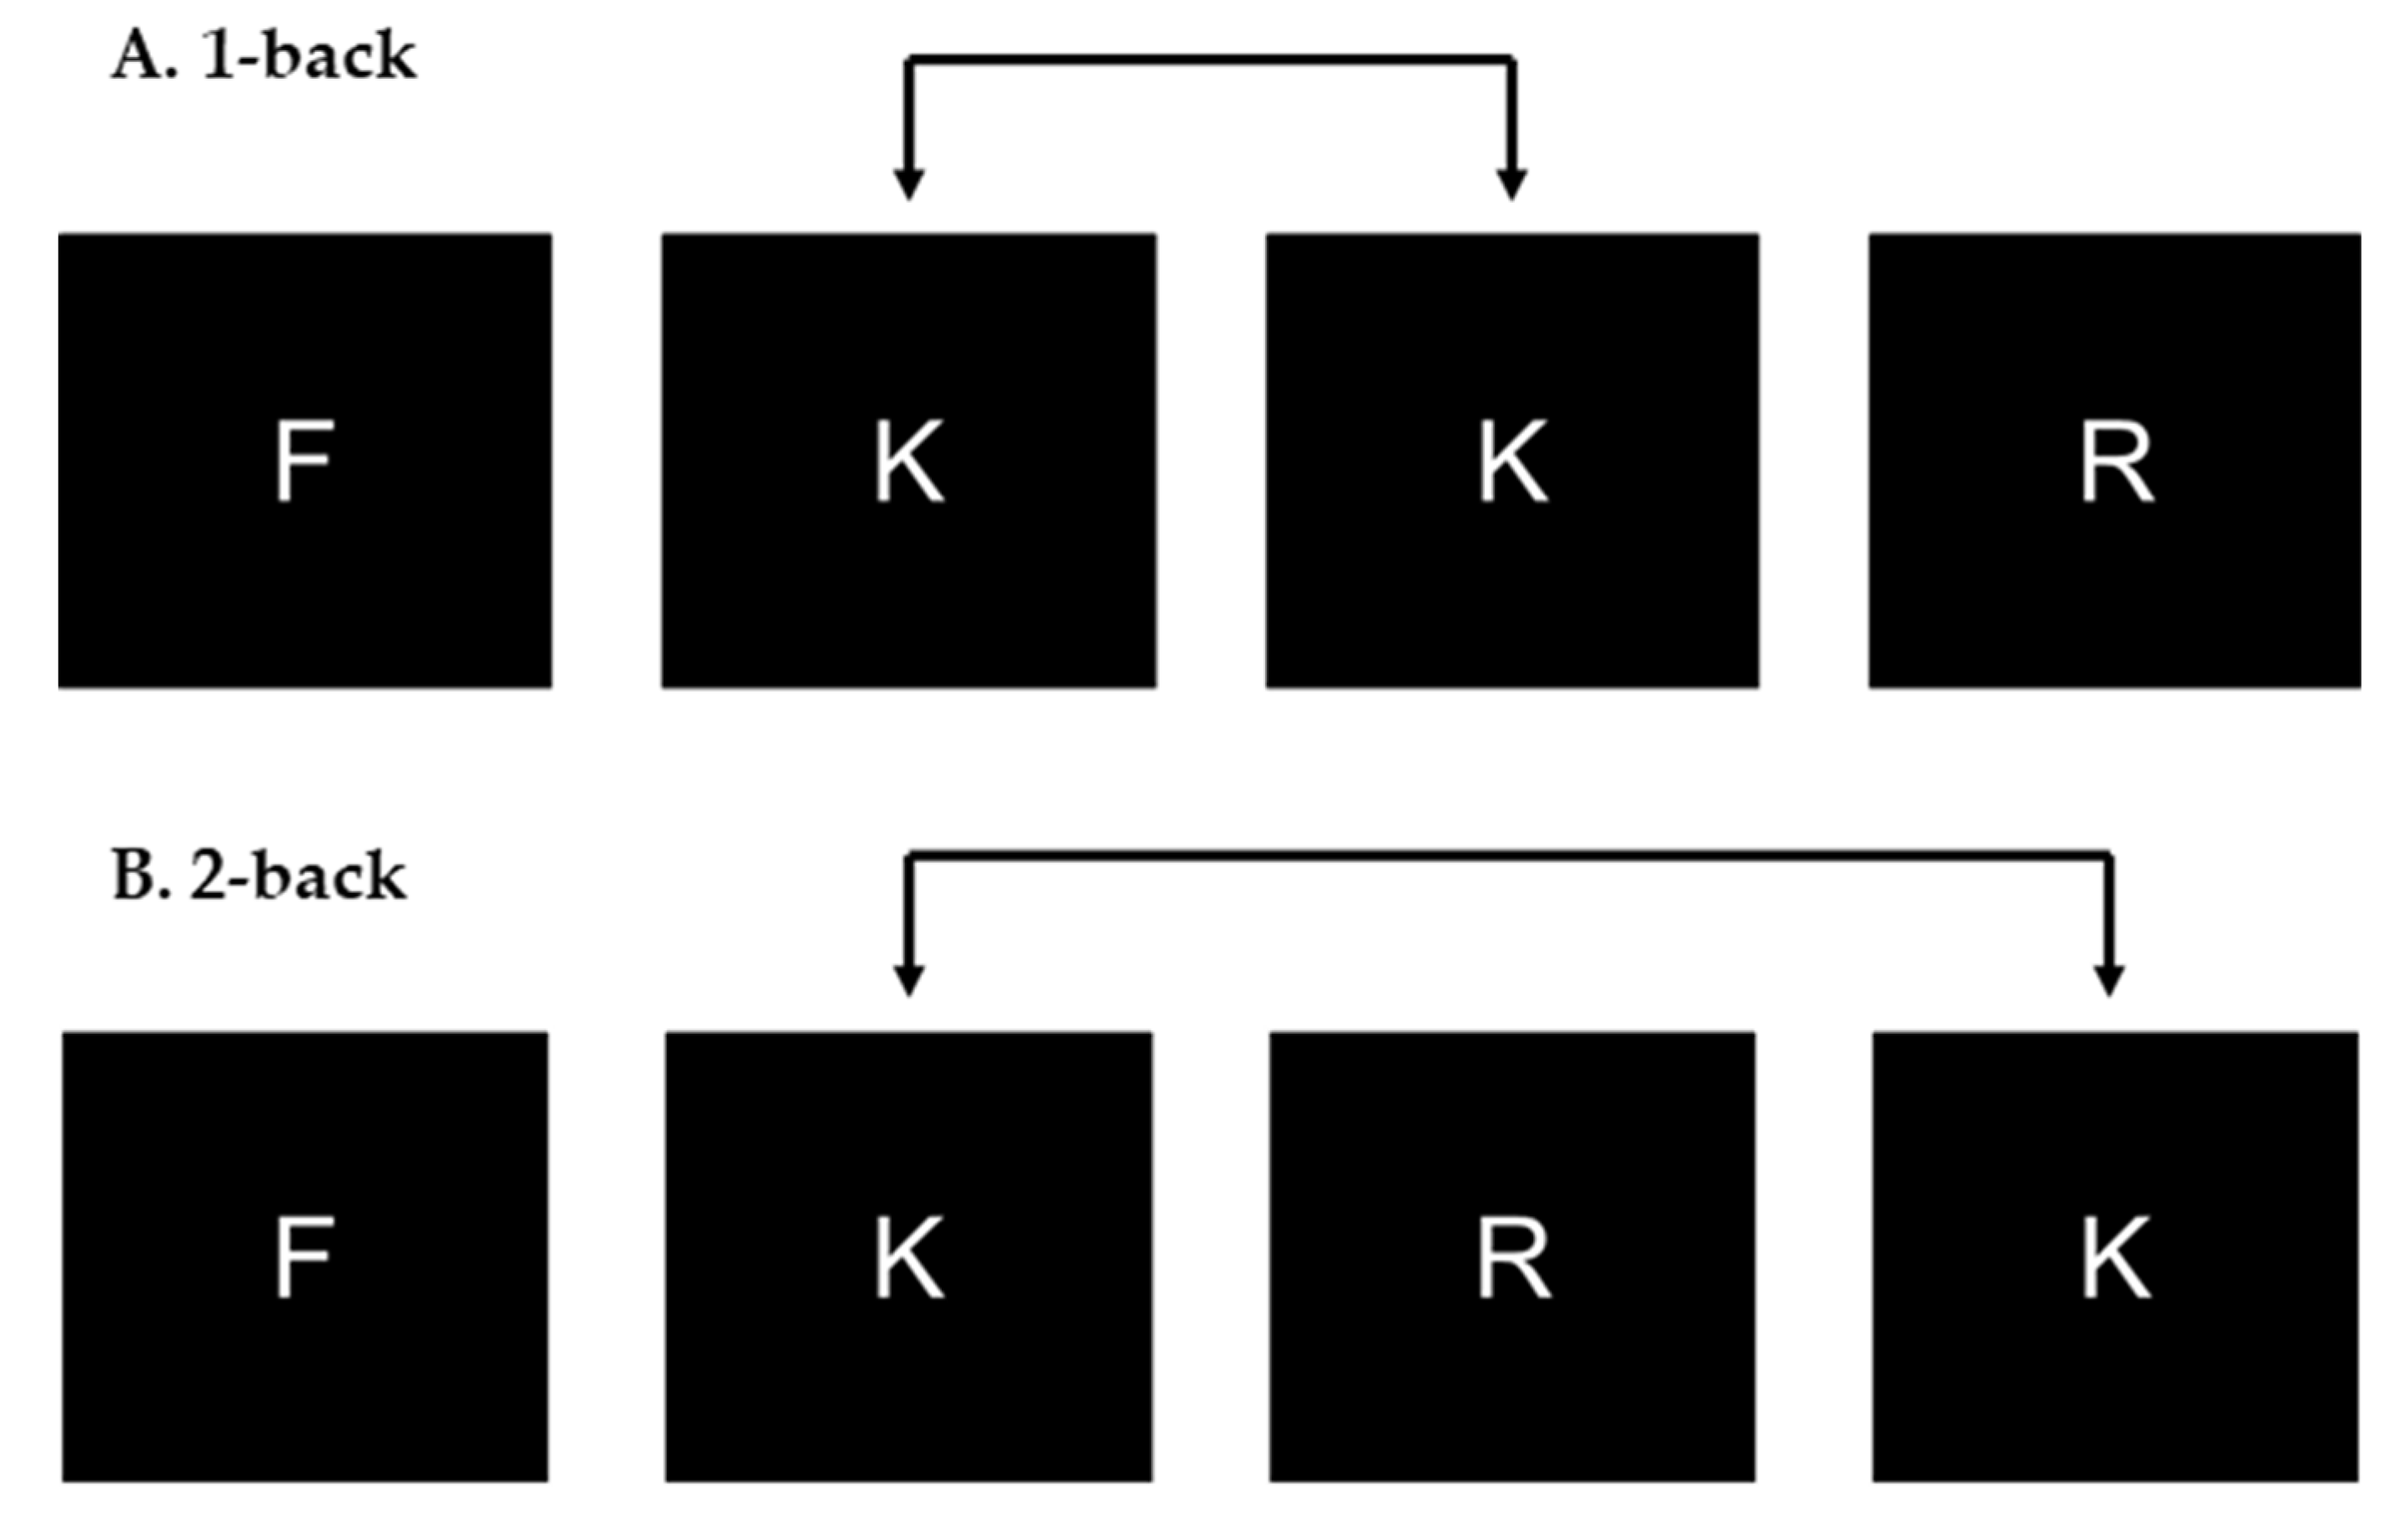
2.5. Cognitive Control
2.6. Lifestyle Habits
2.7. Statistical Analysis
3. Results
4. Discussion
5. Conclusions
Supplementary Materials
Author Contributions
Funding
Acknowledgments
Conflicts of Interest
References
- Romine, C.B.; Reynolds, C.R. A model of the development of frontal lobe functioning: Findings from a meta-analysis. Appl. Neuropsychol. 2005, 12, 190–201. [Google Scholar] [CrossRef] [PubMed]
- Dehart, G.B.; Sroufe, L.A.; Cooper, R.G. Child Development: Its Nature and Course; McGraw-Hill: New York, NY, USA, 2004. [Google Scholar]
- Carson, V.; Chaput, J.-P.; Janssen, I.; Tremblay, M.S. Health associations with meeting new 24-hour movement guidelines for Canadian children and youth. Prev. Med. 2017, 95, 7–13. [Google Scholar] [CrossRef] [PubMed]
- Cohen, B.; Evers, S.; Manske, S.; Bercovitz, K.; Edward, H.G. Smoking, physical activity and breakfast consumption among secondary school students in a southwestern Ontario community. Can. J. Public Health 2003, 94, 41–44. [Google Scholar] [CrossRef]
- Stea, T.H.; Torstveit, M.K. Association of lifestyle habits and academic achievement in Norwegian adolescents: A cross-sectional study. BMC Public Health 2014, 14, 829. [Google Scholar] [CrossRef] [PubMed] [Green Version]
- Walsh, J.J.; Barnes, J.D.; Cameron, J.D.; Goldfield, G.S.; Chaput, J.-P.; Gunnell, K.E.; Ledoux, A.-A.; Zemek, R.L.; Tremblay, M.S. Associations between 24 hour movement behaviours and global cognition in US children: A cross-sectional observational study. Lancet Child. Adolesc. Health 2018, 2, 783–791. [Google Scholar] [CrossRef]
- Ericsson, I.; Karlsson, M.K. Motor skills and school performance in children with daily physical education in school—A 9-year intervention study. Scand. J. Med. Sci. Sports 2014, 24, 273–278. [Google Scholar] [CrossRef]
- Hillman, C.H.; Pontifex, M.B.; Raine, L.B.; Castelli, D.M.; Hall, E.E.; Kramer, A.F. The effect of acute treadmill walking on cognitive control and academic achievement in preadolescent children. Neuroscience 2009, 159, 1044–1054. [Google Scholar] [CrossRef] [Green Version]
- Ruiz, J.R.; Ortega, F.B.; Castillo, R.; Martin-Matillas, M.; Kwak, L.; Vicente-Rodriguez, G.; Noriega, J.; Tercedor, P.; Sjostrom, M.; Moreno, L.A. Physical activity, fitness, weight status, and cognitive performance in adolescents. J. Pediatr. 2010, 157, 917–922. [Google Scholar] [CrossRef]
- Bangsbo, J.; Krustrup, P.; Duda, J.; Hillman, C.; Andersen, L.B.; Weiss, M.; Williams, C.A.; Lintunen, T.; Green, K.; Hansen, P.R.; et al. The Copenhagen Consensus Conference 2016: Children, youth, and physical activity in schools and during leisure time. Br. J. Sports Med. 2016, 50, 1177–1178. [Google Scholar] [CrossRef] [Green Version]
- Gibson, E.S.; Powles, A.C.; Thabane, L.; O’Brien, S.; Molnar, D.S.; Trajanovic, N.; Ogilvie, R.; Shapiro, C.; Yan, M.; Chilcott-Tanser, L. Sleepiness is serious in adolescence: Two surveys of 3235 Canadian students. BMC Public Health 2006, 6, 116. [Google Scholar] [CrossRef]
- Lazaratou, H.; Dikeos, D.G.; Anagnostopoulos, D.C.; Sbokou, O.; Soldatos, C.R. Sleep problems in adolescence. A study of senior high school students in Greece. Eur. Child. Adolesc. Psychiatry 2005, 14, 237–243. [Google Scholar] [CrossRef] [PubMed]
- Stroebele, N.; Mcnally, J.; Plog, A.; Siegfried, S.; Hill, J.O. The association of self-reported sleep, weight status, and academic performance in fifth-grade students. J. Sch. Health 2013, 83, 77–84. [Google Scholar] [CrossRef] [Green Version]
- Wolfson, A.R.; Carskadon, M.A. Sleep schedules and daytime functioning in adolescents. Child. Dev. 1998, 69, 875–887. [Google Scholar] [CrossRef] [PubMed]
- Fallone, G.; Acebo, C.; Arnedt, J.T.; Seifer, R.; Carskadon, M.A. Effects of acute sleep restriction on behavior, sustained attention, and response inhibition in children. Percept. Mot. Skills 2001, 93, 213–229. [Google Scholar] [CrossRef] [PubMed]
- Sadeh, A.; Gruber, R.; Raviv, A. The effects of sleep restriction and extension on school-age children: What a difference an hour makes. Child. Dev. 2003, 74, 444–455. [Google Scholar] [CrossRef]
- García-Hermoso, A.; Marina, R. Relationship of weight status, physical activity and screen time with academic achievement in adolescents. Obes. Res. Clin. Pract. 2017, 11, 44–50. [Google Scholar] [CrossRef]
- Sharif, I.; Sargent, J.D. Association between television, movie, and video game exposure and school performance. Pediatrics 2006, 118, e1061–e1070. [Google Scholar] [CrossRef] [Green Version]
- Yan, H.; Zhang, R.; Oniffrey, T.M.; Chen, G.; Wang, Y.; Wu, Y.; Zhang, X.; Wang, Q.; Ma, L.; Li, R.; et al. Associations among screen time and unhealthy behaviors, academic performance, and well-being in Chinese adolescents. Int. J. Environ. Res. Public Health 2017, 14, 596. [Google Scholar] [CrossRef] [Green Version]
- Anderson, D.R.; Subrahmanyam, K. Digital Screen media and cognitive development. Pediatrics 2017, 140, S57–S61. [Google Scholar] [CrossRef] [Green Version]
- Przybylski, A.K.; Mishkin, A.F. How the quantity and quality of electronic gaming relates to adolescents’ academic engagement and psychosocial adjustment. Psychol. Pop. Media Cult. 2016, 5, 145–156. [Google Scholar] [CrossRef]
- Green, C.S.; Bavelier, D. Action-video-game experience alters the spatial resolution of vision. Psychol. Sci. 2007, 18, 88–94. [Google Scholar] [CrossRef] [PubMed] [Green Version]
- Hartanto, A.; Toh, W.X.; Yang, H. Context counts: The different implications of weekday and weekend video gaming for academic performance in mathematics, reading, and science. Comput. Educ. 2018, 120, 51–63. [Google Scholar] [CrossRef]
- Drummond, A.; Sauer, J.D. Timesplitters: Playing video games before (but not after) school on weekdays is associated with poorer adolescent academic performance. A test of competing theoretical accounts. Comput. Educ. 2020, 144, 103704. [Google Scholar] [CrossRef]
- Barr, S.I.; Vatanparast, H.; Smith, J. Breakfast in Canada: Prevalence of consumption, contribution to nutrient and food group intakes, and variability across tertiles of daily diet quality. A study from the International Breakfast Research Initiative. Nutrients 2018, 10, 985. [Google Scholar] [CrossRef] [Green Version]
- Adolphus, K.; Lawton, C.L.; Champ, C.L.; Dye, L. The effects of breakfast and breakfast composition on cognition in children and adolescents: A systematic review. Adv. Nutr. 2016, 7, 590S–612S. [Google Scholar] [CrossRef]
- Lien, L. Is breakfast consumption related to mental distress and academic performance in adolescents? Public Health Nutr. 2007, 10, 422–428. [Google Scholar] [CrossRef] [Green Version]
- So, W.Y. Association between frequency of breakfast consumption and academic performance in healthy Korean adolescents. Iran. J. Public Health 2013, 42, 25–32. [Google Scholar]
- Edwards, J.U.; Mauch, L.; Winkelman, M.R. Relationship of nutrition and physical activity behaviors and fitness measures to academic performance for sixth graders in a midwest city school district. J. Sch. Health 2011, 81, 65–73. [Google Scholar] [CrossRef]
- Correa-Burrows, P.; Burrows, R.; Blanco, E.; Reyes, M.; Gahagan, S. Nutritional quality of diet and academic performance in Chilean students. Bull. World Health Organ. 2016, 94, 185–192. [Google Scholar] [CrossRef]
- Haapala, E.A.; Eloranta, A.M.; Venalainen, T.; Jalkanen, H.; Poikkeus, A.M.; Ahonen, T.; Lindi, V.; Lakka, T.A. Diet quality and academic achievement: A prospective study among primary school children. Eur. J. Nutr. 2017, 56, 2299–2308. [Google Scholar] [CrossRef]
- Pivik, R.T.; Tennal, K.B.; Chapman, S.D.; Gu, Y. Eating breakfast enhances the efficiency of neural networks engaged during mental arithmetic in school-aged children. Physiol. Behav. 2012, 106, 548–555. [Google Scholar] [CrossRef] [PubMed]
- Affinita, A.; Catalani, L.; Cecchetto, G.; De Lorenzo, G.; Dilillo, D.; Donegani, G.; Fransos, L.; Lucidi, F.; Mameli, C.; Manna, E.; et al. Breakfast: A multidisciplinary approach. Ital. J. Pediatr. 2013, 39, 44. [Google Scholar] [CrossRef] [PubMed] [Green Version]
- Gale, C.R.; Martyn, C.N.; Marriott, L.D.; Limond, J.; Crozier, S.; Inskip, H.M.; Godfrey, K.M.; Law, C.M.; Cooper, C.; Robinson, S.M. Dietary patterns in infancy and cognitive and neuropsychological function in childhood. J. Child. Psychol, Psychiatry 2009, 50, 816–823. [Google Scholar] [CrossRef] [PubMed] [Green Version]
- Best, J.R.; Miller, P.H.; Naglieri, J.A. Relations between executive function and academic achievement from ages 5 to 17 in a large, representative national sample. Learn. Individ. Differ. 2011, 21, 327–336. [Google Scholar] [CrossRef] [PubMed] [Green Version]
- Blair, C.; Razza, R.P. Relating effortful control, executive function, and false belief understanding to emerging math and literacy ability in kindergarten. Child. Dev. 2007, 78, 647–663. [Google Scholar] [CrossRef] [PubMed]
- St Clair-Thompson, H.L.; Gathercole, S.E. Executive functions and achievements in school: Shifting, updating, inhibition, and working memory. Q. J. Exp. Psychol. 2006, 59, 745–759. [Google Scholar] [CrossRef]
- Swanson, H.L.; Alloway, T.P. Working Memory, Learning, and Academic Achievement. In APA Educational Psychology Handbook, Volume 1: Theories, Constructs, and Critical Issues; American Psychological Association: Washington, DC, USA, 2012; pp. 327–366. [Google Scholar]
- Stiglic, N.; Viner, R.M. Effects of screentime on the health and well-being of children and adolescents: A systematic review of reviews. BMJ Open 2019, 9, e023191. [Google Scholar] [CrossRef] [Green Version]
- Edefonti, V.; Rosato, V.; Parpinel, M.; Nebbia, G.; Fiorica, L.; Fossali, E.; Ferraroni, M.; Decarli, A.; Agostoni, C. The effect of breakfast composition and energy contribution on cognitive and academic performance: A systematic review. Am. J. Clin. Nutr. 2014, 100, 626–656. [Google Scholar] [CrossRef] [Green Version]
- Faught, E.L.; Gleddie, D.; Storey, K.E.; Davison, C.M.; Veugelers, P.J. Healthy lifestyle behaviours are positively and independently associated with academic achievement: An analysis of self-reported data from a nationally representative sample of Canadian early adolescents. PLoS ONE 2017, 12, e0181938. [Google Scholar] [CrossRef]
- Faught, E.L.; Ekwaru, J.P.; Gleddie, D.; Storey, K.E.; Asbridge, M.; Veugelers, P.J. The combined impact of diet, physical activity, sleep and screen time on academic achievement: A prospective study of elementary school students in Nova Scotia, Canada. Int. J. Behav. Nutr. Phys. Act. 2017, 14, 29. [Google Scholar] [CrossRef] [Green Version]
- Bound, J.; Hershbein, B.; Long, B.T. Playing the admissions game: Student reactions to increasing college competition. J. Econ. Perspect. 2009, 23, 119–146. [Google Scholar] [CrossRef] [Green Version]
- Achenbach, T.M.; Rescorla, L.A. Manual for the ASEBA School-Age Forms & Profiles; University of Vermont, Research Center for Children, Youth, & Families: Burlington, VT, USA, 2001. [Google Scholar]
- Petersen, A.C.; Crockett, L.; Richards, M.; Boxer, A. A self-report measure of pubertal status: Reliability, validity, and initial norms. J. Youth Adolesc. 1988, 17, 117–133. [Google Scholar] [CrossRef] [PubMed]
- Hollingshead, A.B. Four Factor Index of Social Status; Unpublished manuscript; Yale University: New Haven, CT, USA, 1975. [Google Scholar]
- Eriksen, B.A.; Eriksen, C.W. Effects of noise letters upon the identification of a target letter in a nonsearch task. Percept. Psychophys. 1974, 16, 143–149. [Google Scholar] [CrossRef] [Green Version]
- Inquisit 4.0.9 [Computer software]; Millisecond Software: Seattle, WA, USA, 2015.
- Kirchner, W.K. Age differences in short-term retention of rapidly changing information. J. Exp. Psychol. 1958, 55, 352–358. [Google Scholar] [CrossRef] [PubMed]
- Mackworth, J.F. Paced memorizing in a continuous task. J. Exp. Psychol. 1959, 58, 206–211. [Google Scholar] [CrossRef]
- Stanislaw, H.; Todorov, N. Calculation of signal detection theory measures. Behav. Res. Meth. Instrum. Comput. 1999, 31, 137–149. [Google Scholar] [CrossRef] [Green Version]
- Voyer, D.; Voyer, S.D. Gender differences in scholastic achievement: A meta-analysis. Psychol. Bull. 2014, 140, 1174–1204. [Google Scholar] [CrossRef]
- Cohen, J.; Cohen, P. Applied Multiple Regression/Correlation Analysis for the Behavioral Sciences; Erlbaum: Hillsdale, NJ, USA, 1983. [Google Scholar]
- Kantomaa, M.T.; Stamatakis, E.; Kankaanpää, A.; Kajantie, E.; Taanila, A.; Tammelin, T. Associations of physical activity and sedentary behavior with adolescent academic achievement. J. Res. Adolesc. 2016, 26, 432–442. [Google Scholar] [CrossRef]
- Felez-Nobrega, M.; Hillman, C.H.; Cirera, E.; Puig-Ribera, A. The association of context-specific sitting time and physical activity intensity to working memory capacity and academic achievement in young adults. Eur. J. Public Health 2017, 27, 741–746. [Google Scholar] [CrossRef]
- Burns, R.D.; Fu, Y.; Brusseau, T.A.; Clements-Nolle, K.; Yang, W. Relationships among physical activity, sleep duration, diet, and academic achievement in a sample of adolescents. Prev. Med. Rep. 2018, 12, 71–74. [Google Scholar] [CrossRef]
- Parkes, A.; Sweeting, H.; Wight, D.; Henderson, M. Do television and electronic games predict children’s psychosocial adjustment? Longitudinal research using the UK Millennium Cohort Study. Arch. Dis. Child. 2013, 98, 341–348. [Google Scholar] [CrossRef] [PubMed] [Green Version]


| Variables | Female Students n = 116 | Male Students n = 71 |
|---|---|---|
| Students working (n (%) workers), year 1 | 18 (16.1) | 12 (17.4) |
| Students working (n (%) workers), year 3 | 35 (30.2) * | 10 (14.1) |
| Studying time (h/week), year 1 | 11.4 ± 8.4 (1–50) | 9.5 ± 7.3 (1–36) |
| Studying time (h/week), year 3 | 12.6 ± 9.7 (0–48) | 10.9 ± 9.9 (0–48) |
| Physical activity (h/week), year 1 | 6.2 ± 5.5 (0–30) | 6.7 ± 5.4 (0–30) |
| Physical activity (h/week), year 3 | 5.2 ± 5.1 † (0–30) | 6.7 ± 5.0 (0–22) |
| Number of meals/day, year 1 | 3.0 ± 0.6 (1–6) | 3.1 ± 0.5 (2–5) |
| Number of meals/day, year 3 | 3.0 ± 0.6 (1–5) | 3.3 ± 0.6 † (2–5) |
| Serving of fruits and vegetables/day, year 1 | 4.1 ± 1.6 (1–10) | 4.0 ± 1.8 (1–10) |
| Serving of fruits and vegetables/day, year 3 | 4.1 ± 1.6 (1–8) | 4.4 ± 2.3 † (0–10) |
| Breakfast consumers on weekdays (n (%)), year 1 | 96 (83.5) | 63 (88.7) |
| Breakfast consumers on weekdays (n (%)), year 3 | 91 (79.1) | 64 (90.1) |
| Breakfast consumers on weekend (n (%)), year 1 | 103 (89.6) | 66 (94.3) |
| Breakfast consumers on weekend (n (%)), year 3 | 101 (87.8) | 66 (93.0) |
| Variables | Female Students n = 116 | Male Students n = 71 | ||
|---|---|---|---|---|
| Weekdays | Weekend | Weekdays | Weekend | |
| Screen time (h/day) | ||||
| Television, year 1 | 1.6 ± 1.5 (0–7) | 2.8 ± 2.0 (0–10) | 1.2 ± 1.1 (0–6) | 2.6 ± 2.0 (0–8) |
| Television, year 3 | 1.2 ± 1.3 * (0–5) | 2.4 ± 1.9 † (0–8) | 0.9 ± 1.0 * (0–6) | 2.1 ± 1.8 * (0–8) |
| Computer, year 1 | 1.7 ± 1.5 (0–7) | 2.3 ± 2.2 (0–13) | 2.2 ± 1.9 (0–10) | 2.3 ± 2.2 (0–10) |
| Computer, year 3 | 1.6 ± 1.6 (0–6) | 2.8 ± 2.9 * (0–11) | 1.7 ± 1.7 (0–7) | 3.1 ± 2.6 * (0–14) |
| Video games, year 1 | 0.7 ± 1.5 (0–7) | 1.2 ± 1.9 (0–8) | 1.4 ± 1.8 (0–7) | 2.7 ± 2.2 (0–8) |
| Video games, year 3 | 0.2 ± 0.6 * (0–4) | 0.4 ± 1.0 * (0–6) | 0.7 ± 1.1 * (0–6) | 1.9 ± 1.8 * (0–8) |
| Cellphone, year1 | 1.1 ± 1.6 (0–9) | 1.6 ± 2.4 (0–10) | 0.9 ± 1.7 (0–10) | 1.1 ± 1.9 (0–8) |
| Cellphone, year 3 | 1.9 ± 2.6 (0–15) | 2.7 ± 3.1 * (0–14) | 1.4 ± 2.1 (0–10) | 2.0 ± 2.8 * (0–12) |
| Social media use, year 1 | 1.9 ± 1.8 (0–8) | 2.9 ± 2.9 (0–15) | 1.5 ± 1.6 (0–9) | 1.6 ± 1.9 (0–8) |
| Social media use, year 3 | 2.5 ± 2.9 * (0–15) | 3.6 ± 3.2 * (0–15) | 1.5 ± 1.9 (0–10) | 2.2 ± 2.3 * (0–12) |
| Variables | Female students n = 116 | Male students n = 71 | ||
|---|---|---|---|---|
| Weekdays | Weekend | Weekdays | Weekend | |
| Bedtime §, year 1 | 1.9 ± 0.9 (0–5) | 3.0 ± 1.3 (0–8) | 1.6 ± 0.9 (0–4) | 2.8 ± 1.2 (0–6) |
| Bedtime §, year 3 | 2.5 ± 1.0 * (0–5) | 3.4 ± 1.2 * (0–7) | 2.4 ± 1.0 * (0–5) | 3.5 ± 1.4 * (0–5) |
| Wake-up time (AM), year 1 | 6.3 ± 0.5 (5–7) | 9.2 ± 1.5 (6–13) | 6.2 ± 0.5 (5–7) | 8.8 ± 1.4 (6–12) |
| Wake-up time (AM), year 3 | 6.3 ± 0.6 (5–7) | 9.3 ± 1.5 (5–12) | 6.3 ± 0.5 * (5–7) | 9.0 ± 1.4 † (6–12) |
| Sleep duration (h), year 1 | 8.4 ± 0.9 (5–10) | 10.2 ± 1.5 (5–13) | 8.6 ± 0.9 (6–10) | 10.0 ± 1.3 (7–14) |
| Sleep duration (h), year 3 | 7.8 ± 1.1 * (4–10) | 10.0 ± 1.2 * (5–12) | 7.9 ± 1.0 * (5–10) | 9.5 ± 1.6 * (5–13) |
| Sleep onset latency (min), year1 | 24.7 ± 25.8 (0–180) | 18.3 ± 18.5 (0–120) | ||
| Sleep onset latency (min), year 3 | 24.5 ± 27.9 (0–180) | 17.6 ± 16.1 (0–90) | ||
| Female students | Male students | |||||||
|---|---|---|---|---|---|---|---|---|
| OA | SCI | MAT | LAN | OA | SCI | MAT | LAN | |
| Studying time | 0.00 | −0.10 | −0.02 | −0.01 | 0.29 * | 0.09 | 0.18 | 0.28 † |
| Physical activity | 0.00 | −0.12 | −0.05 | 0.10 | 0.08 | 0.07 | 0.09 | −0.05 |
| Number of meals/day | 0.11 | 0.11 | 0.15 | 0.17 | −0.21 § | 0.01 | −0.25 § | −0.15 § |
| Serving of fruits and vegetables/day | 0.06 | −0.06 | 0.08 | 0.03 | 0.25 | 0.13 | 0.24 | 0.17 |
| Screen usage | ||||||||
| Television WD | −0.34 ** | −0.19 | −0.36 ** | −0.37 ** | −0.01 § | −0.09 | −0.04 § | 0.01 § |
| Television WE | −0.33 ** | −0.16 | −0.32 ** | −0.29 * | −0.10 | −0.10 | −0.15 | −0.13 |
| Computer WD | −0.17 | −0.01 | −0.14 | −0.25 * | −0.01 | −0.10 | 0.04 | 0.01 |
| Computer WE | 0.07 | 0.08 | 0.04 | 0.06 | 0.16 | 0.13 | 0.20 | 0.03 |
| Video games WD | −0.17 | −0.17 | −0.16 | −0.23 † | −0.04 | −0.15 | 0.02 | −0.08 |
| Video games WE | −0.19 | −0.05 | −0.22 † | −0.25 * | −0.31 * | −0.27 † | −0.32 * | −0.17 |
| Cellphone WD | −0.26 * | −0.29 * | −0.35 ** | −0.36 ** | 0.22 § | 0.07 § | 0.20 § | 0.09 § |
| Cellphone WE | −0.33 ** | −0.25 * | −0.39 ** | −0.42 ** | 0.25 § | 0.24 § | 0.14 § | 0.16 § |
| Social media WD | −0.02 | 0.03 | −0.03 | −0.17 | 0.00 | −0.09 | 0.03 | −0.02 |
| Social media WE | −0.24 * | −0.19 | −0.21 | −0.37 ** | 0.03 | 0.03 | 0.00 | −0.03 § |
| Sleep habits | ||||||||
| Bedtime WD | 0.11 | 0.23 † | 0.01 | 0.22 | −0.08 | −0.05 | −0.11 | −0.19 § |
| Bedtime WE | −0.26 * | −0.17 | −0.25 * | −0.30 * | −0.08 | 0.04 | −0.12 | −0.04 § |
| Wake up time WD | 0.11 | 0.09 | 0.05 | 0.10 | 0.06 | 0.10 | 0.12 | 0.01 |
| Wake up time WE | 0.06 | 0.11 | 0.00 | −0.01 | −0.03 | −0.12 | −0.17 | 0.03 |
| Sleep duration WD | −0.05 | −0.18 | 0.01 | 0.04 | 0.11 | 0.10 | 0.17 | 0.20 |
| Sleep duration WE | 0.28 * | 0.26 * | 0.20 | 0.23 † | 0.04 | −0.15 § | −0.06 | 0.07 |
| Sleep onset latency | −0.22 † | −0.12 | −0.26 * | −0.22 † | −0.22 | −0.16 | −0.26 † | −0.24 |
| Dependent Variables | Independent Variables | β | Total r2 | p Value |
|---|---|---|---|---|
| ΔFlanker congruent MRT | Social media on WD at Y1 | 0.28 | 0.147 | 0.001 |
| Daily meals at Y1 | −0.29 | |||
| ΔFlanker incongruent MRT | Daily meals at Y1 | −0.24 | 0.099 | 0.012 |
| Social media on WD at Y1 | 0.22 | |||
| Δ1-back accuracy | Daily meals at Y1 | 0.39 | 0.210 | 0.000 |
| ΔTotal screen on WD | −0.24 | |||
| Δ2-back accuracy | ΔVideo games on WE | −0.32 | 0.100 | 0.007 |
| Δ2-back MRT | Social media on WD at Y1 | 0.41 | 0.206 | 0.000 |
| Daily meals at Y1 | −0.25 |
| Dependent Variables | Independent Variables | β | Total r2 | p Value |
|---|---|---|---|---|
| ΔOverall average | ΔDaily servings of F/V | 0.50 | 0.248 | 0.000 |
| ΔScience | Age | 0.60 | 0.392 | 0.000 |
| ΔStudying time | 0.24 | 0.059 | 0.009 | |
| ΔMathematics | Age | −0.26 | 0.069 | 0.027 |
| ΔBedtime on WD | −0.45 | 0.202 | 0.000 | |
| ΔLanguage | ΔBreakfast on WE | −0.25 | 0.064 | 0.059 |
© 2019 by the authors. Licensee MDPI, Basel, Switzerland. This article is an open access article distributed under the terms and conditions of the Creative Commons Attribution (CC BY) license (http://creativecommons.org/licenses/by/4.0/).
Share and Cite
Dubuc, M.-M.; Aubertin-Leheudre, M.; Karelis, A.D. Lifestyle Habits Predict Academic Performance in High School Students: The Adolescent Student Academic Performance Longitudinal Study (ASAP). Int. J. Environ. Res. Public Health 2020, 17, 243. https://0-doi-org.brum.beds.ac.uk/10.3390/ijerph17010243
Dubuc M-M, Aubertin-Leheudre M, Karelis AD. Lifestyle Habits Predict Academic Performance in High School Students: The Adolescent Student Academic Performance Longitudinal Study (ASAP). International Journal of Environmental Research and Public Health. 2020; 17(1):243. https://0-doi-org.brum.beds.ac.uk/10.3390/ijerph17010243
Chicago/Turabian StyleDubuc, Marie-Maude, Mylène Aubertin-Leheudre, and Antony D. Karelis. 2020. "Lifestyle Habits Predict Academic Performance in High School Students: The Adolescent Student Academic Performance Longitudinal Study (ASAP)" International Journal of Environmental Research and Public Health 17, no. 1: 243. https://0-doi-org.brum.beds.ac.uk/10.3390/ijerph17010243