Utility of Liver Function Tests and Fatty Liver Index to Categorize Metabolic Phenotypes in a Mediterranean Population

 ,
,
Abstract
:1. Introduction
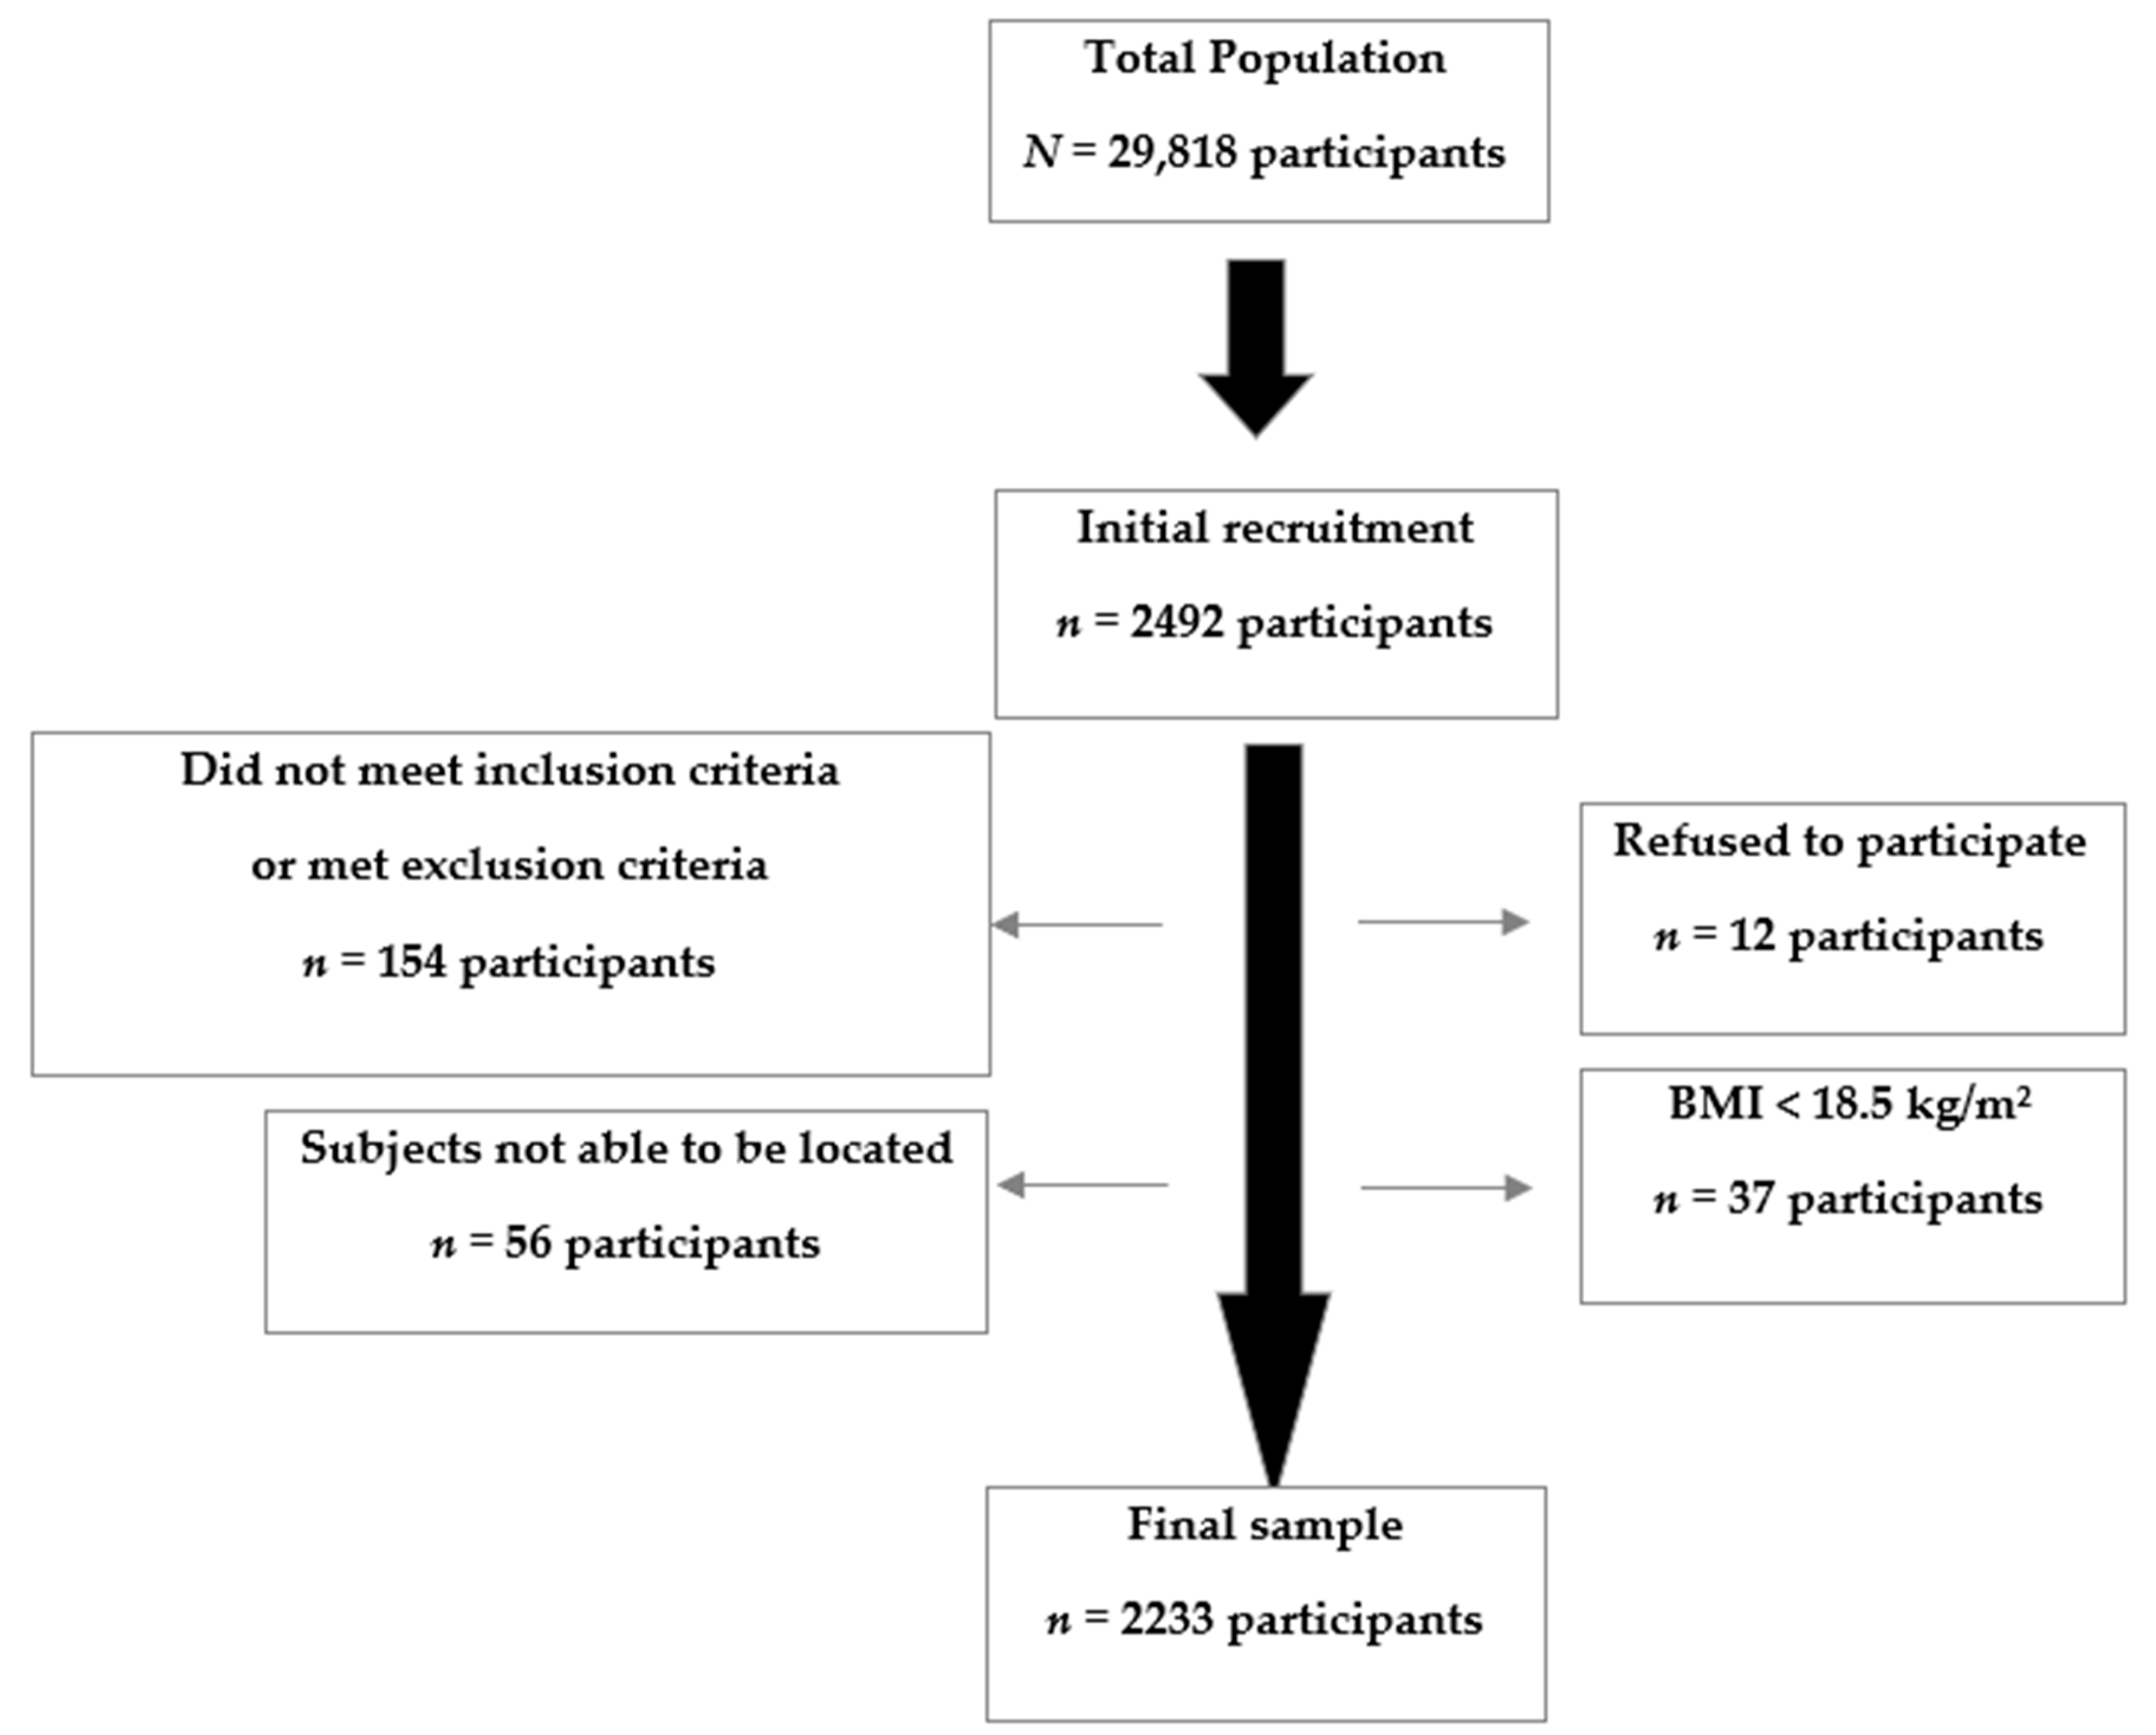
2. Methods
Statistical Analysis
3. Results
4. Discussion
Strengths and Limitations
5. Conclusions
Author Contributions
Funding
Acknowledgments
Conflicts of Interest
Abbreviations
| NAFLD | Non-alcoholic Fatty Liver Disease |
| LF% | Liver Fat percentage |
| LFT | Liver Function Tests |
| HDL cholesterol | High-density lipoprotein cholesterol |
| HbA1c | Glycated hemoglobin A1c |
| AST | Aspartate Aminotransferase |
| ALT | Alanine Transaminase |
| GGT | Gamma-glutamyltransferase |
| FLI | Fatty Liver Index |
| BMI | Body Mass Index |
| CI | confidence interval |
| OR | Odds Ratio |
| ROC | Receiver operating characteristic |
| AUC | Area Under the Curve |
| MetS | Metabolic Syndrome |
| MHNW | Metabolically Healthy Normal-Weight |
| MHOW | Metabolically Healthy Overweight |
| MHO | Metabolically Healthy Obese |
| MANW | Metabolically Abnormal Normal-Weight |
| MAOW | Metabolically Abnormal Overweight |
| MAO | Metabolically Abnormal Obese |
References
- Leoni, S.; Tovoli, F.; Napoli, L.; Serio, I.; Ferri, S.; Bolondi, L. Current guidelines for the management of non-alcoholic fatty liver disease: A systematic review with comparative analysis. World J. Gastroenterol. 2018, 24, 3361–3373. [Google Scholar] [CrossRef]
- Rinella, M.E. Nonalcoholic fatty liver disease. A systematic review. JAMA 2015, 313, 2263–2273. [Google Scholar] [CrossRef]
- Vernon, G.; Baranova, A.; Younossi, Z.M. Systematic review: The epidemiology and natural history of non-alcoholic fatty liver disease and non-alcoholic steatohepatitis in adults. Aliment. Pharmacol. Ther. 2011, 34, 274–285. [Google Scholar] [CrossRef]
- Bellentani, S.; Saccoccio, G.; Masutti, F.; Crocè, L.S.; Brandi, G.; Sasso, F.; Cristanini, G.; Tiribelli, C. Prevalence of and risk factors for hepatic steatosis in Northern Italy. Ann. Int. Med. 2000, 132, 112–117. [Google Scholar] [CrossRef]
- Targher, G.; Bertolini, L.; Padovani, R.; Rodella, S.; Tessari, R.; Zenari, L.; Day, C.; Arcaro, G. Prevalence of nonalcoholic fatty liver disease and its association with cardiovascular disease among type 2 diabetic patients. Diabetes Care 2007, 30, 1212–1218. [Google Scholar] [CrossRef] [Green Version]
- Neuschwander-Tetri, B.A.; Caldwell, S.H. Nonalcoholic steatohepatitis: Summary of an AASLD Single Topic Conference. Hepatology 2003, 37, 1202–1219. [Google Scholar] [CrossRef]
- Jung, C.H.; Rhee, E.J.; Kwon, H.; Chang, Y.; Ryu, S.; Lee, W.Y. Visceral-to-subcutaneous abdominal fat ratio is associated with nonalcoholic fatty liver disease and liver fibrosis. Endocrinol. Metab. 2020, 35, 165–176. [Google Scholar] [CrossRef] [PubMed]
- O’Connell, J.; Lynch, L.; Cawood, T.J.; Kwasnik, A.; Nolan, N.; Geoghegan, J.; McCormick, A.; O’Farrelly, C.; O’Shea, D. The relationship of omental and subcutaneous adipocyte size to metabolic disease in severe obesity. PLoS ONE 2010, 5, e9997. [Google Scholar] [CrossRef] [PubMed] [Green Version]
- Benedict, M.; Zhang, X. Non-alcoholic fatty liver disease: An expanded review. World J. Hepatol. 2017, 9, 715–732. [Google Scholar] [CrossRef] [PubMed]
- Bessone, F.; Razori, M.V.; Roma, M.G. Molecular pathways of nonalcoholic fatty liver disease development and progression. Cell. Mol. Life Sci. 2019, 76, 99–128. [Google Scholar] [CrossRef] [PubMed]
- Mirza, M.S. Obesity, Visceral Fat, and NAFLD: Querying the role of adipokines in the progression of nonalcoholic fatty liver disease. ISRN Gastroenterol. 2011, 2011, 592404. [Google Scholar] [CrossRef] [Green Version]
- Alves-Bezerra, M.; Cohen, D.E. Triglyceride metabolism in the liver. Compr Physiol. 2017, 8, 1–8. [Google Scholar] [PubMed]
- Ipsen, D.H.; Lykkesfeldt, J.; Tveden-Nyborg, P. Molecular mechanisms of hepatic lipid accumulation in non-alcoholic fatty liver disease. Cell. Mol. Life Sci. 2018, 75, 3313–3327. [Google Scholar] [CrossRef] [PubMed] [Green Version]
- Kotronen, A.; Peltonen, M.; Hakkarainen, A.; Sevastianova, K.; Bergholm, R.; Johansson, L.M.; Lundbom, N.; Rissanen, A.; Ridderstråle, M.; Groop, L.; et al. Prediction of non-alcoholic fatty liver disease and liver fat using metabolic and genetic factors. Gastroenterology 2009, 137, 865–872. [Google Scholar] [CrossRef] [PubMed]
- Italian Association for the Study of the Liver (AISF). AISF position paper on nonalcoholic fatty liver disease (NAFLD): Updates and future directions. Dig. Liver Dis. 2017, 49, 471–483. [Google Scholar] [CrossRef] [PubMed]
- Maev, I.V.; Samsonov, A.A.; Palgova, L.K.; Pavlov, C.S.; Shirokova, E.N.; Vovk, E.I.; Starostin, K.M. Effectiveness of phosphatidylcholine as adjunctive therapy in improving liver function tests in patients with non-alcoholic fatty liver disease and metabolic comorbidities: Real-life observational study from Russia. BMJ Open Gastroenterol. 2020, 7, e000368. [Google Scholar] [CrossRef] [Green Version]
- Sattar, N.; Forrest, E.; Preiss, D. Non-alcoholic fatty liver disease. BMJ 2014, 349, g4596. [Google Scholar] [CrossRef]
- McPherson, S.; Stewart, S.F.; Henderson, E.; Burt, A.D.; Day, C.P. Simple non-invasive fibrosis scoring systems can reliably exclude advanced fibrosis in patients with non-alcoholic fatty liver disease. Gut 2010, 59, 1265–1269. [Google Scholar] [CrossRef] [Green Version]
- Noureddin, M.; Loomba, R. Nonalcoholic fatty liver disease: Indications for liver biopsy and noninvasive biomarkers. Clin. Liver Dis. 2012, 1, 104–107. [Google Scholar] [CrossRef]
- Bedogni, G.; Bellentani, S.; Miglioli, L.; Masutti, F.; Passalacqua, M.; Castiglione, A.; Tiribelli, C. The Fatty Liver Index: A simple and accurate predictor of hepatic steatosis in the general population. BMC Gastroenterol. 2006, 6, 33. [Google Scholar] [CrossRef] [Green Version]
- Brandão, I.; Martins, M.J.; Monteiro, R. Metabolically healthy obesity-heterogeneity in definitions and unconventional factors. Metabolites 2020, 10, 48. [Google Scholar] [CrossRef] [PubMed] [Green Version]
- Appleton, S.L.; Seaborn, C.J.; Visvanathan, R.; Hill, C.L.; Gill, T.K.; Taylor, A.W.; Adams, R.J. North West Adelaide Health Study TeamNorth West Adelaide health study team diabetes and cardiovascular disease outcomes in the metabolically healthy obese phenotype: A cohort study. Diabetes Care 2013, 36, 2388–2394. [Google Scholar] [CrossRef] [PubMed] [Green Version]
- Kim, Y.; Chang, Y.; Cho, Y.K.; Ahn, J.; Shin, H.; Ryu, S. Metabolically healthy versus unhealthy obesity and risk of fibrosis progression in non-alcoholic fatty liver disease. Liver Int. 2019, 39, 1884–1894. [Google Scholar] [CrossRef] [PubMed]
- Cameron, A.J.; Zimmet, P.Z. The metabolic syndrome: Prevalence in worlwide populations. Endocrinol. Metab. Clin. N Am. 2004, 33, 351–375. [Google Scholar] [CrossRef] [PubMed]
- Alberti, K.G.; Eckel, R.H.; Grundy, S.M.; Zimmet, P.Z.; Cleeman, J.I.; Donato, K.A.; Fruchart, J.C.; James, W.P.; Loria, C.M.; Smith, S.C., Jr.; et al. Harmonizing the metabolic syndrome: A joint interim statement of the International Diabetes Federation Task Force on Epidemiology and Prevention; National Heart, Lung, and Blood Institute; American Heart Association; World Heart Federation; International Atherosclerosis Society; and International Association for the Study of Obesity. Circulation 2009, 120, 1640–1645. [Google Scholar]
- American Diabetes Association. Standards of medical care in diabetes-2014. Diabetes Care 2014, 37 (Suppl. 1), S14–S80. [Google Scholar] [CrossRef] [Green Version]
- Cao, R.; López-de-Ullibarri, I. ROC Curves for the statistical analysis of microarray data. Methods Mol. Biol. 2019, 1986, 245–253. [Google Scholar]
- Ke, B.S.; Chiang, A.J.; Chang, Y.I. Influence analysis for the area under the receiver operating characteristic curve. J. Biopharm. Stat. 2018, 28, 722–734. [Google Scholar] [CrossRef]
- Zelber-Sagi, S.; Webb, M.; Assy, N.; Blendis, L.; Yeshua, H.; Leshno, M.; Ratziu, V.; Halpern, Z.; Oren, R.; Santo, E. Comparison of fatty liver index with noninvasive methods for steatosis detection and quantification. World J. Gastroenterol. 2013, 19, 57–64. [Google Scholar] [CrossRef]
- Huang, X.; Xu, M.; Chen, Y.; Peng, K.; Huang, Y.; Wang, P.; Ding, L.; Lin, L.; Xu, Y.; Chen, Y.; et al. Validation of the fatty liver index for nonalcoholic fatty liver disease in middle-aged and elderly Chinese. Medicine 2015, 94, e1682. [Google Scholar] [CrossRef]
- Baratta, F.; Pastori, D.; Polimeni, L.; Bucci, T.; Ceci, F.; Calabrese, C.; Ernesti, I.; Pannitteri, G.; Violi, F.; Angelico, F.; et al. Adherence to mediterranean diet and non-alcoholic fatty liver disease: Effect on insulin resistance. Am. J. Gastroenterol. 2017, 112, 1832–1839. [Google Scholar] [CrossRef] [PubMed]
- Carpino, G.; Pastori, D.; Baratta, F.; Overi, D.; Labbadia, G.; Polimeni, L.; Di Costanzo, A.; Pannitteri, G.; Carnevale, R.; Del Ben, M.; et al. PNPLA3 variant and portal/periportal histological pattern in patients with biopsy-proven non-alcoholic fatty liver disease: A possible role for oxidative stress. Sci. Rep. 2017, 7, 15756. [Google Scholar] [CrossRef]
- Di Costanzo, A.; D’Erasmo, L.; Polimeni, L.; Baratta, F.; Coletta, P.; Di Martino, M.; Loffredo, L.; Perri, L.; Ceci, F.; Montali, A.; et al. Non-alcoholic fatty liver disease and subclinical atherosclerosis: A comparison of metabolically-versus genetically-driven excess fat hepatic storage. Atherosclerosis 2017, 257, 232–239. [Google Scholar] [CrossRef] [PubMed]
- Jansen-Chaparro, S.; Mancera, J.; Cuende, J.I.; Villalobos, A.; Baca, A.J.; Lopez-Carmona, M.D.; Bernal-Lopez, M.R.; Tinahones, F.J.; Gomez-Huelgas, R. Metabolic syndrome and vascular risk estimation in a Mediterranean non-diabetic population without cardiovascular disease. Eur. J. Int. Med. 2012, 23, 558–563. [Google Scholar] [CrossRef] [PubMed]
- Samuel, V.T.; Shulman, G.I. Non-alcoholic fatty liver disease as a nexus of metabolic and hepatic diseases. Cell Metab. 2018, 27, 22–41. [Google Scholar] [CrossRef] [Green Version]
- Zhang, H.; Ma, Z.; Pan, L.; Xu, Y.; Shao, J.; Huang, Z.; Chen, Z.; Sun, Q.; Liu, C.; Lin, M.; et al. Hepatic fat content is a determinant of metabolic phenotypes and increased carotid intima-media thickness in obese adults. Sci. Rep. 2016, 6, 21894. [Google Scholar] [CrossRef]
- Chen, Z.; Han, C.K.; Pan, L.L.; Zhang, H.J.; Ma, Z.M.; Huang, Z.F.; Chen, S.; Zhuang, X.J.; Li, Z.B.; Li, X.Y.; et al. Serum alanine aminotransferase independently correlates with intrahepatic triglyceride contents in obese subjects. Dig. Dis. Sci. 2014, 59, 2470–2476. [Google Scholar] [CrossRef]
- Stefan, N.; Kantartzis, K.; Machann, J.; Schick, F.; Thamer, C.; Rittig, K.; Balletshofer, B.; Machicao, F.; Fritsche, A.; Häring, H.U. Identification and characterization of metabolically benign obesity in humans. Arch Int. Med. 2008, 168, 1609–1616. [Google Scholar] [CrossRef]
- Camhi, S.M.; Katzmarzyk, P.T. Differences in body composition between metabolically healthy obese and metabolically abnormal obese adults. Int. J. Obes. 2014, 38, 1142–1145. [Google Scholar] [CrossRef] [Green Version]
- Goossens, G.H. The metabolic phenotype in obesity: Fat mass, body fat distribution, and adipose tissue function. Obes. Facts. 2017, 10, 207–215. [Google Scholar] [CrossRef]
- Lu, H.; Liu, H.; Hu, F.; Zou, L.; Luo, S.; Sun, L. Independent association between nonalcoholic fatty liver disease and cardiovascular disease: A systematic review and meta-analysis. Int. J. Endocrinol 2013, 2013, 124958. [Google Scholar] [CrossRef]
- Messier, V.; Karelis, A.D.; Robillard, M.E.; Bellefeuille, P.; Brochu, M.; Lavoie, J.M.; Rabasa-Lhoret, R. Metabolically healthy but obese individuals: Relationship with hepatic enzymes. Metabolism 2010, 59, 20–24. [Google Scholar] [CrossRef] [PubMed]
- Pajunen, P.; Kotronen, A.; Korpi-Hyövälti, E.; Keinänen-Kiukaanniemi, S.; Oksa, H.; Niskanen, L.; Saaristo, T.; Saltevo, J.T.; Sundvall, J.; Vanhala, M.; et al. Metabolically healthy and unhealthy obesity phenotypes in the general population: The FIN-D2D Survey. BMC Public Health 2011, 11, 754. [Google Scholar] [CrossRef] [PubMed]
- Du, T.; Yu, X.; Yuan, G.; Zhang, J.; Sun, X. Combined influence of nonalcoholic fatty liver and body size phenotypes on diabetes risk. Cardiovasc. Diabetol. 2015, 14, 144. [Google Scholar] [CrossRef] [PubMed] [Green Version]
- Chait, A.; den Hartigh, L.J. Adipose tissue distribution, inflammation and its metabolic consequences, including diabetes and cardiovascular disease. Front. Cardiovasc. Med. 2020, 7, 22. [Google Scholar] [CrossRef] [PubMed] [Green Version]
- Plourde, G.; Karelis, A.D. Current issues in the identification and treatment of metabolically healthy but obese individuals. Nutr. Metab. Cardiovasc. Dis. 2014, 24, 455–459. [Google Scholar] [CrossRef]
- Gomez-Huelgas, R.; Narankiewicz, D.; Villalobos, A.; Wärnberg, J.; Mancera-Romero, J.; Cuesta, A.L.; Tinahones, F.J.; Bernal-Lopez, M.R. Prevalence of metabolically discordant phenotypes in a mediterranean population-The IMAP study. Endocr. Pract. 2013, 19, 758–768. [Google Scholar] [CrossRef]
- Bozeman, S.R.; Hoaglin, D.C.; Burton, T.M.; Pashos, C.L.; Ben-Joseph, R.H.; Hollenbeak, C.S. Predicting waist circumference from body mass index. BMC Med. Res. Methodol. 2012, 12, 115. [Google Scholar] [CrossRef] [Green Version]
- Calori, G.; Lattuada, G.; Piemonti, L.; Garancini, M.P.; Ragogna, F.; Villa, M.; Mannino, S.; Crosignani, P.; Bosi, E.; Luzi, L.; et al. Prevalence, metabolic features, and prognosis of metabolically healthy obese Italian individuals: The Cremona Study. Diabetes Care 2011, 34, 210–215. [Google Scholar] [CrossRef] [Green Version]
- Hernaez, R.; Lazo, M.; Bonekamp, S.; Kamel, I.; Brancati, F.L.; Guallar, E.; Clark, J.M. Diagnostic accuracy and reliability of ultrasonography for the detection of fatty liver: A meta-analysis. Hepatology 2011, 54, 1082–1090. [Google Scholar] [CrossRef] [Green Version]
- Sattar, N.; McConnachie, A.; Ford, I.; Gaw, A.; Cleland, S.J.; Forouhi, N.G.; McFarlane, P.; Shepherd, J.; Cobbe, S.; Packard, C. Serial metabolic measurements and conversion to type 2 diabetes in the west of Scotland coronary prevention study: Specific elevations in alanine aminotransferase and triglycerides suggest hepatic fat accumulation as a potential contributing factor. Diabetes 2007, 56, 984–991. [Google Scholar] [CrossRef] [PubMed] [Green Version]
- Cuthbertson, D.J.; Weickert, M.O.; Lythgoe, D.; Sprung, V.S.; Dobson, R.; Shoajee-Moradie, F.; Umpleby, M.; Pfeiffer, A.F.; Thomas, E.L.; Bell, J.D.; et al. External validation of the fatty liver index and lipid accumulation product indices, using 1H-magnetic resonance spectroscopy, to identify hepatic steatosis in healthy controls and obese, insulin-resistant individuals. Eur. J. Endocrinol. 2014, 171, 561–569. [Google Scholar] [CrossRef] [PubMed]


| Total | Metabolically Healthy | Metabolically Abnormal | |||||
|---|---|---|---|---|---|---|---|
| MHNW | MHOW | MHO | MANW | MAOW | MAO | ||
| N (%) | 2233 (100) | 643 (28.8) | 437 (19.6) | 145 (6.5) | 198 (8.8) | 435 (19.5) | 375 (16.8) |
| General Characteristics | |||||||
| Age (years) | 43.9 ± 15.6 | 34.7 ± 10.8 | 40.3 ± 13.6 | 46.3 ± 15.8 | 43.6 ± 16.1 * | 51.5 ± 15.0 * | 54.4 ± 14.3 * |
| Sex (male/female) (%) | 50.2/49.8 | 34.5/65.5 | 57.2/42.8 | 40.0/60.0 | 59.1/40.9 * | 64.8/35.2 | 50.9/49.1 * |
| Waist circumference (cm) | 90.6 ± 13.5 | 78.3 ± 7.5 | 83.4 ± 8.3 | 102.8 ± 9.8 | 84.7 ± 8.5 * | 94.3 ± 8.8 * | 107.1 ± 10.7 * |
| Weight (kg) | 74.0 ± 15.1 | 61.4 ± 8.4 | 75.8 ± 10.1 | 89.4 ± 13.5 | 64.4 ± 8.5 ** | 75.4 ± 10.3 | 91.2 ± 13.2 |
| BMI (kg/m2) | 27.1 ± 5.1 | 22.3 ± 1.8 | 27.1 ± 1.4 | 33.7 ± 3.9 | 23.0 ± 1.6 * | 27.4 ± 1.4 | 34.4 ± 4.0 † |
| Systolic blood pressure (mmHg) | 126 ± 16 | 116 ± 12.9 | 122 ± 14 | 127 ± 16 | 128 ± 13 * | 134 ± 15 * | 135 ± 15 * |
| Diastolic blood pressure (mmHg) | 75 ± 10 | 69 ± 9 | 73 ± 10 | 76 ± 9 | 74 ± 9 * | 79 ± 10 * | 80 ± 10 ** |
| Median-high/low educational level (%) | 42.3/57.7 | 61.1/38.9 | 46.5/53.5 | 31.7/68.3 | 44.4/55.6 * | 28.7/71.3 * | 23.7/76.3 * |
| Sedentary lifestyle (%) | 76.5 | 77.8 | 72.1 | 82.1 | 70.7 * | 76.6 | 80.5 * |
| Smoking (%) | 27.6 | 29.4 | 24.3 | 25.5 | 36.9 * | 32.0 † | 19.2 * |
| Analytical parameters | |||||||
| Glucose (mg/dL) | 93.7 ± 26.1 | 84.3 ± 7.7 | 85.9 ± 8.6 | 88.0 ± 7.3 | 97.1 ± 33.7 * | 104.9 ± 36.5 * | 106.1 ± 29.3 * |
| HbA1c (%) | 5.7 ± 0.8 | 5.3 ± 0.3 | 5.4 ± 0.3 | 5.4 ± 0.4 | 6.0 ± 1.1 * | 6.0 ±1.1 * | 6.1 ± 0.8 * |
| Creatinine (mg/dL) | 0.8 ± 0.2 | 0.7 ± 0.2 | 0.8 ± 0.2 | 0.7 ± 0.2 | 0.8 ± 0.2 ** | 0.9 ± 0.3 † | 0.8 ± 0.2 * |
| Uric acid (mg/dL) | 4.7 ± 1.4 | 4.0 ± 1.0 | 4.7 ± 1.3 | 4.9 ± 1.2 | 4.5 ± 1.2 * | 5.0 ± 1.5 ** | 5.5 ± 1.5 * |
| Total cholesterol (mg/dL) | 199.7 ± 40.7 | 188.6 ± 36.9 | 194.2 ± 39.1 | 202.5 ± 39.6 | 199.8 ± 42.5 ** | 211.5 ± 42.6 * | 210.5 ± 39.4 |
| LDL cholesterol (mg/dL) | 124.9 ± 34.5 | 112.1 ± 31.5 | 121.0 ± 34.2 | 125.4 ± 34.3 | 131.0 ± 34.5 * | 137.0 ± 34.0 * | 133.7 ± 32.2 |
| HDL cholesterol (mg/dL) | 53.3 ± 13.6 | 59.9 ± 12.5 | 55.7 ± 11.2 | 56.7 ± 12.1 | 47.4 ± 12.9 * | 47.9 ± 13.5 * | 47.3 ± 12.9 * |
| Triglycerides (mg/dL) | 89 (62–132) | 66 (48–92) | 76 (57–102) | 89 (69–120) | 107 (76–160) * | 122 (84–178) * | 133 (91–187) * |
| AST (U/L) | 23.6 ± 13.0 | 23.2 ± 13.2 | 23.6 ± 13.7 | 25.2 ± 16.1 | 24.2 ± 12.7 | 24.1 ± 12.7 | 22.5 ± 10.6 |
| ALT (U/L) | 41.3 ± 17.2 | 41.3 ± 16.9 | 40.8 ± 17.4 | 41.7 ± 15.6 | 39.7 ± 14.7 | 42.9 ± 18.0 | 40.4 ± 18.2 |
| GGT (U/L) | 33.6 ± 29.4 | 34.7 ± 39.4 | 32.7 ± 22.0 | 33.3 ± 24.0 | 30.7 ± 21.2 | 35.1 ± 26.2 | 32.8 ± 25.6 |
| Comorbilities an treatments | |||||||
| Microalbuminuria (%) | 6.4 | 5.6 | 6.9 | 4.6 | 7.7 ** | 5.0 | 8.6 * |
| Prior type 2 diabetes diagnosis (%) | 5.6 | 0 | 0 | 0 | 7.6 | 10.1 | 17.6 |
| Type 2 diabetes (%) | 9.0 | 0 | 0 | 0 | 11.1 | 19.1 | 25.3 |
| Fatty Liver Index (FLI) | 41.1 ± 28.6 | 13.5 ± 10.0 | 34.6 ± 16.9 | 70.4 ± 17.2 | 25.9 ± 15.7 * | 51.5 ± 19.5 * | 80.3 ± 15.2 * |
| Antihypertensive treatment (%) | 15.8 | 1.1 | 8.0 | 15.9 | 15.2 * | 23.7 * | 41.3 * |
| Lipid-lowering agents (%) | 8.7 | 1.6 | 4.1 | 7.6 | 8.1 | 14.0 * | 21.1 * |
| Total Population | FLI < 30 | p | FLI ≥ 60 | p |
|---|---|---|---|---|
| Age | 0.94 (0.93–0.94) | <0.001 | 1.05 (1.04–1.06) | <0.001 |
| Sex (F vs. M) | 4.01 (3.13–5.01) | <0.001 | 0.45 (0.37–0.56) | <0.001 |
| Smoking (Y vs. N) | 1.06 (0.85–1.32) | 0.58 | 1.02 (0.81–1.28) | 0.86 |
| Sedentary lifestyle (Y vs. N) | 0.62 (0.50–0.79) | <0.001 | 1.45 (1.13–1.86) | 0.003 |
| Low education level (Y vs. N) | 0.61 (0.49–0.75) | <0.001 | 1.62 (1.28–2.05) | <0.001 |
| Metabolically Abnormal Phenotypes | ||||
| Age | 0.96 (0.95-0.98) | <0.001 | 1.03 (1.02-1.04) | <0.001 |
| Sex (F vs. M) | 2.55 (1.80–3.60) | <0.001 | 0.60 (0.45–0.78) | <0.001 |
| Smoking (Y vs. N) | 1.19 (0.84–1.70) | 0.33 | 0.81 (0.60–1.08) | 0.16 |
| Sedentary lifestyle (Y vs. N) | 0.49 (0.34–0.70) | <0.001 | 1.58 (1.16–2.15) | 0.004 |
| Low education level (Y vs. N) | 0.64 (0.45–0.93) | 0.02 | 1.50 (1.10–2.05) | 0.01 |
| FLI ≥ 60 (Y/N) | ||
|---|---|---|
| OR (95% CI) | p | |
| MANW vs MHNW | 3.63 (0.65–20.14) | 0.14 |
| MAOW vs MHOW | 3.07 (1.97–4.76) | <0.001 |
| MAO vs MHO | 1.95 (1.08–3.50) | 0.03 |
© 2020 by the authors. Licensee MDPI, Basel, Switzerland. This article is an open access article distributed under the terms and conditions of the Creative Commons Attribution (CC BY) license (http://creativecommons.org/licenses/by/4.0/).
Share and Cite
Narankiewicz, D.; Ruiz-Nava, J.; Buonaiuto, V.; Ruiz-Moreno, M.I.; López-Carmona, M.D.; Pérez-Belmonte, L.M.; Gómez-Huelgas, R.; Bernal-López, M.R. Utility of Liver Function Tests and Fatty Liver Index to Categorize Metabolic Phenotypes in a Mediterranean Population. Int. J. Environ. Res. Public Health 2020, 17, 3518. https://0-doi-org.brum.beds.ac.uk/10.3390/ijerph17103518
Narankiewicz D, Ruiz-Nava J, Buonaiuto V, Ruiz-Moreno MI, López-Carmona MD, Pérez-Belmonte LM, Gómez-Huelgas R, Bernal-López MR. Utility of Liver Function Tests and Fatty Liver Index to Categorize Metabolic Phenotypes in a Mediterranean Population. International Journal of Environmental Research and Public Health. 2020; 17(10):3518. https://0-doi-org.brum.beds.ac.uk/10.3390/ijerph17103518
Chicago/Turabian StyleNarankiewicz, Dariusz, Josefina Ruiz-Nava, Veronica Buonaiuto, María Isabel Ruiz-Moreno, María Dolores López-Carmona, Luis Miguel Pérez-Belmonte, Ricardo Gómez-Huelgas, and María Rosa Bernal-López. 2020. "Utility of Liver Function Tests and Fatty Liver Index to Categorize Metabolic Phenotypes in a Mediterranean Population" International Journal of Environmental Research and Public Health 17, no. 10: 3518. https://0-doi-org.brum.beds.ac.uk/10.3390/ijerph17103518