Foot Health Status Questionnaire (FHSQ) in Spanish People with Type 2 Diabetes Mellitus: Preliminary Values Study

 , , , , and
Abstract
:1. Introduction
2. Materials and Methods
2.1. Research Design
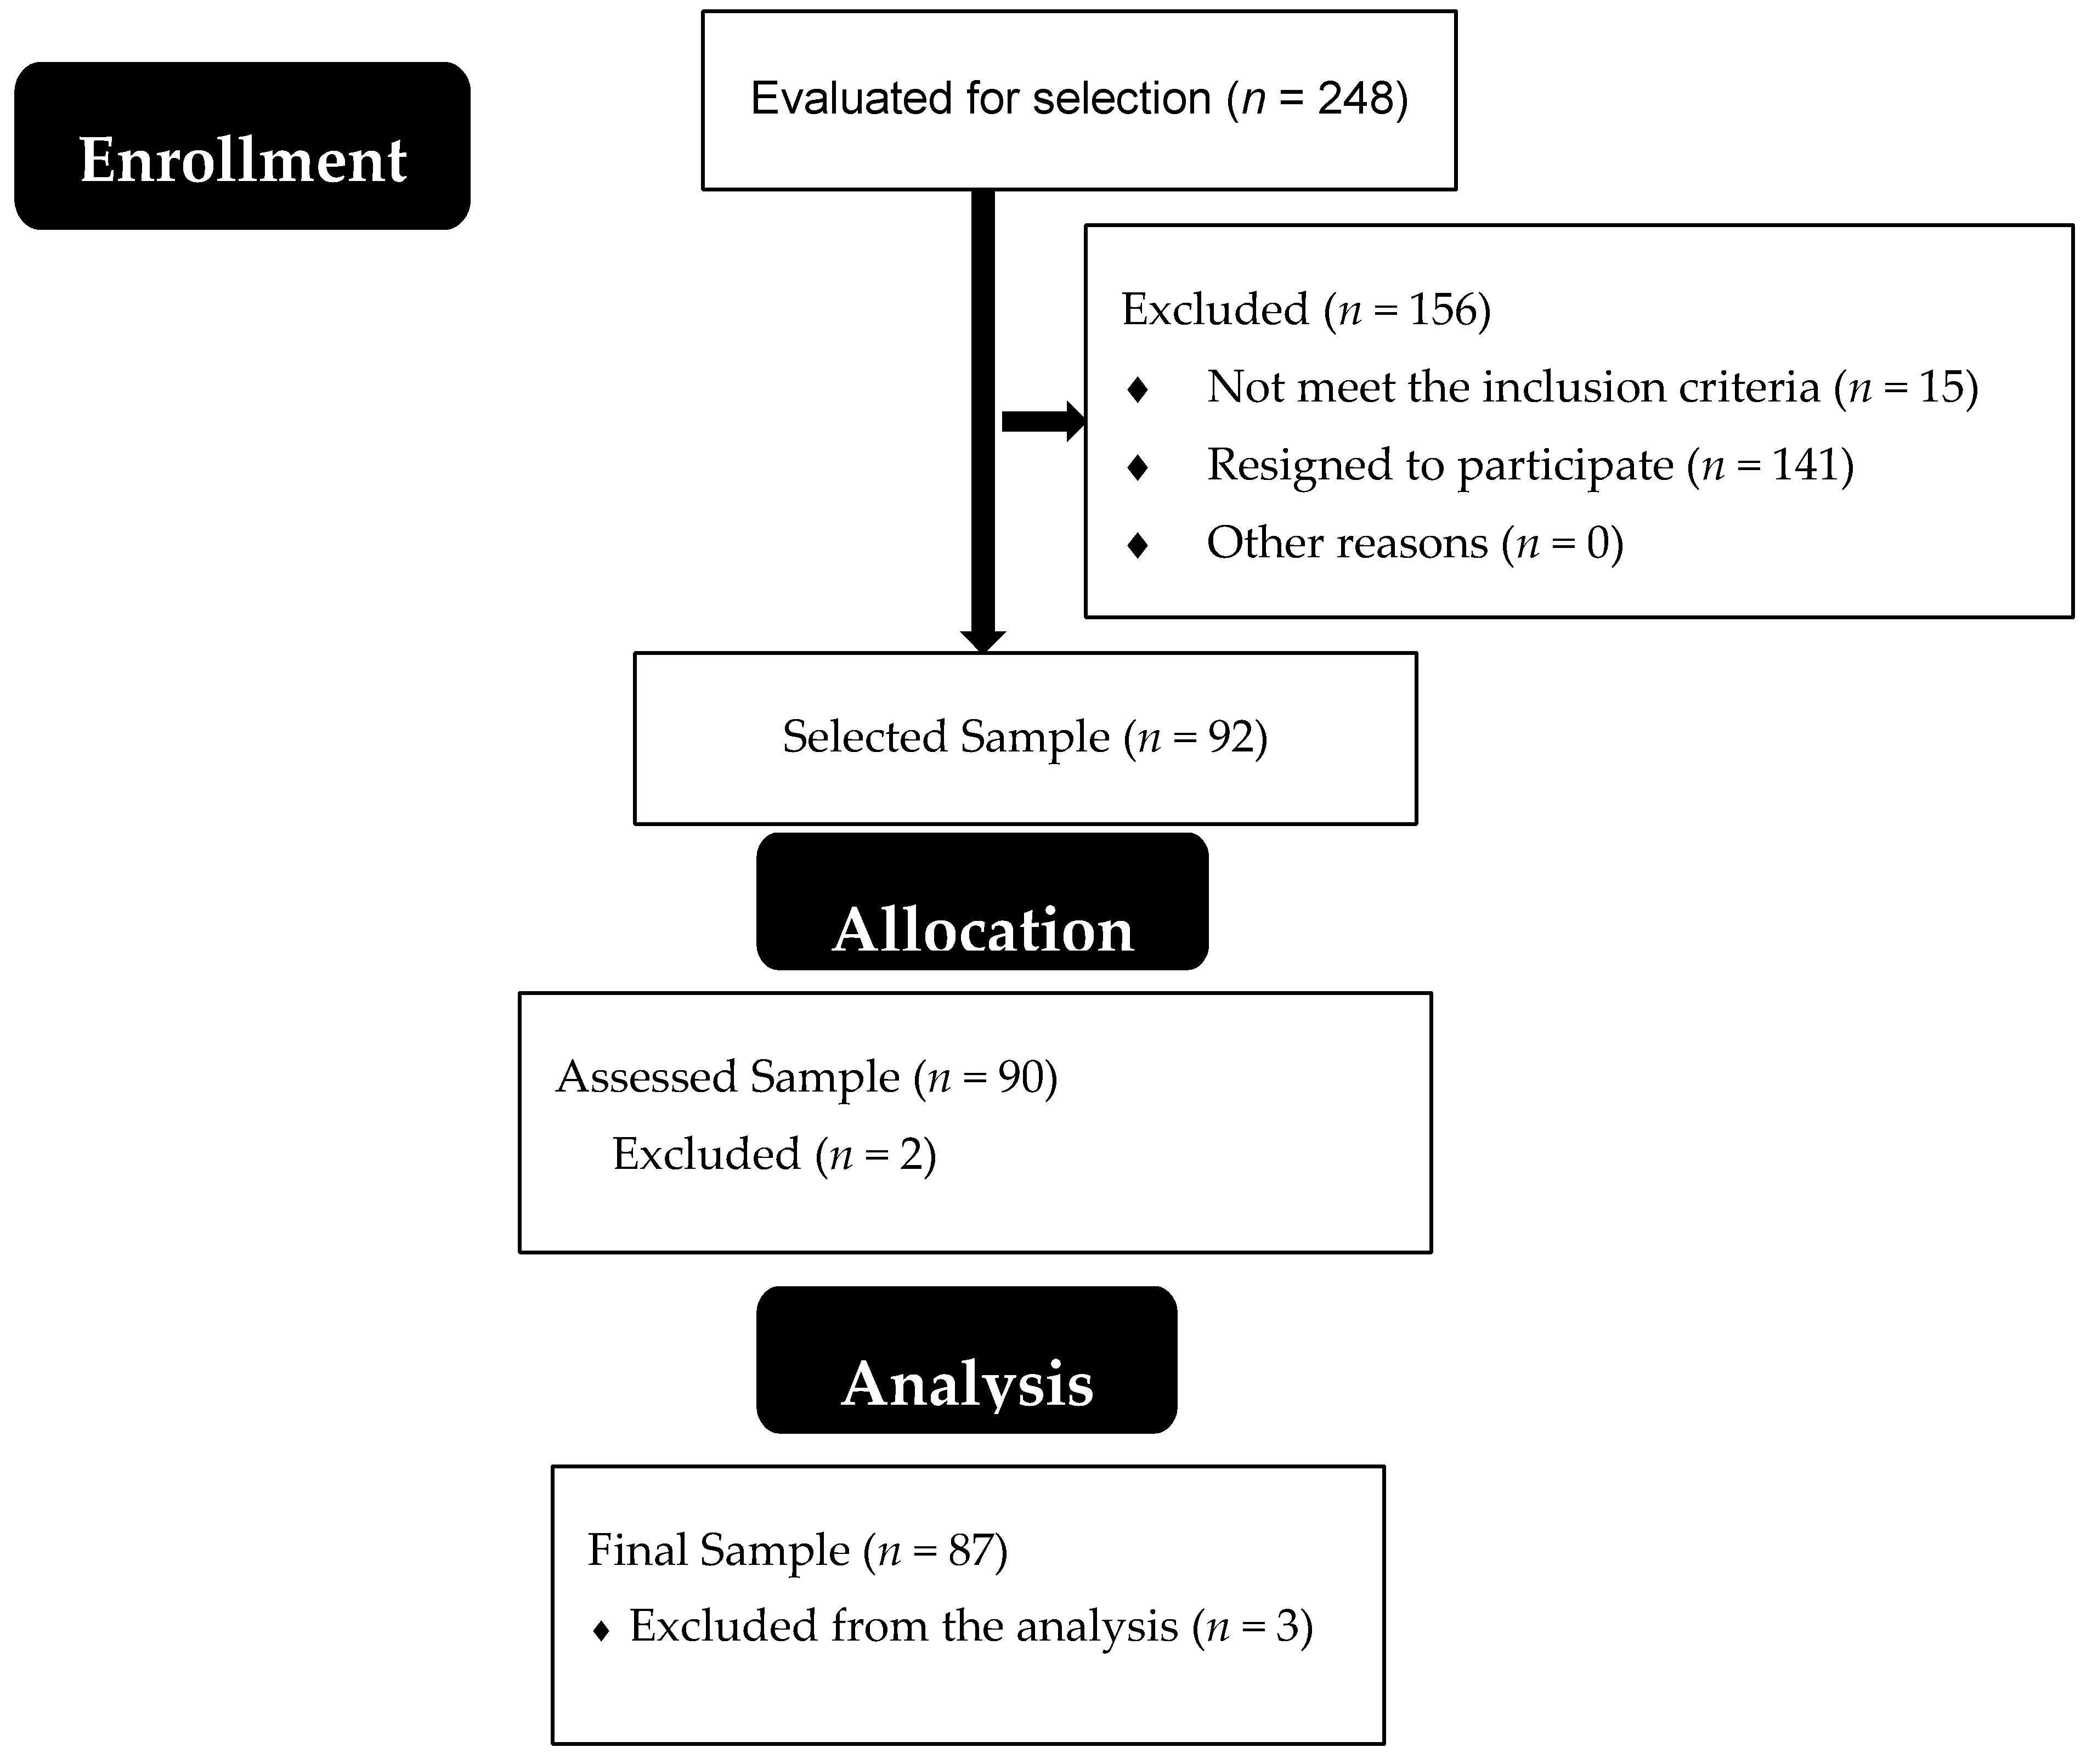
2.2. Participants
2.3. Measurement Tools
- -
- Do not wear shoes.
- -
- The subject must have his feet and heels together.
- -
- He should touch the measuring rod with his buttocks and back.
- -
- The head should be in a neutral state, looking forward.
- -
- No intense physical exercise 24 h before.
- -
- Urinate before the measurements.
- -
- Measure weight and height at each evaluation.
- -
- Settle in the supine position for 8-10 min beforehand.
- -
- Correct position of the electrodes.
- -
- Arms and legs should be separated from the trunk.
- -
- Remove metallic elements.
- -
- Report situations such as marked abdominal obesity, muscle mass, weight loss, menstrual cycle, and menopause.
2.4. Statistical Analysis
3. Results
3.1. Participant Characteristics
3.2. Preliminary FHSQ Values
4. Discussion
5. Conclusions
Author Contributions
Funding
Acknowledgments
Conflicts of Interest
References
- Sarmiento, E.G.; Calleja, I.P.; Gimeno, M.L.; Lenguas, J.A.C. Síndrome metabólico y diabetes mellitus. Rev. Española De Cardiol. Supl. 2005, 5, 30D–37D. [Google Scholar] [CrossRef]
- WHO. Definition, Diagnosis and Classification of Diabetes Mellitus and Its Complications. Part 1: Diagnosis and Classification of Diabetes Mellitus; WHO: Geneva, Switzerland, 1999. [Google Scholar]
- Ogurtsova, K.; da Rocha Fernandes, J.; Huang, Y.; Linnenkamp, U.; Guariguata, L.; Cho, N.; Cavan, D.; Shaw, J.; Makaroff, L. IDF Diabetes Atlas: Global estimates for the prevalence of diabetes for 2015 and 2040. Diabetes Res. Clin. Pract. 2017, 128, 40–50. [Google Scholar] [CrossRef] [PubMed] [Green Version]
- Malacara, J.M. El enigma de las causas de la diabetes mellitus tipo 2. Acta Univ. 2003, 13, 5–17. [Google Scholar] [CrossRef]
- Antonio, J.A.A.S.J.; Samur, A.; Rodríguez, M.Z.C.; Olmos, A.I.; Bárcena, D.G. Prevalencia de neuropatía periférica en diabetes mellitus. Acta Médica Grupo Ángeles 2006, 4, 13. [Google Scholar]
- Alberti, K.G.M.M.; Zimmet, P.F. Definition, diagnosis and classification of diabetes mellitus and its complications. Part 1: Diagnosis and classification of diabetes mellitus. Provisional report of a WHO consultation. Diabet. Med. 1998, 15, 539–553. [Google Scholar] [CrossRef]
- Hoyos, E.G.; Levy, A.E.; Perez, A.D.; Hernández, M.C.; Zorrilla, C.M.; Pascual, A.L.C. Pie diabético. Semin. De La Fund. Española De Reumatol. 2012, 13, 119–129. [Google Scholar]
- López-Antuñano, S.; López-Antuñano, F.J. Diabetes mellitus y lesiones del pie. Salud Pública De México 1998, 40, 281–292. [Google Scholar] [CrossRef] [Green Version]
- Lumbreras Marín, E.; Albarrán Juan, M.; Muñoz, M. Revisión sobre el dolor neuropático en el síndrome del pie diabético. Med. Interna 2004, 450–455. [Google Scholar] [CrossRef] [Green Version]
- López-Gavito, E.; Parra-Téllez, P.; Vázquez-Escamilla, J. Charcot arthropathy and diabetic foot. Acta Ortopédica Mex. 2016, 30, 33–45. [Google Scholar]
- Rincón, Y.; Gil, V.; Pacheco, J.; Benítez, I.; Sánchez, M. Evaluación y tratamiento del pie diabético. Rev. Venez. De Endocrinol. Y Metab. 2012, 10, 176–187. [Google Scholar]
- Bennett, P.J.; Patterson, C.; Wearing, S.; Baglioni, T. Development and validation of a questionnaire designed to measure foot-health status. J. Am. Podiatr. Med Assoc. 1998, 88, 419–428. [Google Scholar] [CrossRef] [PubMed]
- Bennett, P.J.; Patterson, C.; Dunne, M.P. Health-related quality of life following podiatric surgery. J. Am. Podiatr. Med Assoc. 2001, 91, 164–173. [Google Scholar] [CrossRef] [PubMed]
- Landorf, K.B.; Keenan, A.-M.; Herbert, R.D. Effectiveness of foot orthoses to treat plantar fasciitis: A randomized trial. Arch. Intern. Med. 2006, 166, 1305–1310. [Google Scholar] [CrossRef] [PubMed] [Green Version]
- Dunn, J.; Link, C.; Felson, D.; Crincoli, M.; Keysor, J.; McKinlay, J. Prevalence of foot and ankle conditions in a multiethnic community sample of older adults. Am. J. Epidemiol. 2004, 159, 491–498. [Google Scholar] [CrossRef] [PubMed]
- Burns, J.; Wegener, C.; Begg, L.; Vicaretti, M.; Fletcher, J. Randomized trial of custom orthoses and footwear on foot pain and plantar pressure in diabetic peripheral arterial disease. Diabet. Med. 2009, 26, 893–899. [Google Scholar] [CrossRef] [PubMed]
- Palomo-López, P.; Losa-Iglesias, M.E.; Becerro-de-Bengoa-Vallejo, R.; López-López, D.; Rodríguez-Sanz, D.; Romero-Morales, C.; Calvo-Lobo, C. Specific foot health-related quality-of-life impairment in patients with type II versus type I diabetes. Int. Wound J. 2018, 16, 47–51. [Google Scholar] [CrossRef] [Green Version]
- Landorf, K.B.; Keenan, A.-M. An evaluation of two foot-specific, health-related quality-of-life measuring instruments. Foot Ankle Int. 2002, 23, 538–546. [Google Scholar] [CrossRef]
- Menz, H.B.; Auhl, M.; Ristevski, S.; Frescos, N.; Munteanu, S.E. Comparison of the responsiveness of the foot health status questionnaire and the Manchester foot pain and disability index in older people. Health Qual. Life Outcomes 2014, 12, 158. [Google Scholar] [CrossRef] [Green Version]
- Marfell-Jones, M.J.; Stewart, A.D.; de Ridder, J.H. International Standards for Anthropometric Assessment; International Society for the Advancement of Kinanthropometry: Glasgow, UK, 2012. [Google Scholar]
- Norton, K.I. Standards for Anthropometry Assessment. In Kinanthropometry and Exercise Physiology; Routledge: London, UK, 2020; pp. 68–137. [Google Scholar] [CrossRef]
- Campuzano-Maya, G.; Latorre-Sierra, G. La HbA1c en el diagnóstico y en el manejo de la diabetes. Med. Lab. 2010, 16, 211–241. [Google Scholar]
- Moreno, G.M. Definición y clasificación de la obesidad. Rev. Médica Clínica Las Condes 2012, 23, 124–128. [Google Scholar] [CrossRef] [Green Version]
- Alvarado García, A.M.; Maya, S.; María, Á. Análisis del concepto de envejecimiento. Gerokomos 2014, 25, 57–62. [Google Scholar] [CrossRef] [Green Version]
- López-López, D.; Rodríguez-Vila, I.; Losa-Iglesias, M.E.; Rodríguez-Sanz, D.; Calvo-Lobo, C.; Romero-Morales, C.; Becerro-de-Bengoa-Vallejo, R. Impact of the quality of life related to foot health in a sample of pregnant women: A case control study. Medicine 2017, 96, e6433. [Google Scholar] [CrossRef] [PubMed]
- López López, D.; López Martínez, N.; Losa Iglesias, M.E.; Rodríguez Sanz, D.; Palomo López, P.; Becerro de Bengoa Vallejo, R. Impact on quality of life related to foot health in a sample of menopausal women: A case–control observational study. Climacteric 2016, 19, 501–505. [Google Scholar] [CrossRef]
- Rodríguez-Sanz, D.; Barbeito-Fernández, D.; Losa-Iglesias, M.E.; Saleta-Canosa, J.L.; López-López, D.; Tovaruela-Carrión, N.; Becerro-de-Bengoa-Vallejo, R. Foot health and quality of life among university students: Cross-sectional study. Sao Paulo Med. J. 2018, 136, 123–128. [Google Scholar] [CrossRef]
- Lopez Lopez, D.; Bouza Prego Mde, L.; Requeijo Constenla, A.; Saleta Canosa, J.L.; Bautista Casasnovas, A.; Tajes, F.A. The impact of foot arch height on quality of life in 6–12 year olds. Colomb. Med. 2014, 45, 168–172. [Google Scholar] [CrossRef]
- Lopez-Lopez, D.; Exposito-Casabella, Y.; Losa-Iglesias, M.; Bengoa-Vallejo, R.B.; Saleta-Canosa, J.L.; Alonso-Tajes, F. Impact of shoe size in a sample of elderly individuals. Rev. Assoc. Med. Bras. (1992) 2016, 62, 789–794. [Google Scholar] [CrossRef] [Green Version]
- Ruiz, S.H.; Tajes, F.A.; Bautista, C.R.; Blázquez, F.M.G.; Nova, A.M.; Rodriguez, R.S. Estudio de la altura recomendada del tacón. El Peu 2005, 25, 73–78. [Google Scholar]
- Bombi Arrieta, M. Características de los zapatos de tacón. Bachelor’s Thesis, Universitat de Barcelona, Barcelona, Spain, 8 June 2015. [Google Scholar]


| Total (n = 87) | Men (n = 54) | Women (n = 33) | p | ||||
|---|---|---|---|---|---|---|---|
| Mean | SD | Mean | SD | Mean | SD | ||
| Age (years) | 65.56 | 8.74 | 65.55 | 8.31 | 65.57 | 9.52 | 0.827 * |
| HB1Ac (%) | 6.74 | 1.01 | 6.79 | 0.95 | 6.66 | 1.10 | 0.430 † |
| Weight (kg) | 80.60 | 16.23 | 85.64 | 17.21 | 72.35 | 10.19 | < 0.001 * |
| Height (cm) | 164.83 | 10.12 | 170.06 | 7.81 | 156.27 | 7.25 | < 0.001 * |
| BMI (kg/m2) | 29.55 | 4.43 | 29.50 | 4.81 | 29.64 | 3.80 | 0.523 * |
| Body Fat Percentage | 33.11 | 7.31 | 29.16 | 5.04 | 39.58 | 5.67 | < 0.001 * |
| Years of diagnosis | 9.71 | 8.80 | 9.11 | 7.26 | 10.70 | 10.93 | 0.809 † |
| Years of pain | 1.86 | 0.40 | 1.85 | 0.45 | 1.87 | 0.33 | 0.937 † |
| Pain (0–10) | 3.89 | 14.98 | 2.53 | 9.98 | 6.12 | 20.74 | 0.631 † |
| Foot Pain | Foot Function | Shoe | General Foot Health | General Health | Physical Activity | Social Capacity | Vigour | |
|---|---|---|---|---|---|---|---|---|
| General | ||||||||
| Median (IQR) | 29.20 (7.80) | 100.00 (0.00) | 100.00 (33.33) | 60.00 (30.00) | 70.00 (40.00) | 88.88 (22.22) | 100.00 (0.00) | 68.75 (37.50) |
| Mean (SD) | 38.59 (22.89) | 94.39 (16.31) | 75.76 (38.43) ζ | 57.67 (25.03) ζ | 66.66 (23.16) | 80.45 (22.13) ζ | 91.23 (20.71) | 67.45 (23.86) ζ |
| Range | 21.50–100.00 | 12.50–100.00 | 0.00–100.00 | 0.00–100.00 | 10.00–100.00 | 5.55–100.00 | 12.50–100.00 | 0.00–100.00 |
| Diabetes Control | ||||||||
| Hb1Ac < 7 (n = 61) | ||||||||
| Median (IQR) | 29.30 (6.95) | 100.00 (0.00) | 100.00 (58.35) | 60.00 (25.00) | 70.00 (40.00) | 88.88 (25.00) | 100.00 (0.00) | 68.75 (37.50) |
| Mean (SD) | 37.97 (22.37) | 94.26 (16.26) | 72.81 (39.43) | 60.65 (25.43) * | 66.39 (24.15) | 82.14 (18.26) | 91.39 (19.70) | 67.11 (24.60) |
| Range | 21.50–100.00 | 12.50–100.00 | 0.00–100.00 | 0.00–100.00 | 10.00–100.00 | 27.77–100.00 | 12.50–100.00 | 0.00–100.00 |
| Hb1Ac > 7 (n = 26) | ||||||||
| Median (IQR) | 28.90 (11.25) | 100.00 (0.00) | 100.00 (12.49) | 60.00 (31.25) | 70.00 (32.50) | 88.88 (22.22) | 100.00 (0.00) | 68.75 (39.06) |
| Mean (SD) | 40.03 (24.46) | 94.71 (16.74) | 82.69 (35.74) | 50.67 (23.03) | 67.30 (21.08) | 76.49 (29.36) | 90.86 (23.33) | 68.26 (22.49) |
| Range | 24.40–100.00 | 25.00-100.00 | 0.00–100.00 | 0.00–100.00 | 30.00–100.00 | 5.55–100.00 | 25.00–100.00 | 12.5–100.00 |
| BMI Normal Weight (kg/m2) | ||||||||
| BMI < 25 (n = 10) | ||||||||
| Median (IQR) | 24.10 (15.81) | 100 (0.00) | 100 (29.16) | 82.50 (25.00) | 75.00 (30.00) | 91.66 (19.44) | 100.00 (0.00) | 81.25 (40.62) |
| Mean (SD) | 37.39 (29.12) * | 99.37 (1.97) * | 87.49 (17.67) | 76.00 (14.68) * | 71.00 (22.82) | 88.88 (12.28) | 100.00 (.00) | 76.25 (19.93) |
| Range | 21.50–100.00 | 93.75–100.00 | 58.33–100.00 | 60.00–100.00 | 30.00–100.00 | 66.66–100.00 | 100.00–100.00 | 50.00–100.00 |
| BMI > 25 (n = 77) | ||||||||
| Median (IQR) | 29.80 (7.75) | 100.00 (0.00) | 100.00 (54.16) | 60.00 (17.50) | 70.00 (40.00) | 88.88 (22.22) | 100.00 (0.00) | 68.75 (37.50) |
| Mean (SD) | 38.74 (22.19) | 93.75 (17.23) | 74.24 (40.17) | 55.29 (25.17) | 66.10 (23.29) | 79.36 (22.93) | 90.09 (21.77) | 66.31 (24.20) |
| Range | 25.00–100.00 | 12.50–100.00 | 0.00–100.00 | 0.00–100.00 | 10.00–100.00 | 5.55–100.00 | 12.50–100.00 | 0.00–100.00 |
| Age | ||||||||
| < 65 years (n = 32) | ||||||||
| Median (IQR) | 29.25 (8.80) | 100.00 (0.00) | 95.83 (66.66) | 60.00 (51.87) | 70.00 (30.00) | 94.44 (22.22) | 100.00 (0.00) | 75.00 (34.37) |
| Mean (SD) | 35.17 (15.84) | 93.55 (19.60) | 69.79 (39.18) | 58.90 (29.35) | 65.31 (23.68) | 84.37 (21.28) | 92.18 (19.50) | 70.89 (20.85) |
| Range | 21.50–84.37 | 12.50–100.00 | 0.00–100.00 | 0.00–100.00 | 10.00–100.00 | 5.55-100.00 | 25.00–100.00 | 12.50–100.00 |
| > 65 years (n = 55) | ||||||||
| Median (IQR) | 29.20 (7.90) | 100.00 (0.00) | 100.00 (16.66) | 60.00 (0.00) | 70.00 (40.00) | 83.33 (22.22) | 100.00 (0.00) | 68.75 (37.50) |
| Mean (SD) | 40.58 (26.07) | 94.88 (14.23) | 79.24 (37.91) | 56.95 (22.40) | 67.45 (23.03) | 78.18 (22.49) | 90.68 (21.54) | 65.45 (25.42) |
| Range | 23.50–100.00 | 25.00–100.00 | 0.00–100.00 | 0.00–100.00 | 10.00–100.00 | 5.55–100.00 | 12.50–100.00 | 0.00–100.00 |
| Years of diagnosis | ||||||||
| ≤ 5 years (n = 36) | ||||||||
| Median (IQR) | 29.55 (10.40) | 100.00 (0.00) | 100.00 (37.51) | 60.00 (38.13) | 70.00 (47.50) | 88.88 (22.22) | 100.00 (0.00) | 78.12 (37.50) |
| Mean (SD) | 39.57 (24.18) | 98.61 (4.51) | 78.01 (36.63) | 64.65 (21.85) | 66.39 (23.80) | 83.33 (16.16) | 92.36 (20.11) | 69.79 (23.46) |
| Range | 21.50–100.00 | 75.00–100.00 | 0.00–100.00 | 25.00–100.00 | 20.00–100.00 | 50.00–100.00 | 12.50–100.00 | 12.50–100.00 |
| > 5 years (n = 51) | ||||||||
| Median (IQR) | 29.20 (7.50) | 100.00 (6.25) | 100.00 (33.34) | 60.00 (17.50) | 70.00 (40.00) | 88.88 (22.22) | 100.00 (0.00) | 68.75 (37.50) |
| Mean (SD) | 37.90 (22.16) | 91.42 (20.54) | 74.18 (39.94) | 52.74 (26.15) | 66.86 (22.93) | 78.43 (25.50) | 90.44 (21.30) | 65.80 (24.25) |
| Range | 23.50–100.00 | 12.50–100.00 | 0.00–100.00 | 0.00–100.00 | 10.00–100.00 | 5.56–100.00 | 25.00–100.00 | 0.00–100.00 |
| < 10 years (n = 52) | ||||||||
| Median (IQR) | 28.65 (7.02) | 100.00 (0.00) | 100.00 (16.67) | 60.00 (25.00) | 70.00 (40.00) | 88.88 (26.39) | 100.00 (0.00) | 68.75 (37.50) |
| Mean (SD) | 37.78 (22.46) | 96.03 (12.80) | 81.24 (34.41) | 64.27 (24.01) * | 67.69 (23.23) | 82.90 (19.14) | 91.82 (20.54) | 68.26 (22.91) |
| Range | 21.50–100.00 | 31.25–100.00 | 0.00–100.00 | 0.00–100.00 | 20.00–100.00 | 5.55–100.00 | 12.50–100.00 | 12.50–100.00 |
| ≥ 10 years (n = 35) | ||||||||
| Median (IQR) | 29.90 (8.30) | 100.00 (6.25) | 100.00 (91.67) | 60.00 (35.00) | 70.00 (30.00) | 83.33 (22.22) | 100.00 (0.00) | 68.75 (43.75) |
| Mean (SD) | 39.79 (23.80) | 91.96 (20.42) | 67.61 (42.95) | 47.85 (23.54) | 65.14 (23.31) | 76.82 (25.82) | 90.35 (21.24) | 66.25 (25.50) |
| Range | 24.40–100.00 | 12.50–100.00 | 0.00–100.00 | 0.00–85.00 | 10.00–100.00 | 5.56–100.00 | 25.00–100.00 | 0.00–100.00 |
| Foot Pain | Foot Function | Shoe | General Foot Health | General Health | Physical Activity | Social Capacity | Vigour | |
|---|---|---|---|---|---|---|---|---|
| General | ||||||||
| Median (IQR) | 28.95 (7.42) | 100.00 (0.00) | 100.00 (10.41) | 60.00 (25.00) | 70.00 (40.00) | 91.66 (22.22) | 100.00 (0.00) | 75.00 (32.81) |
| Mean (SD) | 37.99 (22.55) | 95.13 (15.09) | 85.18 (29.92) | 63.37 (22.68) | 69.07 (22.75) | 83.95 (22.37) | 92.36 (18.87) | 72.56 (22.33) |
| Range | 21.50–100.00 | 25.00–100.00 | 0.00–100.00 | 0.00–100.00 | 10.00–100.00 | 5.55–100.00 | 25.00–100.00 | 0.00–100.00 |
| Diabetes Control | ||||||||
| Hb1Ac < 7 (n = 36) | ||||||||
| Median (IQR) | 28.65 (5.47) | 100.00 (0.00) | 100.00 (22.91) | 60.00 (25.00) | 75.00 (30.00) | 94.44 (16.66) | 100.00 (0.00) | 78.12 (35.93) |
| Mean (SD) | 36.55 (21.58) | 96.35 (12.17) | 84.25 (29.12) | 69.23 (19.68) * | 71.11 (23.75) | 88.27 (15.24) | 94.05 (17.02) | 72.56 (23.82) |
| Range | 21.50–100.00 | 31.25–100.00 | 8.33–100.00 | 0.00–100.00 | 10.00–100.00 | 38.88–100.00 | 25.00–100.00 | 0.00–100.00 |
| Hb1Ac > 7 (n = 18) | ||||||||
| Median (IQR) | 29.20 (12.85) | 100.00 (0.00) | 100.00 (2.08) | 60.00 (8.75) | 70.00 (30.00) | 86.11 (22.22) | 100.00 (0.00) | 71.87 (28.12) |
| Mean (SD) | 40.85 (24.79) | 92.70 (19.90) | 87.03 (32.23) | 51.66 (24.25) | 65.00 (20.65) | 75.30 (31.03) | 90.97 (22.60) | 72.56 (19.66) |
| Range | 24.40–100.00 | 25.00–100.00 | 0.00–100.00 | 0.00–100.00 | 30.00–100.00 | 5.55–100.00 | 25.00–100.00 | 37.50–100.00 |
| BMI Normal Weight (kg/m2) | ||||||||
| BMI < 25 (n = 7) | ||||||||
| Median (IQR) | 23.80 (1.00) | 100.00 (0.00) | 100.00 (25.00) | 85.00 (25.00) | 80.00 (30.00) | 100.00 (11.11) | 100.00 (0.00) | 87.50 (37.50) |
| Mean (SD) | 34.48 (28.90) * | 100.00 (0.00) | 90.47 (16.96) | 76.42 (16.25) | 81.42 (14.63) | 95.23 (6.75) | 100.00 (0.00) | 83.03 (17.57) |
| Range | 21.50–100.00 | 100.00–100.00 | 58.33–100.00 | 60.00–100.00 | 60.00–100.00 | 83.33–100.00 | 100.00–100.00 | 56.25–100.00 |
| BMI > 25 (n = 47) | ||||||||
| Median (IQR) | 29.20 (8.00) | 100.00 (0.00) | 100.00 (8.33) | 60.00 (12.50) | 70.00 (40.00) | 88.88 (16.66) | 100.00 (0.00) | 68.75 (31.25) |
| Mean (SD) | 38.51 (21.79) | 94.41 (16.07) | 84.39 (31.45) | 61.43 (22.98) | 67.23 (23.28) | 82.26 (23.41) | 91.22 (20.00) | 71.01 (22.70) |
| Range | 25.60–100.00 | 25.00–100.00 | 0.00–100.00 | 0.00–100.00 | 10.00–100.00 | 5.55–100.00 | 25.00–100.00 | 0.00–100.00 |
| Age | ||||||||
| < 65 years (n = 21) | ||||||||
| Median (IQR) | 29.80 (11.30) | 100.00 (0.00) | 100.00 (25.00) | 60.00 (25.00) | 80.00 (35.00) | 94.44 (11.11) | 100.00 (0.00) | 81.25 (25.00) |
| Mean (SD) | 35.29 (15.64) | 95.83 (15.09) | 86.90 (24.23) | 66.07 (26.21) | 72.85 (21.94) | 89.68 (20.43) * | 95.23 (16.99) | 76.48 (16.87) |
| Range | 21.50–78.75 | 31.25–100.00 | 25.00–100.00 | 0.00–100.00 | 30.00–100.00 | 5.55–100.00 | 25.00–100.00 | 37.50–100.00 |
| > 65 years (n = 33) | ||||||||
| Median (IQR) | 28.60 (6.15) | 100.00 (0.00) | 100.00 (8.33) | 60.00 (0.00) | 70.00 (40.00) | 88.88 (22.22) | 100.00 (6.25) | 68.75 (40.62) |
| Mean (SD) | 39.70 (26.11) | 94.69 (15.31) | 84.09 (33.35) | 61.66 (20.36) | 66.66 (23.27) | 80.30 (23.07) | 90.53 (20.01) | 70.07 (25.13) |
| Range | 23.50–100.00 | 25.00–100.00 | 0.00–100.00 | 0.00–100.00 | 10.00–100.00 | 5.55–100.00 | 25.00–100.00 | 0.00–100.00 |
| Years of diagnosis | ||||||||
| ≤ 5 years (n = 20) | ||||||||
| Median (IQR) | 28.10 (5.88) | 100.00 (0.00) | 100.00 (12.51) | 78.75 (25.00) | 80.00 (27.50) | 94.44 (11.12) | 100.00 (0.00) | 81.25 (29.69) |
| Mean (SD) | 38.31 (24.33) | 100.00 (0.00) * | 88.33 (24.24) | 72.37 (19.54) * | 73.00 (22.96) | 89.72 (14.89) | 97.50 (8.70) | 76.56 (22.11) |
| Range | 21.50–100.00 | 100.00–100.00 | 25.00–100.00 | 25.00–100.00 | 20.00–100.00 | 50.00–100.00 | 62.50–100.00 | 18.75–100.00 |
| > 5 years (n = 34) | ||||||||
| Median (IQR) | 29.20 (8,7) | 100.00 (6.25) | 100.00 (12.50) | 60.00 (0.00) | 70.00 (40.00) | 88.88 (19.45) | 100.00 (3.13) | 68.75 (32.81) |
| Mean (SD) | 37.80 (21.83) | 92.28 (18.53) | 83.33 (33.02) | 58.09 (22.99) | 66.76 (22.66) | 80.55 (25.37) | 89.34 (22.43) | 70.22 (22.46) |
| Range | 23.50–100.00 | 25.00–100.00 | 0.00–100.00 | 0.00–100.00 | 10.00–100.00 | 5.56–100.00 | 25.00–100.00 | 0.00–100.00 |
| < 10 years (n = 32) | ||||||||
| Median (IQR) | 28.60 (5.62) | 100.00 (0.00) | 100.00 (0.00) | 60.00 (25.00) | 75.00 (30.00) | 94.44 (16.67) | 100.00 (0.00) | 81.25 (35.93) |
| Mean (SD) | 37.18 (22.76) | 96.87 (12.60) | 87.50 (27.19) | 69.53 (21.99) * | 72.50 (21.99) | 86.46 (19.75) | 94.53 (16.78) | 74.41 (20.78) |
| Range | 21.50–100.00 | 31.25–100.00 | 8.33–100.00 | 0.00–100.00 | 20.00–100.00 | 5.56–100.00 | 25.00–100.00 | 18.75–100.00 |
| ≥ 10 years (n = 22) | ||||||||
| Median (IQR) | 29.55 (10.87) | 100.00 (6.25) | 100.00 (27.08) | 60.00 (0.00) | 65.00 (32.50) | 88.89 (19.44) | 100.00 (15.62) | 68.75 (29.69) |
| Mean (SD) | 39.17 (22.74) | 92.61 (18.16) | 81.82 (33.89) | 54.43 (21.04) | 64.09 (23.43) | 80.30 (25.76) | 89.20 (21.58) | 69.89 (24.67) |
| Range | 24.40–100.00 | 25.00–100.00 | 0.00–100.00 | 0.00–85.00 | 10.00–100.00 | 5.56–100.00 | 25.00–100.00 | 0.00–100.00 |
| Foot Pain | Foot Function | Shoe | General Foot Health | General Health | Physical Activity | Social Capacity | Vigour | |
|---|---|---|---|---|---|---|---|---|
| General | ||||||||
| Median (IQR) | 29.90 (8.00) | 100.00 (6.25) | 83.33 (100.00) | 60.00 (35.00) | 70.00 (40.00) | 77.77 (27.77) | 100.00 (6.25) | 56.25 (31.25) |
| Mean (SD) | 39.57 (23.76) | 93.18 (18.31) | 60.35 (45.74) | 48.33 (26.21) | 62.72 (23.62) | 74.74 (20.83) | 89.39 (23.61) | 59.09 (24.26) |
| Range | 24.00–100.00 | 12.50–100.00 | 0.00–100.00 | 0.00–92.50 | 10.00–100.00 | 22.22–100.00 | 12.50–100.00 | 12.50–100.00 |
| Diabetes Control | ||||||||
| Hb1Ac < 7 (n = 25) | ||||||||
| Median (IQR) | 30.00 (7.80) | 100.00 (6.25) | 83.33 (100.00) | 60.00 (35.00) | 70.00 (35.00) | 77.77 (19.44) | 100.00 (18.75) | 56.25 (28.12) |
| Mean (SD) | 40.02 (23.77) | 91.25 (20.72) | 56.33 (46.60) | 48.30 (27.97) | 59.60 (23.53) | 73.33 (18.90) | 89.00 (23.19) | 59.25 (24.01) |
| Range | 24.00–100.00 | 12.50–100.00 | 0.00–100.00 | 0.00–92.50 | 10.00–100.00 | 27.77–100.00 | 12.50–100.00 | 12.50–100.00 |
| Hb1Ac > 7 (n = 8) | ||||||||
| Median (IQR) | 28.45 (9.07) | 100.00 (0.00) | 100.00 (75.00) | 51.25 (33.75) | 70.00 (45.00) | 88.88 (36.11) | 100.00 (0.00) | 56.25 (40.62) |
| Mean (SD) | 38.17 (25.29) | 99.21 (2.20) | 72.91 (43.35) | 48.43 (21.42) | 72.50 (22.51) | 79.16 (27.01) | 90.62 (26.51) | 58.59 (26.71) |
| Range | 25.00–100.00 | 93.75–100.00 | 0.00–100.00 | 25.00–85.00 | 40.00–100.00 | 22.22–100.00 | 25.00–100.00 | 12.50–93.75 |
| BMI Normal Weight (kg/m2) | ||||||||
| BMI > 25 (n = 30) | ||||||||
| Median (IQR) | 29.95 (7.55) | 100.00 (6.25) | 87.50 (100.00) | 51.25 (35.00) | 70.00 (35.00) | 77.77 (34.72) | 100.00 (15.62) | 56.25 (32.81) |
| Mean (SD) | 39.11 (23.17) | 92.70 (19.14) | 58.33 (47.24) | 45.66 (25.79) | 64.33 (23.58) | 74.81 (21.77) | 88.33 (24.55) | 58.95 (25.03) |
| Range | 25.00–100.00 | 12.50–100.00 | 0.00–100.00 | 0.00–92.50 | 10.00–100.00 | 22.22–100.00 | 12.50–100.00 | 12.50–100.00 |
| Age | ||||||||
| < 65 years (n = 11) | ||||||||
| Median (IQR) | 28.80 (6.40) | 100.00 (6.25) | 8.33 (75.00) | 60.00 (35.00) | 60.00 (40.00) | 77.77 (44.44) | 100.00 (25.00) | 50.00 (31.25) |
| Mean (SD) | 34.93 (16.98) | 89.20 (26.52) | 37.12 (42.38) * | 45.22 (31.35) | 50.90 (20.71) * | 74.24 (19.91) | 86.36 (23.35) | 60.22 (24.25) |
| Range | 24.20–84.37 | 12.50–100.00 | 0.00–100.00 | 0.00–92.50 | 10.00–70.00 | 44.44–100.00 | 25.00–100.00 | 12.50–93.75 |
| > 65 years (n = 22) | ||||||||
| Median (IQR) | 30.50 (9.42) | 100.00 (6.25) | 100.00 (91.66) | 60.00 (35.00) | 70.00 (42.50) | 80.55 (24.99) | 100.00 (0.00) | 56.25 (32.81) |
| Mean (SD) | 41.89 (26.57) | 95.17 (12.78) | 71.96 (43.68) | 49.88 (23.91) | 68.63 (23.15) | 74.99 (21.73) | 90.90 (24.14) | 58.52 (24.81) |
| Range | 24.00–100.00 | 43.75–100.00 | 0.00–100.00 | 0.00–85.00 | 30.00–100.00 | 22.22–100.00 | 12.50–100.00 | 12.50–100.00 |
| Years of diagnosis | ||||||||
| ≤ 5 years (n = 16) | ||||||||
| Median (IQR) | 30.15 (13.58) | 100.00 (6.25) | 95.83 (97.92) | 60.00 (32.50) | 55.00 (30.00) | 75.00 (16.67) | 100.00 (21.88) | 56.25 (31.25) |
| Mean (SD) | 41.16 (24.70) | 97.87 (6.45) | 65.10 (45.46) | 55.00 (21.25) | 58.12 (22.87) | 75.35 (14.34) | 85.94 (27.71) | 61.33 (22.96) |
| Range | 24.00–100.00 | 75.00–100.00 | 0.00–100.00 | 25.00–85.00 | 30.00–100.00 | 50.00–100.00 | 12.50–100.00 | 12.50–100.00 |
| > 5 years (n = 17) | ||||||||
| Median (IQR) | 28.88 (6.9) | 100.00 (3.13) | 75.00 (100.00) | 60.00 (41.25) | 70.00 (30.00) | 77.78 47.22 | 100.00 (0.00) | 56.25 (31.25) |
| Mean (SD) | 38.09 (23.50) | 89.70 (24.60) | 55.88 (46.93) | 42.06 (29.41) | 67.06 (24.18) | 74.19 (25.98) | 92.65 (19.29) | 56.98 (25.95) |
| Range | 25.00–100.00 | 12.50–100.00 | 0.00–100.00 | 0.00–92.50 | 10.00–100.00 | 22.22–100.00 | 25.00–100.00 | 12.50–100.00 |
| < 10 years (n = 20) | ||||||||
| Median (IQR) | 29.65 (10.22) | 100.00 (6.25) | 100.00 (79.17) | 60.00 (41.25) | 65.00 (30.00) | 80.55 (26.30) | 100.00 (21.87) | 56.25 (29.69) |
| Mean (SD) | 38.74 (22.52) | 94.69 (13.34) | 71.25 (42.45) | 55.87 (25.25) | 60.00 (23.62) | 67.22 (17.09) | 87.50 (25.33) | 58.44 (23.23) |
| Range | 24.00–100.00 | 43.75–100.00 | 0.00–100.00 | 0.00–92.50 | 30.00–100.00 | 44.44–100.00 | 12.50–100.00 | 12.50–100.00 |
| ≥ 10 years (n =13) | ||||||||
| Median (IQR) | 29.90 (7.80) | 100.00 (3.12) | 8.33 (100.00) | 30.00 (41.25) | 70.00 (30.00) | 77.78 (41.67) | 100.00 (0.00) | 56.25 (37.50) |
| Mean (SD) | 40.86 (26.44) | 90.86 (24.55) | 43.59 (47.16) | 36.73 (24.14) | 66.92 (23.94) | 70.94 (25.87) | 92.30 (21.37) | 60.10 (26.70) |
| Range | 25.00–100.00 | 12.50–100.00 | 0.00–100.00 | 0.00–60.00 | 10.00–100.00 | 22.22–100.00 | 25.00–100.00 | 12.50–100.00 |
© 2020 by the authors. Licensee MDPI, Basel, Switzerland. This article is an open access article distributed under the terms and conditions of the Creative Commons Attribution (CC BY) license (http://creativecommons.org/licenses/by/4.0/).
Share and Cite
Domínguez-Muñoz, F.J.; Garcia-Gordillo, M.A.; Diaz-Torres, R.A.; Hernandez-Mocholi, M.Á.; Villafaina, S.; Collado-Mateo, D.; Jiménez-Fernández, C.; Igual-Fraile, D.; Pérez-Escanilla, F.; Martín-Gómez, G.; et al. Foot Health Status Questionnaire (FHSQ) in Spanish People with Type 2 Diabetes Mellitus: Preliminary Values Study. Int. J. Environ. Res. Public Health 2020, 17, 3643. https://0-doi-org.brum.beds.ac.uk/10.3390/ijerph17103643
Domínguez-Muñoz FJ, Garcia-Gordillo MA, Diaz-Torres RA, Hernandez-Mocholi MÁ, Villafaina S, Collado-Mateo D, Jiménez-Fernández C, Igual-Fraile D, Pérez-Escanilla F, Martín-Gómez G, et al. Foot Health Status Questionnaire (FHSQ) in Spanish People with Type 2 Diabetes Mellitus: Preliminary Values Study. International Journal of Environmental Research and Public Health. 2020; 17(10):3643. https://0-doi-org.brum.beds.ac.uk/10.3390/ijerph17103643
Chicago/Turabian StyleDomínguez-Muñoz, Francisco Javier, Miguel Angel Garcia-Gordillo, Rodrigo Anibal Diaz-Torres, Miguel Ángel Hernandez-Mocholi, Santos Villafaina, Daniel Collado-Mateo, Carmen Jiménez-Fernández, Dimas Igual-Fraile, Fernando Pérez-Escanilla, Giovanna Martín-Gómez, and et al. 2020. "Foot Health Status Questionnaire (FHSQ) in Spanish People with Type 2 Diabetes Mellitus: Preliminary Values Study" International Journal of Environmental Research and Public Health 17, no. 10: 3643. https://0-doi-org.brum.beds.ac.uk/10.3390/ijerph17103643