Predicting Risky and Aggressive Driving Behavior among Taxi Drivers: Do Spatio-Temporal Attributes Matter?

 , ,
, ,
Abstract
:1. Introduction
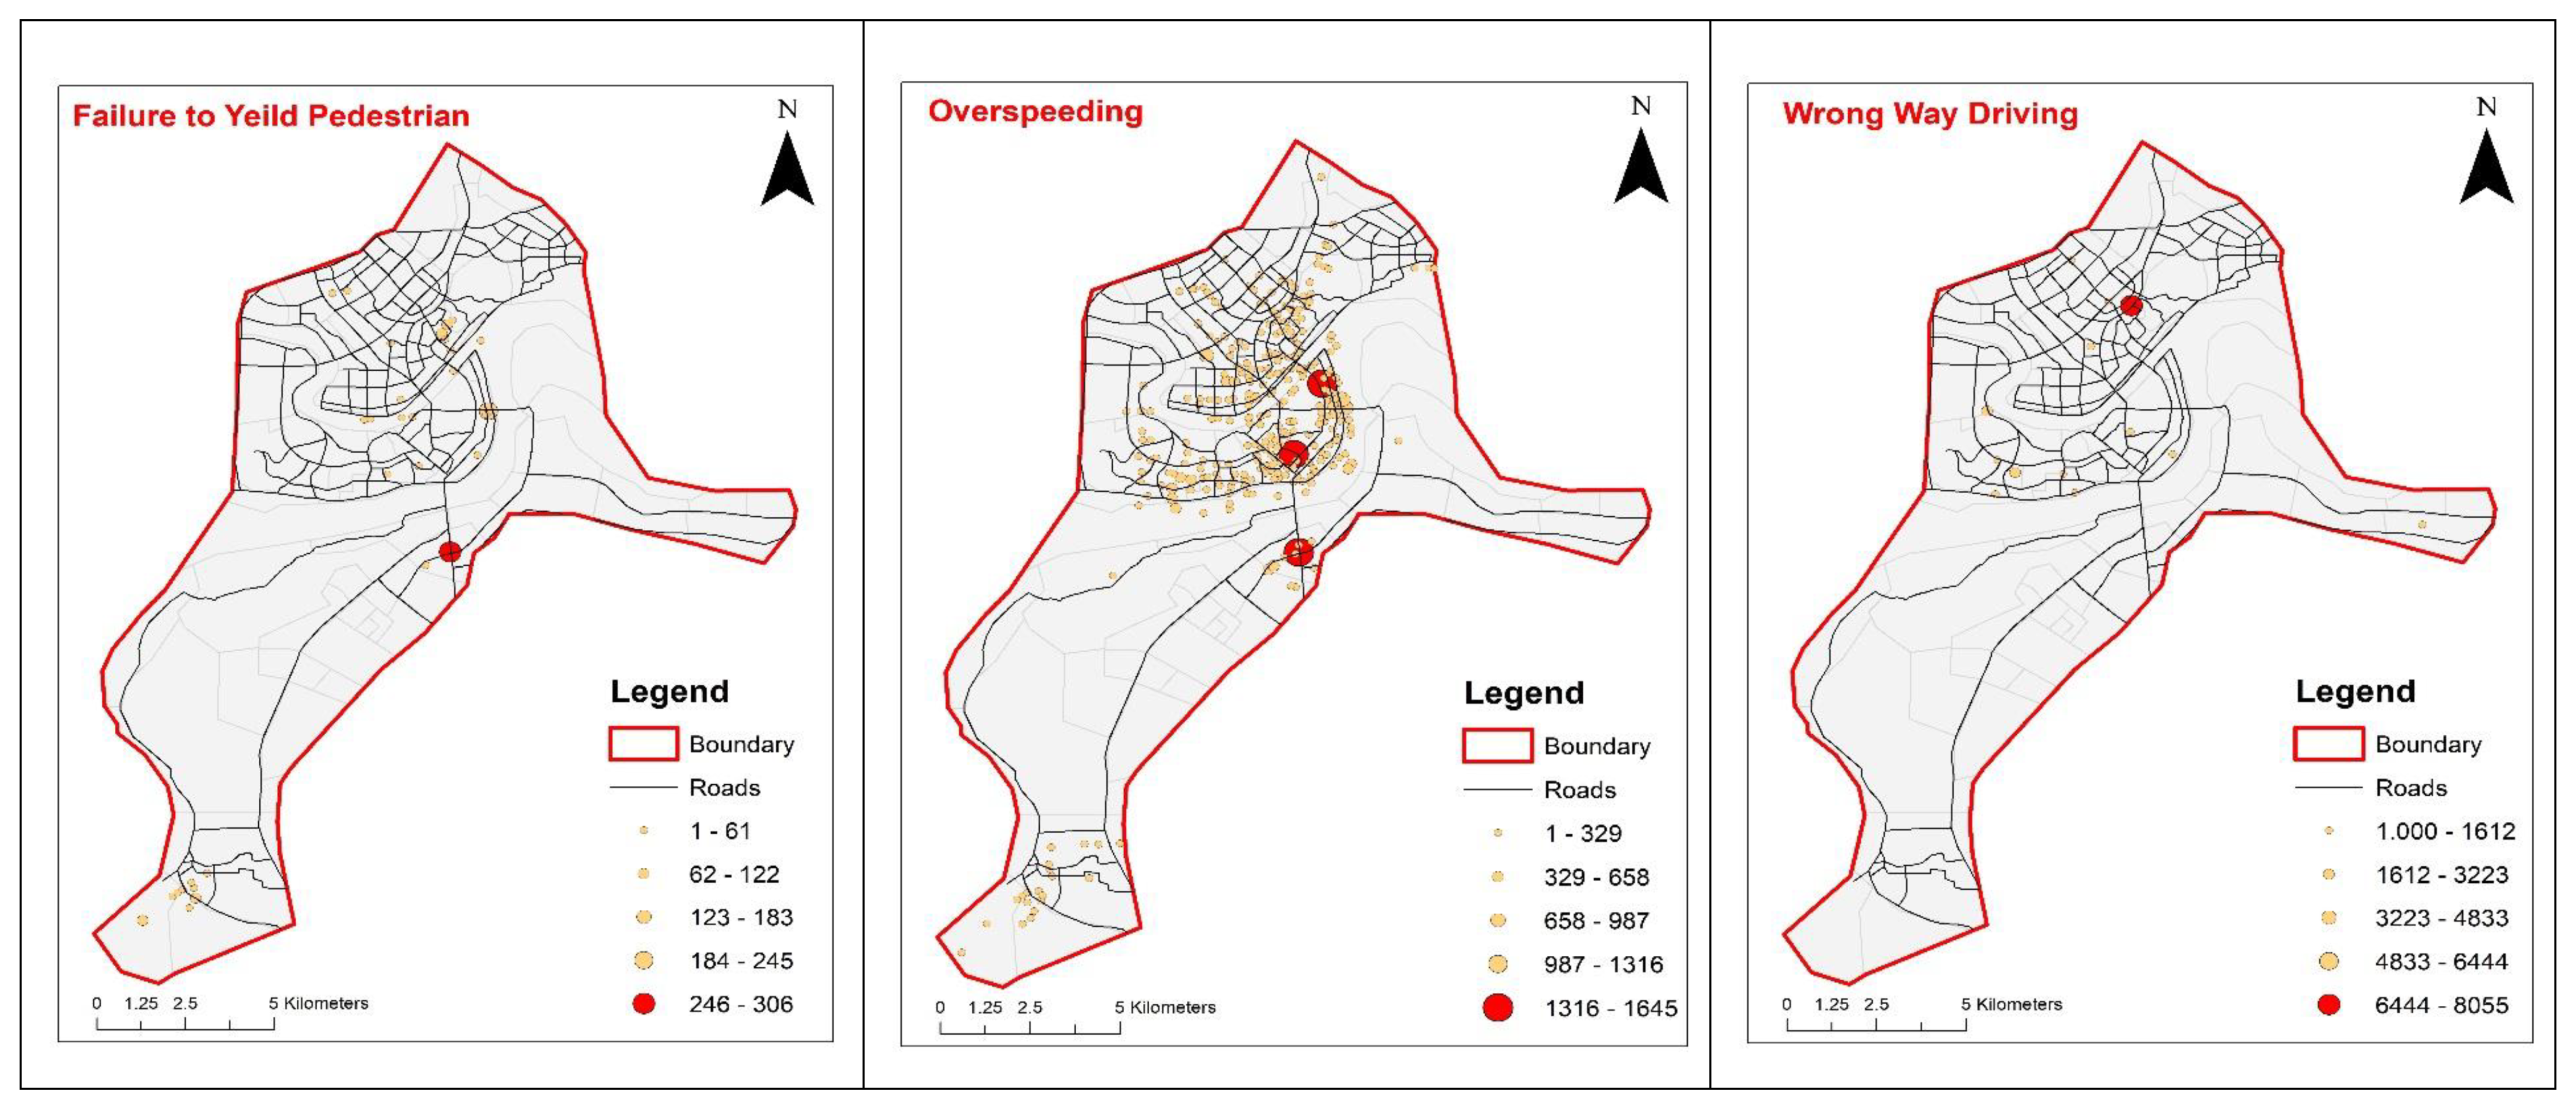
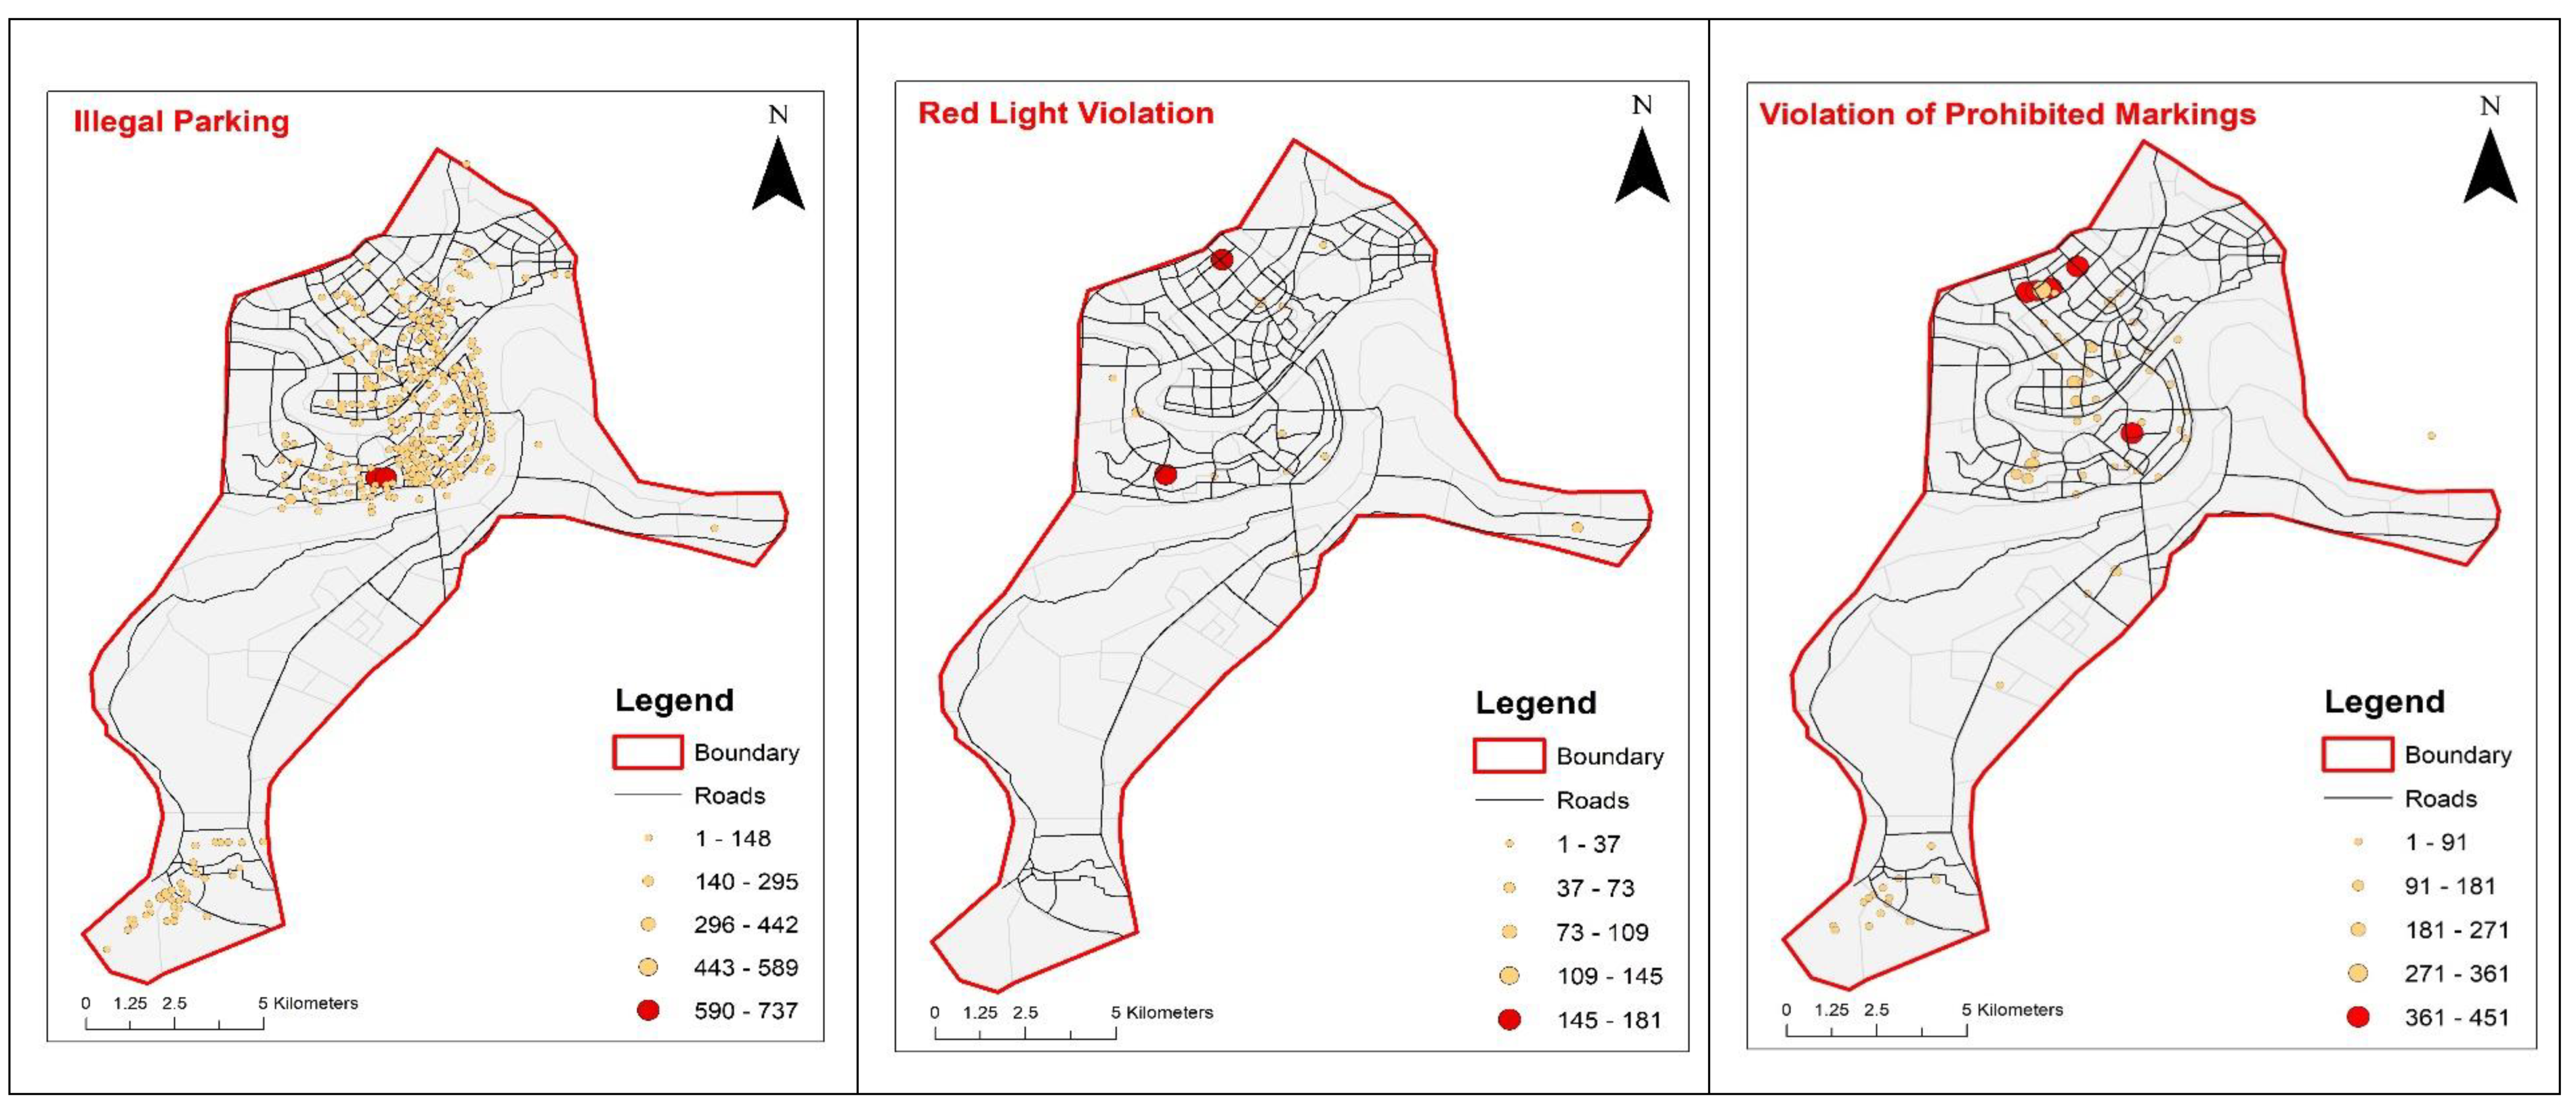
- We used frequency-based nearest neighborhood cluster methods in Arc map Geographic Information System (GIS) to develop hotspots maps for different violation types that are vital for prioritizing and conducting treatment alternatives efficiently.
- Secondly, we predict and classify the occurrence of violations by taxi drivers using stack generalization technique. To the best of our knowledge, it has not been previously used in traffic violations prediction and classification.
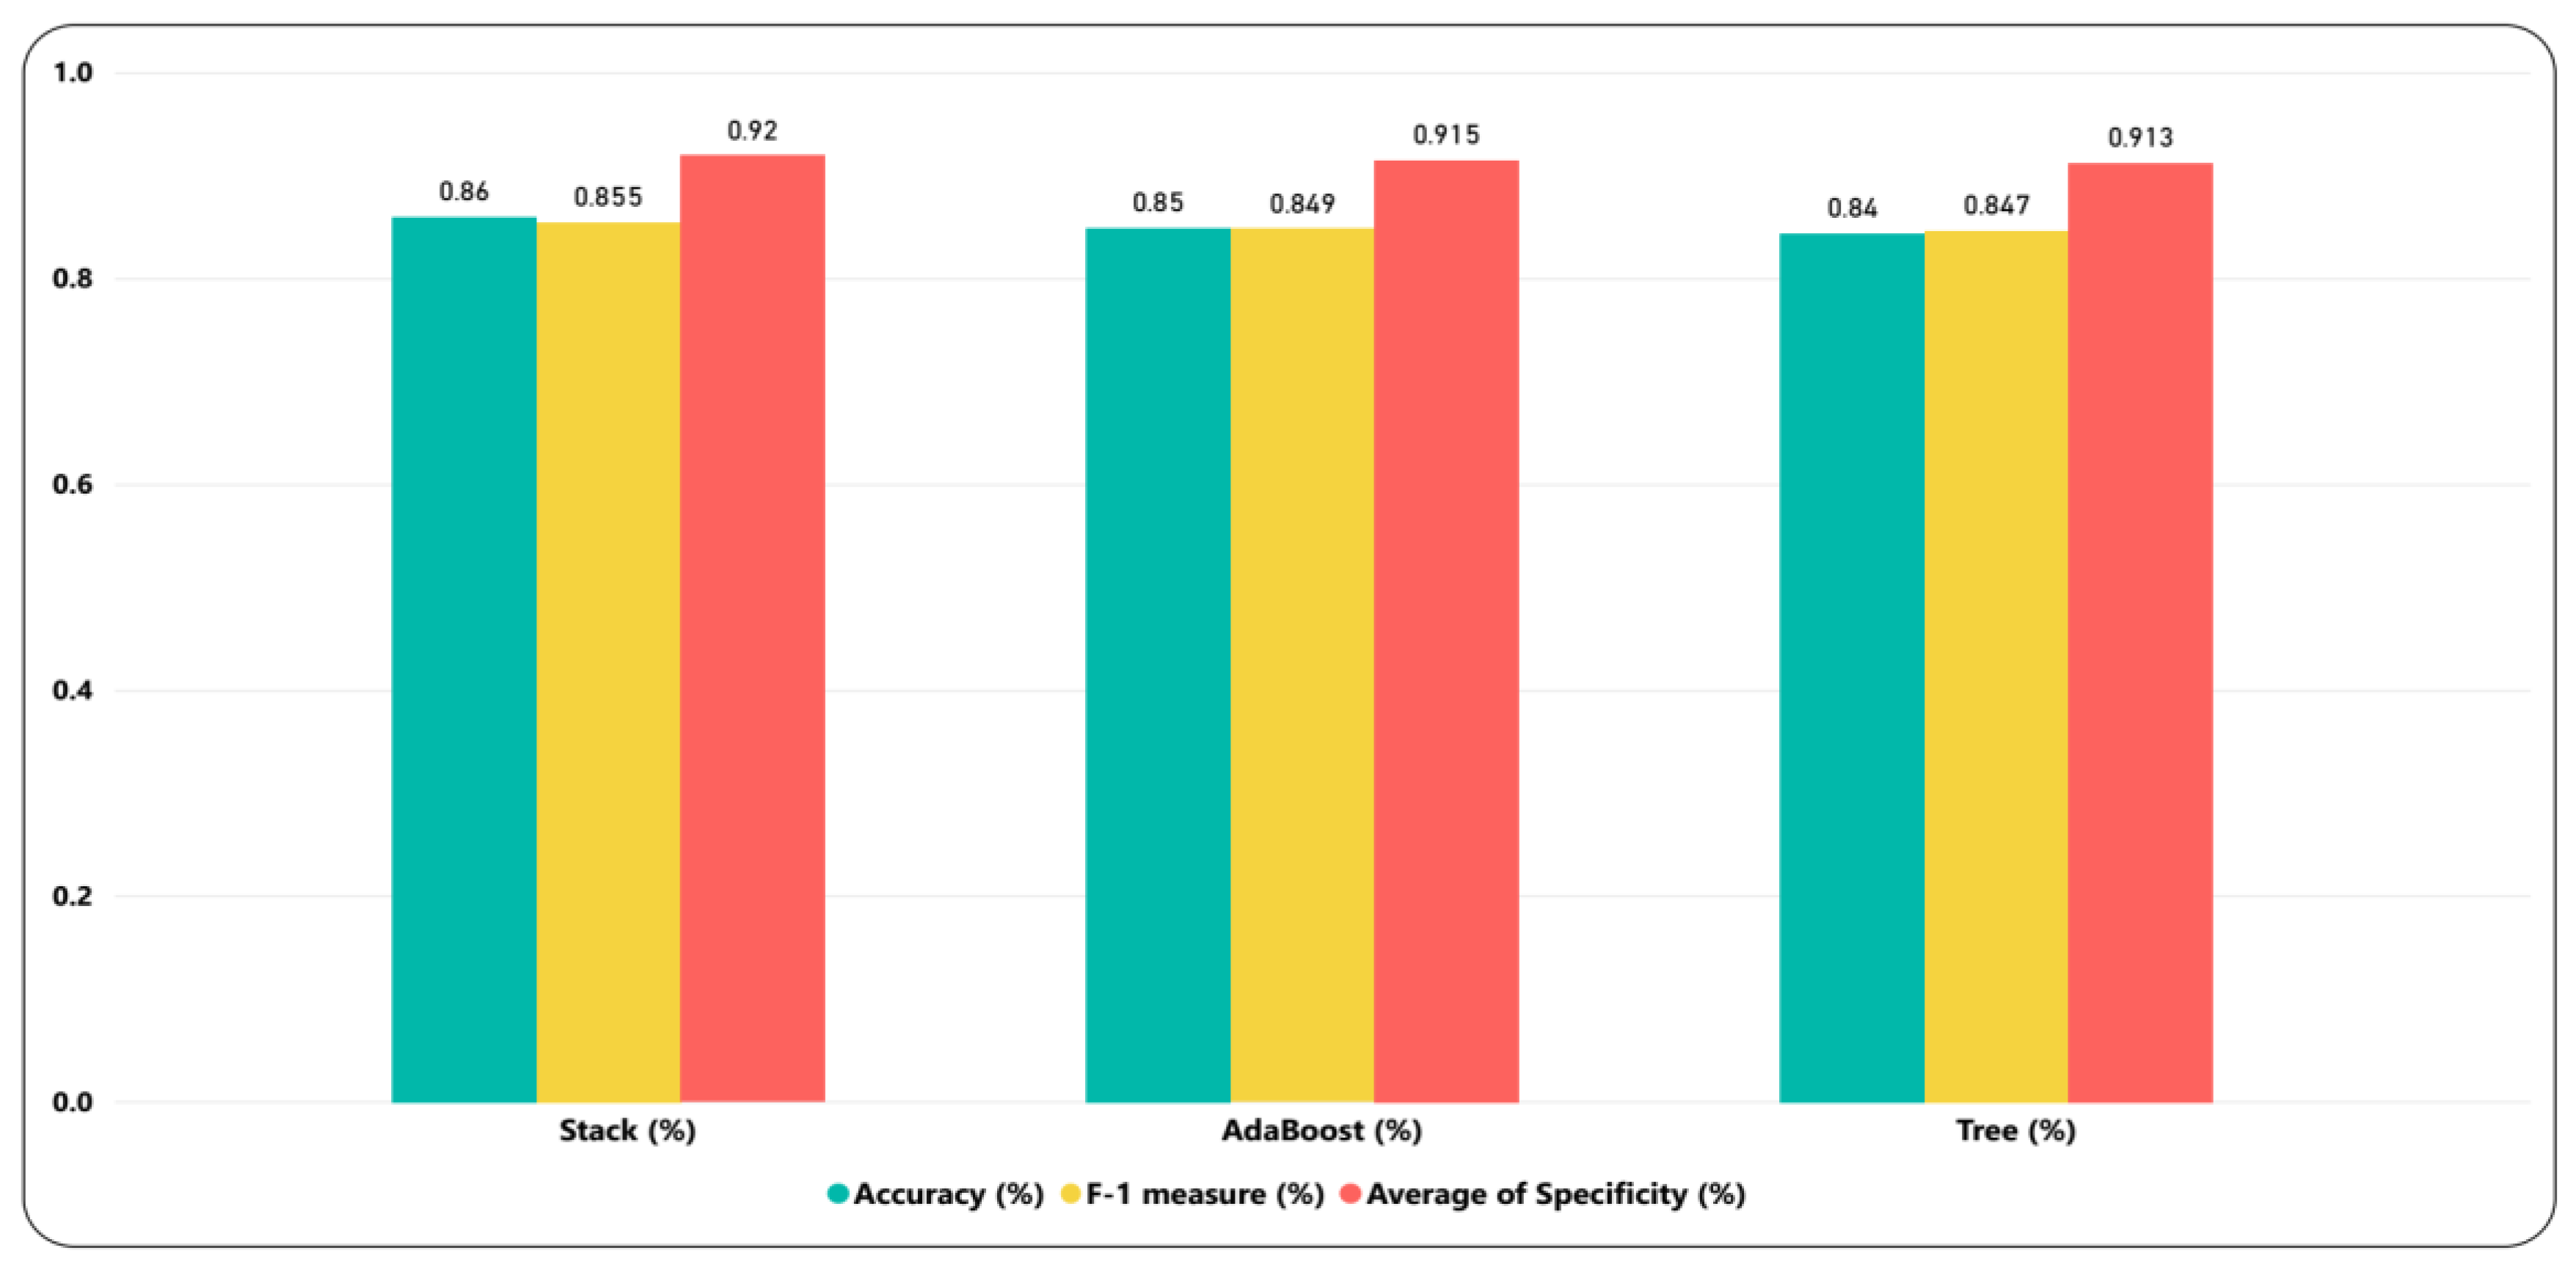
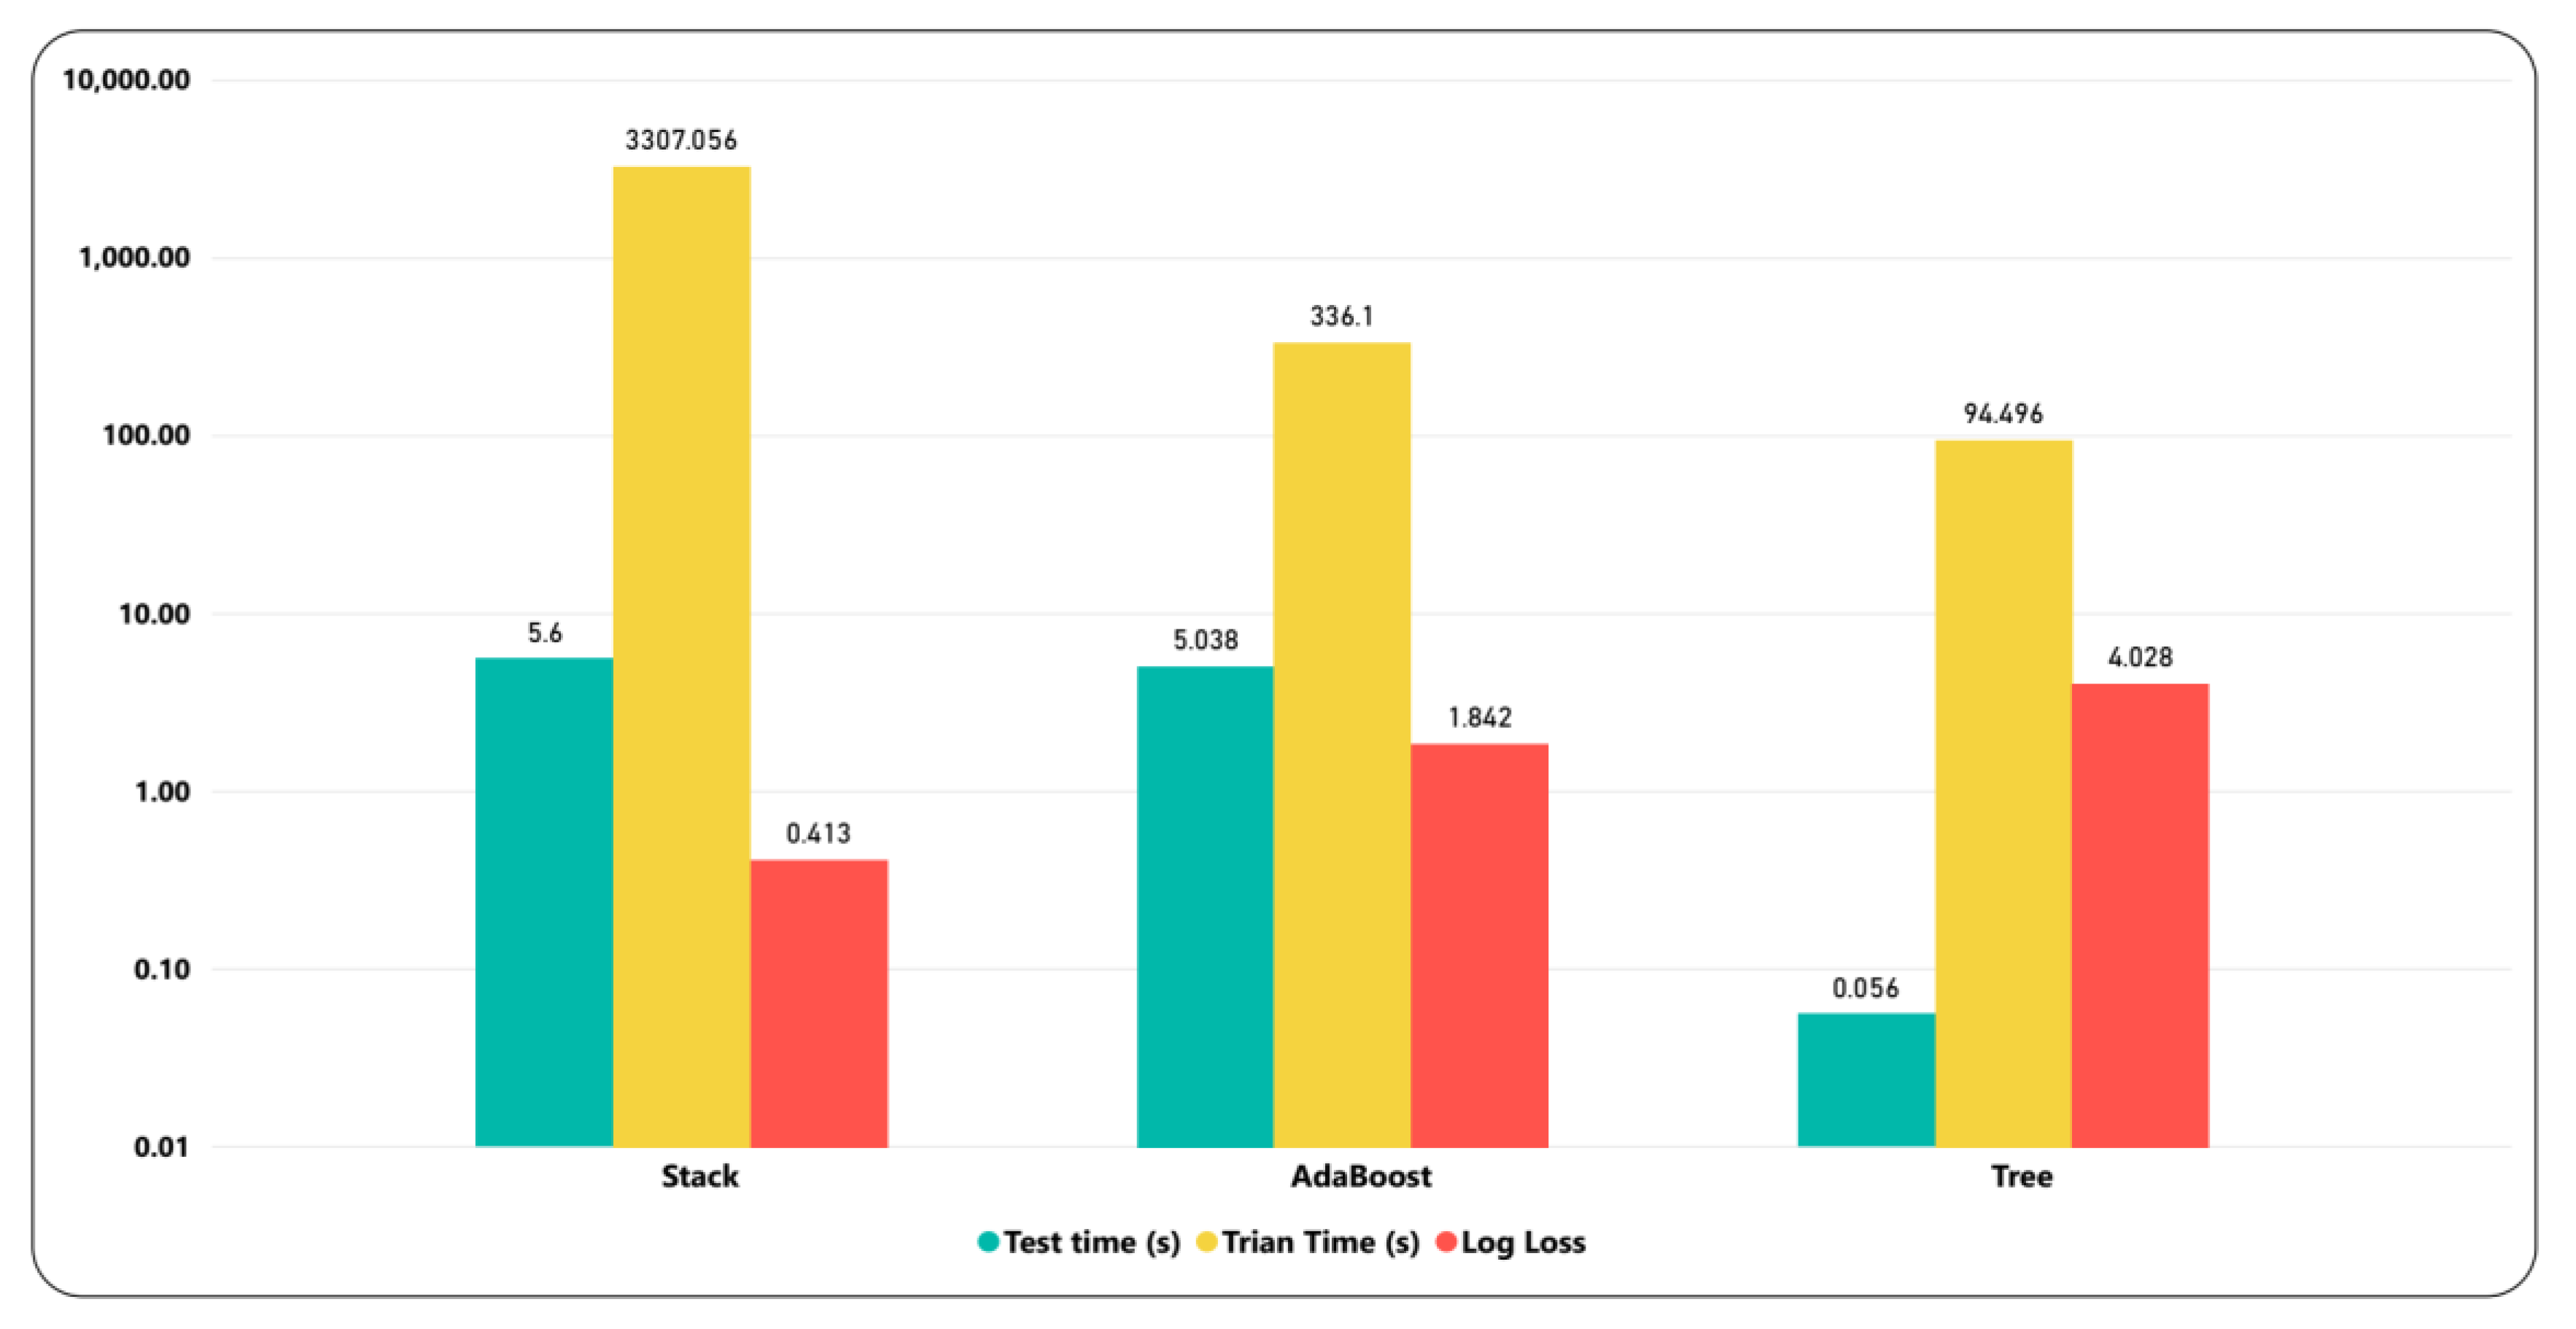
- To demonstrate the efficacy of the proposed technique, a detailed comparison has been made with base models (AdaBoost and decision tree (DT)). The results demonstrate that the stack model outperformed the base models.
2. Related Work
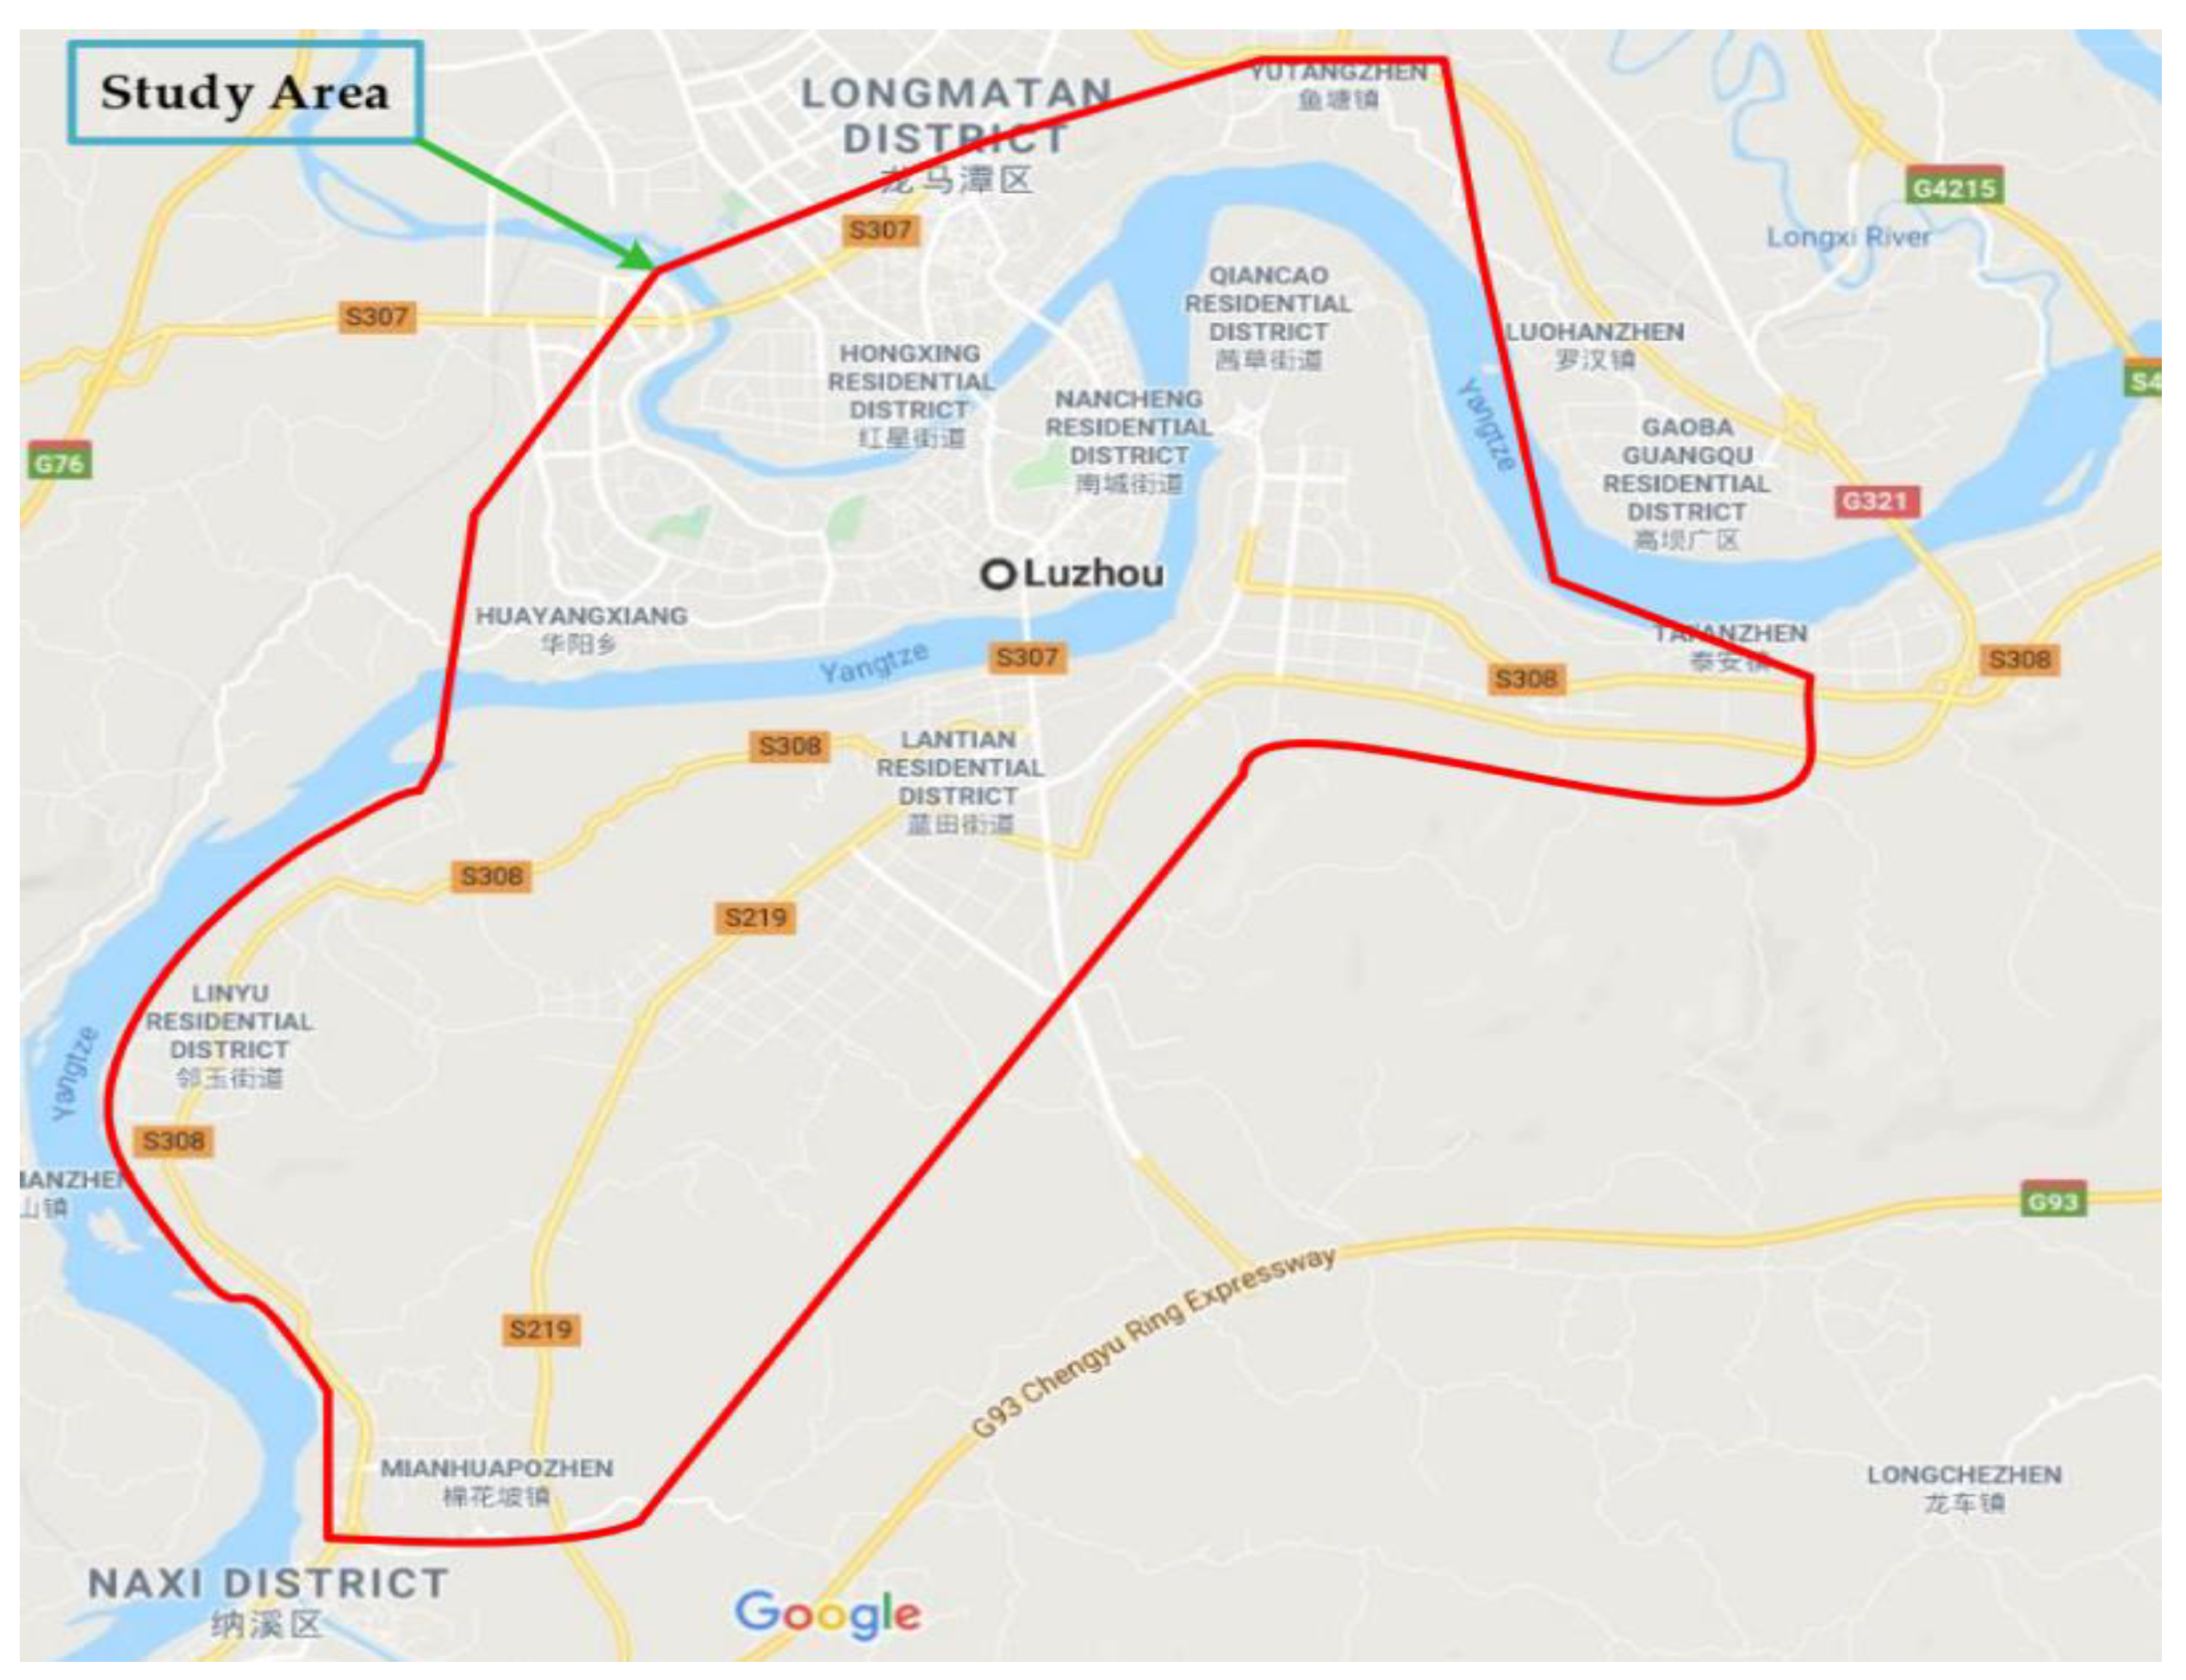
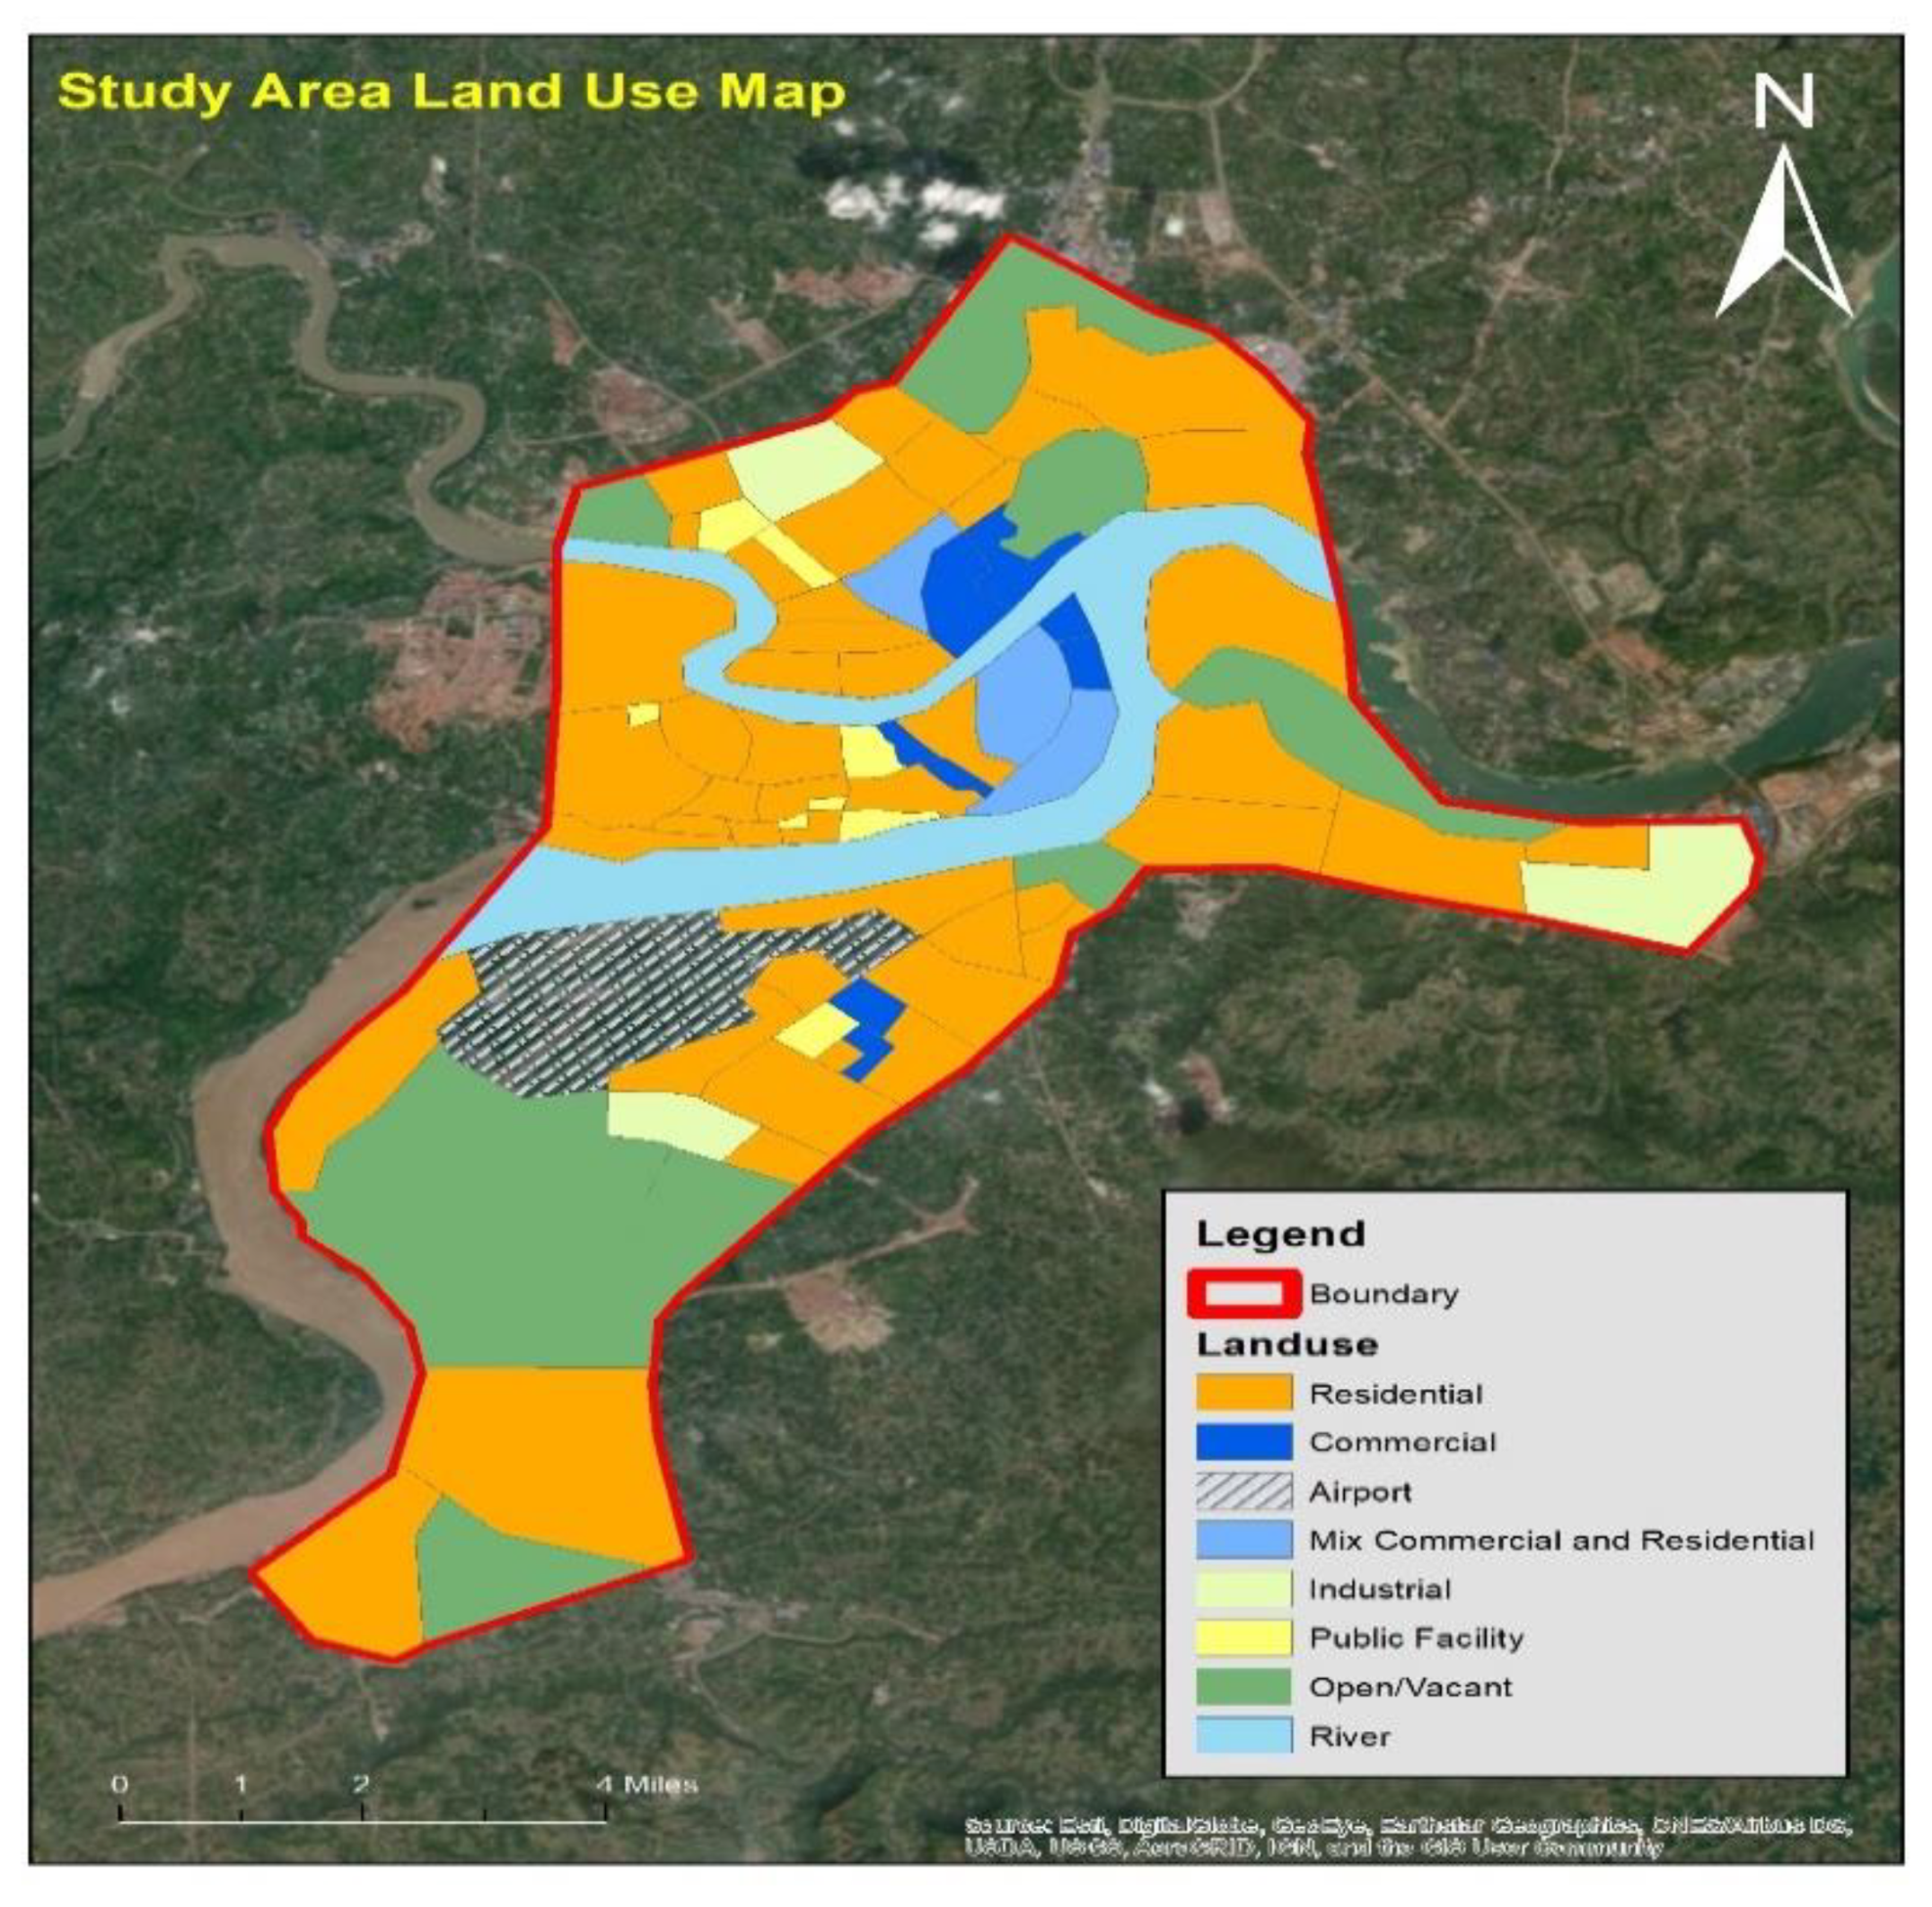
3. Study Area and Data Collection
4. Analysis of Descriptive Statistics and Violation Hotspots
5. Traffic Violation Prediction Using Machine Learning (ML) Methods
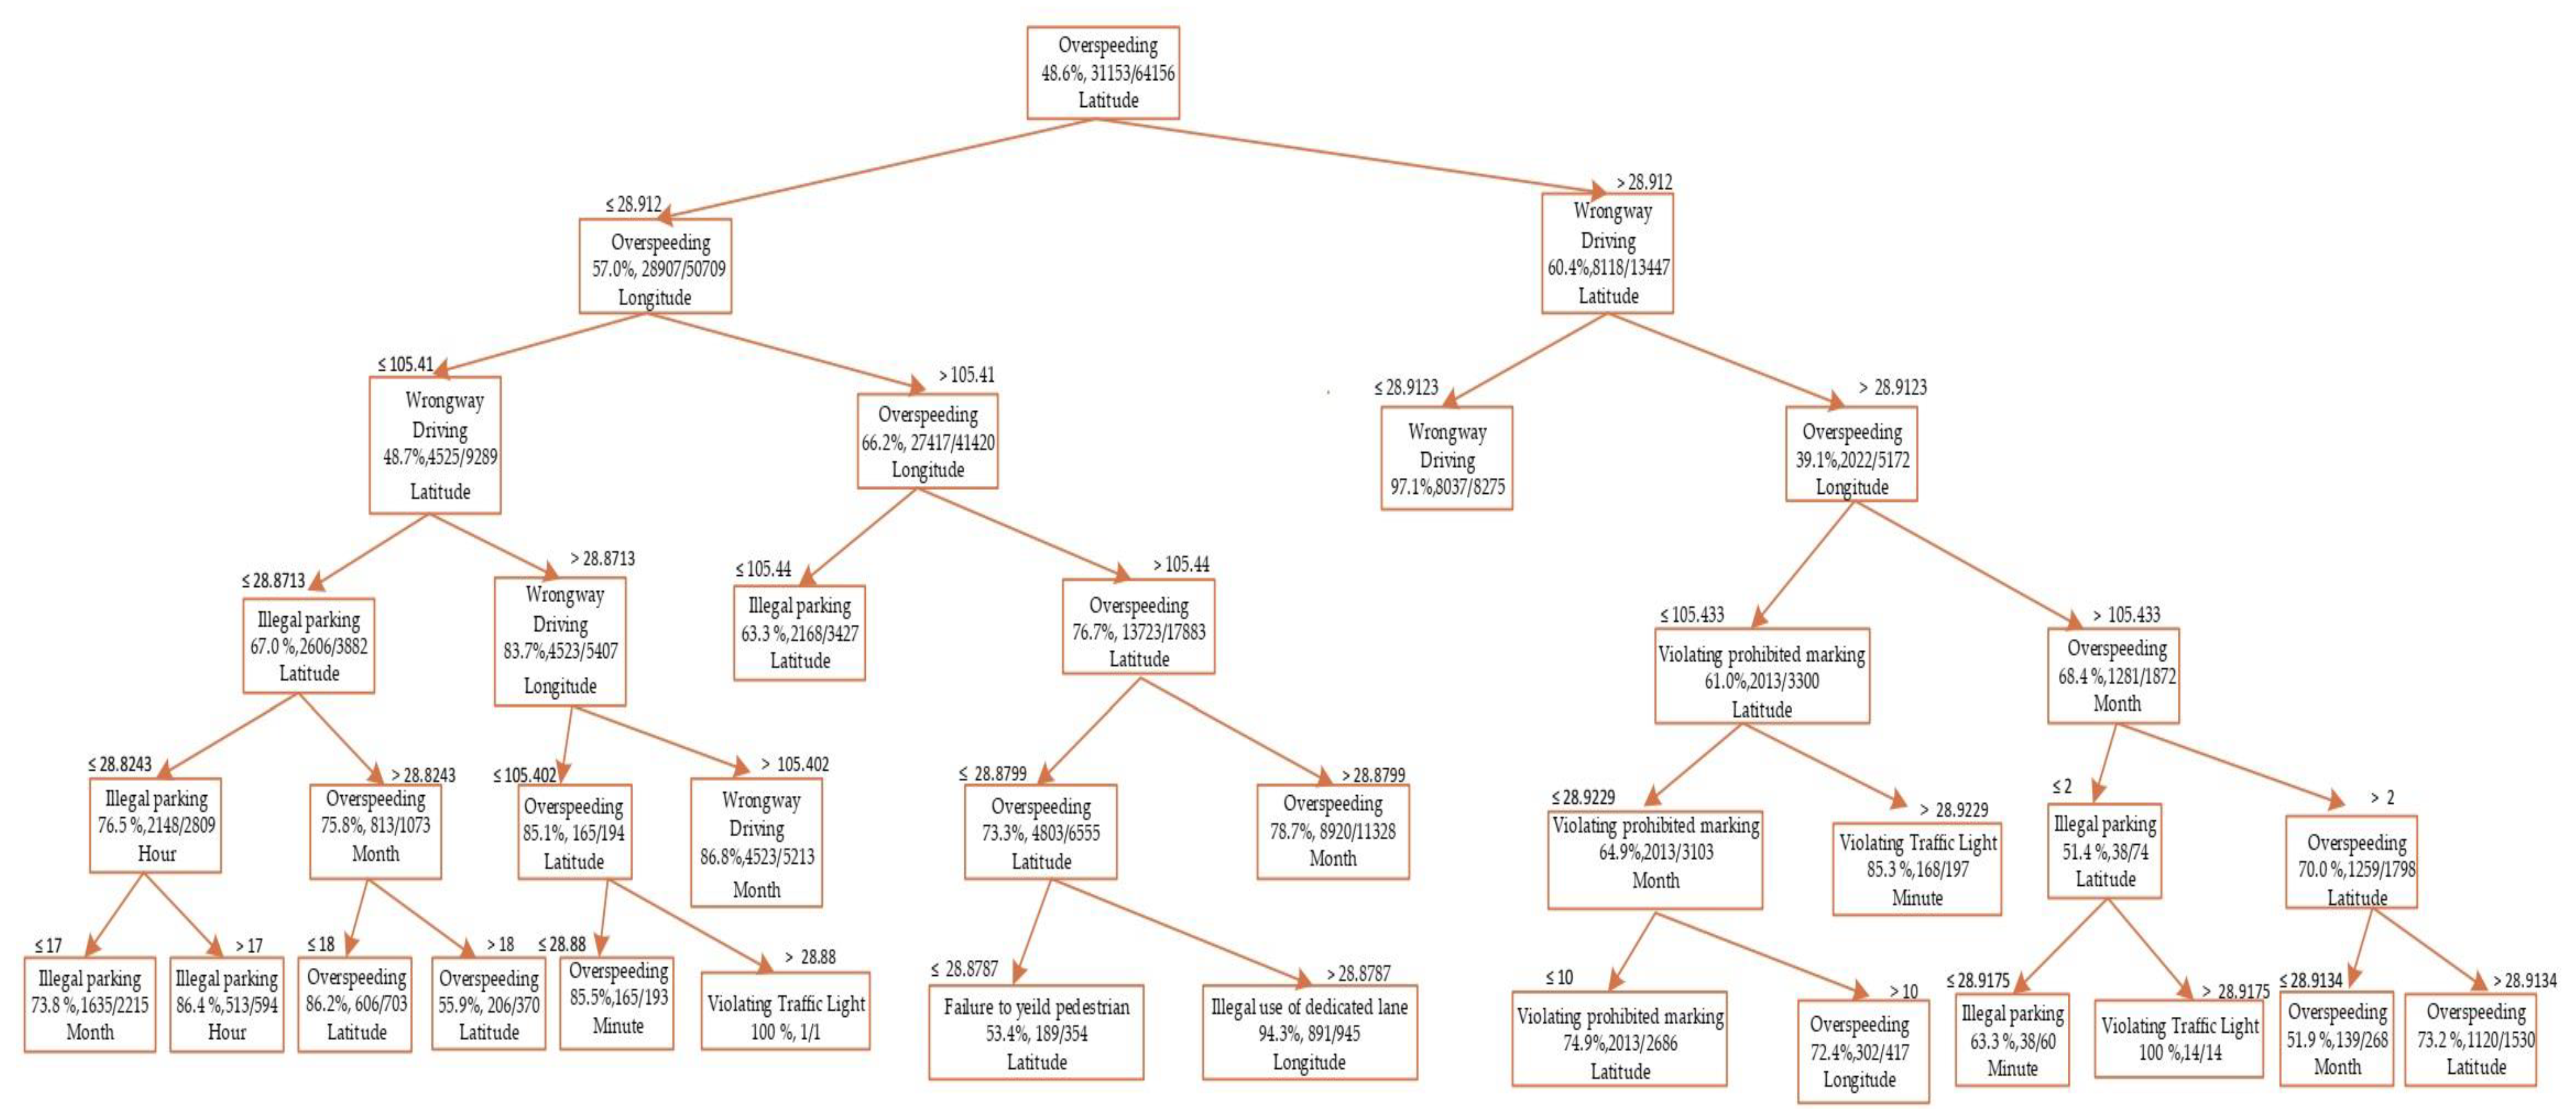
5.1. Decisions Tree (DT)
5.2. AdaBoost
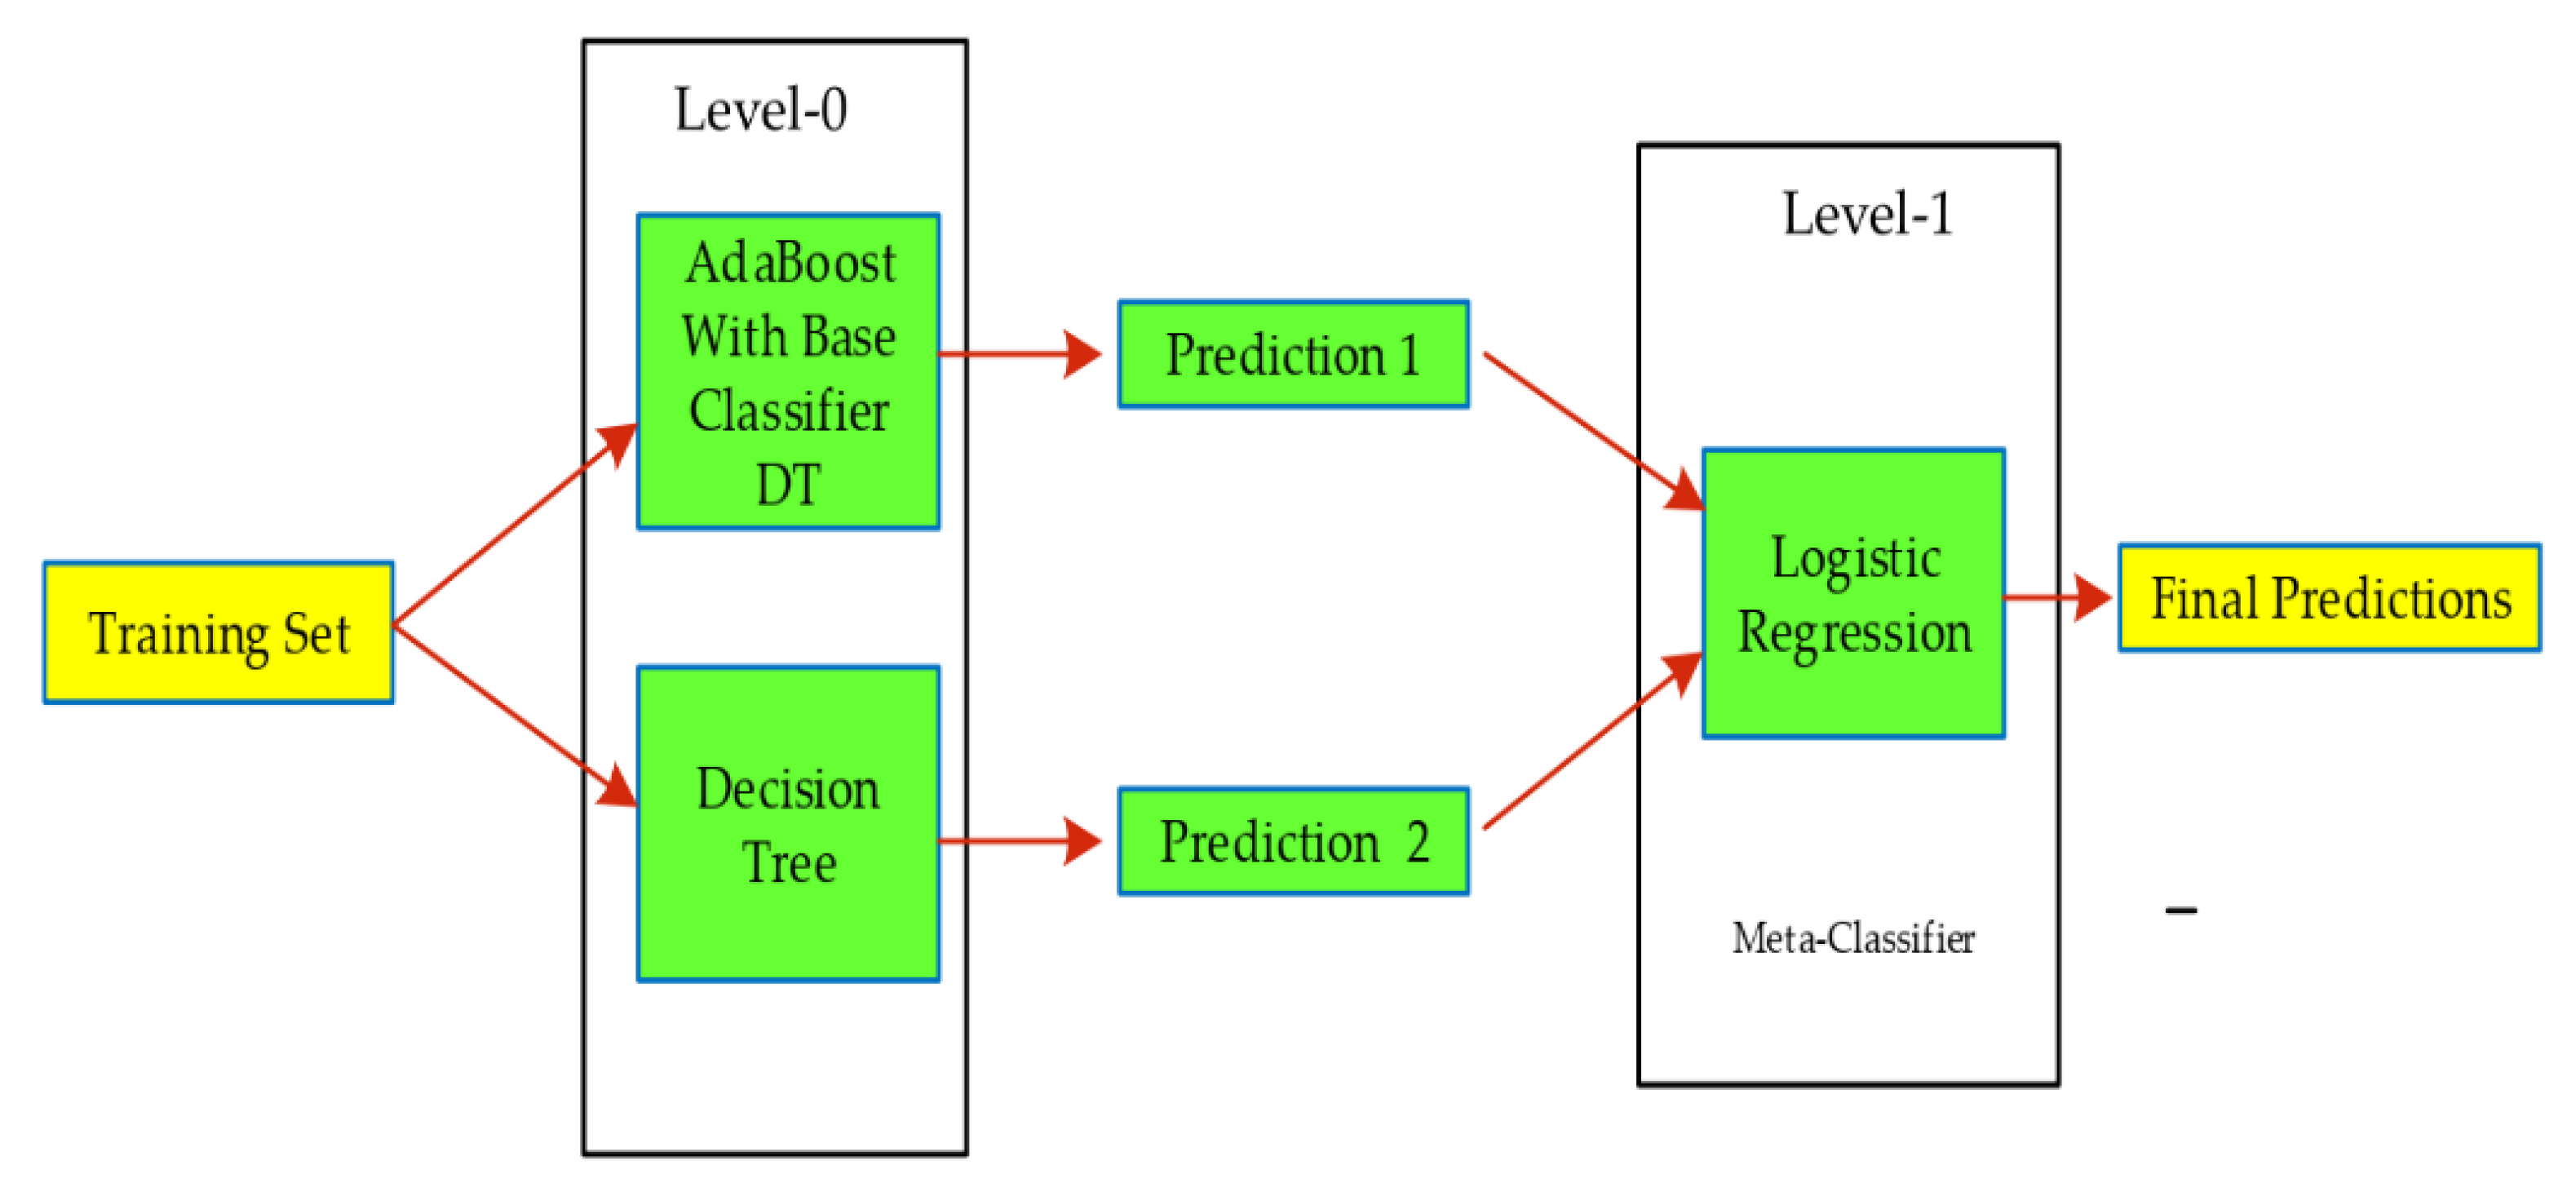
5.3. Stack Model
| Algorithm 1. pseudo code of stack model |
| Input violations dataset, |
| , represent attribute vector, is number of observations, and where is for predictions or outcomes. |
| Level-0 classification models |
| Level-1 meta learner, |
| Ensemble size , |
| For |
| = creation of Level-0 models (Creating Level-0 models from dataset) |
| End |
| Creation of New dataset, |
| For |
| For |
| To make prediction with meta learner or classifier |
| End |
| (Combining with different classifiers) |
| End |
| Training meta classifier or Level-1 with new dataset |
| End |
| Outcomes: |
| Return final predictions from . |
5.4. Model’s Evaluation Metrics
6. Results and Discussions
6.1. Model’s Comparison
6.2. Proposed Mitigation Strategies
7. Conclusions
Author Contributions
Funding
Acknowledgments
Conflicts of Interest
References
- Lawton, R.; Parker, D.; Stradling, S.G.; Manstead, A.S.R. Predicting road traffic accidents: The role of social deviance and violations. Br. J. Psychol. 1997, 88, 249–262. [Google Scholar] [CrossRef]
- Yang, J.; Du, F.; Qu, W.; Gong, Z.; Sun, X. Effects of personality on risky driving behavior and accident involvement for Chinese drivers. Traffic Inj. Prev. 2013, 14, 565–571. [Google Scholar] [CrossRef] [PubMed]
- World Health Organization. Global Status Report on Road Safety 2018: Summary; World Health Organization: Geneva, Switzerland, 2018. [Google Scholar]
- National Bureau of Statistics of China. China Statistical Year Book; 2019. Available online: http://www.stats.gov.cn/tjsj/ndsj/2019/indexeh.htm (accessed on 6 May 2020).
- View, C. Special Report: NPC, CPPCC Annual Sessions 2008. Available online: http://news.xinhuanet.com/english/2008-03/08/content_7746470.htm (accessed on 8 March 2008).
- Wang, L.; Yu, C.; Zhang, Y.; Luo, L.; Zhang, G. An analysis of the characteristics of road traffic injuries and a prediction of fatalities in China from 1996 to 2015. Traffic Inj. Prev. 2018, 19, 749–754. [Google Scholar] [CrossRef] [PubMed]
- Jamal, A.; Rahman, M.T.; Al-Ahmadi, H.M.; Mansoor, U. The dilemma of road safety in the eastern province of Saudi Arabia: Consequences and prevention strategies. Int. J. Environ. Res. Public Health 2020, 17, 157. [Google Scholar] [CrossRef] [Green Version]
- Ako, E. Impact of Road Safety and Accidents Prevention in Cameroon. Available online: https://ssrn.com/abstract=3404589 (accessed on 15 June 2019).
- Qiu, L.; Nixon, W.A. Effects of adverse weather on traffic crashes: Systematic review and meta-analysis. Transp. Res. Rec. 2008, 2055, 139–146. [Google Scholar] [CrossRef]
- Norris, F.H.; Matthews, B.A.; Riad, J.K. Characterological, situational, and behavioral risk factors for motor vehicle accidents: A prospective examination. Accid. Anal. Prev. 2000, 32, 505–515. [Google Scholar] [CrossRef]
- Abdel-Aty, M.A.; Radwan, A.E. Modeling traffic accident occurrence and involvement. Accid. Anal. Prev. 2000, 32, 633–642. [Google Scholar] [CrossRef]
- Ullah, I.; Jamal, A.; Subhan, F. Public perception of autonomous car: A case study for Pakistan. Adv. Transp. Stud. 2019, 49, 145–154. [Google Scholar]
- Morrow, P.C.; Crum, M.R. Antecedents of fatigue, close calls, and crashes among commercial motor-vehicle drivers. J. Saf. Res. 2004, 35, 59–69. [Google Scholar] [CrossRef]
- WHO | Violence and Injury Prevention. World Health Organization: Global Status Report on Road Safety 2015; World Health Organization: Geneva, Switzerland, 2015. [Google Scholar]
- Alver, Y.; Demirel, M.C.; Mutlu, M.M. Interaction between socio-demographic characteristics: Traffic rule violations and traffic crash history for young drivers. Accid. Anal. Prev. 2014, 72, 95–104. [Google Scholar] [CrossRef]
- Shi, J.; Tao, L.; Li, X.; Xiao, Y.; Atchley, P. A survey of taxi drivers’ aberrant driving behavior in Beijing. J. Transp. Saf. Secur. 2014, 6, 34–43. [Google Scholar] [CrossRef]
- Tseng, C.-M. Operating styles, working time and daily driving distance in relation to a taxi driver’s speeding offenses in Taiwan. Accid. Anal. Prev. 2013, 52, 1–8. [Google Scholar] [CrossRef]
- Rosenbloom, T.; Shahar, A. Differences between taxi and nonprofessional male drivers in attitudes towards traffic-violation penalties. Transp. Res. Part F Traffic Psychol. Behav. 2007, 10, 428–435. [Google Scholar] [CrossRef]
- Nguyen-Phuoc, D.Q.; Nguyen, H.A.; De Gruyter, C.; Su, D.N.; Nguyen, V.H. Exploring the prevalence and factors associated with self-reported traffic crashes among app-based motorcycle taxis in Vietnam. Transp. Policy 2019, 81, 68–74. [Google Scholar] [CrossRef]
- Zahid, M.; Chen, Y.; Jamal, A.; Memon, M.Q. Short Term Traffic State Prediction via Hyperparameter Optimization Based Classifiers. Sensors 2020, 20, 685. [Google Scholar] [CrossRef] [Green Version]
- Jamal, A.; Rahman, M.T.; Al-Ahmadi, H.M.; Ullah, I.M.; Zahid, M. Intelligent Intersection Control for Delay Optimization: Using Meta-Heuristic Search Algorithms. Sustainability 2020, 12, 1896. [Google Scholar] [CrossRef] [Green Version]
- Zahid, M.; Chen, Y.; Jamal, A. Freeway Short-Term Travel Speed Prediction Based on Data Collection Time-Horizons: A Fast Forest Quantile Regression Approach. Sustainability 2020, 12, 646. [Google Scholar] [CrossRef] [Green Version]
- Harrington, D.M.; Mcbride, R.S. Traffic violations by type, age, sex, and marital status. Accid. Anal. Prev. 1970, 2, 67–79. [Google Scholar] [CrossRef]
- Clarke, D.D.; Ward, P.; Bartle, C.; Truman, W. Work-related road traffic collisions in the UK. Accid. Anal. Prev. 2009, 41, 345–351. [Google Scholar] [CrossRef] [PubMed]
- Al-Ahmadi, H.M.; Jamal, A.; Reza, I.; Assi, K.J.; Ahmed, S.A. Using Microscopic Simulation-Based Analysis to Model Driving Behavior: A Case Study of Khobar-Dammam in Saudi Arabia. Sustainability 2019, 11, 3018. [Google Scholar] [CrossRef] [Green Version]
- Johnson, N.J.; Sorlie, P.D.; Backlund, E. The impact of specific occupation on mortality in the US National Longitudinal Mortality Study. Demography 1999, 36, 355–367. [Google Scholar] [CrossRef] [PubMed]
- La, Q.N.; Lee, A.H.; Meuleners, L.B.; Van Duong, D. Prevalence and factors associated with road traffic crash among taxi drivers in Hanoi, Vietnam. Accid. Anal. Prev. 2013, 50, 451–455. [Google Scholar] [CrossRef] [PubMed]
- Lam, L.T. Environmental factors associated with crash-related mortality and injury among taxi drivers in New South Wales, Australia. Accid. Anal. Prev. 2004, 36, 905–908. [Google Scholar] [CrossRef] [PubMed]
- Corfitsen, M.T. Tiredness and visual reaction time among nighttime cab drivers: A roadside survey. Accid. Anal. Prev. 1993, 25, 667–673. [Google Scholar] [CrossRef]
- Dalziel, J.R.; Job, R.F.S. Motor vehicle accidents, fatigue and optimism bias in taxi drivers. Accid. Anal. Prev. 1997, 29, 489–494. [Google Scholar] [CrossRef]
- Maag, U.; Vanasse, C.; Dionne, G.; Laberge-Nadeau, C. Taxi drivers’ accidents: How binocular vision problems are related to their rate and severity in terms of the number of victims. Accid. Anal. Prev. 1997, 29, 217–224. [Google Scholar] [CrossRef]
- Wu, J.; Yan, X.; Radwan, E. Discrepancy analysis of driving performance of taxi drivers and non-professional drivers for red-light running violation and crash avoidance at intersections. Accid. Anal. Prev. 2016, 91, 1–9. [Google Scholar] [CrossRef]
- Burns, P.C.; Wilde, G.J.S. Pergamon Risk Taking in Male Taxi Drivers: Relationships among Personality, Observational Data and Driver Records. Personal. Individ. Differ. 1995, 18, 268–278. [Google Scholar] [CrossRef]
- Peltzer, K.; Renner, W. Superstition, risk-taking and risk perception of accidents among South African taxi drivers. Accid. Anal. Prev. 2003, 35, 619–623. [Google Scholar] [CrossRef]
- Routley, V.; Ozanne-Smith, J.; Qin, Y.; Wu, M. Taxi driver seat belt wearing in Nanjing, China. J. Saf. Res. 2009, 40, 449–454. [Google Scholar] [CrossRef]
- Cheng, A.S.K.; Ting, K.H.; Liu, K.P.Y.; Ba, Y. Impulsivity and risky decision making among taxi drivers in Hong Kong: An event-related potential study. Accid. Anal. Prev. 2016, 95, 387–394. [Google Scholar] [CrossRef] [PubMed]
- Steg, L.; van Brussel, A. Accidents, aberrant behaviours, and speeding of young moped riders. Transp. Res. Part F Traffic Psychol. Behav. 2009, 12, 503–511. [Google Scholar] [CrossRef]
- Yilmaz, V.; Çelik, H.E. Risky driving attitudes and self-reported traffic violations among Turkish drivers: The case of Eskişehir. Doğuş Üniv. Derg. 2011, 7, 127–138. [Google Scholar] [CrossRef] [Green Version]
- Cheng, Z.; Lu, J.; Zu, Z.; Li, Y. Speeding Violation Type Prediction Based on Decision Tree Method: A Case Study in Wujiang, China. J. Adv. Transp. 2019, 2019. [Google Scholar] [CrossRef]
- Cooper, P.J. The relationship between speeding behaviour (as measured by violation convictions) and crash involvement. J. Saf. Res. 1997, 28, 83–95. [Google Scholar] [CrossRef]
- Mesken, J.; Lajunen, T.; Summala, H. Interpersonal violations, speeding violations and their relation to accident involvement in Finland. Ergonomics 2002, 45, 469–483. [Google Scholar] [CrossRef]
- Aarts, L.; Van Schagen, I. Driving speed and the risk of road crashes: A review. Accid. Anal. Prev. 2006, 38, 215–224. [Google Scholar] [CrossRef]
- Viallon, V.; Laumon, B. Fractions of fatal crashes attributable to speeding: Evolution for the period 2001–2010 in France. Accid. Anal. Prev. 2013, 52, 250–256. [Google Scholar] [CrossRef]
- Gargoum, S.A.; El-Basyouny, K. Exploring the association between speed and safety: A path analysis approach. Accid. Anal. Prev. 2016, 93, 32–40. [Google Scholar] [CrossRef]
- Doecke, S.D.; Kloeden, C.N.; Dutschke, J.K.; Baldock, M.R.J. Safe speed limits for a safe system: The relationship between speed limit and fatal crash rate for different crash types. Traffic Inj. Prev. 2018, 19, 404–408. [Google Scholar] [CrossRef]
- Meng, F.; Li, S.; Cao, L.; Li, M.; Peng, Q.; Wang, C.; Zhang, W. Driving fatigue in professional drivers: A survey of truck and taxi drivers. Traffic Inj. Prev. 2015, 16, 474–483. [Google Scholar] [CrossRef] [PubMed]
- Newnam, S.; Mamo, W.G.; Tulu, G.S. Exploring differences in driving behaviour across age and years of education of taxi drivers in Addis Ababa, Ethiopia. Saf. Sci. 2014, 68, 1–5. [Google Scholar] [CrossRef] [Green Version]
- Mani, K.; Mun, S.W.; Hayati, K. Speeding among taxi drivers in Selangor, Malaysia. Inj. Prev. 2010, 16, A14. [Google Scholar] [CrossRef] [Green Version]
- Sagberg, F.; Ingebrigtsen, R. Effects of a penalty point system on traffic violations. Accid. Anal. Prev. 2018, 110, 71–77. [Google Scholar] [CrossRef] [PubMed]
- Esmaili, A.; Mikaeili, N. The study of the relationship between the level of economic welfare and driving violations (a case study of Urmia). Traffic Manag. Stud. 2010, 5, 1–18. [Google Scholar]
- Ivers, R.Q.; Chen, H.Y.; Boufous, S.; Senserrick, T.; Stevenson, M.R.; Williamson, A.; Woodward, M.; Norton, R. Driving offences and risk of subsequent crash in novice drivers: The DRIVE Study. Inj. Prev. 2010, 16, A67. [Google Scholar] [CrossRef] [Green Version]
- Farooq, D.; Moslem, S.; Faisal Tufail, R.; Ghorbanzadeh, O.; Duleba, S.; Maqsoom, A.; Blaschke, T. Analyzing the importance of driver behavior criteria related to road safety for different driving cultures. Int. J. Environ. Res. Public Health 2020, 17, 1893. [Google Scholar] [CrossRef] [PubMed] [Green Version]
- Vahedi, J.; Shariat Mohaymany, A.; Tabibi, Z.; Mehdizadeh, M. Aberrant driving behaviour, risk involvement, and their related factors among taxi drivers. Int. J. Environ. Res. Public Health 2018, 15, 1626. [Google Scholar] [CrossRef] [PubMed] [Green Version]
- Oppenheim, I.; Oron-Gilad, T.; Parmet, Y.; Shinar, D. Can traffic violations be traced to gender-role, sensation seeking, demographics and driving exposure? Transp. Res. Part F traffic Psychol. Behav. 2016, 43, 387–395. [Google Scholar] [CrossRef]
- Das, S.; Sun, X.; Wang, F.; Leboeuf, C. Estimating likelihood of future crashes for crash-prone drivers. J. Traffic Transp. Eng. (English Ed.) 2015, 2, 145–157. [Google Scholar] [CrossRef] [Green Version]
- Gebers, M.A.; Peck, R.C. Using traffic conviction correlates to identify high accident-risk drivers. Accid. Anal. Prev. 2003, 35, 903–912. [Google Scholar] [CrossRef]
- Kim, D.-H.; Ramjan, L.M.; Mak, K.-K. Prediction of vehicle crashes by drivers’ characteristics and past traffic violations in Korea using a zero-inflated negative binomial model. Traffic Inj. Prev. 2016, 17, 86–90. [Google Scholar] [CrossRef] [PubMed]
- Nishida, Y. Analyzing accidents and developing elderly driver-targeted measures based on accident and violation records. IATSS Res. 2015, 39, 26–35. [Google Scholar] [CrossRef] [Green Version]
- Wang, C.; Liu, L.; Xu, C.; Lv, W. Predicting future driving risk of crash-involved drivers based on a systematic machine learning framework. Int. J. Environ. Res. Public Health 2019, 16, 334. [Google Scholar] [CrossRef] [Green Version]
- Zhang, Z. Research on the taxi traffic accident and violation identification model. In Proceedings of the 2010 2nd International Asia Conference on Informatics in Control, Automation and Robotics (CAR 2010), Wuhan, China, 6–7 March 2010; Volume 2, pp. 533–536. [Google Scholar]
- Rahman, M.T.; Nahiduzzaman, K.M. Examining the walking accessibility, willingness, and travel conditions of residents in saudi cities. Int. J. Environ. Res. Public Health 2019, 16, 545. [Google Scholar] [CrossRef] [Green Version]
- Demšar, J.; Curk, T.; Erjavec, A.; Gorup, Č.; Hočevar, T.; Milutinovič, M.; Možina, M.; Polajnar, M.; Toplak, M.; Starič, A. Orange: Data mining toolbox in Python. J. Mach. Learn. Res. 2013, 14, 2349–2353. [Google Scholar]
- Freund, Y.; Schapire, R.E. Experiments with a new boosting algorithm. In Proceedings of the icml; Citeseer: Bari, Italy, 1996; Volume 96, pp. 148–156. [Google Scholar]
- Wolpert, D.H. Stacked generalization. Neural Netw. 1992, 5, 241–259. [Google Scholar] [CrossRef]
- Hastie, T.; Rosset, S.; Zhu, J.; Zou, H. Multi-class adaboost. Stat. Interface 2009, 2, 349–360. [Google Scholar] [CrossRef] [Green Version]
- Hallmark, S.; Oneyear, N.; McDonald, T. Toolbox of Countermeasures to Reduce Red Light Running (No. InTrans Project 10-386); Center for Transportation Research and Education, Iowa State University: Ames, IA, USA, 2012; Available online: http://www.intrans.iastate.edu/research/documents/research-reports/RLR_toolbox_w_cvr.pdf (accessed on 6 May 2020).
- Bonneson, J.A.; Zimmerman, K.; Brewer, M.A. Engineering Countermeasures to Reduce Red-Light-Running; Report No. FHWA/TX-03/4027-2; Texas Transportation Insitiute, Texas A & M University System College: Austin, TX, USA, 2002. [Google Scholar]
- Sayer, I.A.; Palmer, C.J.; Murray, G.; Guy, J. Improving road safety education in developing countries. TRL Rep. 1997, 265, 14P+A p. [Google Scholar]
- Goodwin, A.H.; Thomas, L.; Kirley, B.; Hall, W.; O’Brien, N.P.; Hill, K. Countermeasures That Work: A Highway Safety Countermeasure Guide for State Highway Safety Offices: (Report No. DOT HS 812 202); National Highway Traffic Safety Administration: Washington, DC, USA, 2015.
- Jiang, H.; Xu, H.; Li, H.; Li, X. A Research on Traffic Accident of Over-Speeding Vehicle on Expressway. Commun. Transp. Syst. Eng. Inf. 2003, 3, 49–51. [Google Scholar]
- Dablanc, L. City distribution, a key element of the urban economy: Guidelines for practitioners. In City Distribution and Urban Freight Transport: Multiple Perspectives; Edward Elgar: Cheltenham, UK, 2011; pp. 13–36. [Google Scholar]


| Type of Violation | Count of Type of Violation | Percentage of Total Violation | Variable Type |
|---|---|---|---|
| Over-speeding | 31,153 | 48.56% | Response |
| Illegal parking | 12,878 | 20.07% | Response |
| Wrong way driving | 12,687 | 19.77% | Response |
| Violation of Prohibited road markings | 4174 | 6.51% | Response |
| Illegal use of dedicated lane | 1381 | 2.15% | Response |
| Failure to yield pedestrian | 1245 | 1.94% | Response |
| Violation of traffic signals/lights | 638 | 0.99% | Response |
| Location | |||
| Longitude | 64,156 | - | Predictor |
| Latitude | 64,156 | - | |
| Hours of the day | |||
| Peak hours (9:00 am–10:00 am, 15:00 pm–16:00 pm) | 33,137 | 51.65% | Predictor |
| Off-peak hours (11:00 am–14:00 pm, 17:00 pm–8:00 am) | 31,019 | 48.35% | |
| Season | |||
| Autumn | 19,546 | 30.47% | Predictor |
| Summer | 17,760 | 27.68% | |
| Winter | 14,863 | 23.17% | |
| Spring | 11,987 | 18.68% | |
| Week | |||
| Working day | 48,461 | 75.54% | Predictor |
| Weekend | 15,692 | 24.46% |
| Actual Condition | Predicted Condition | |
|---|---|---|
| Positive | Negative | |
| Positive | True Positives (TP) | True Negatives (TN) |
| Negative | False positives (FP) | False Negatives (FN) |
| Actual | Predicted | |||||||
|---|---|---|---|---|---|---|---|---|
| Pedestrian | Illegal Parking | Illegal Use of Dedicated Lane | Over-Speeding | Prohibited Markings Violation | Signal Violation | Wrong-Way Driving | Precision | |
| Pedestrian | 71.7% | 1.1% | 0.1% | 0.8% | 0.2% | 0.2% | 0.0% | 71.7% |
| Illegal parking | 8.9% | 72.5% | 0.0% | 12.0% | 1.9% | 0.2% | 0.3% | 72.5% |
| Illegal use of dedicated lane | 0.2% | 0.1% | 99.6% | 0.0% | 0.0% | 0.0% | 0.0% | 99.6% |
| Over-speeding | 18.7% | 25.2% | 0.1% | 85.4% | 7.7% | 0.8% | 1.4% | 85.4% |
| Prohibited markings violation | 0.4% | 0.9% | 0.1% | 1.1% | 88.0% | 2.8% | 0.4% | 88.0% |
| Signal violation | 0.1% | 0.1% | 0.0% | 0.1% | 0.7% | 60.6% | 2.0% | 60.6% |
| Wrong-way driving | 0.0% | 0.3% | 0.0% | 0.6% | 1.4% | 35.4% | 95.9% | 95.9% |
| Recall | 67.5% | 68.5% | 98.4% | 87.8% | 86.9% | 48.0% | 96.4% |
| Actual | Predicted | |||||||
|---|---|---|---|---|---|---|---|---|
| Pedestrian | Illegal Parking | Illegal Use of Dedicated Lane | Over-Speeding | Prohibited Markings Violation | Signal Violation | Wrong-Way Driving | Precision | |
| Pedestrian | 69.6% | 0.9% | 0.1% | 0.7% | 0.2% | 0.4% | 0.0% | 69.6% |
| Illegal parking | 8.9% | 70.3% | 0.0% | 11.8% | 2.3% | 0.6% | 0.3% | 70.9% |
| Illegal use of dedicated lane | 0.2% | 0.0% | 99.6% | 0.0% | 0.0% | 0.0% | 0.0% | 99.6% |
| Over-speeding | 19.2% | 27.8% | 0.1% | 86.4% | 8.5% | 1.2% | 1.9% | 86.4% |
| Prohibited markings violation | 0.8% | 0.7% | 0.2% | 1.0% | 86.7% | 3.2% | 0.4% | 86.7% |
| Signal violation | 0.2% | 0.0% | 0.0% | 0.0% | 0.8% | 62.4% | 2.1% | 62.4% |
| Wrong-way driving | 0.0% | 0.1% | 0.0% | 0.1% | 1.5% | 35.4% | 95.3% | 95.3% |
| Recall | 79.0% | 69.6% | 99.3% | 85.9% | 88.3% | 49.2% | 97.9% |
| Actual | Predicted | |||||||
|---|---|---|---|---|---|---|---|---|
| Pedestrian | Illegal Parking | Illegal Use of Dedicated Lane | Over-Speeding | Prohibited Road Markings | Signal Violation | Wrong-Way Driving | Precision | |
| Pedestrian | 74.1% | 1.1% | 0.1% | 0.9% | 0.2% | 0.5% | 0.0% | 74.1% |
| Illegal Parking | 8.9% | 75.8% | 0.0% | 12.6% | 2.1% | 0.5% | 0.3% | 75.8% |
| Illegal use of dedicated lane | 0.2% | 0.0% | 99.6% | 0.0% | 0.0% | 0.0% | 0.0% | 99.6% |
| Over-speeding | 19.2% | 27.8% | 0.1% | 85.3% | 7.5% | 1.2% | 1.9% | 85.3% |
| Prohibited road markings | 0.8% | 0.7% | 0.2% | 1.0% | 87.9% | 3.2% | 0.4% | 87.9% |
| Signal violation | 0.1% | 0.0% | 0.0% | 0.0% | 0.8% | 68.4% | 2.3% | 68.4% |
| Wrong-way driving | 0.0% | 0.2% | 0.0% | 0.1% | 1.5% | 26% | 95.2% | 95.2% |
| Recall | 64.7% | 66.3% | 99.3% | 89.6% | 87.4% | 46.2% | 98.3% |
© 2020 by the authors. Licensee MDPI, Basel, Switzerland. This article is an open access article distributed under the terms and conditions of the Creative Commons Attribution (CC BY) license (http://creativecommons.org/licenses/by/4.0/).
Share and Cite
Zahid, M.; Chen, Y.; Khan, S.; Jamal, A.; Ijaz, M.; Ahmed, T. Predicting Risky and Aggressive Driving Behavior among Taxi Drivers: Do Spatio-Temporal Attributes Matter? Int. J. Environ. Res. Public Health 2020, 17, 3937. https://0-doi-org.brum.beds.ac.uk/10.3390/ijerph17113937
Zahid M, Chen Y, Khan S, Jamal A, Ijaz M, Ahmed T. Predicting Risky and Aggressive Driving Behavior among Taxi Drivers: Do Spatio-Temporal Attributes Matter? International Journal of Environmental Research and Public Health. 2020; 17(11):3937. https://0-doi-org.brum.beds.ac.uk/10.3390/ijerph17113937
Chicago/Turabian StyleZahid, Muhammad, Yangzhou Chen, Sikandar Khan, Arshad Jamal, Muhammad Ijaz, and Tufail Ahmed. 2020. "Predicting Risky and Aggressive Driving Behavior among Taxi Drivers: Do Spatio-Temporal Attributes Matter?" International Journal of Environmental Research and Public Health 17, no. 11: 3937. https://0-doi-org.brum.beds.ac.uk/10.3390/ijerph17113937