Physical Rehabilitation Needs in the BRICS Nations from 1990 to 2017: Cross-National Analyses Using Data from the Global Burden of Disease Study

 ,
,  ,
,
Abstract
:1. Introduction
- (1)
- How large are the physical rehabilitation needs in 2017 for each BRICS country (e.g., in nominal values, population-adjusted rates, age-standardized rates), and how have those values evolved since 1990?
- (2)
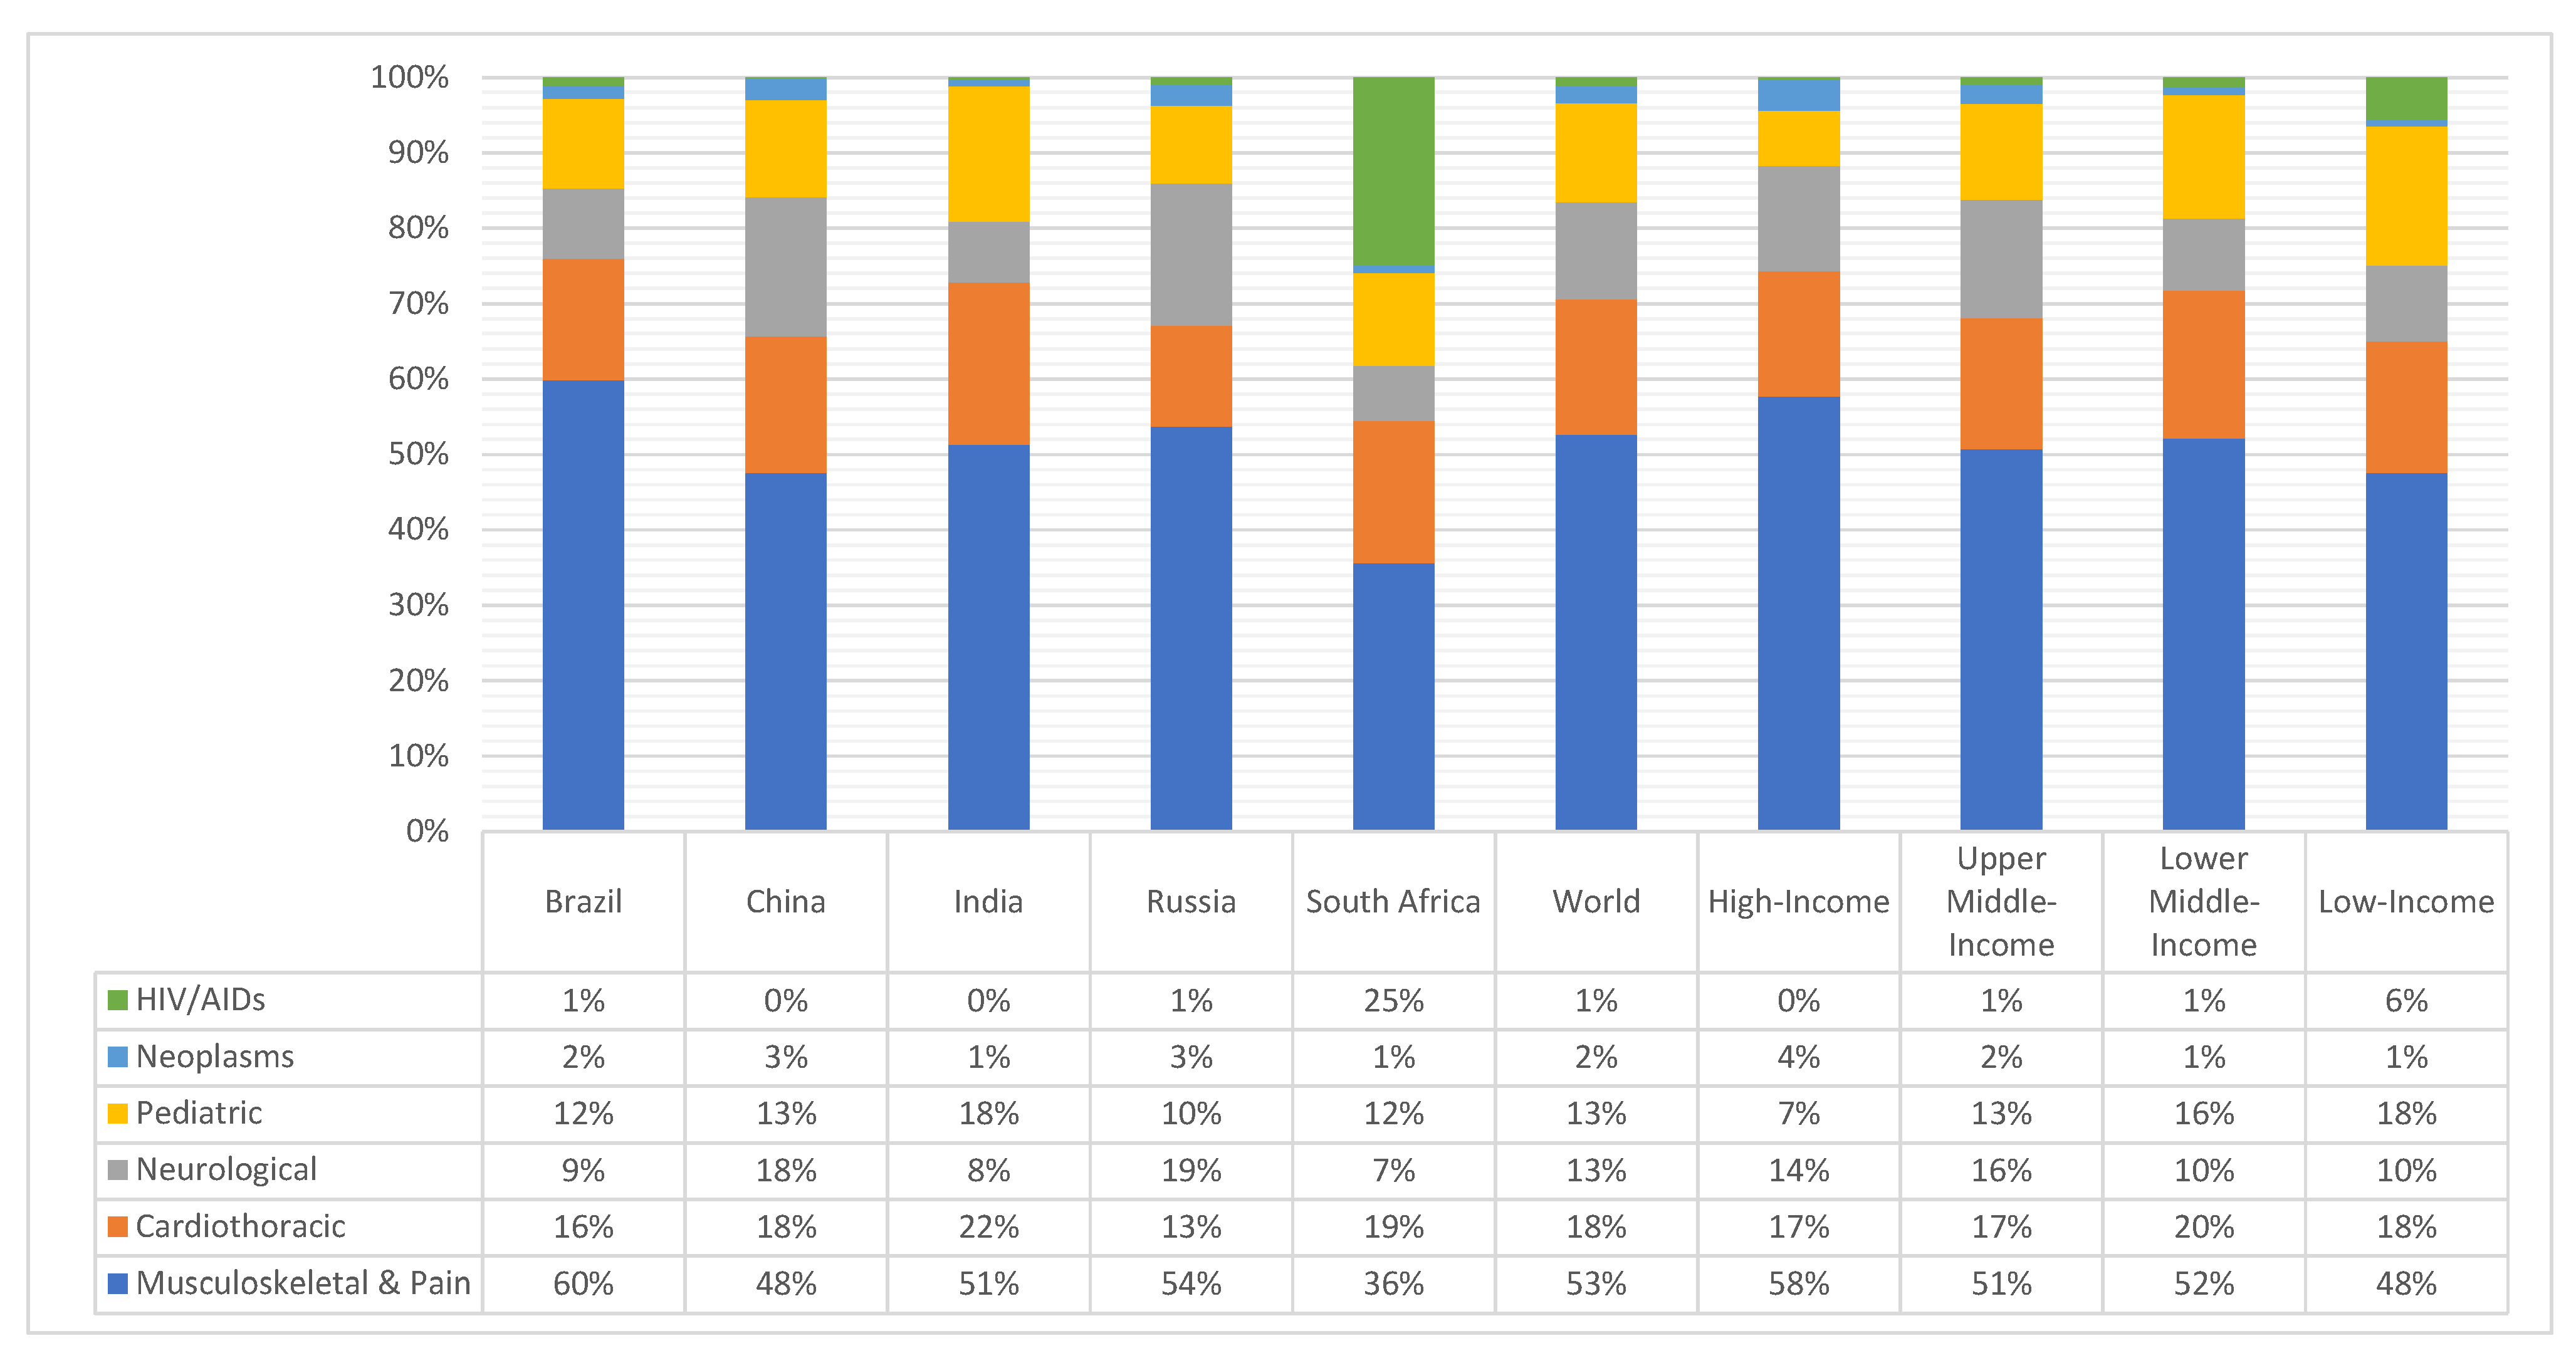
- Which condition groups (e.g., musculoskeletal, neurological, cardiothoracic) account for the highest rates of physical rehabilitation need for each of the BRICS countries in 2017, and how have those values evolved since 1990?
2. Materials and Methods
3. Results
3.1. Total Physical Rehabilitation Needs
3.2. Needs by Condition Types
4. Discussion
Study Limitations
- First, YLDs from selected health conditions are but proxy indicators of physical rehabilitation needs, i.e., not a direct functional or impairments-based measure. Nonetheless, YLDs is the aggregative measure of non-fatal health loss from the prominent GBD study and includes variables such as the prevalence of conditions, the time lived with sequalae from the respective conditions, and weighted for the appraised severity of those sequelae.
- Second, the set of conditions whose YLDs likely benefit from rehabilitation were replicated from a previous study which systematically reviewed evidence linking those conditions to rehabilitation needs; [25] nonetheless, these conditions cannot be considered a fixed standard as the relevant conditions may change over time with the advancement of rehabilitation therapies and their scientific support. For example, the recent COVID-19 pandemic has been boosting new types of rehabilitation need (e.g., for respiratory therapy; for the rehabilitation for the post-intensive care syndrome) [83,84,85], which were not reflected in the data up to 2017.
- Third, YLD values (extracted from the GBD 2017) are only estimates based on the best-available evidence, not actual YLDs. The GBD 2017 is the most comprehensive epidemiological study to date, and the amount of data used to create those estimates is unprecedented [25,48]. Even so, the quality and the quantity of the underlying data for computing the GBD estimates vary across locations and in time within the same location, which in turn affects the precision of the YLD estimates. However, lower precision does not equate to bias toward over or under-estimation of YLDs for the earlier times or for the locations in which less or lower-quality data were available. At each cycle, the GBD study (e.g., the GBD 2017) apply the new data and more advanced estimation methods to re-calculate YLDs across locations and the entire time series (since 1990), not only the values for 2017.
- Fourth, most data obtained for the GBD study (e.g., in India) are from self-reports and hence many undiagnosed conditions might not be included within this data to represent the true picture. Hence results of this study could be a gross under-estimation of the problem, at least in the absolute values.
- Sixth, we do not supplement our analyses of physical rehabilitation ‘needs’ with indicators of physical rehabilitation ‘supply’ across nations, the other key element in the resources planning equation. In part, this follows the lack of available data. For example, the World Confederation of Physical Therapy reports data on the amount of practicing physical therapists per nations, as locally collected from authoritative sources or estimated by national associations (i.e., their member organizations) for a total of 89 countries, but unfortunately not from 3 of the analyzed countries (China, Russia, or India) [86].
5. Conclusions
Supplementary Materials
Author Contributions
Funding
Acknowledgments
Conflicts of Interest
References
- McBride, B.; Hawkes, S.; Buse, K. Soft power and global health: The sustainable development goals (SDGs) era health agendas of the G7, G20 and BRICS. BMC Public Health 2019, 19, 815. [Google Scholar] [CrossRef] [PubMed] [Green Version]
- Acharya, S.; Barber, S.L.; Lopez-Acuna, D.; Menabde, N.; Migliorini, L.; Molina, J.; Schwartlander, B.; Zurn, P. BRICS and global health. Bull. World Health Organ. 2014, 92, 386a. [Google Scholar] [CrossRef] [PubMed]
- Fan, V.Y.; Grepin, K.A.; Shen, G.C.; Chen, L. Tracking the flow of health aid from BRICS countries. Bull. World Health Organ. 2014, 92, 457–458. [Google Scholar] [CrossRef] [PubMed]
- Harmer, A.; Fleck, F. The BRICS countries: A new force in global health? Bull. World Health Organ. 2014, 92, 394–395. [Google Scholar] [CrossRef] [PubMed]
- Kickbusch, I. BRICS’ contributions to the global health agenda. Bull. World Health Organ. 2014, 92, 463–464. [Google Scholar] [CrossRef] [PubMed]
- McKee, M.; Marten, R.; Balabanova, D.; Watt, N.; Huang, Y.; Finch, A.P.; Fan, V.Y.; Van Damme, W.; Tediosi, F.; Missoni, E. BRICS’ role in global health and the promotion of universal health coverage: The debate continues. Bull. World Health Organ. 2014, 92, 452–453. [Google Scholar] [CrossRef] [PubMed]
- Watt, N.F.; Gomez, E.J.; McKee, M. Global health in foreign policy—And foreign policy in health? Evidence from the BRICS. Health Policy Plan. 2014, 29, 763–773. [Google Scholar] [CrossRef] [PubMed] [Green Version]
- Shajalal, M.; Xu, J.; Jing, J.; King, M.; Zhang, J.; Wang, P.; Bouey, J.; Cheng, F. China’s engagement with development assistance for health in Africa. Glob. Health Res. Policy 2017, 2, 24. [Google Scholar] [CrossRef] [PubMed] [Green Version]
- Liao, J.; Cheng, F.; Harris, A.; Xu, D. The new face of China’s foreign aid: Where do we go from here? Lancet 2018, 392, 636. [Google Scholar] [CrossRef] [Green Version]
- Barbosa da Silva Junior, J.; Desiraju, K.; Matsoso, P.; Minghui, R.; Salagay, O. BRICS cooperation in strategic health projects. Bull. World Health Organ. 2014, 92, 388. [Google Scholar] [CrossRef] [PubMed]
- Rao, K.D.; Petrosyan, V.; Araujo, E.C.; McIntyre, D. Progress towards universal health coverage in BRICS: Translating economic growth into better health. Bull. World Health Organ. 2014, 92, 429–435. [Google Scholar] [CrossRef] [PubMed]
- Jakovljevic, M.B.; Milovanovic, O. Growing Burden of Non-Communicable Diseases in the Emerging Health Markets: The Case of BRICS. Front. Public Health 2015, 3, 65. [Google Scholar] [CrossRef] [PubMed] [Green Version]
- India State-Level Disease Burden Initiative Collaborators. Nations within a nation: Variations in epidemiological transition across the states of India, 1990–2016 in the Global Burden of Disease Study. Lancet 2017, 390, 2437–2460. [Google Scholar] [CrossRef]
- Collaborators, G.R. The burden of disease in Russia from 1980 to 2016: A systematic analysis for the Global Burden of Disease Study 2016. Lancet 2018, 392, 1138–1146. [Google Scholar] [CrossRef] [Green Version]
- Baxter, A.J.; Charlson, F.J.; Cheng, H.G.; Shidhaye, R.; Ferrari, A.J.; Whiteford, H.A. Prevalence of mental, neurological, and substance use disorders in China and India: A systematic analysis. Lancet. Psychiatry 2016, 3, 832–841. [Google Scholar] [CrossRef]
- Collaborators, G.B. Burden of disease in Brazil, 1990–2016: A systematic subnational analysis for the Global Burden of Disease Study 2016. Lancet 2018, 392, 760–775. [Google Scholar] [CrossRef] [Green Version]
- Bollyky, T.J.; Templin, T.; Cohen, M.; Dieleman, J.L. Lower-Income Countries That Face The Most Rapid Shift In Noncommunicable Disease Burden Are Also The Least Prepared. Health Aff. 2017, 36, 1866–1875. [Google Scholar] [CrossRef] [PubMed]
- Kampfen, F.; Wijemunige, N.; Evangelista, B., Jr. Aging, non-communicable diseases, and old-age disability in low- and middle-income countries: A challenge for global health. Int. J. Public Health 2018, 63, 1011–1012. [Google Scholar] [CrossRef] [PubMed] [Green Version]
- Pillay-van Wyk, V.; Msemburi, W.; Laubscher, R.; Dorrington, R.E.; Groenewald, P.; Glass, T.; Nojilana, B.; Joubert, J.D.; Matzopoulos, R.; Prinsloo, M.; et al. Mortality trends and differentials in South Africa from 1997 to 2012: Second National Burden of Disease Study. Lancet. Glob. Health 2016, 4, e642–e653. [Google Scholar] [CrossRef] [Green Version]
- Martins-Melo, F.R.; Carneiro, M.; Ramos, A.N., Jr.; Heukelbach, J.; Ribeiro, A.L.P.; Werneck, G.L. The burden of Neglected Tropical Diseases in Brazil, 1990–2016: A subnational analysis from the Global Burden of Disease Study 2016. PLoS Negl. Trop. Dis. 2018, 12, e0006559. [Google Scholar] [CrossRef] [PubMed]
- Mujica, O.J.; Vazquez, E.; Duarte, E.C.; Cortez-Escalante, J.J.; Molina, J.; Barbosa da Silva Junior, J. Socioeconomic inequalities and mortality trends in BRICS, 1990–2010. Bull. World Health Organ. 2014, 92, 405–412. [Google Scholar] [CrossRef] [PubMed]
- Marten, R.; McIntyre, D.; Travassos, C.; Shishkin, S.; Longde, W.; Reddy, S.; Vega, J. An assessment of progress towards universal health coverage in Brazil, Russia, India, China, and South Africa (BRICS). Lancet 2014, 384, 2164–2171. [Google Scholar] [CrossRef] [Green Version]
- Chatterji, S.; Byles, J.; Cutler, D.; Seeman, T.; Verdes, E. Health, functioning, and disability in older adults—Present status and future implications. Lancet 2015, 385, 563–575. [Google Scholar] [CrossRef] [Green Version]
- Zeng, Y.; Feng, Q.; Hesketh, T.; Christensen, K.; Vaupel, J.W. Survival, disabilities in activities of daily living, and physical and cognitive functioning among the oldest-old in China: A cohort study. Lancet 2017, 389, 1619–1629. [Google Scholar] [CrossRef]
- Jesus, T.S.; Landry, M.D.; Hoenig, H. Global Need for Physical Rehabilitation: Systematic Analysis from the Global Burden of Disease Study 2017. Int. J. Environ. Res. Public Health 2019, 16. [Google Scholar] [CrossRef] [PubMed] [Green Version]
- Chang, A.Y.; Skirbekk, V.F.; Tyrovolas, S.; Kassebaum, N.J.; Dieleman, J.L. Measuring population ageing: An analysis of the Global Burden of Disease Study 2017. Lancet. Public Health 2019, 4, e159–e167. [Google Scholar] [CrossRef] [Green Version]
- World Report on Ageing and Health; World Health Organization: Geneva, Switzerland, 2015.
- Briggs, A.M.; Cross, M.J.; Hoy, D.G.; Sanchez-Riera, L.; Blyth, F.M.; Woolf, A.D.; March, L. Musculoskeletal Health Conditions Represent a Global Threat to Healthy Aging: A Report for the 2015 World Health Organization World Report on Ageing and Health. Gerontologist 2016, 56, S243–S255. [Google Scholar] [CrossRef] [PubMed] [Green Version]
- Hosseinpoor, A.R.; Bergen, N.; Kostanjsek, N.; Kowal, P.; Officer, A.; Chatterji, S. Socio-demographic patterns of disability among older adult populations of low-income and middle-income countries: Results from World Health Survey. Int. J. Public Health 2016, 61, 337–345. [Google Scholar] [CrossRef] [PubMed] [Green Version]
- GBD 2017 Mortality Collaborators. Global, regional, and national age-sex-specific mortality and life expectancy, 1950–2017: A systematic analysis for the Global Burden of Disease Study 2017. Lancet 2018, 392, 1684–1735. [Google Scholar] [CrossRef] [Green Version]
- GBD 2017 Population and Fertility Collaborators. Population and fertility by age and sex for 195 countries and territories, 1950–2017: A systematic analysis for the Global Burden of Disease Study 2017. Lancet 2018, 392, 1995–2051. [Google Scholar] [CrossRef] [Green Version]
- Ferretti, F.; Mariani, M. Sugar-sweetened beverage affordability and the prevalence of overweight and obesity in a cross section of countries. Glob. Health 2019, 15, 30. [Google Scholar] [CrossRef] [PubMed]
- Fox, A.; Feng, W.; Asal, V. What is driving global obesity trends? Globalization or “modernization”? Glob. Health 2019, 15, 32. [Google Scholar] [CrossRef] [PubMed] [Green Version]
- Cuevas Garcia-Dorado, S.; Cornselsen, L.; Smith, R.; Walls, H. Economic globalization, nutrition and health: A review of quantitative evidence. Glob. Health 2019, 15, 15. [Google Scholar] [CrossRef] [PubMed] [Green Version]
- Richardson, C.R.; Franklin, B.; Moy, M.L.; Jackson, E.A. Advances in rehabilitation for chronic diseases: Improving health outcomes and function. BMJ 2019, 365, l2191. [Google Scholar] [CrossRef] [PubMed] [Green Version]
- Afshin, A.; Forouzanfar, M.H.; Reitsma, M.B.; Sur, P.; Estep, K.; Lee, A.; Marczak, L.; Mokdad, A.H.; Moradi-Lakeh, M.; Naghavi, M.; et al. Health Effects of Overweight and Obesity in 195 Countries over 25 Years. N. Engl. J. Med. 2017, 377, 13–27. [Google Scholar] [CrossRef] [PubMed]
- Shukla, A.; Kumar, K.; Singh, A. Association between obesity and selected morbidities: A study of BRICS countries. PLoS ONE 2014, 9, e94433. [Google Scholar] [CrossRef] [PubMed] [Green Version]
- Wu, F.; Guo, Y.; Chatterji, S.; Zheng, Y.; Naidoo, N.; Jiang, Y.; Biritwum, R.; Yawson, A.; Minicuci, N.; Salinas-Rodriguez, A.; et al. Common risk factors for chronic non-communicable diseases among older adults in China, Ghana, Mexico, India, Russia and South Africa: The study on global AGEing and adult health (SAGE) wave 1. BMC Public Health 2015, 15, 88. [Google Scholar] [CrossRef] [PubMed] [Green Version]
- Liu, S.; Li, Y.; Zeng, X.; Wang, H.; Yin, P.; Wang, L.; Liu, Y.; Liu, J.; Qi, J.; Ran, S.; et al. Burden of Cardiovascular Diseases in China, 1990–2016: Findings From the 2016 Global Burden of Disease Study. JAMA Cardiol. 2019. [Google Scholar] [CrossRef] [PubMed]
- Charlson, F.J.; Baxter, A.J.; Cheng, H.G.; Shidhaye, R.; Whiteford, H.A. The burden of mental, neurological, and substance use disorders in China and India: A systematic analysis of community representative epidemiological studies. Lancet 2016, 388, 376–389. [Google Scholar] [CrossRef]
- Ouriques Martins, S.C.; Sacks, C.; Hacke, W.; Brainin, M.; de Assis Figueiredo, F.; Marques Pontes-Neto, O.; Lavados Germain, P.M.; Marinho, M.F.; Hoppe Wiegering, A.; Vaca McGhie, D.; et al. Priorities to reduce the burden of stroke in Latin American countries. Lancet. Neurol. 2019, 18, 674–683. [Google Scholar] [CrossRef]
- Krug, E.; Cieza, A. Strengthening health systems to provide rehabilitation services. Bull. World Health Organ. 2017, 95, 167. [Google Scholar] [CrossRef] [PubMed]
- Coe, N.B.; Skira, M.M.; Larson, E.B. A Comprehensive Measure of the Costs of Caring for a Parent: Differences According to Functional Status. J. Am. Geriatr. Soc. 2018, 66, 2003–2008. [Google Scholar] [CrossRef] [PubMed] [Green Version]
- Greysen, S.R.; Stijacic Cenzer, I.; Boscardin, W.J.; Covinsky, K.E. Functional Impairment: An Unmeasured Marker of Medicare Costs for Postacute Care of Older Adults. J. Am. Geriatr. Soc. 2017, 65, 1996–2002. [Google Scholar] [CrossRef] [PubMed]
- Louw, Q.; Twizeyemariya, A.; Grimmer, K.; Leibbrandt, D. Estimating the costs and benefits of stroke rehabilitation in South Africa. J. Eval. Clin. Pract. 2019. [Google Scholar] [CrossRef] [PubMed]
- Hussey, M.; MacLachlan, M.; Mji, G. Barriers to the Implementation of the Health and Rehabilitation Articles of the United Nations Convention on the Rights of Persons with Disabilities in South Africa. Int. J. Health Policy Manag. 2017, 6, 207–218. [Google Scholar] [CrossRef] [PubMed]
- Tediosi, F.; Finch, A.; Procacci, C.; Marten, R.; Missoni, E. BRICS countries and the global movement for universal health coverage. Health Policy Plan. 2016, 31, 717–728. [Google Scholar] [CrossRef] [PubMed]
- GBD 2017 Disease and Injury Incidence and Prevalence Collaborators. Global, regional, and national incidence, prevalence, and years lived with disability for 354 diseases and injuries for 195 countries and territories, 1990–2017: A systematic analysis for the Global Burden of Disease Study 2017. Lancet 2018, 392, 1789–1858. [Google Scholar] [CrossRef] [Green Version]
- Jesus, T.S.; Landry, M.D.; Brooks, D.; Hoenig, H. Physical rehabilitation needs per condition type: Results from the Global Burden of Disease study 2017. Arch. Phys. Med. Rehabil. 2020. Epub Ahead of Print. [Google Scholar] [CrossRef] [PubMed]
- Salomon, J.A.; Haagsma, J.A.; Davis, A.; de Noordhout, C.M.; Polinder, S.; Havelaar, A.H.; Cassini, A.; Devleesschauwer, B.; Kretzschmar, M.; Speybroeck, N.; et al. Disability weights for the Global Burden of Disease 2013 study. Lancet Glob. Health 2015, 3, e712–e723. [Google Scholar] [CrossRef] [Green Version]
- Zhou, M.; Wang, H.; Zeng, X.; Yin, P.; Zhu, J.; Chen, W.; Li, X.; Wang, L.; Wang, L.; Liu, Y.; et al. Mortality, morbidity, and risk factors in China and its provinces, 1990–2017: A systematic analysis for the Global Burden of Disease Study 2017. Lancet 2019. [Google Scholar] [CrossRef] [Green Version]
- GBD 2017 Causes of Death Collaborators. Global, regional, and national age-sex-specific mortality for 282 causes of death in 195 countries and territories, 1980-2017: A systematic analysis for the Global Burden of Disease Study 2017. Lancet 2018, 392, 1736–1788. [Google Scholar] [CrossRef] [Green Version]
- Foreman, K.J.; Marquez, N.; Dolgert, A.; Fukutaki, K.; Fullman, N.; McGaughey, M.; Pletcher, M.A.; Smith, A.E.; Tang, K.; Yuan, C.W.; et al. Forecasting life expectancy, years of life lost, and all-cause and cause-specific mortality for 250 causes of death: Reference and alternative scenarios for 2016–40 for 195 countries and territories. Lancet 2018, 392, 2052–2090. [Google Scholar] [CrossRef] [Green Version]
- Zhou, B.; Zhang, J.; Zhao, Y.; Li, X.; Anderson, C.S.; Xie, B.; Wang, N.; Zhang, Y.; Tang, X.; Prvu Bettger, J.; et al. Caregiver-Delivered Stroke Rehabilitation in Rural China. Stroke 2019, 50, 1825–1830. [Google Scholar] [CrossRef] [PubMed]
- Yang, G.; Wang, Y.; Zeng, Y.; Gao, G.F.; Liang, X.; Zhou, M.; Wan, X.; Yu, S.; Jiang, Y.; Naghavi, M.; et al. Rapid health transition in China, 1990–2010: Findings from the Global Burden of Disease Study 2010. Lancet 2013, 381, 1987–2015. [Google Scholar] [CrossRef]
- India State-Level Disease Burden Initiative CRD Collaborators. The burden of chronic respiratory diseases and their heterogeneity across the states of India: The Global Burden o f Disease Study 1990–2016. Lancet Glob. Health 2018, 6, e1363–e1374. [Google Scholar] [CrossRef] [Green Version]
- India State-Level Disease Burden Initiative CVD Collaborators. The changing patterns of cardiovascular diseases and their risk factors in the states of India: The Global Burden of Disease Study 1990–2016. Lancet Glob. Health 2018, 6, e1339–e1351. [Google Scholar] [CrossRef] [Green Version]
- Kamalakannan, S.; Gudlavalleti, A.S.V.; Gudlavalleti, V.S.M.; Goenka, S.; Kuper, H. Incidence & prevalence of stroke in India: A systematic review. Indian J. Med. Res. 2017, 146, 175–185. [Google Scholar] [CrossRef] [PubMed]
- From ‘Paramedics’ to Allied Health Professionals; Public Health Foundation of India: New Delhi, India, 2012.
- Madhok, R. Doctors and health in India: An outsider’s perspective. Indian J. Med Ethics 2012, 9, 259–263. [Google Scholar] [CrossRef] [PubMed]
- Indian Ministry of Health & Family Welfare. National Programme for Prevention and Control of Cancer, Diabetes, Cardiovascular Diseases and Stroke. Available online: https://dghs.gov.in/content/1363_3_NationalProgrammePreventionControl.aspx (accessed on 5 November 2019).
- Gudlavalleti, M.V.; John, N.; Allagh, K.; Sagar, J.; Kamalakannan, S.; Ramachandra, S.S. Access to health care and employment status of people with disabilities in South India, the SIDE (South India Disability Evidence) study. BMC Public Health 2014, 14, 1125. [Google Scholar] [CrossRef] [PubMed] [Green Version]
- Kamalakannan, S.; Gudlavalleti Venkata, M.; Prost, A.; Natarajan, S.; Pant, H.; Chitalurri, N.; Goenka, S.; Kuper, H. Rehabilitation Needs of Stroke Survivors After Discharge from Hospital in India. Arch. Phys. Med. Rehabil. 2016, 97, 1526–1532. [Google Scholar] [CrossRef] [PubMed] [Green Version]
- Sureshkumar, K.; Murthy, G.V.S.; Kuper, H. Protocol for a randomised controlled trial to evaluate the effectiveness of the ‘Care for Stroke’ intervention in India: A smartphone-enabled, carer-supported, educational intervention for management of disabilities following stroke. BMJ Open 2018, 8, e020098. [Google Scholar] [CrossRef] [PubMed] [Green Version]
- Hanass-Hancock, J.; Regondi, I.; Naidoo, K. Disability and HIV: What drives this relationship in Eastern and Southern Africa? Afr. J. Disabil. 2013, 2, 25. [Google Scholar] [CrossRef] [PubMed]
- Machingaidze, S.; Zani, B.; Abrams, A.; Durao, S.; Louw, Q.; Kredo, T.; Grimmer, K.; Young, T. Series: Clinical Epidemiology in South Africa. Paper 2: Quality and reporting standards of South African primary care clinical practice guidelines. J. Clin. Epidemiol. 2017, 83, 31–36. [Google Scholar] [CrossRef] [PubMed]
- Republic of South Africa—National Planning Commission. National Development Plan 2030: Our Future-Make It Work. Available online: https://nationalplanningcommission.files.wordpress.com/2015/02/ndp-2030-our-future-make-it-work_0.pdf (accessed on 28 October 2019).
- Nixon, S.A.; Hanass-Hancock, J.; Whiteside, A.; Barnett, T. The increasing chronicity of HIV in sub-Saharan Africa: Re-thinking “HIV as a long-wave event” in the era of widespread access to ART. Glob. Health 2011, 7, 41. [Google Scholar] [CrossRef] [PubMed] [Green Version]
- Myezwa, H.; Buchalla, C.M.; Jelsma, J.; Stewart, A. HIV/AIDS: Use of the ICF in Brazil and South Africa—Comparative data from four cross-sectional studies. Physiotherapy 2011, 97, 17–25. [Google Scholar] [CrossRef] [PubMed]
- Kietrys, D.; Myezwa, H.; Galantino, M.L.; Parrott, J.S.; Davis, T.; Levin, T.; O’Brien, K.; Hanass-Hancock, J. Functional Limitations and Disability in Persons Living with HIV in South Africa and United States: Similarities and Differences. J. Int. Assoc. Provid. AIDS Care 2019, 18, 2325958219850558. [Google Scholar] [CrossRef] [PubMed] [Green Version]
- Rossii, Z. Healthcare in Russia. 2017. Available online: https://gks.ru/storage/mediabank/zdrav17.pdf (accessed on 4 November 2019).
- Muromtseva, G.A.; Kontsevaya, A.V.; Konstantinov, V.V.; Artamonova, G.V.; Gatagonova, T.M.; Duplyakov, D.V.; Efanov, A.Y.; Zhernakova, Y.V.; Il’in, V.A.; Konradi, A.O.; et al. The prevalence of non-infectious diseases risk factors in Russian population in 2012–2013 years. The results of ECVD-RF. Cardiovasc. Ther. Prev. 2015, 13. [Google Scholar] [CrossRef] [Green Version]
- Alcohol Policy Impact Case Study: The Effects of Alcohol Control Measures on Mortality and Life Expectancy in the Russian Federation (2019); WHO Regional Office for Europe: Copenhagen, Denmark, 2019.
- Rosstat, S. The Demographic Yearbook of Russia; Russian Government: Moscow, Russian Federation, 2017. [Google Scholar]
- Pogosova, N.; Sokolova, O. Governmental efforts for cardiovascular disease prevention efforts in the Russian Federation. Cardiovasc. Diagn. Ther. 2017, 7, S48–S54. [Google Scholar] [CrossRef] [PubMed] [Green Version]
- Boytsov, S.A.; Andreev, E.M.; Samorodskaya, I.V. Assessment of the Possibility of Comparing Mortality Rates from Diseases of the Circulatory System in the United States and Russia. Kardiologiia 2017, 1, 5–16. [Google Scholar]
- Pogosova, N.; Oganov, R.; Saner, H.; Suvorov, S.; Sokolova, O. Potential and limitations of health policy to improve coronary heart disease prevention and to reduce the burden of disease: A Russian experience. Eur. J. Prev. Cardiol. 2018, 25, 1725–1734. [Google Scholar] [CrossRef] [PubMed]
- Puzin SN, S.S.; Gridin, L.A.; Goncharova, O.V.; Dmitrieva, N. On the history of medical rehabilitation in Russia. Hist. Med. 2017, 4, 103–111. [Google Scholar] [CrossRef]
- Bubnova MG, A.D.; Boytsov, S.A.; Ivanova, G.E.; Andreev, A.G.; Barbarash, O.L.; Belova, V.V.; Belov, V.N.; Borisov, B.V.; Ivanov, E.V.; Karamova, I.M.; et al. Cardiorehabilitation organization in Russia. The results of the pilot project “Development of the system of rehabilitation of patients with cardiovascular diseases in medical institutions of the Russian Federation”. Cardiosomatics 2016, 7, 72–81. [Google Scholar]
- St. Petersburg State Pavlov Medical University. The Pilot Project Development Of MEdical Rehabilitation System in Russian Federation. Available online: https://clinicaltrials.gov/ct2/show/NCT02793934v (accessed on 5 November 2019).
- Ladeira, R.M.; Malta, D.C.; Morais, O.L.N.; Montenegro, M.M.S.; Soares, A.M.F.; Vasconcelos, C.H.; Mooney, M.; Naghavi, M. Road traffic accidents: Global Burden of Disease study, Brazil and federated units, 1990 and 2015. Rev. Epidemiol. 2017, 20, 157–170. [Google Scholar] [CrossRef] [PubMed] [Green Version]
- Malta, D.C.; Minayo, M.C.d.S.; Filho, A.M.S.; Silva, M.M.A.d.; Montenegro, M.d.M.S.; Ladeira, R.M.; Neto, O.L.d.M.; Melo, A.P.; Mooney, M.; Naghavi, M. Mortality and years of life lost by interpersonal violence and self-harm: In Brazil and Brazilian states: Analysis of the estimates of the Global Burden of Disease Study, 1990 and 2015. Rev. Bras. Epidemiol. 2017, 20, 142–156. [Google Scholar] [CrossRef] [PubMed]
- Landry, M.D.; Tupetz, A.; Jalovcic, D.; Sheppard, P.; Jesus, T.S.; Raman, S.R. The Novel Coronavirus (COVID-19): Making a Connection between Infectious Disease Outbreaks and Rehabilitation. Physiother Can. 2020. [Google Scholar] [CrossRef] [Green Version]
- Smith, J.M.; Lee, A.C.; Zeleznik, H.; Coffey Scott, J.P.; Fatima, A.; Needham, D.M.; Ohtake, P.J. Home and Community-Based Physical Therapist Management of Adults With Post-Intensive Care Syndrome. Phys. Ther. 2020. Online Ahead of Print. [Google Scholar] [CrossRef] [PubMed]
- Stam, H.J.; Stucki, G.; Bickenbach, J. Covid-19 and Post Intensive Care Syndrome: A Call for Action. J. Rehab. Med. 2020. Online Ahead of Print. [Google Scholar] [CrossRef]
- World Confederation for Physical Therapy. Survey Reveals Global State of the Physical Therapy Profession. Available online: https://www.wcpt.org/news/surveys-reveal-global-state-of-the-physical-therapy-profession. (accessed on 6 November 2019).


| Underlying Health Conditions (from the Global Burden of Disease Study) | Intermediate Aggregation | Main Groups (Condition Types) |
|---|---|---|
| Low back pain | Pain | Musculoskeletal & Pain |
| Neck pain | ||
| Tension-type headaches | ||
| Injuries (all selected except Spinal & Brain Injuries; Asphyxiation; and Severe Chest Injuries) | Musculoskeletal Trauma | |
| Osteoarthritis | Musculoskeletal disorders | |
| Rheumatoid arthritis | ||
| Gout & Other musculoskeletal disorders | ||
| Leprosy | ||
| Chronic Respiratory Diseases | Pulmonary | |
| Severe Chest Injuries | ||
| Cardiovascular Diseases (excluding Stroke) | Cardiovascular | Cardiotoracic |
| Heart Failure (resulting from all the non-considered health conditions) | ||
| Stroke | Neurological Disorders (non-communicable) | Neurological |
| Multiple sclerosis; Parkinson’s; Alzheimer’s & Other Dementias; Motor neuron disease; Other neurological disorders; Neoplasm–brain & nervous system | ||
| Infectious–affecting the nervous system: Encephalitis; Meningitis; Tetanus; ZIKA virus | Neurological–Infectious * | |
| Syndrome: Guillain-Barré (resulting from non-considered health conditions) | ||
| Spinal Cord Injury | Neurological Trauma | |
| Traumatic Brain Injury; Asphyxiation | ||
| Congenital birth defects (digestive & urogenital disorders excluded) | - | Pediatric ** |
| Neonatal | ||
| Autism Spectrum Disorder | ||
| All Neoplasms (not nervous system) | - | Neoplasm (not nervous system) |
| HIV/AIDS | - | HIV-related |
| 1990 | 2017 | % Change [1990–2017] | Regression Model Type | r2 | b Coefficient | 95% CI | 99% CI | |
|---|---|---|---|---|---|---|---|---|
| YLD Counts, Millions | ||||||||
| Brazil | 4.94 | 9.02 | 82.6% | Linear | 1 | 0.16 * | 0.15–0.16 | 0.15–0.16 |
| China | 39.8 | 67.0 | 68.1% | Linear | 0.98 | 1.01 * | 0.94–1.07 | 0.92–1.10 |
| India | 28.8 | 55.1 | 91.6% | Linear | 0.98 | 0.98 * | 0.93–1.03 | 0.91–1.05 |
| Russia | 8.69 | 9.35 | 7.6% | Linear | 0.76 | 0.03 * | 0.02–0.04 | 0.02–0.04 |
| South Africa | 1.25 | 2.68 | 114.1% | Linear | 0.94 | 0.06 * | 0.06–0.07 | 0.05–0.07 |
| World | 206.4 | 342.9 | 66.2% | Linear | 0.99 | 5.10 * | 4.88–5.32 | 4.80–5.40 |
| High-income | 57.5 | 79.0 | 37.4% | Linear | 0.99 | 0.81 * | 0.77–0.84 | 0.76–0.86 |
| Upper Middle-Income | 75.9 | 123.0 | 62.1% | Linear | 0.99 | 1.78 * | 1.69–1.87 | 1.66–1.90 |
| Lower Middle-Income | 62.3 | 118.8 | 90.4% | Linear | 0.99 | 2.10 * | 2.02–2.19 | 1.99–2.22 |
| Low-Income | 9.81 | 20.8 | 111.5% | Linear | 1 | 0.39 * | 0.38–0.40 | 0.38–0.41 |
| YLD Rates (per 100,000 inhabitants) | ||||||||
| Brazil | 3306 | 4528 | 28.8% | Linear | 1 | 37.2 * | 36.3–38.1 | 36.0–38.4 |
| China | 3329 | 4743 | 42.5% | Linear | 0.95 | 54.3 * | 49.3–59.2 | 47.6–60.9 |
| India | 3300 | 3990 | 20.9% | Linear | 0.92 | 25.2 * | 22.2–28.2 | 21.1–29.3 |
| Russia | 5741 | 6393 | 11.4% | Linear | 0.91 | 31.6 * | 27.6–35.6 | 26.2–37.0 |
| South Africa | 3399 | 4803 | 43.3% | Linear | 0.85 | 73.4 * | 61.1–85.7 | 56.8–90.0 |
| World | 3825 | 4488 | 17.3% | Linear | 0.96 | 25.7 * | 23.7–27.7 | 23.0–28.4 |
| High-income | 5748 | 6643 | 15.6% | Linear | 0.98 | 33.1 * | 31.1–35.1 | 30.4–35.8 |
| Upper Middle-Income | 3594 | 4669 | 29.9% | Linear | 0.96 | 42.6 * | 39.3–46.0 | 38.1–47.2 |
| Lower Middle-Income | 3233 | 3806 | 17.7% | Linear | 0.96 | 21.6 * | 19.9–23.2 | 19.3–23.8 |
| Low-Income | 2977 | 3112 | 4.5% | Logarithmic | 0.50 | 2.5 ** | 0.40–4.55 | −0.33–5.28 |
| Age-standardized YLD Rates | ||||||||
| Brazil | 3993 | 4010 | 0.44% | Linear | 0.69 | 2.9 * | 2.08–3.63 | 1.81–3.90 |
| China | 3795 | 3898 | 2.71% | Linear | 0.24 | 5.4 * | 1.47–9.02 | 0.14–10.4 |
| India | 4361 | 4368 | 0.16% | Logarithmic | 0.09 | - 0.2 | −2.62–2.22 | −3.47–3.08 |
| Russia | 5156 | 4991 | −3.20% | Logarithmic | 0.13 | - 0.1 | −4.02–3.77 | −5.40–5.14 |
| South Africa | 4415 | 5131 | 16.2% | Logarithmic | 0.72 | 47.8 * | 32.7–62.8 | 27.5–68.1 |
| World | 4377 | 4334 | −1.0% | Logarithmic | 0.22 | −0.62 | −2.13–0.89 | −2.66–1.42 |
| High-income | 5007 | 4872 | −2.7% | Logarithmic | 0.86 | −5.36 * | −6.76–(−3.96) | −7.26–(−3.47) |
| Upper Middle-Income | 4106 | 4080 | −0.6% | Linear | 0.04 | 1.34 | −1.38–4.06 | −2.33–5.02 |
| Lower Middle-Income | 4262 | 4314 | 1.2% | Linear | 0.46 | 2.33 * | 1.26–3.40 | 0.89–3.78 |
| Low-Income | 4189 | 4276 | 2.1% | Logarithmic | 0.15 | 0.29 | −3.29–3.87 | −4.55–5.14 |
| % of YLDs Benefiting from Physical Rehabilitation (among total YLDs) | ||||||||
| Brazil | 60.1% | 66.2% | 10.2% | Linear | 0.96 | 0.26 * | 0.24–0.28 | 0.23–0.29 |
| China | 37.8% | 44.8% | 18.7% | Linear | 0.97 | 0.26 * | 0.24–0.28 | 0.24–0.29 |
| India | 29.9% | 35.9% | 20.1% | Linear | 0.93 | 0.23 * | 0.21–0.26 | 0.20–0.27 |
| Russia | 45.4% | 46.6% | 2.6% | Linear | 0.46 | 0.07 * | 0.04–0.09 | 0.03–0.11 |
| South Africa | 34.8% | 43.8% | 25.8% | Linear | 0.87 | 0.43 * | 0.37–0.50 | 0.34–0.52 |
| World | 36.7% | 40.2% | 9.5% | Linear | 0.97 | 0.14 * | 0.13–0.15 | 0.12–0.15 |
| High-income | 47.6% | 48.6% | 2.2% | Linear | 0.87 | 0.03 * | 0.03–0.04 | 0.02–0.04 |
| Upper Middle-Income | 37.9% | 42.2% | 11.4% | Linear | .97 | 0.17 * | 0.16–0.18 | 0.15–0.19 |
| Lower Middle-Income | 30.7% | 35.9% | 16.8% | Linear | 0.98 | 0.20 * | 0.19–0.21 | 0.19–0.22 |
| Low-Income | 27.8% | 32.1% | 15.4% | Linear | 0.97 | 0.16 * | 0.15–0.17 | 0.14–0.17 |
| 1990 | 2017 | % Change [1990–2017] | Regression Model Type | r2 | b Coefficient | 95% CI | 99% CI | |
|---|---|---|---|---|---|---|---|---|
| Musculoskeletal & Pain | ||||||||
| Brazil | 1901 | 2551 | 34.2% | Linear | 1 | 25.4 * | 24.9–25.9 | 24.8–26.0 |
| China | 1646 | 2258 | 37.2% | Linear | 0.99 | 25.0 * | 23.8–26.2 | 23.4–26.6 |
| India | 1765 | 2048 | 16.0% | Linear | 0.91 | 10.1 * | 8.9–11.4 | 8.4–11.9 |
| Russia | 3271 | 3435 | 5.0% | Linear | 0.88 | 11.6 * | 9.8–13.3 | 9.2–13.9 |
| South Africa | 1605 | 1731 | 7.9% | Linear | 0.93 | 5.7 * | 5.1–6.4 | 4.9–6.6 |
| World | 2071 | 2363 | 14.1% | Linear | 0.98 | 11.4 * | 10.7−12.1 | 10.5−12.4 |
| High-Income | 3359 | 3835 | 14.2% | Linear | 0.99 | 16.8 * | 16.1−17.5 | 15.9−17.7 |
| Upper Middle-Income | 1875 | 2369 | 26.3% | Linear | 0.98 | 20.5 * | 19.4−21.5 | 19.0−21.9 |
| Lower Middle-Income | 1724 | 1983 | 15.1% | Linear | 0.96 | 9.4 * | 8.6−10.3 | 8.3−10.5 |
| Low-Income | 1486 | 1491 | 0.4% | Linear | 0.09 | −0.6 | −1.3−0.1 | −1.5−0.4 |
| Neurological | ||||||||
| Brazil | 263 | 396 | 50.4% | Linear | 0.96 | 5.2 * | 4.7–5.6 | 4.6–5.7 |
| China | 410 | 870 | 112.5% | Exponential | 0.97 | 15.6 * | 13.8–17.3 | 13.2–17.9 |
| India | 247 | 323 | 30.5% | Linear | 0.94 | 2.8 * | 2.5–3.1 | 2.4–3.2 |
| Russia | 922 | 1207 | 30.9% | Linear | 0.83 | 11.4 * | 9.3–13.4 | 8.6–14.1 |
| South Africa | 330 | 356 | 7.9% | Linear | 0.57 | 0.7 * | 0.5–1.0 | 0.4–1.1 |
| World | 441 | 578 | 31.1% | Linear | 0.89 | 4.8 * | 4.1−5.5 | 3.9−5.7 |
| High-Income | 750 | 929 | 23.7% | Linear | 0.90 | 6.1 * | 5.3−6.9 | 5.0−7.2 |
| Upper Middle-Income | 441 | 736 | 66.9% | Exponential | 0.95 | 10.4 * | 9.1−11.6 | 8.7−12.0 |
| Lower Middle-Income | 301 | 364 | 21.2% | Linear | 0.86 | 2.3 * | 1.9−2.7 | 1.8−2.8 |
| Low-Income | 321 | 314 | −2.1% | Linear | 0.53 | −0.5 * | −0.7−(−0.3) | −0.8−(−0.2) |
| Cardiotoracic | ||||||||
| Brazil | 624 | 685 | 9.8% | Linear | 0.88 | 2.65 * | 2.3–3.1 | 2.11–3.19 |
| China | 759 | 857 | 12.9% | Linear | 0.36 | 4.95 * | 2.3–7.6 | 1.35–8.56 |
| India | 746 | 857 | 14.8% | Linear | 0.49 | 4.02 * | 2.4–5.7 | 1.78–6.26 |
| Russia | 802 | 856 | 6.7% | Linear | 0.94 | 2.21 * | 2.0–2.4 | 1.90–2.52 |
| South Africa | 851 | 918 | 7.9% | Logarithmic | 0.73 | 2.89 * | 1.7–4.1 | 1.23–4.56 |
| World | 733 | 807 | 10.1% | Linear | 0.63 | 3.5 * | 2.4−4.5 | 2.0−4.9 |
| High-Income | 956 | 1103 | 15.4% | Linear | 0.94 | 7.0 * | 6.3−7.7 | 6.0−8.0 |
| Upper Middle-Income | 719 | 810 | 12.7% | Linear | 0.55 | 4.3 * | 2.7−5.9 | 2.2−6.4 |
| Lower Middle-Income | 662 | 745 | 12.5% | Linear | 0.67 | 3.4 * | 2.5−4.4 | 2.1−4.7 |
| Low-Income | 557 | 549 | −1.5% | Linear | 0.06 | −0.3 | −0.8−0.2 | −1.0−0.3 |
| Pediatric | ||||||||
| Brazil | 468 | 505 | 7.8% | Linear | 0.99 | 1.48 * | 1.42–1.54 | 1.40–1.57 |
| China | 467 | 613 | 31.4% | Linear | 0.97 | 5.46 * | 5.04–5.87 | 4.90–6.02 |
| India | 519 | 713 | 37.3% | Linear | 0.99 | 7.18 * | 6.92–7.43 | 6.83–7.52 |
| Russia | 636 | 658 | 3.6% | Linear | 0.50 | 1.89 * | 1.13–2.66 | 0.86–2.93 |
| South Africa | 558 | 596 | 6.8% | Logarithmic | 0.06 | −0.03 | −1.19–1.12 | −1.60–1.53 |
| World | 498 | 588 | 18.0% | Linear | 0.99 | 3.5 * | 3.4−3.6 | 3.3−3.7 |
| High-Income | 493 | 486 | −1.5% | Logarithmic | 0.91 | −0.2 * | −0.3−(−0.2) | −0.3−(−0.1) |
| Upper Middle-Income | 505 | 594 | 17.7% | Linear | 0.97 | 3.4 * | 3.2−3.6 | 3.1−3.7 |
| Lower Middle-Income | 507 | 624 | 23.0% | Linear | 0.99 | 4.6 * | 4.4−4.8 | 4.4−4.8 |
| Low-Income | 424 | 579 | 36.5% | Linear | 0.97 | 6.4 * | 5.9−6.8 | 5.8−6.9 |
| Neoplasm | ||||||||
| Brazil | 38 | 75 | 99% | Linear | 1 | 1.32 * | 1.30–1.35 | 1.29–1.36 |
| China | 47 | 136 | 189% | Exponential | 0.94 | 3.00 * | 2.51–3.49 | 2.34–3.66 |
| India | 22 | 34 | 58% | Linear | 0.81 | 0.40 * | 0.32–0.47 | 0.29–0.05 |
| Russia | 106 | 174 | 64% | Linear | 0.93 | 2.68 * | 2.38–2.98 | 2.27–3.08 |
| South Africa | 38 | 49 | 30% | Logarithmic | 0.39 | 0.28 ** | 0.03–0.53 | −0.06–0.62 |
| World | 62 | 100 | 62.3% | Linear | 0.95 | 1.3 * | 1.1−1.4 | 1.1−1.4 |
| High-Income | 173 | 271 | 56.6% | Linear | 0.99 | 3.4 * | 3.3−3.5 | 3.2−3.6 |
| Upper Middle-Income | 50 | 115 | 130% | Exponential | 0.95 | 2.3 * | 1.9−2.6 | 1.8−2.7 |
| Lower Middle-Income | 27 | 38 | 40.1% | Linear | 0.76 | 0.4 * | 0.3−0.5 | 0.3−0.5 |
| Low-Income | 27 | 26 | −1.9% | Linear | 0.55 | −0.1 * | −0.2−(−0.1) | −0.2−(−0.1) |
| HIV-related | ||||||||
| Brazil | 12.4 | 45.2 | 163% | Linear | 0.94 | 1.1 * | 1.0–1.2 | 0.09–1.3 |
| China | 1.2 | 7.4 | 528% | Linear | 0.98 | 0.2 * | 0.2–0.2 | 0.2–0.3 |
| India | 0.8 | 15.2 | 1905% | Logarithmic | 0.64 | 0.7 * | 0.3–1.0 | 0.2–1.1 |
| Russia | 4.5 | 61.7 | 1277% | Exponential | 1 | 1.8 * | 1.5–2.1 | 1.4–2.2 |
| South Africa | 17.3 | 1219 | 6469% | Logarithmic | 0.83 | 63.8 * | 51.0–76.5 | 46.5–81.0 |
| World | 17 | 54 | 207% | Logarithmic | 0.79 | 1.28 * | 0.79−1.77 | 0.62−1.94 |
| High-Income | 14 | 19 | 37% | Linear | 0.04 | 0.04 * | −0.2−0.11 | −0.6−0.13 |
| Upper Middle-Income | 4 | 48 | 1255% | Linear | 0.89 | 1.89 * | 1.62−2.15 | 1.53−2.24 |
| Lower Middle-Income | 23 | 50 | 113% | Logarithmic | 0.71 | 1.39 * | 0.85−1.93 | 0.66−2.12 |
| Low-Income | 160 | 178 | 12% | Linear | 0.09 | −2.29 | −5.15−0.58 | −6.16−1.59 |
| # 1990 | # 2017 | % Change [1990–2017] | Regression Model Type | r2 | b Coefficient | 95% CI | 99% CI | |
|---|---|---|---|---|---|---|---|---|
| Musculoskeletal & Pain | ||||||||
| Brazil | 57.5% | 59.9% | 4.2% | Linear | 0.97 | 0.09 * | 0.09–0.10 | 0.09–0.10 |
| China | 49.4% | 47.6% | −3.7% | Linear | 0.09 | −0.03 | −0.08–(−0.01) | −0.08–0.01 |
| India | 53.5% | 51.3% | −4.0% | Linear | 0.91 | −0.09 | −0.10–(−0.08) | −0.10–(−0.07) |
| Russia | 57.0% | 53.7% | −5.7% | Linear | 0.67 | −0.10 | −0.13–(−0.07) | −0.14–(−0.06) |
| South Africa | 47.2% | 35.6% | −24.7% | Logarithmic | 0.87 | −0.54 * | −0.66–(−0.41) | −0.70–(−0.37) |
| World | 54.1% | 52.6% | −2.8% | Linear | 0.87 | −0.06 * | −0.06−(−0.05) | −0.07−(−0.03) |
| High–Income | 58.4% | 57.7% | −1.2% | Linear | 0.72 | −0.04 * | −0.05−(−0.03) | −0.05−(−0.03) |
| Upper Middle–Income | 52.2% | 50.7% | −2.8% | Linear | 0.29 | −0.04 * | −0.06−(−0.01) | −0.07−(−0.01) |
| Lower Middle–Income | 53.3% | 52.1% | −2.3% | Linear | 0.97 | −0.06 * | −0.06−(−0.05) | −0.06−(−0.05) |
| Low–Income | 49.9% | 41.7% | −4.0% | Logarithmic | 0.62 | −0.06 * | −0.09−(−0.02) | −0.11−(−0.01) |
| Neurological | ||||||||
| Brazil | 8.0% | 9.3% | 16.8% | Linear | 0.86 | 0.05 * | 0.04–0.06 | 0.04–0.06 |
| China | 12.3% | 18.4% | 49.2% | Exponential | 0.96 | 0.19 * | 0.17–0.21 | 0.16–0.22 |
| India | 7.5% | 8.1% | 8.0% | Linear | 0.95 | 0.02 * | 0.02–0.03 | 0.02–0.03 |
| Russia | 16.1% | 18.9% | 17.6% | Linear | 0.74 | 0.10 * | 0.08–0.12 | 0.07–0.13 |
| South Africa | 9.7% | 7.3% | −24.7% | Logarithmic | 0.81 | −0.12 * | −0.15–(−0.09) | −0.16–(−0.08) |
| World | 11.5% | 12.9% | 11.7% | Linear | 0.72 | 0.04 * | 0.03−0.05 | 0.03−0.05 |
| High–Income | 13.1% | 14.0% | 7.1% | Linear | 0.58 | 0.03 * | 0.02−0.04 | 0.02−0.04 |
| Upper Middle–Income | 12.3% | 15.8% | 28.4% | Exponential | 0.90 | 0.11 * | 0.10−0.13 | 0.10−0.13 |
| Lower Middle–Income | 9.3% | 9.6% | 2.9% | Linear | 0.23 | 0.01 * | 0.002–0.02 | 0.002–0.02 |
| Low–Income | 10.8% | 10.1% | −6.3% | Logarithmic | 0.86 | 0.02 * | −0.03−(−0.02) | −0.03−(−0.02) |
| Cardiothoracic | ||||||||
| Brazil | 18.9% | 16.1% | −14.7% | Linear | 0.96 | −0.10 * | −0.11–(−0.09) | −0.11–(−0.09) |
| China | 22.8% | 18.1% | −20.8% | Logarithmic | 0.71 | −0.16 * | −0.21–(−0.11) | −0.23–(−0.09) |
| India | 22.6% | 21.5% | −5.0% | Logarithmic | 0.46 | −0.04 ** | −0.07–(−0.01) | −0.07–0.002 |
| Russia | 14.0% | 13.4% | −4.2% | Linear | 0.79 | −0.04 * | −0.04–(−0.03) | −0.05–(−0.03) |
| South Africa | 25.0% | 18.9% | −24.7% | Linear | 0.89 | −0.30 * | −0.34–(−0.26) | −0.36–(−0.24) |
| World | 19.2% | 18.0% | −6.2% | Logarithmic | 0.57 | −0.03 * | −0.05−(−0.01) | −0.06−(−0.01) |
| High–Income | 16.6% | 16.6% | −0.1% | Linear | 0.56 | 0.03 * | 0.02−0.03 | 0.01−0.04 |
| Upper Middle–Income | 20.0% | 17.4% | −13.2% | Logarithmic | 0.74 | −0.09 * | −0.12−(−0.06) | −0.13−(−0.05) |
| Lower Middle–Income | 20.5% | 19.6% | −4.4% | Logarithmic | 0.48 | −0.02 ** | −0.04−(−0.005) | −0.05−0.002 |
| Low–Income | 18.7% | 17.6% | −5.7% | Logarithmic | 0.43 | −0.02 | −0.05−0.001 | −0.06−0.01 |
| Pediatric | ||||||||
| Brazil | 14.2% | 11.9% | −16.3% | Linear | 1 | −0.09 * | −0.09–(−0.09) | −0.09–(−0.09) |
| China | 14.0% | 12.9% | −7.8% | Linear | 0.39 | −0.05 * | −0.08–(−0.03) | −0.09–(−0.02) |
| India | 15.7% | 17.9% | 13.6% | Linear | 0.84 | 0.08 * | 0.07–0.10 | 0.06–0.10 |
| Russia | 11.1% | 10.3% | −7.0% | Logarithmic | 0.92 | −0.02 * | −0.09–(−0.09) | −0.09–(−0.09) |
| South Africa | 16.4% | 12.3% | −25.5% | Logarithmic | 0.80 | −0.23 * | −0.29–(−0.16) | −0.31–(−0.14) |
| World | 13.0% | 13.1% | 0.6% | Logarithmic | 0.15 | 0.003 | −0.004−0.011 | −0.007−0.013 |
| High–Income | 8.6% | 7.3% | −14.8% | Linear | 0.99 | −0.05 * | −0.048−(−0.045) | −0.048−(−0.044) |
| Upper Middle–Income | 14.0% | 12.7% | −9.4% | Linear | 0.73 | −0.06 * | −0.073−(−0.044) | −0.078−(−0.039) |
| Lower Middle–Income | 15.7% | 16.4% | 4.5% | Logarithmic | 0.74 | 0.03 * | 0.023−0.042 | 0.020−0.045 |
| Low–Income | 14.2% | 18.6% | 30.6% | Linear | 0.92 | 0.19 * | 0.171−0.216 | 0.163−0.224 |
| Neoplasms | ||||||||
| Brazil | 1.14% | 1.75% | 54% | Linear | 0.98 | 0.021 * | 0.020–0.022 | 0.019–0.022 |
| China | 1.41% | 2.86% | 103% | Exponential | 0.91 | 0.048 * | 0.040–0.056 | 0.037–0.059 |
| India | 0.66% | 0.86% | 30% | Linear | 0.71 | 0.006 * | 0.004–0.007 | 0.004–0.008 |
| Russia | 1.84% | 2.72% | 47% | Linear | 0.87 | 0.032 * | 0.027–0.032 | 0.025–0.039 |
| South Africa | 1.10% | 1.00% | −10% | Linear | 0.56 | −0.011 * | −0.015–(−0.007) | −0.016–(−0.006) |
| World | 1.6% | 2.2% | 38.3% | Linear | 0.94 | 0.02 * | 0.02−0.02 | 0.02−0.02 |
| High–Income | 3.0% | 4.1% | 35.5% | Logarithmic | 0.97 | 0.04 * | 0.03−0.04 | 0.03−0.04 |
| Upper Middle–Income | 1.4% | 2.5% | 77.0% | Exponential | 0.92 | 0.04 * | 0.03−0.04 | 0.03−0.04 |
| Lower Middle–Income | 0.8% | 1.0% | 19.0% | Linear | 0.53 | 0.01 * | 0.004−0.01 | 0.003−0.01 |
| Low–Income | 0.9% | 0.8% | −6.1% | Linear | 0.59 | −0.01 * | −0.01−(−0.004) | −0.01−(−0.003) |
| HIV–related | ||||||||
| Brazil | 0.38% | 1.06% | 182% | Linear | 0.89 | 0.022 * | 0.019–0.025 | 0.018–0.027 |
| China | 0.04% | 0.16% | 341% | Linear | 0.99 | 0.005 * | 0.005–0.005 | 0.004–0.005 |
| India | 0.02% | 0.38% | 1558% | Linear | 0.55 | 0.016 * | 0.006–0.026 | 0.003–0.030 |
| Russia | 0.08% | 0.97% | 1137% | Exponential | 1 | 0.028 * | 0.024–0.033 | 0.023–0.034 |
| South Africa | 0.51% | 25.0% | 4831% | Logarithmic | 0.85 | 1.193 * | 0.939–1.448 | 0.849–1.538 |
| World | 0.5% | 1.2% | 162% | Linear | 0.89 | 0.02 * | 0.012−0.037 | 0.007−0.042 |
| High–Income | 0.2% | 0.3% | 19% | Linear | 0.99 | 0.001 | −0.002−0.001 | −0.003−0.001 |
| Upper Middle–Income | 0.1% | 1.0% | 943% | Logarithmic | 0.55 | 0.04 * | 0.032−0.048 | 0.029−0.050 |
| Lower Middle–Income | 0.7% | 1.3% | 81% | Exponential | 1.0 | 0.03 * | 0.016−0.050 | 0.010−0.056 |
| Low–Income | 5.4% | 5.7% | 7% | Logarithmic | 0.85 | −0.08 | −0.166−0.009 | −0.197−0.040 |
© 2020 by the authors. Licensee MDPI, Basel, Switzerland. This article is an open access article distributed under the terms and conditions of the Creative Commons Attribution (CC BY) license (http://creativecommons.org/licenses/by/4.0/).
Share and Cite
Jesus, T.S.; Landry, M.D.; Hoenig, H.; Zeng, Y.; Kamalakannan, S.; Britto, R.R.; Pogosova, N.; Sokolova, O.; Grimmer, K.; Louw, Q.A. Physical Rehabilitation Needs in the BRICS Nations from 1990 to 2017: Cross-National Analyses Using Data from the Global Burden of Disease Study. Int. J. Environ. Res. Public Health 2020, 17, 4139. https://0-doi-org.brum.beds.ac.uk/10.3390/ijerph17114139
Jesus TS, Landry MD, Hoenig H, Zeng Y, Kamalakannan S, Britto RR, Pogosova N, Sokolova O, Grimmer K, Louw QA. Physical Rehabilitation Needs in the BRICS Nations from 1990 to 2017: Cross-National Analyses Using Data from the Global Burden of Disease Study. International Journal of Environmental Research and Public Health. 2020; 17(11):4139. https://0-doi-org.brum.beds.ac.uk/10.3390/ijerph17114139
Chicago/Turabian StyleJesus, Tiago S., Michel D. Landry, Helen Hoenig, Yi Zeng, Sureshkumar Kamalakannan, Raquel R. Britto, Nana Pogosova, Olga Sokolova, Karen Grimmer, and Quinette A. Louw. 2020. "Physical Rehabilitation Needs in the BRICS Nations from 1990 to 2017: Cross-National Analyses Using Data from the Global Burden of Disease Study" International Journal of Environmental Research and Public Health 17, no. 11: 4139. https://0-doi-org.brum.beds.ac.uk/10.3390/ijerph17114139