Prediction Model for Dry Eye Syndrome Incidence Rate Using Air Pollutants and Meteorological Factors in South Korea: Analysis of Sub-Region Deviations

Abstract
:1. Introduction
2. Materials and Methods
2.1. Enviromental Data
2.2. Dry Eye Syndrome Hospitalization Data
2.3. Dry Eye Syndrome Incidence Rate Prediction Model
3. Results and Discussion
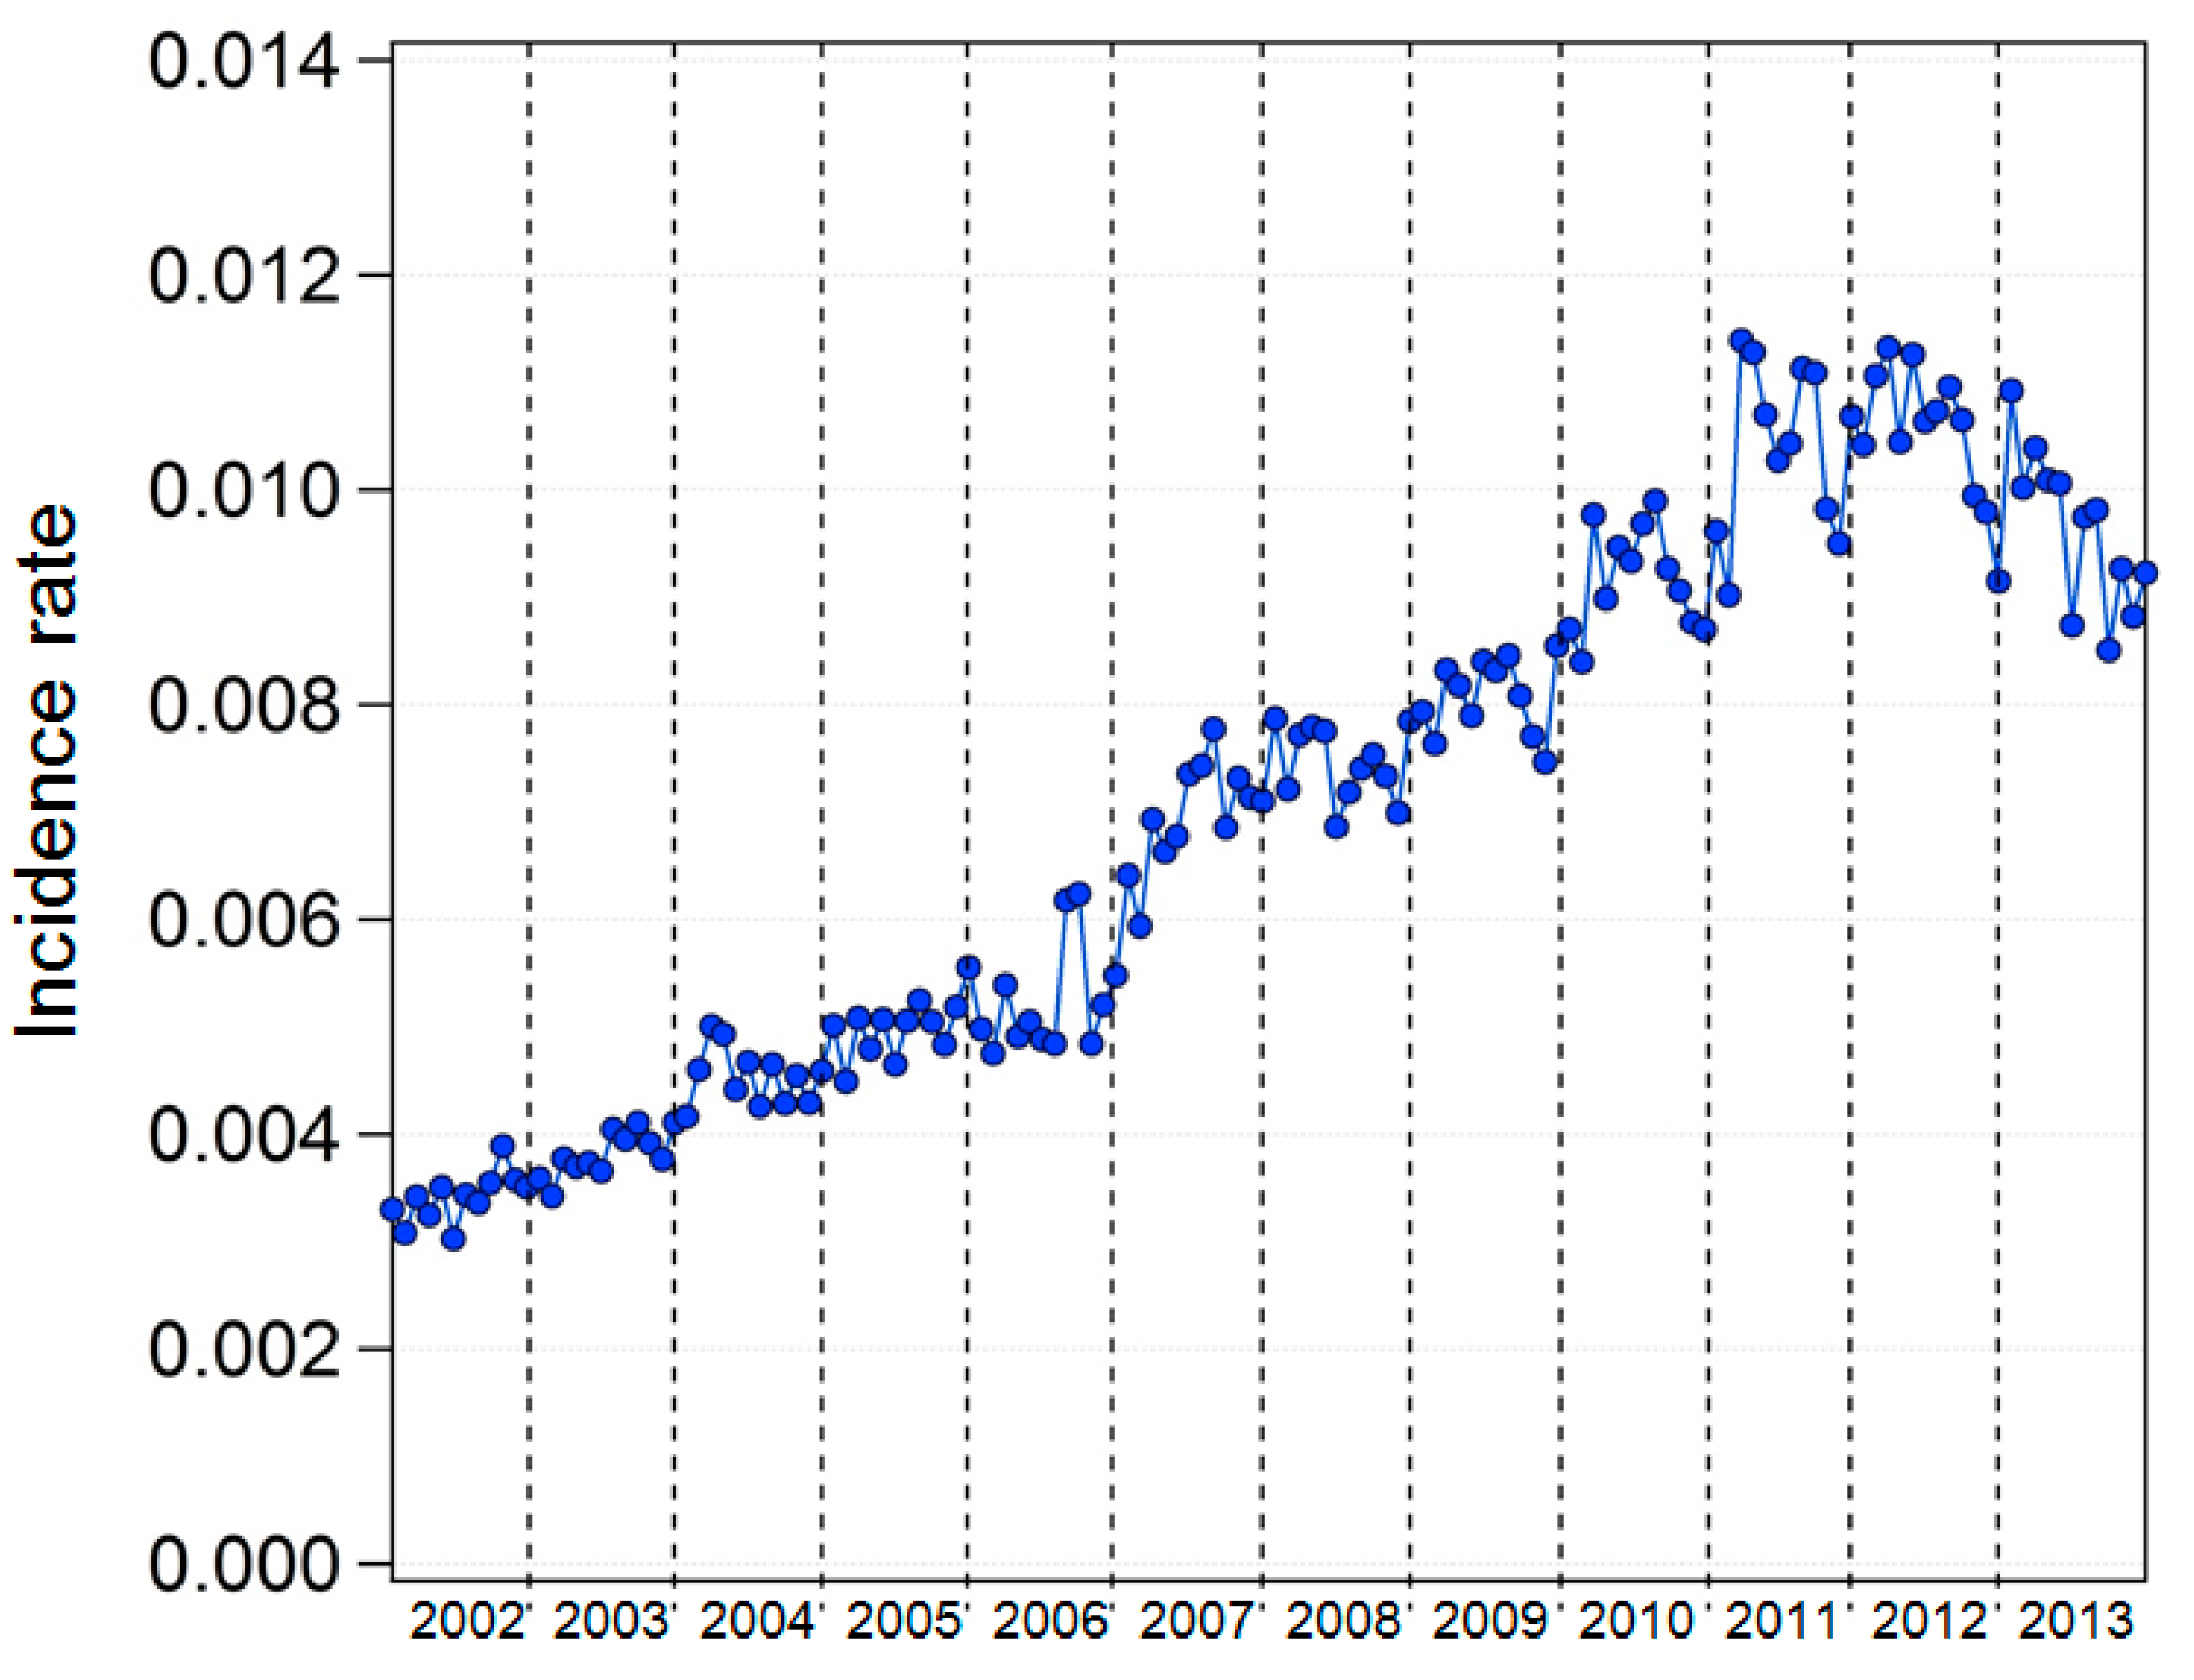
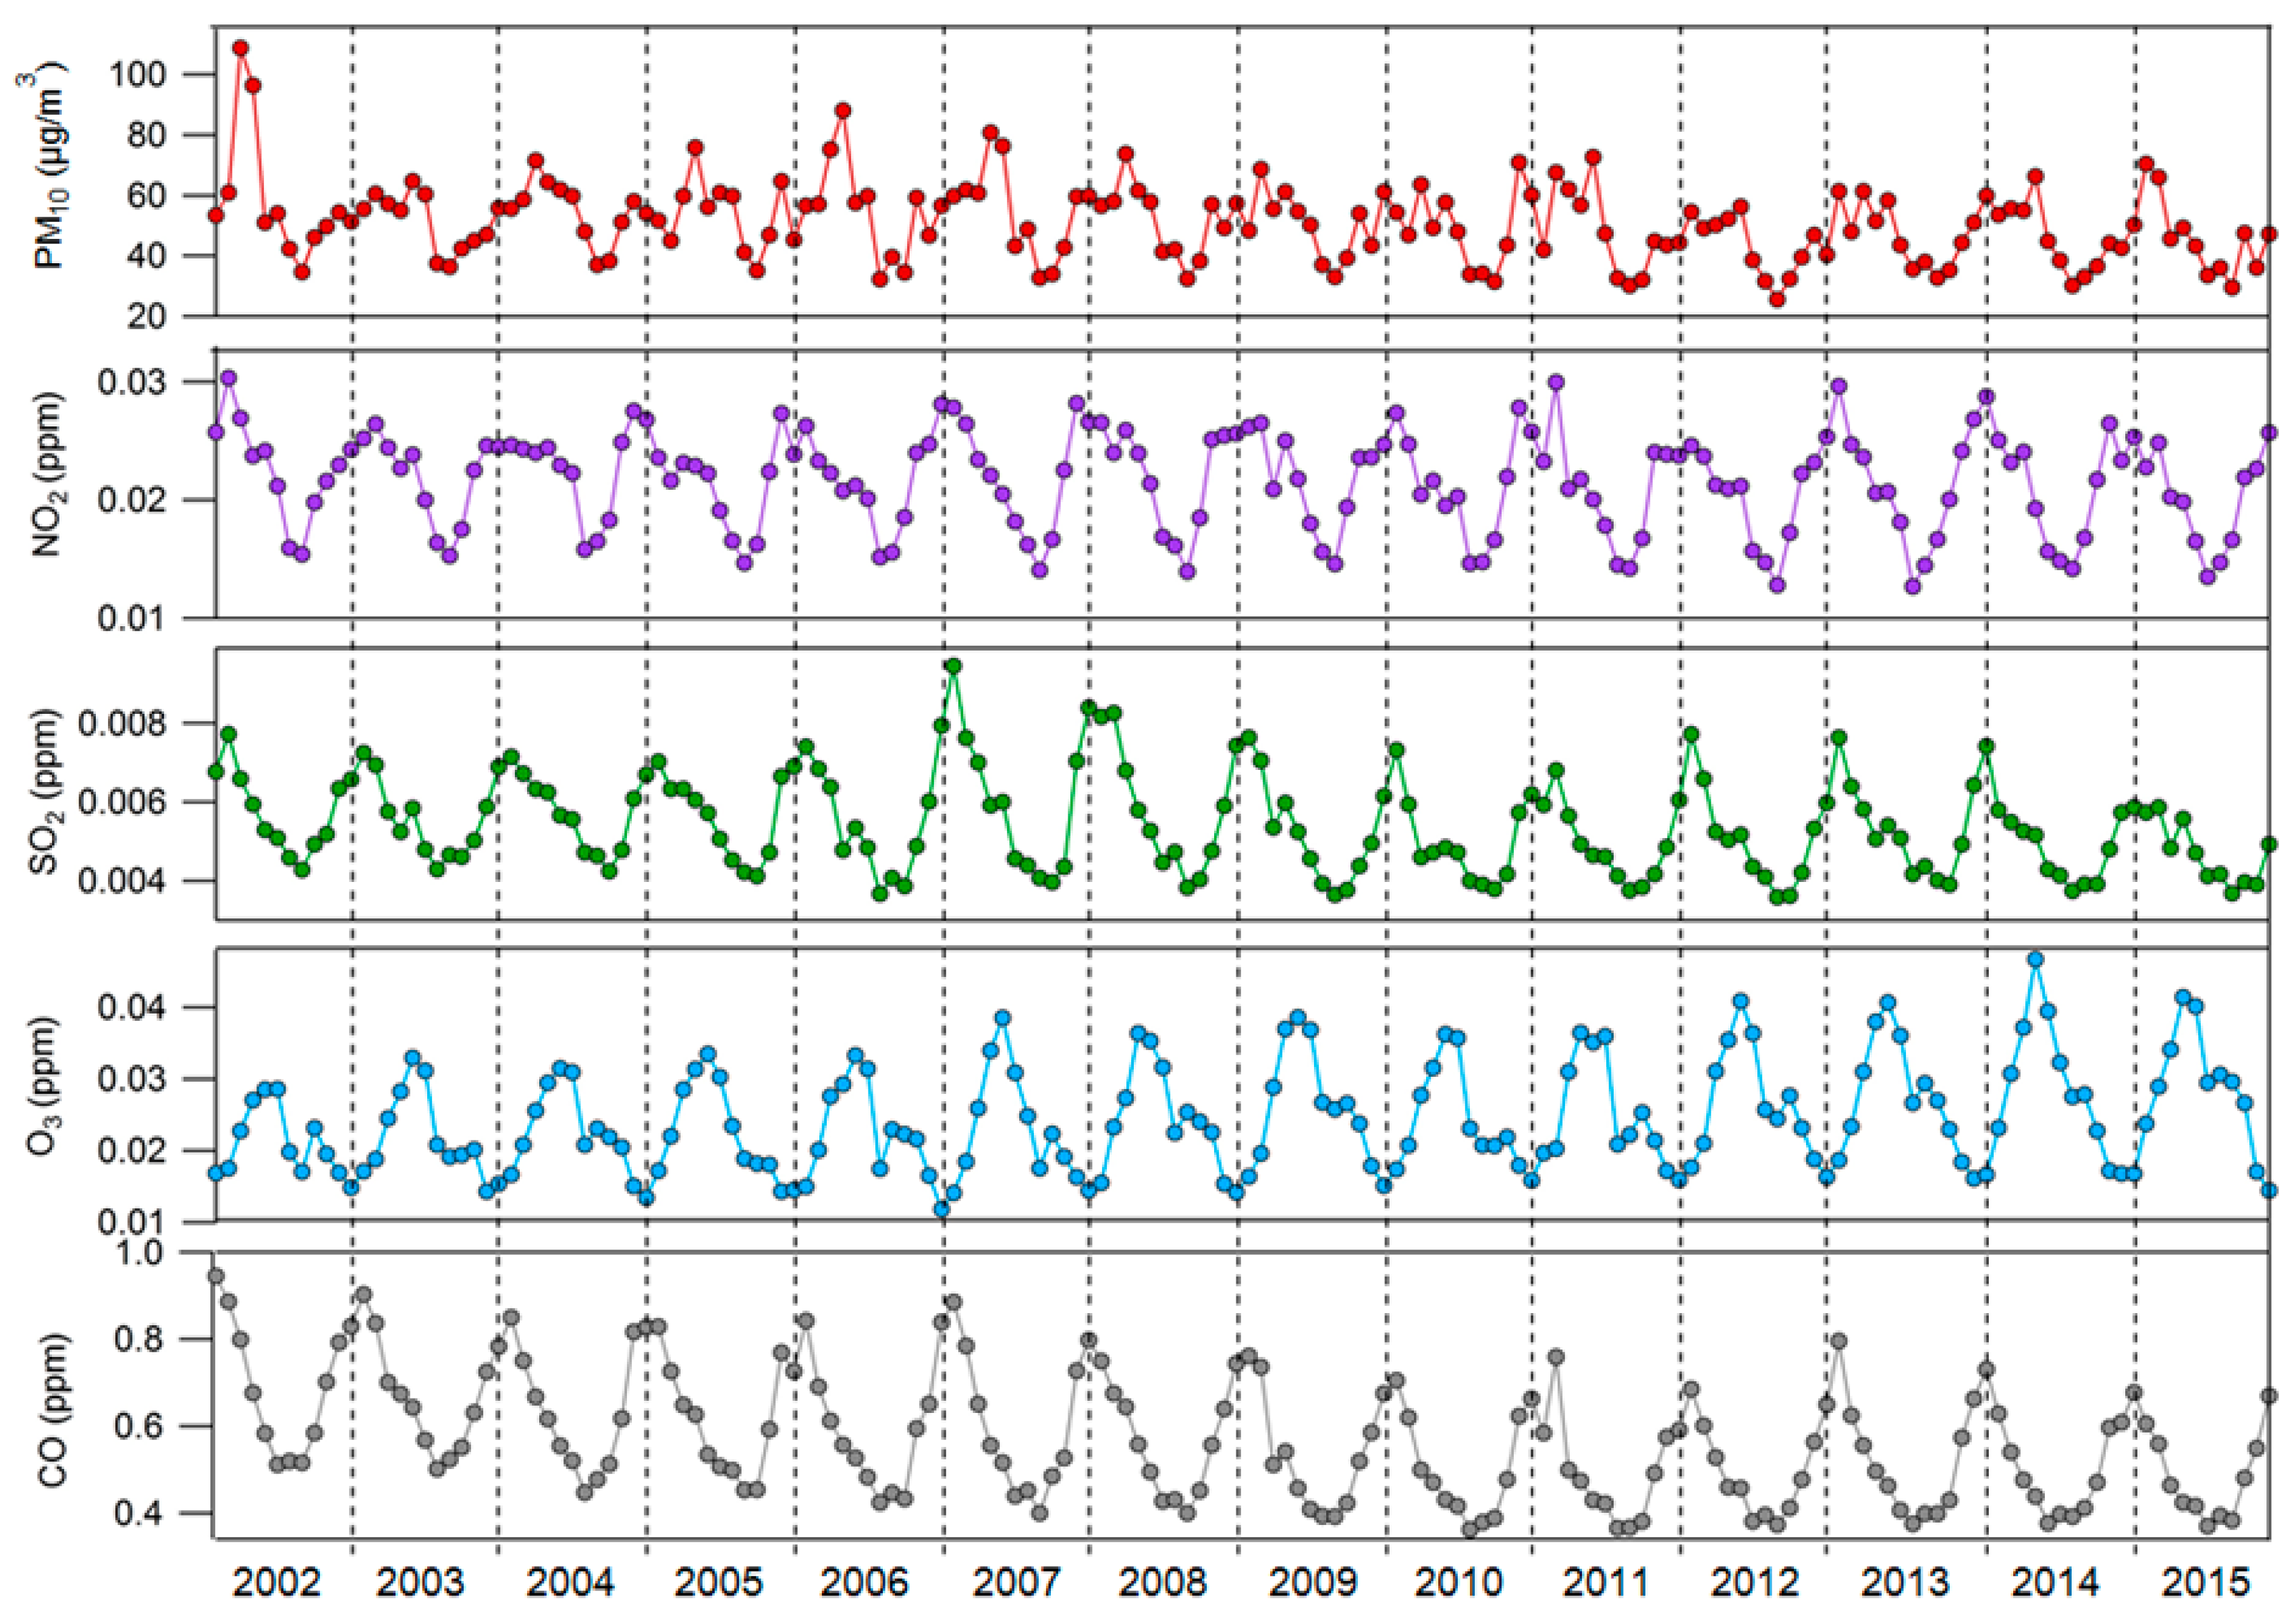
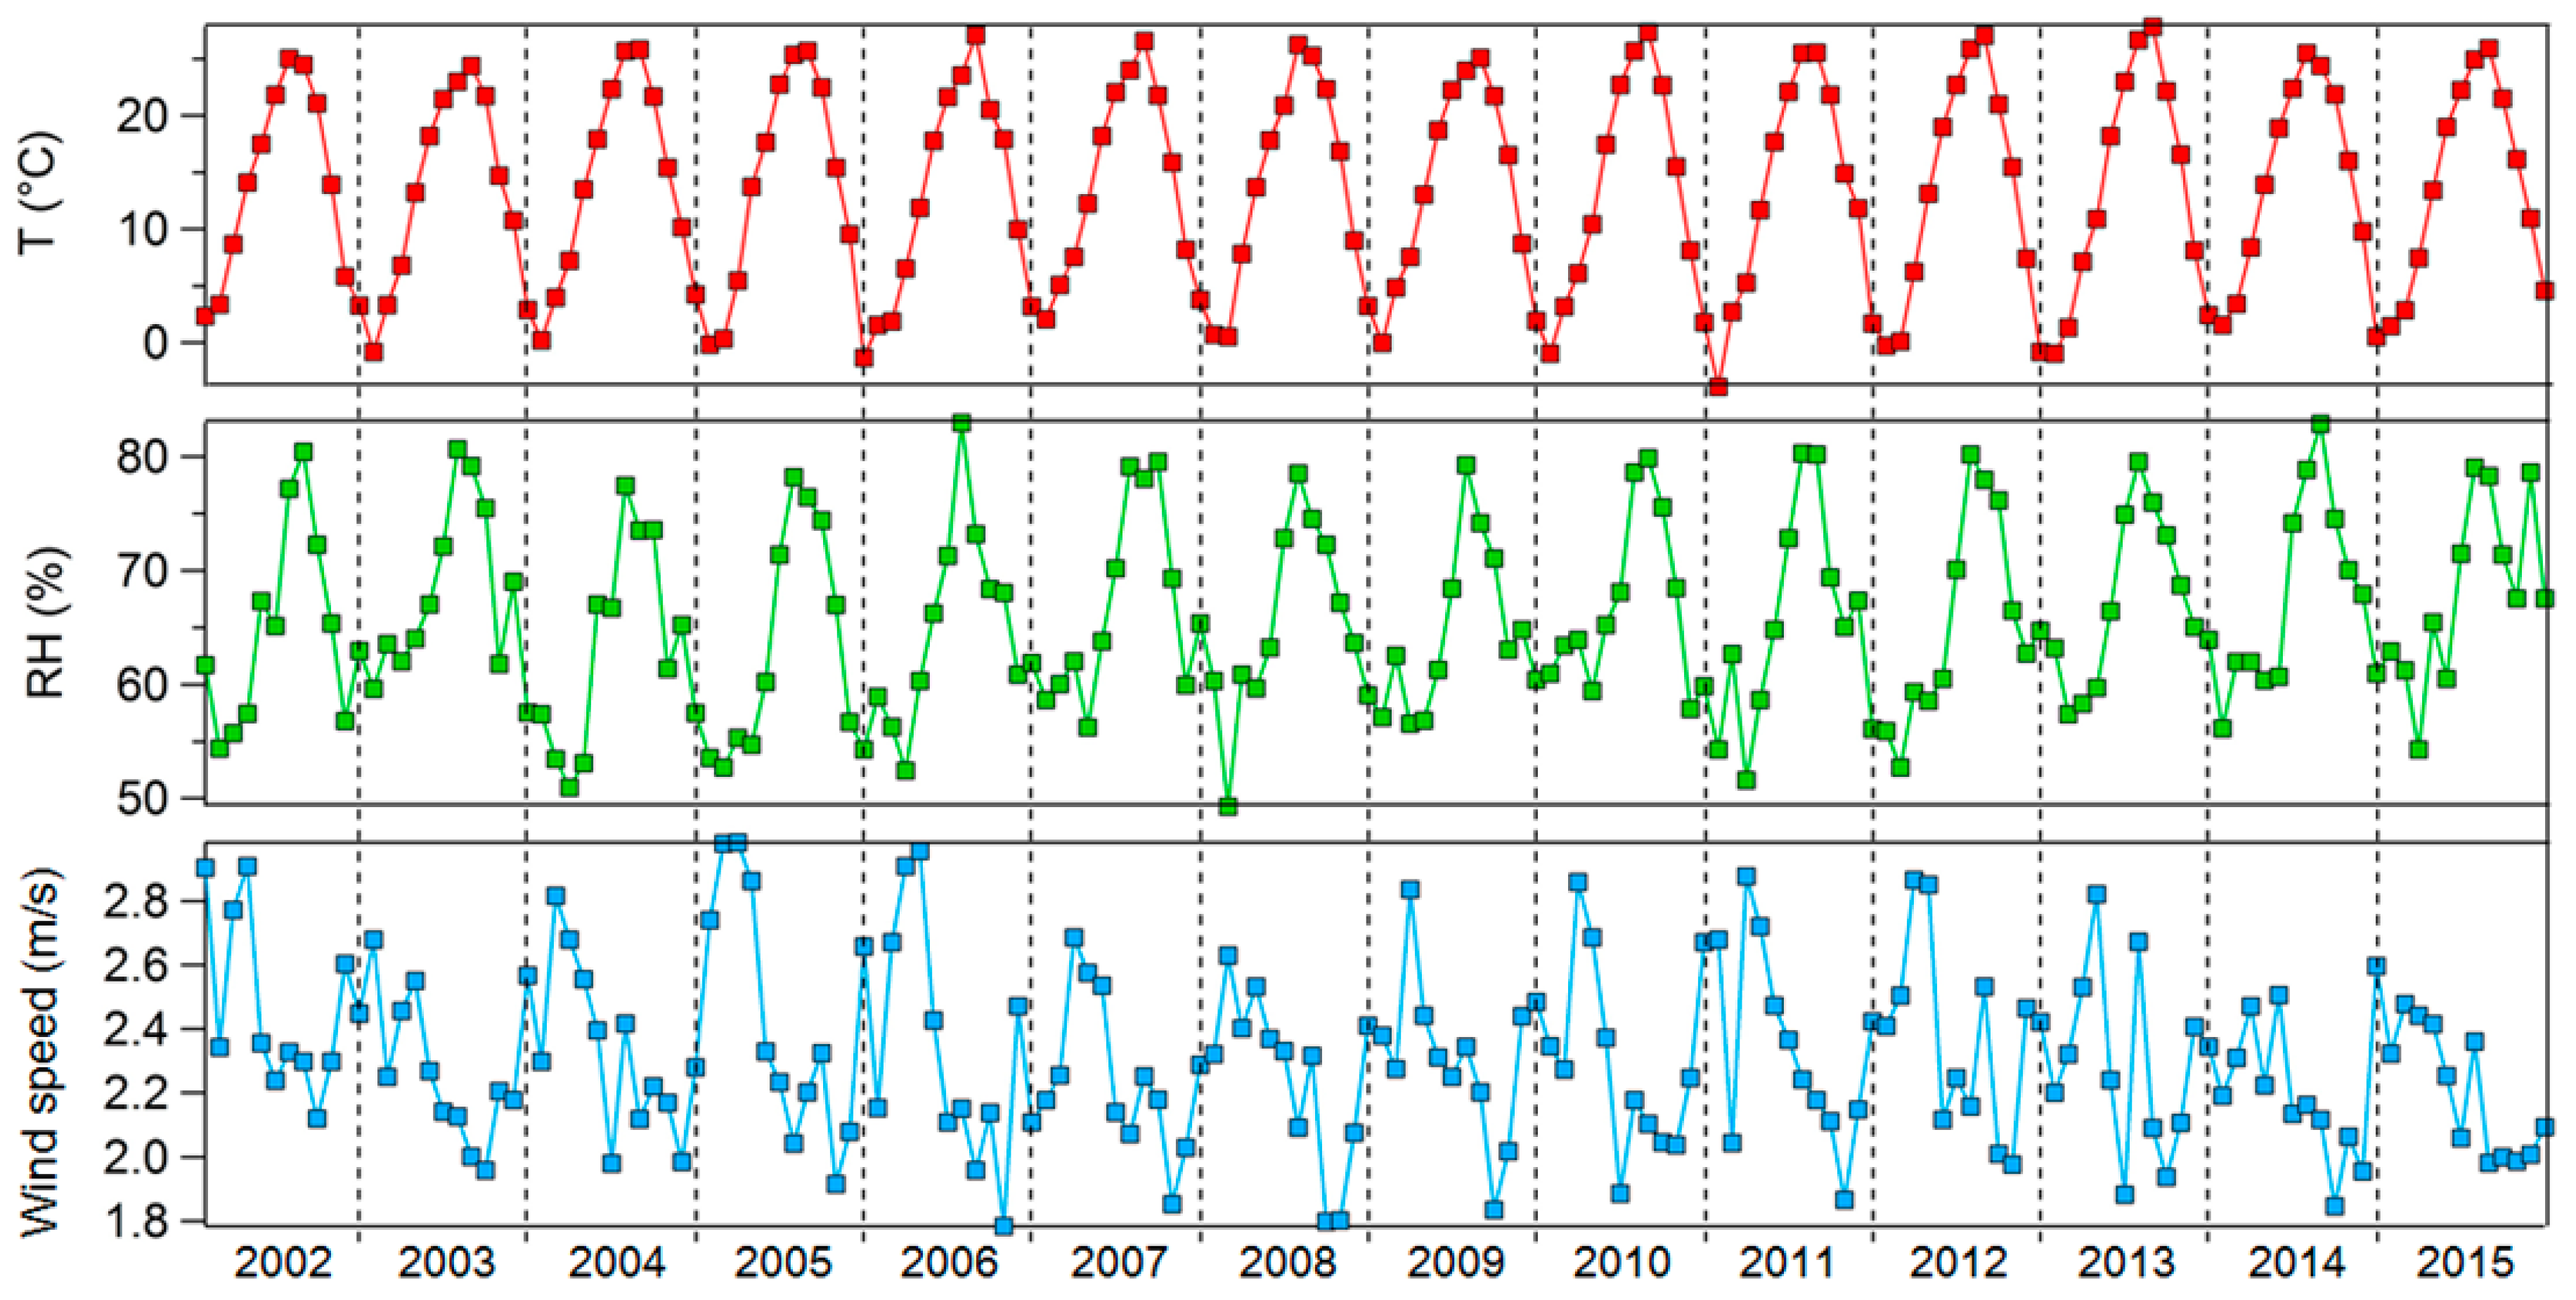
3.1. Monthly Average of Dry Eye Syndrome Incidence Rates, Air Pollutant Levels, and Meteorological Factors
3.2. Dry Eye Syndrome Incidence Rate Prediction Model
4. Conclusions
Author Contributions
Funding
Acknowledgments
Conflicts of Interest
References
- Lekhanont, K.; Rojanaporn, D.; Chuck, R.S.; Vongthongsri, A. Prevalence of dry eye in Bangkok, Thailand. Cornea 2006, 25, 1162–1167. [Google Scholar] [CrossRef] [PubMed]
- Tong, L.; Waduthantri, S.; Wong, T.Y.; Saw, S.M.; Wang, J.J.; Rosman, M.; Lamoureux, E. Impact of symptomatic dry eye on vision-related daily activities: The Singapore malay eye study. Eye 2010, 24, 1486–1491. [Google Scholar] [CrossRef] [PubMed]
- Le, Q.; Zhou, X.; Ge, L.; Wu, L.; Hong, J.; Xu, J. Impact of dry eye syndrome on vision-related quality of life in a non-clinic-based general population. BMC Ophthalmol. 2012, 12, 22. [Google Scholar] [CrossRef] [PubMed] [Green Version]
- Baudouin, C.; Messmer, E.M.; Aragona, P.; Geerling, G.; Akova, Y.A.; Benítez-Del-Castillo, J.; Boboridis, K.G.; Merayo-Lloves, J.; Rolando, M.; Labetoulle, M. Revisiting the vicious circle of dry eye disease: A focus on the pathophysiology of meibomian gland dysfunction. Br. J. Ophthalmol. 2016, 100, 300–306. [Google Scholar] [CrossRef]
- Zhong, J.Y.; Lee, Y.C.; Hsieh, C.J.; Tseng, C.C.; Yiin, L.M. Association between dry eye disease, air pollution and weather changes in Taiwan. Int. J. Environ. Res. Public Health 2018, 15, 2269. [Google Scholar] [CrossRef] [Green Version]
- Sharma, A.; Hindman, H.B. Aging: A predisposition to dry eyes. J. Ophthalmol. 2014, 2014, 1–8. [Google Scholar] [CrossRef]
- Moss, S.E.; Klein, R.; Klein, B.E.K. Prevalance of and risk factors for dry eye syndrome. Arch. Ophthalmol. 2000, 118, 1264–1268. [Google Scholar] [CrossRef] [Green Version]
- Chia, E.M.; Mitchell, P.; Rochtchina, E.; Lee, A.J.; Maroun, R.; Wang, J.J. Prevalence and associations of dry eye syndrome in an older population: The blue mountains eye study. Clin. Exp. Ophthalmol. 2003, 31, 229–232. [Google Scholar] [CrossRef]
- Uchino, M.; Schaumberg, D.A.; Dogru, M.; Uchino, Y.; Fukagawa, K.; Shimmura, S.; Satoh, T.; Takebayashi, T.; Tsubota, K. Prevalence of dry eye disease among Japanese visual display terminal users. Ophthalmology 2008, 115, 1982–1988. [Google Scholar] [CrossRef]
- Jie, Y.; Xu, L.; Wu, Y.Y.; Jonas, J.B. Prevalence of dry eye among adult Chinese in the Beijing eye study. Eye 2009, 23, 688–693. [Google Scholar] [CrossRef] [Green Version]
- Farrand, K.F.; Fridman, M.; Stillman, I.Ö.; Schaumberg, D.A. Prevalence of diagnosed dry eye disease in the United States among adults aged 18 years and older. Am. J. Ophthalmol. 2017, 182, 90–98. [Google Scholar] [CrossRef] [PubMed] [Green Version]
- Yamada, M.; Mizuno, Y.; Shigeyasu, C. Impact of dry eye on work productivity. Clin. Outcomes Res. 2012, 4, 307. [Google Scholar] [CrossRef] [Green Version]
- Cuevas, M.; González-García, M.J.; Castellanos, E.; Quispaya, R.; La Parra, P.D.; Fernández, I.; Calonge, M. Correlations among symptoms, signs, and clinical tests in evaporative-type dry eye disease caused by Meibomian Gland Dysfunction (MGD). Curr. Eye Res. 2012, 37, 855–863. [Google Scholar] [CrossRef] [PubMed]
- Smith, J.A.; Albenz, J.; Begley, C.; Caffery, B.; Nichols, K.; Schaumberg, D.; Schein, O. The epidemiology of dry eye disease: Report of the epidemiology subcommittee of the international Dry Eye WorkShop. Ocul. Surf. 2007, 5, 93–107. [Google Scholar]
- Hyon, J.Y.; Yang, H.K.; Han, S.B. Association between dry eye disease and psychological stress among paramedical workers in Korea. Sci. Rep. 2019, 9, 1–6. [Google Scholar] [CrossRef] [PubMed] [Green Version]
- Bakkar, M.M.; Shihadeh, W.A.; Haddad, M.F.; Khader, Y.S. Epidemiology of symptoms of dry eye disease (DED) in Jordan: A cross-sectional non-clinical population-based study. Contact Lens Anterior Eye 2016, 39, 197–202. [Google Scholar] [CrossRef]
- Stapleton, F.; Alves, M.; Bunya, V.Y.; Jalbert, I.; Lekhanont, K.; Malet, F.; Na, K.S.; Schaumberg, D.; Uchino, M.; Vehof, J.; et al. TFOS DEWS II Epidemiology Report. Ocul. Surf. 2017, 15, 334–365. [Google Scholar] [CrossRef]
- Man, R.E.K.; Veerappan, A.R.; Tan, S.P.; Fenwick, E.K.; Sabanayagam, C.; Chua, J.; Leong, Y.Y.; Wong, T.Y.; Lamoureux, E.L.; Cheng, C.Y.; et al. Incidence and risk factors of symptomatic dry eye disease in Asian Malays from the Singapore Malay Eye Study. Ocul. Surf. 2017, 15, 742–748. [Google Scholar] [CrossRef]
- Yu, D.; Deng, Q.; Wang, J.; Chang, X.; Wang, S.; Yang, R.; Yu, J.; Yu, J. Air pollutants are associated with dry eye disease in urban ophthalmic outpatients: A prevalence study in China. J. Transl. Med. 2019, 17, 46. [Google Scholar] [CrossRef] [Green Version]
- Mo, Z.; Fu, Q.; Lyu, D.; Zhang, L.; Qin, Z.; Tang, Q.; Yin, H.; Xu, P.; Wu, L.; Wang, X.; et al. Impacts of air pollution on dry eye disease among residents in Hangzhou, China: A case-crossover study. Environ. Pollut. 2019, 246, 183–189. [Google Scholar] [CrossRef]
- Calonge, M.; Pinto-Fraga, J.; González-García, M.J.; Enríquez-De-Salamanca, A.; López-De La Rosa, A.; Fernández, I.; López-Miguel, A. Effects of the external environment on dry eye disease. Int. Ophthalmol. Clin. 2017, 57, 23–40. [Google Scholar] [CrossRef] [PubMed]
- Ravilla, T.D.; Gupta, S.; Ravindran, R.D.; Vashist, P.; Krishnan, T.; Maraini, G.; Chakravarthy, U.; Fletcher, A.E. Use of cooking fuels and cataract in a population-based study: The India eye disease study. Environ. Health Perspect. 2016, 124, 1857–1862. [Google Scholar] [CrossRef] [PubMed] [Green Version]
- Novaes, P.; Hilário do Nascimento Saldiva, P.; Matsuda, M.; Macchione, M.; Peres Rangel, M.; Kara-José, N.; Berra, A. The effects of chronic exposure to traffic derived air pollution on the ocular surface. Environ. Res. 2010, 110, 372–374. [Google Scholar] [CrossRef]
- Moen, B.E.; Norbäck, D.; Wieslander, G.; Bakke, J.; Magerøy, N.; Granslo, J.; Irgens, Å.; Bråtveit, M.; Hollund, B.; Aasen, T. Can air pollution affect tear film stability? a cross-sectional study in the aftermath of an explosion accident. BMC Public Health 2011, 11, 1–6. [Google Scholar] [CrossRef] [PubMed] [Green Version]
- Torricelli, A.A.M.; Novaes, P.; Matsuda, M.; Braga, A.; Saldiva, P.H.N.; Alve, M.R.; Monteiro, M.L.R. Correlation between signs and symptoms of ocular surface dysfunction and tear osmolarity with ambient levels of air pollution in a large metropolitan area. Cornea 2013, 32, e11–e15. [Google Scholar]
- Um, S.B.; Kim, N.H.; Lee, H.K.; Song, J.S.; Kim, H.C. Spatial epidemiology of dry eye disease: Findings from South Korea. Int. J. Health Geogr. 2014, 13, 31. [Google Scholar] [CrossRef] [PubMed] [Green Version]
- Hwang, S.H.; Choi, Y.H.; Paik, H.J.; RyangWee, W.; KumKim, M.; Kim, D.H. Potential importance of ozone in the association between outdoor air pollution and dry eye disease in South Korea. JAMA Ophthalmol. 2016, 134, 503–510. [Google Scholar] [CrossRef] [Green Version]
- National Health Insurance Service of South Korea. Key Statistics of National Health Insurance. Available online: http://www.nhis.or.kr/menu/boardRetriveMenuSet.xx?menuId=F3322 (accessed on 1 March 2020).
- Seo, J.W.; Youn, J.S.; Park, S.J.; Joo, C.K. Development of a conjunctivitis outpatient rate prediction model incorporating ambient ozone and meteorological factors in South Korea. Front. Pharmacol. 2018, 9, 1135. [Google Scholar] [CrossRef]


| Data | Categories | Variables |
|---|---|---|
| DES incidence rate | Incidence rate | y |
| Air pollutant data | PM10, NO2, SO2, O3, CO | x1, x2, x3, x4, x5 |
| Meteorological data | Temperature, humidity, wind speed | z1, z2, z3 |
| Population rates | Men: (all), (0–9), (10–19), (20–29), (30-39), (40-49), (50-59), (60-69), (70–79), (over 80) years | Men: M, M1, M2, M3, M4, M5, M6, M7, M8, M9 |
| Women: (all), (0–9), (10–19), (20–29), (30-39), (40-49), (50-59), (60-69), (70–79), (over 80) years | Women: W, W1, W2, W3, W4, W5, W6, W7, W8, W9 |
| x2 | x3 | x4 | x5 | z1 | z2 | z3 | y | |
|---|---|---|---|---|---|---|---|---|
| x1 | 0.616 | 0.569 | 0.183 | 0.506 | −0.447 | −0.643 | 0.429 | −0.272 |
| x2 | 1.000 | 0.815 | −0.324 | 0.835 | −0.841 | −0.784 | 0.185 | −0.176 |
| x3 | 1.000 | −0.350 | 0.876 | −0.837 | −0.735 | 0.350 | −0.226 | |
| x4 | 1.000 | −0.559 | 0.414 | 0.035 | 0.151 | 0.274 | ||
| x5 | 1.000 | −0.815 | −0.649 | 0.274 | −0.477 | |||
| z1 | 1.000 | 0.833 | −0.479 | 0.025 | ||||
| z2 | 1.000 | −0.574 | 0.062 | |||||
| z3 | 1.000 | −0.041 |
| 2002 | 2003 | 2004 | 2005 | 2006 | 2007 | 2008 | 2009 | 2010 | 2011 | 2012 | 2013 | |
|---|---|---|---|---|---|---|---|---|---|---|---|---|
| x1 | 0.488 | 0.287 | 0.555 | 0.373 | 0.151 | 0.290 | 0.232 | 0.012 | −0.034 | 0.188 | 0.286 | 0.147 |
| x2 | 0.475 | 0.330 | 0.400 | 0.377 | 0.183 | 0.344 | 0.252 | 0.283 | 0.296 | 0.284 | 0.226 | 0.154 |
| x3 | 0.153 | −0.069 | 0.134 | 0.155 | 0.036 | 0.127 | 0.173 | 0.290 | 0.324 | 0.421 | 0.262 | 0.391 |
| x4 | 0.128 | 0.049 | −0.186 | −0.436 | −0.260 | −0.478 | −0.382 | −0.395 | −0.305 | −0.374 | −0.146 | −0.066 |
| x5 | −0.089 | −0.017 | 0.019 | −0.112 | −0.164 | 0.075 | 0.013 | −0.088 | −0.096 | −0.16 | −0.381 | −0.422 |
| z1 | 0.119 | 0.149 | −0.066 | −0.090 | −0.100 | −0.024 | −0.070 | −0.038 | 0.043 | −0.005 | 0.028 | 0.241 |
| z2 | −0.216 | −0.232 | −0.311 | −0.423 | −0.198 | −0.309 | −0.211 | −0.260 | −0.360 | −0.361 | −0.339 | −0.477 |
| z3 | 0.266 | 0.134 | 0.081 | −0.103 | 0.024 | −0.075 | −0.128 | −0.052 | −0.052 | −0.025 | −0.122 | −0.015 |
| District | M | M1 | M2 | M3 | M4 | M5 | M6 | M7 | M8 | M9 |
|---|---|---|---|---|---|---|---|---|---|---|
| Nationwide | −0.898 | −0.954 | −0.565 | −0.963 | −0.947 | 0.788 | 0.952 | 0.949 | 0.944 | 0.920 |
| Administrative district | 0.215 | −0.744 | −0.174 | −0.508 | −0.390 | 0.346 | 0.822 | 0.249 | 0.359 | 0.040 |
| District | W | W1 | W2 | W3 | W4 | W5 | W6 | W7 | W8 | W9 |
| Nationwide | 0.898 | −0.957 | −0.616 | −0.961 | −0.942 | 0.752 | 0.952 | 0.927 | 0.946 | 0.935 |
| Administrative district | −0.215 | −0.739 | −0.304 | −0.457 | −0.290 | 0.388 | 0.806 | 0.012 | 0.215 | −0.060 |
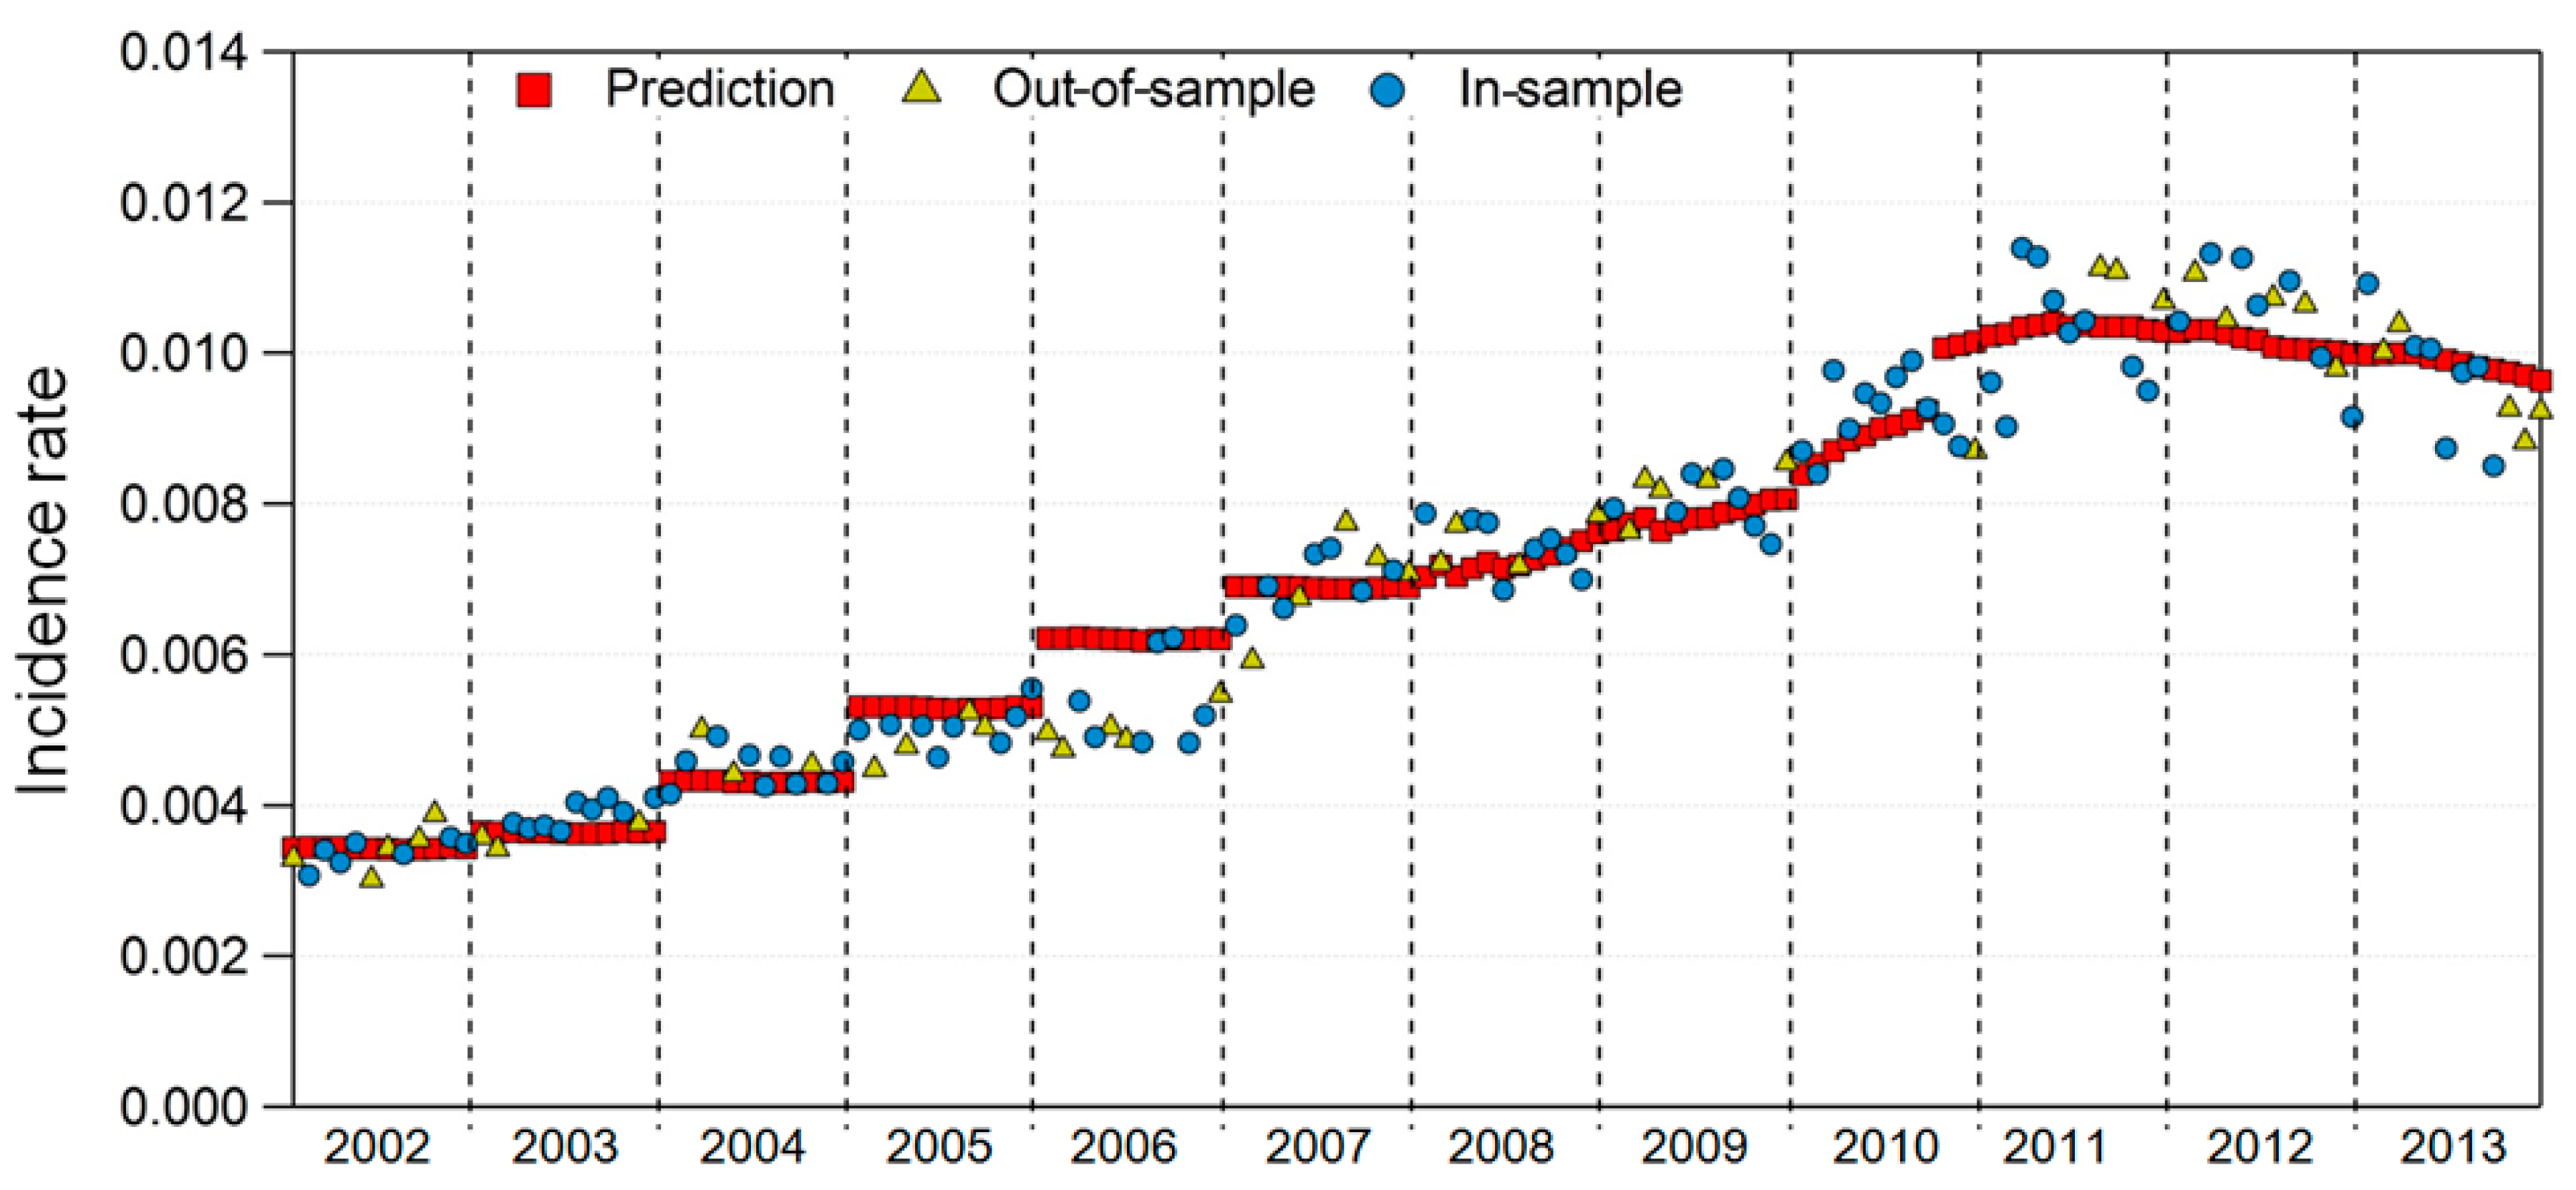
| In-sample test | R2 | 0.9443 |
| p-value | <2.2 × 10⁻¹⁶ | |
| Out-of-sample test | R2 | 0.9388 |
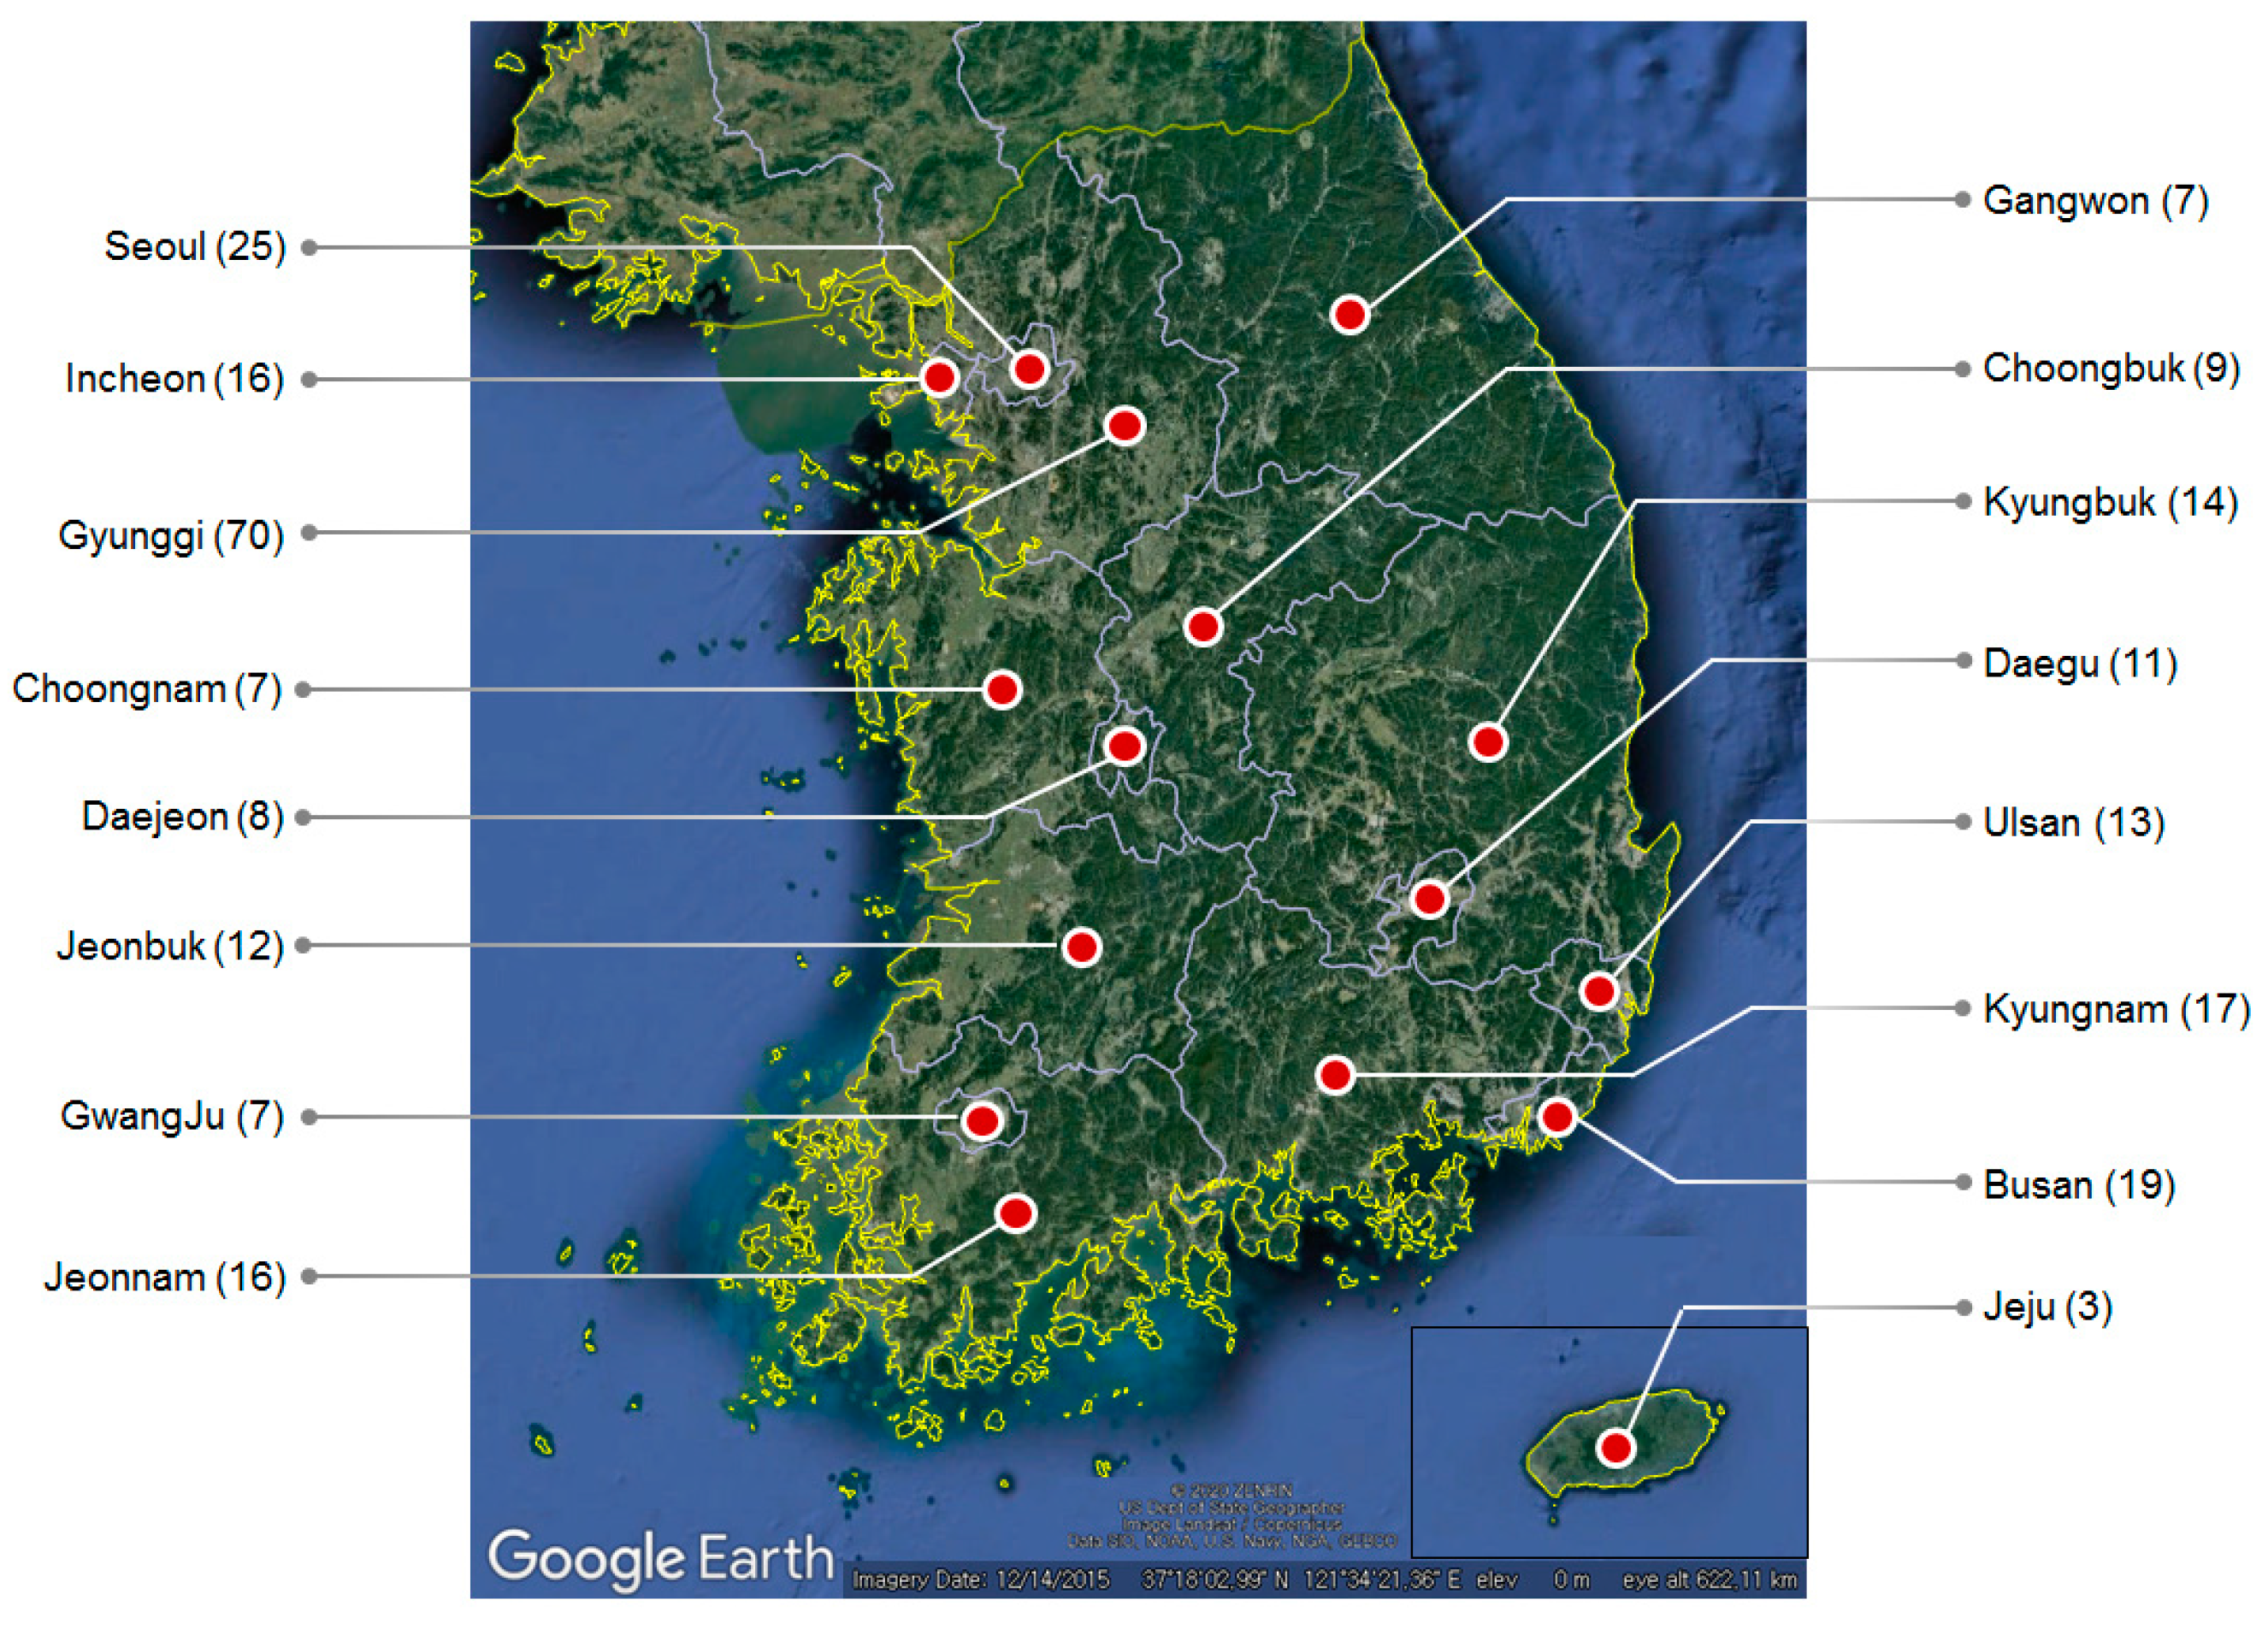
| District | Area | Area Codes |
|---|---|---|
| Metropolitans | Seoul, Busan, Daegu, Incheon, GwangJu, Daejeon, Ulsan | 11, 26, 27, 28, 29, 30, 31 |
| States | Gyunggi, Gangwon, Choongbuk, Choongnam, Jeonbuk, Jeonnam, Kyungbuk, Kyungnam, Jeju | 41, 42, 43, 44, 45, 46, 47, 48, 49 |
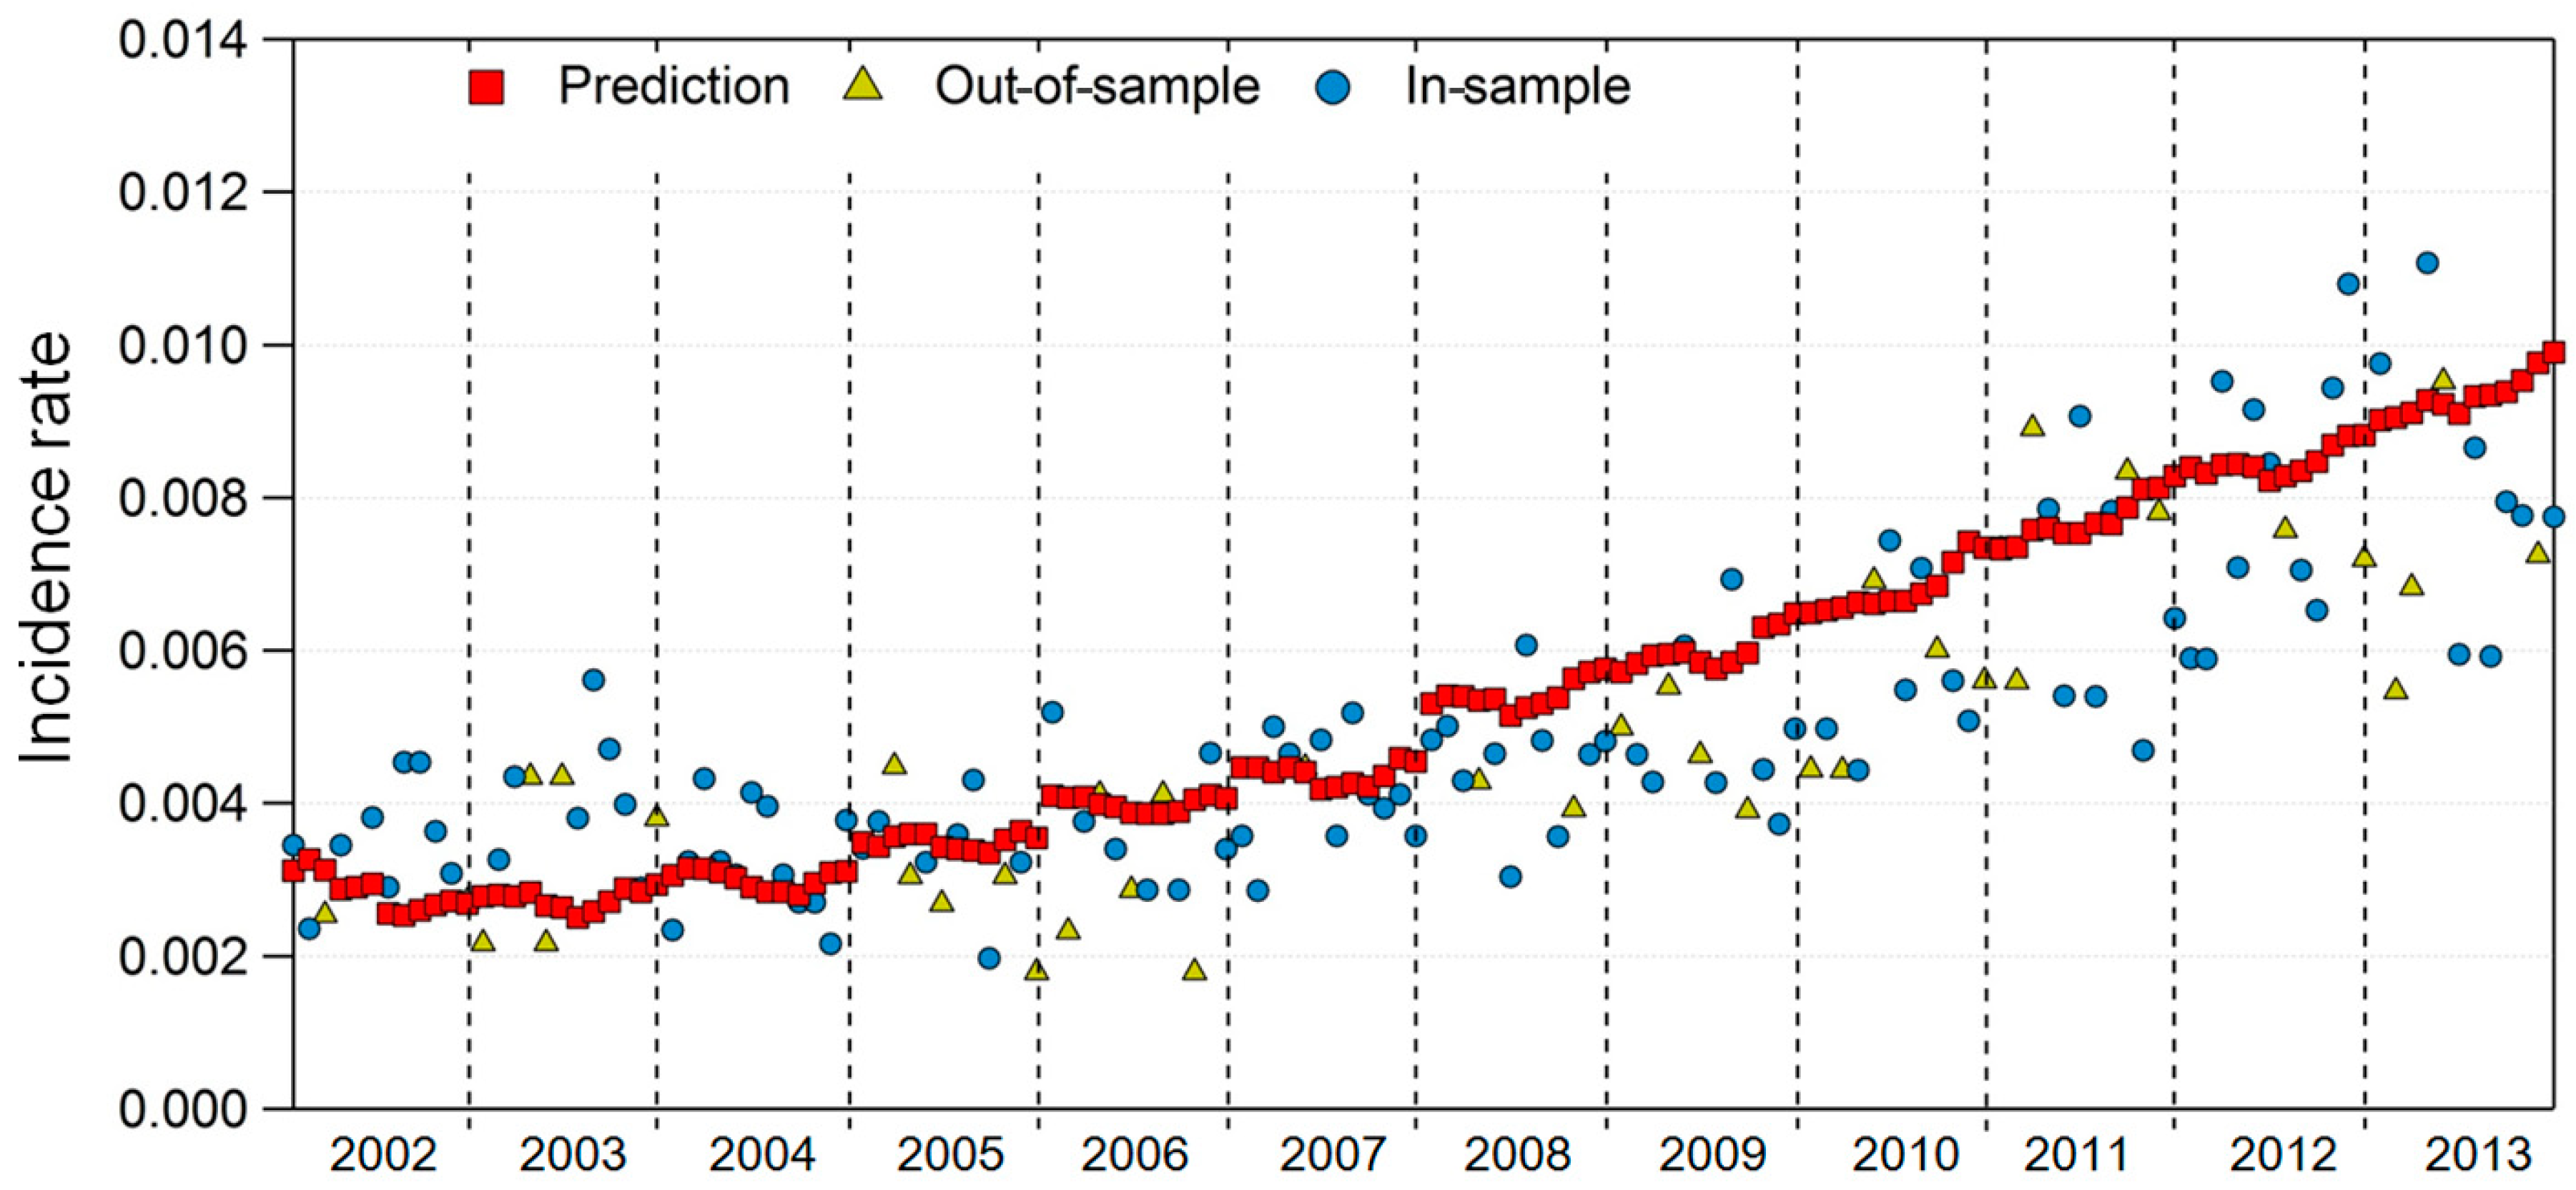
| In-sample test | R2 | 0.7085 |
| p-value | <2.2 × 10⁻¹⁶ | |
| Out-of-sample test | R2 | 0.7219 |
© 2020 by the authors. Licensee MDPI, Basel, Switzerland. This article is an open access article distributed under the terms and conditions of the Creative Commons Attribution (CC BY) license (http://creativecommons.org/licenses/by/4.0/).
Share and Cite
Youn, J.-S.; Seo, J.-W.; Park, W.; Park, S.; Jeon, K.-J. Prediction Model for Dry Eye Syndrome Incidence Rate Using Air Pollutants and Meteorological Factors in South Korea: Analysis of Sub-Region Deviations. Int. J. Environ. Res. Public Health 2020, 17, 4969. https://0-doi-org.brum.beds.ac.uk/10.3390/ijerph17144969
Youn J-S, Seo J-W, Park W, Park S, Jeon K-J. Prediction Model for Dry Eye Syndrome Incidence Rate Using Air Pollutants and Meteorological Factors in South Korea: Analysis of Sub-Region Deviations. International Journal of Environmental Research and Public Health. 2020; 17(14):4969. https://0-doi-org.brum.beds.ac.uk/10.3390/ijerph17144969
Chicago/Turabian StyleYoun, Jong-Sang, Jeong-Won Seo, Wonjun Park, SeJoon Park, and Ki-Joon Jeon. 2020. "Prediction Model for Dry Eye Syndrome Incidence Rate Using Air Pollutants and Meteorological Factors in South Korea: Analysis of Sub-Region Deviations" International Journal of Environmental Research and Public Health 17, no. 14: 4969. https://0-doi-org.brum.beds.ac.uk/10.3390/ijerph17144969