Are the Chinese Moving toward a Healthy Diet? Evidence from Macro Data from 1961 to 2017


Abstract
:1. Introduction
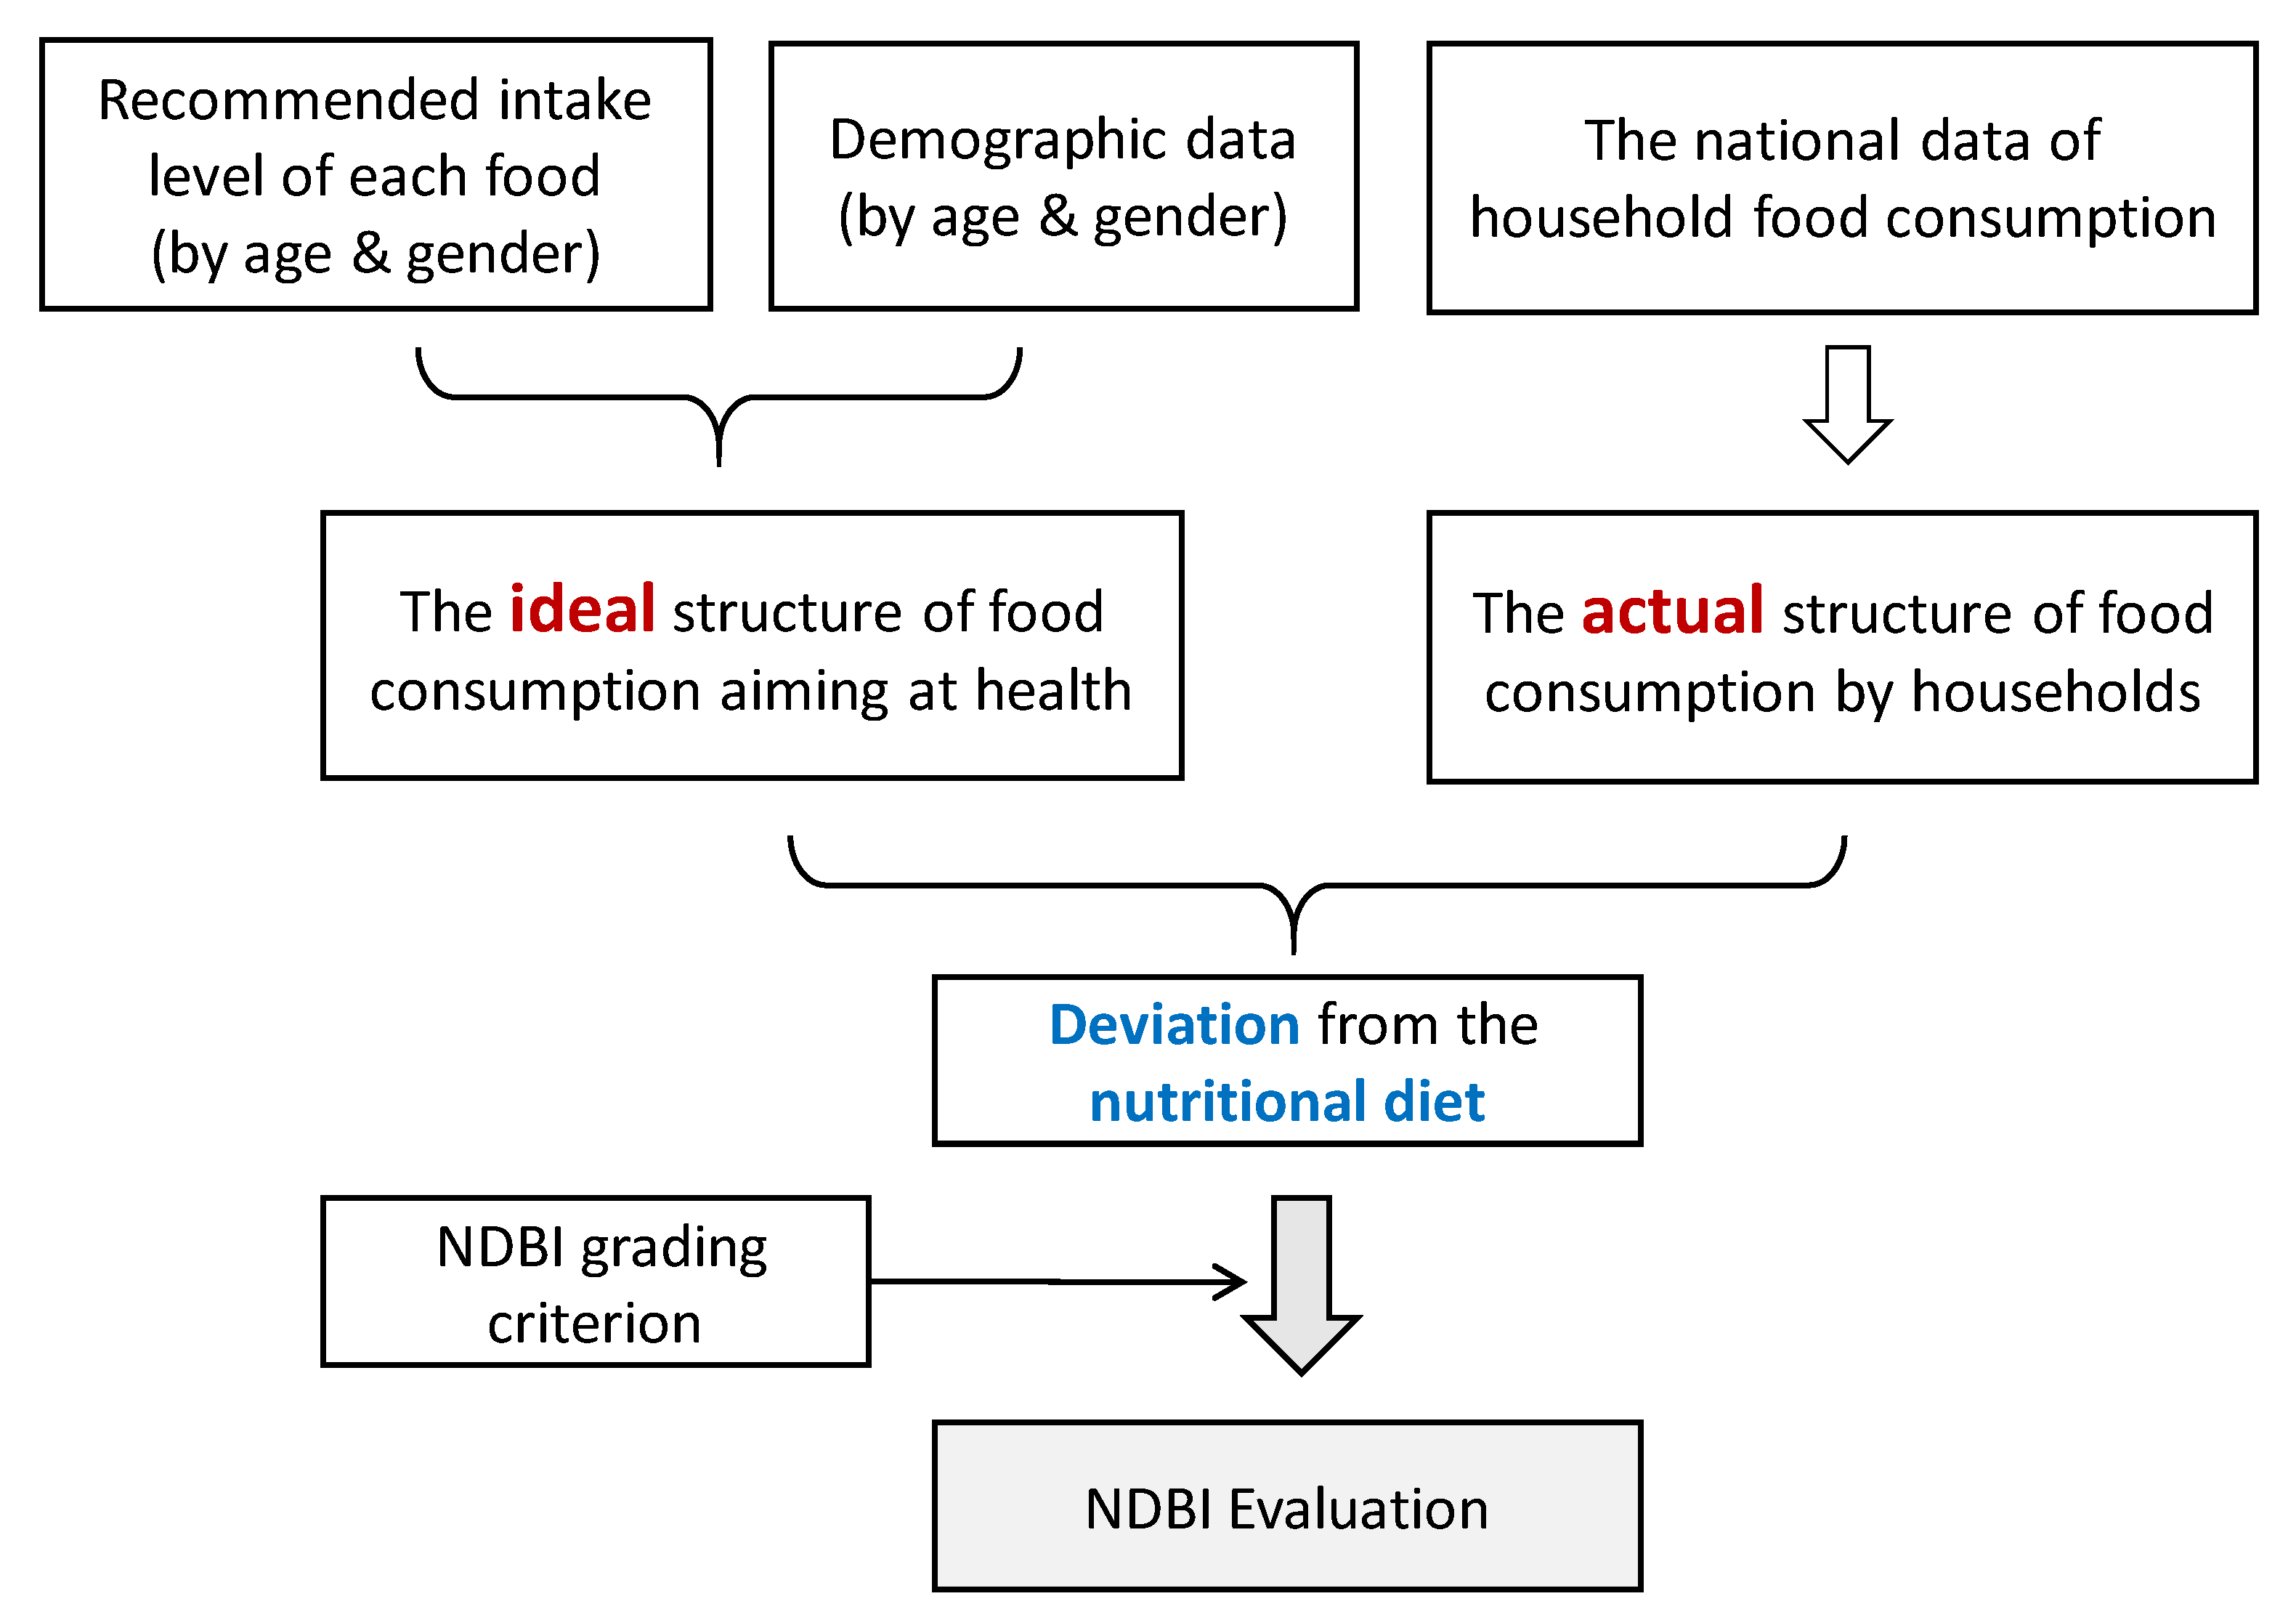
2. Materials and Methods
2.1. NDBI Grading System
2.2. NDBI Scores
2.3. NDBI Evaluation
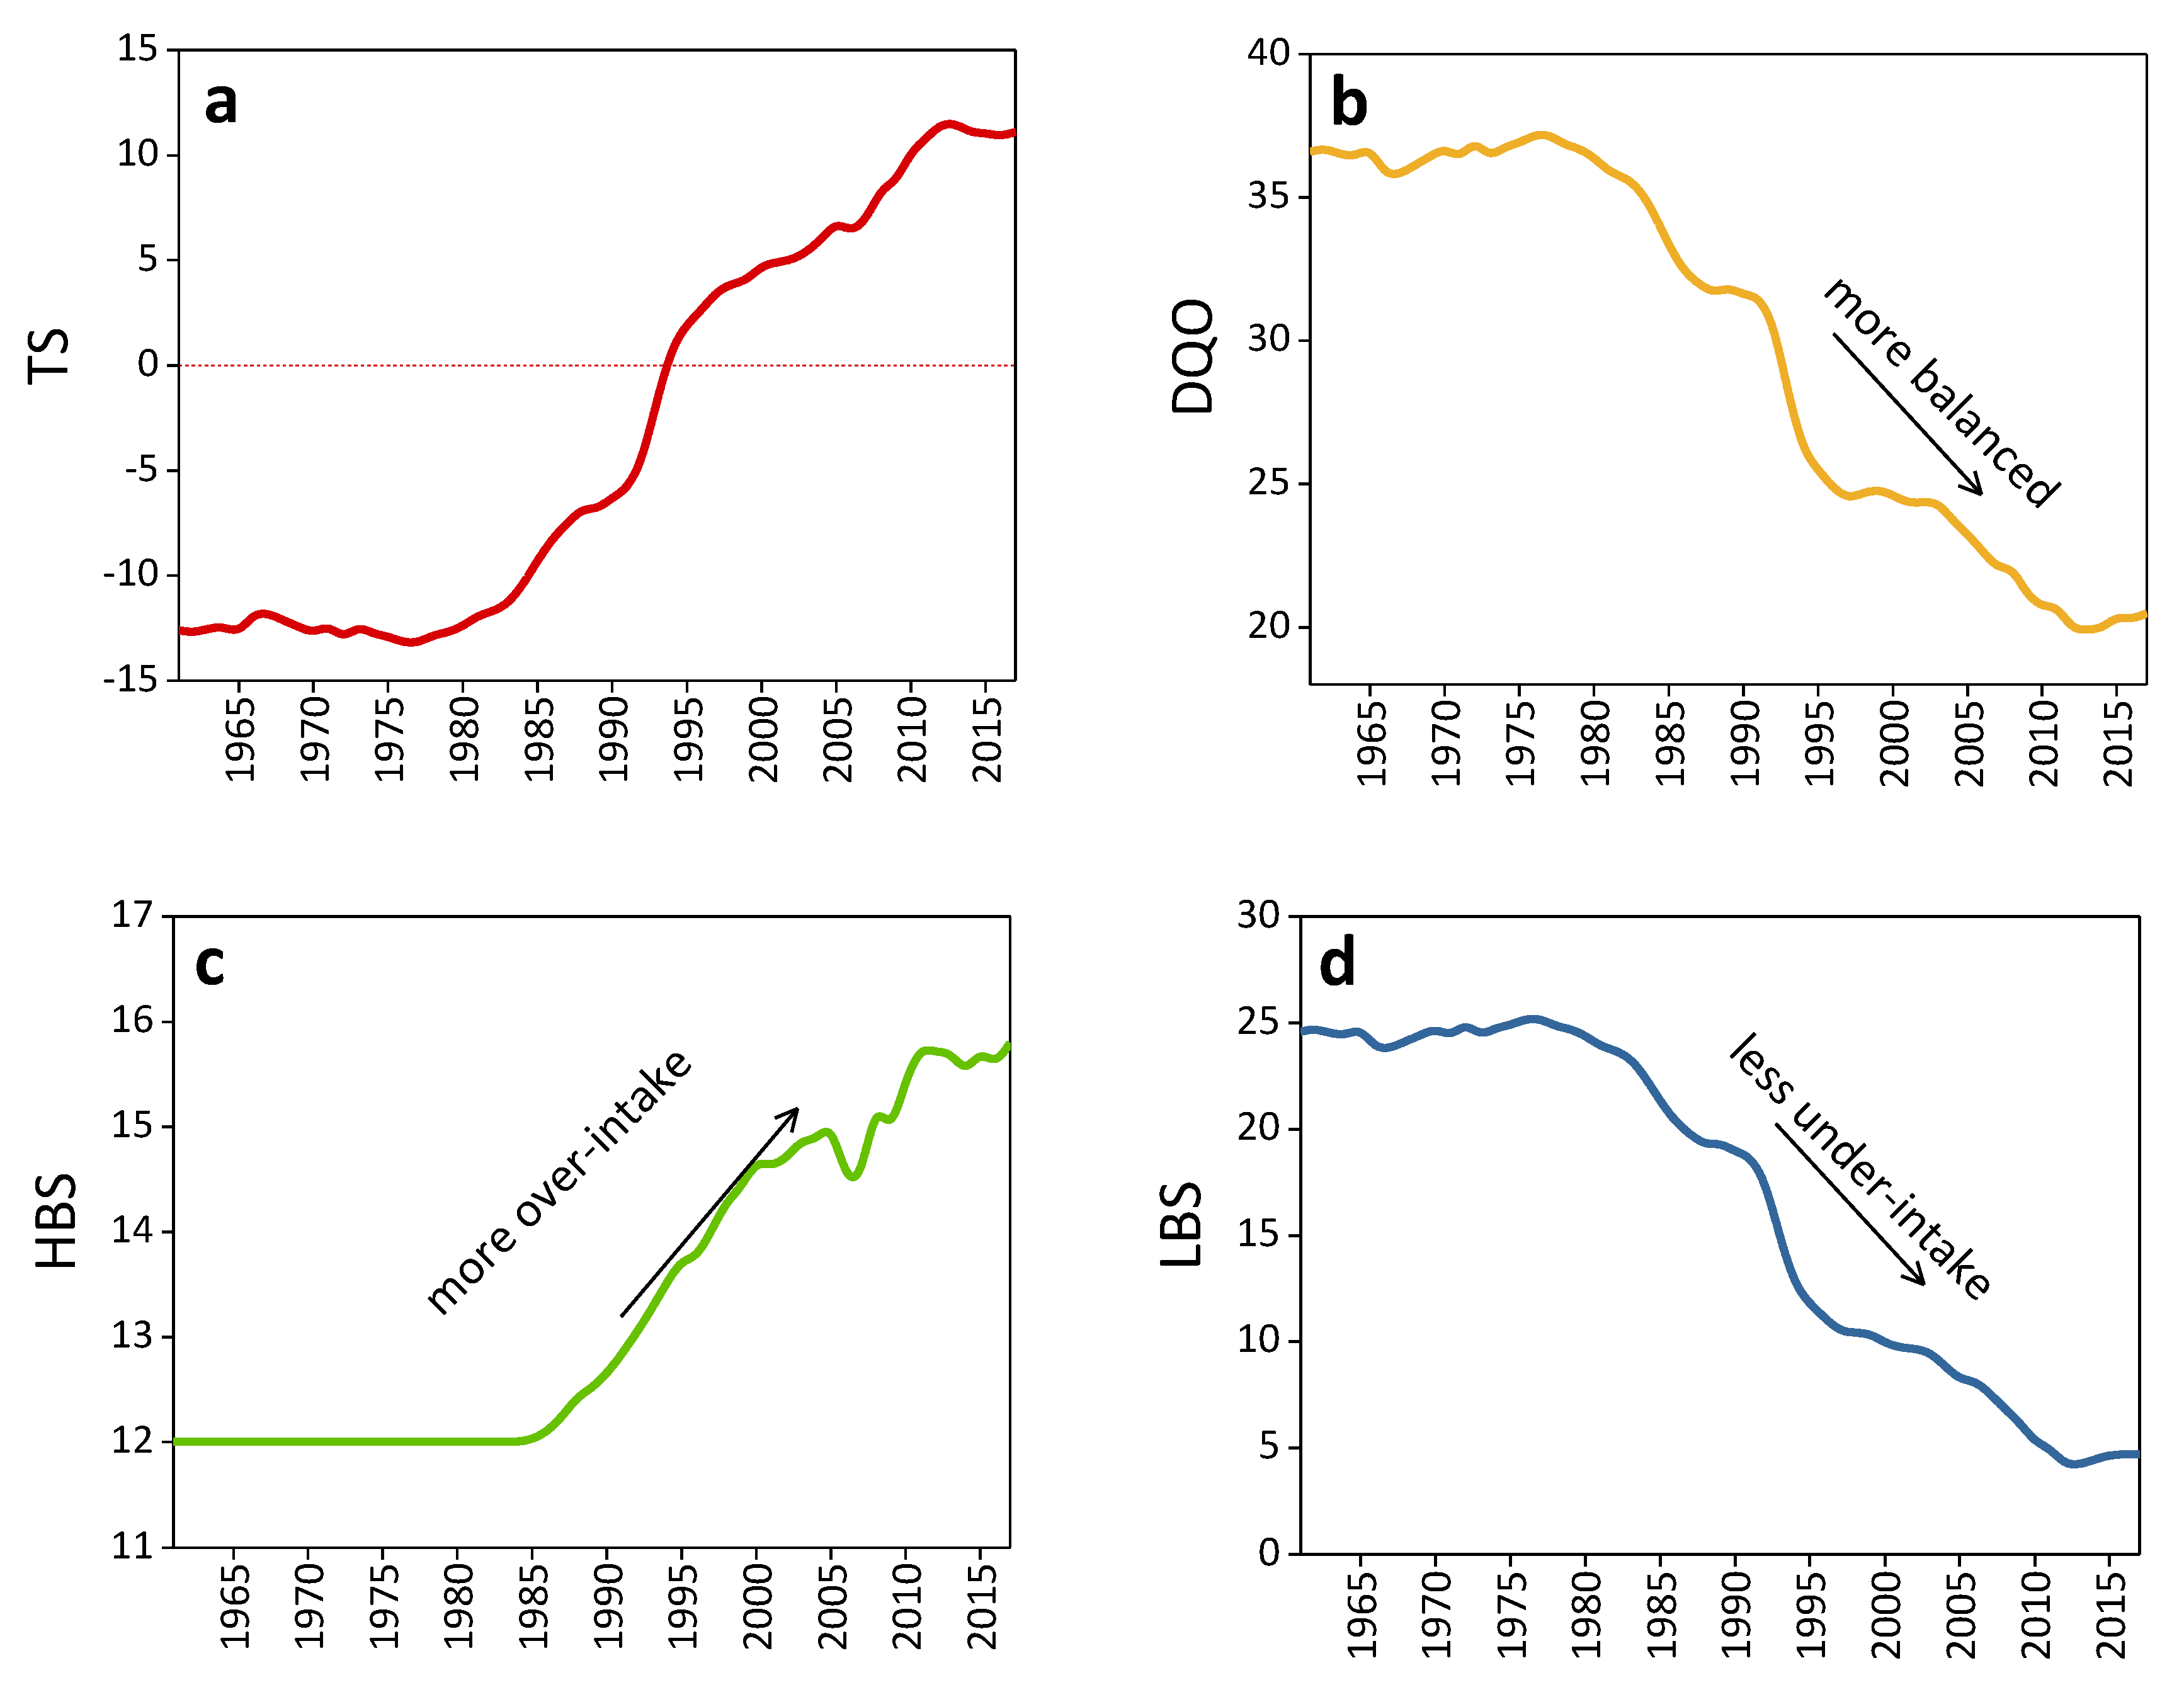
- TS (total score): adding up both negative scores and positive scores to reflect the overall diet balance. A negative TS indicates an overall under-intake diet; a positive TS indicates an overall over-intake, unbalanced diet. If the score is 0, it does not necessarily indicate that the overall intake is balanced, since it could be that the over-intake effect balanced out the under-intake effect.
- DQD (diet quality distance): adding up the absolute values of both negative scores and positive scores to reflect the degree of diet imbalance for the whole diet—the higher the score, the higher the degree of intake imbalance.
- HBS (high bound score): adding up all the positive scores to reflect the degree of over-intake in the whole diet.
- LBS (low bound score): adding up all the absolute values of negative scores to reflect the degree of under-intake in the whole diet.
3. Results
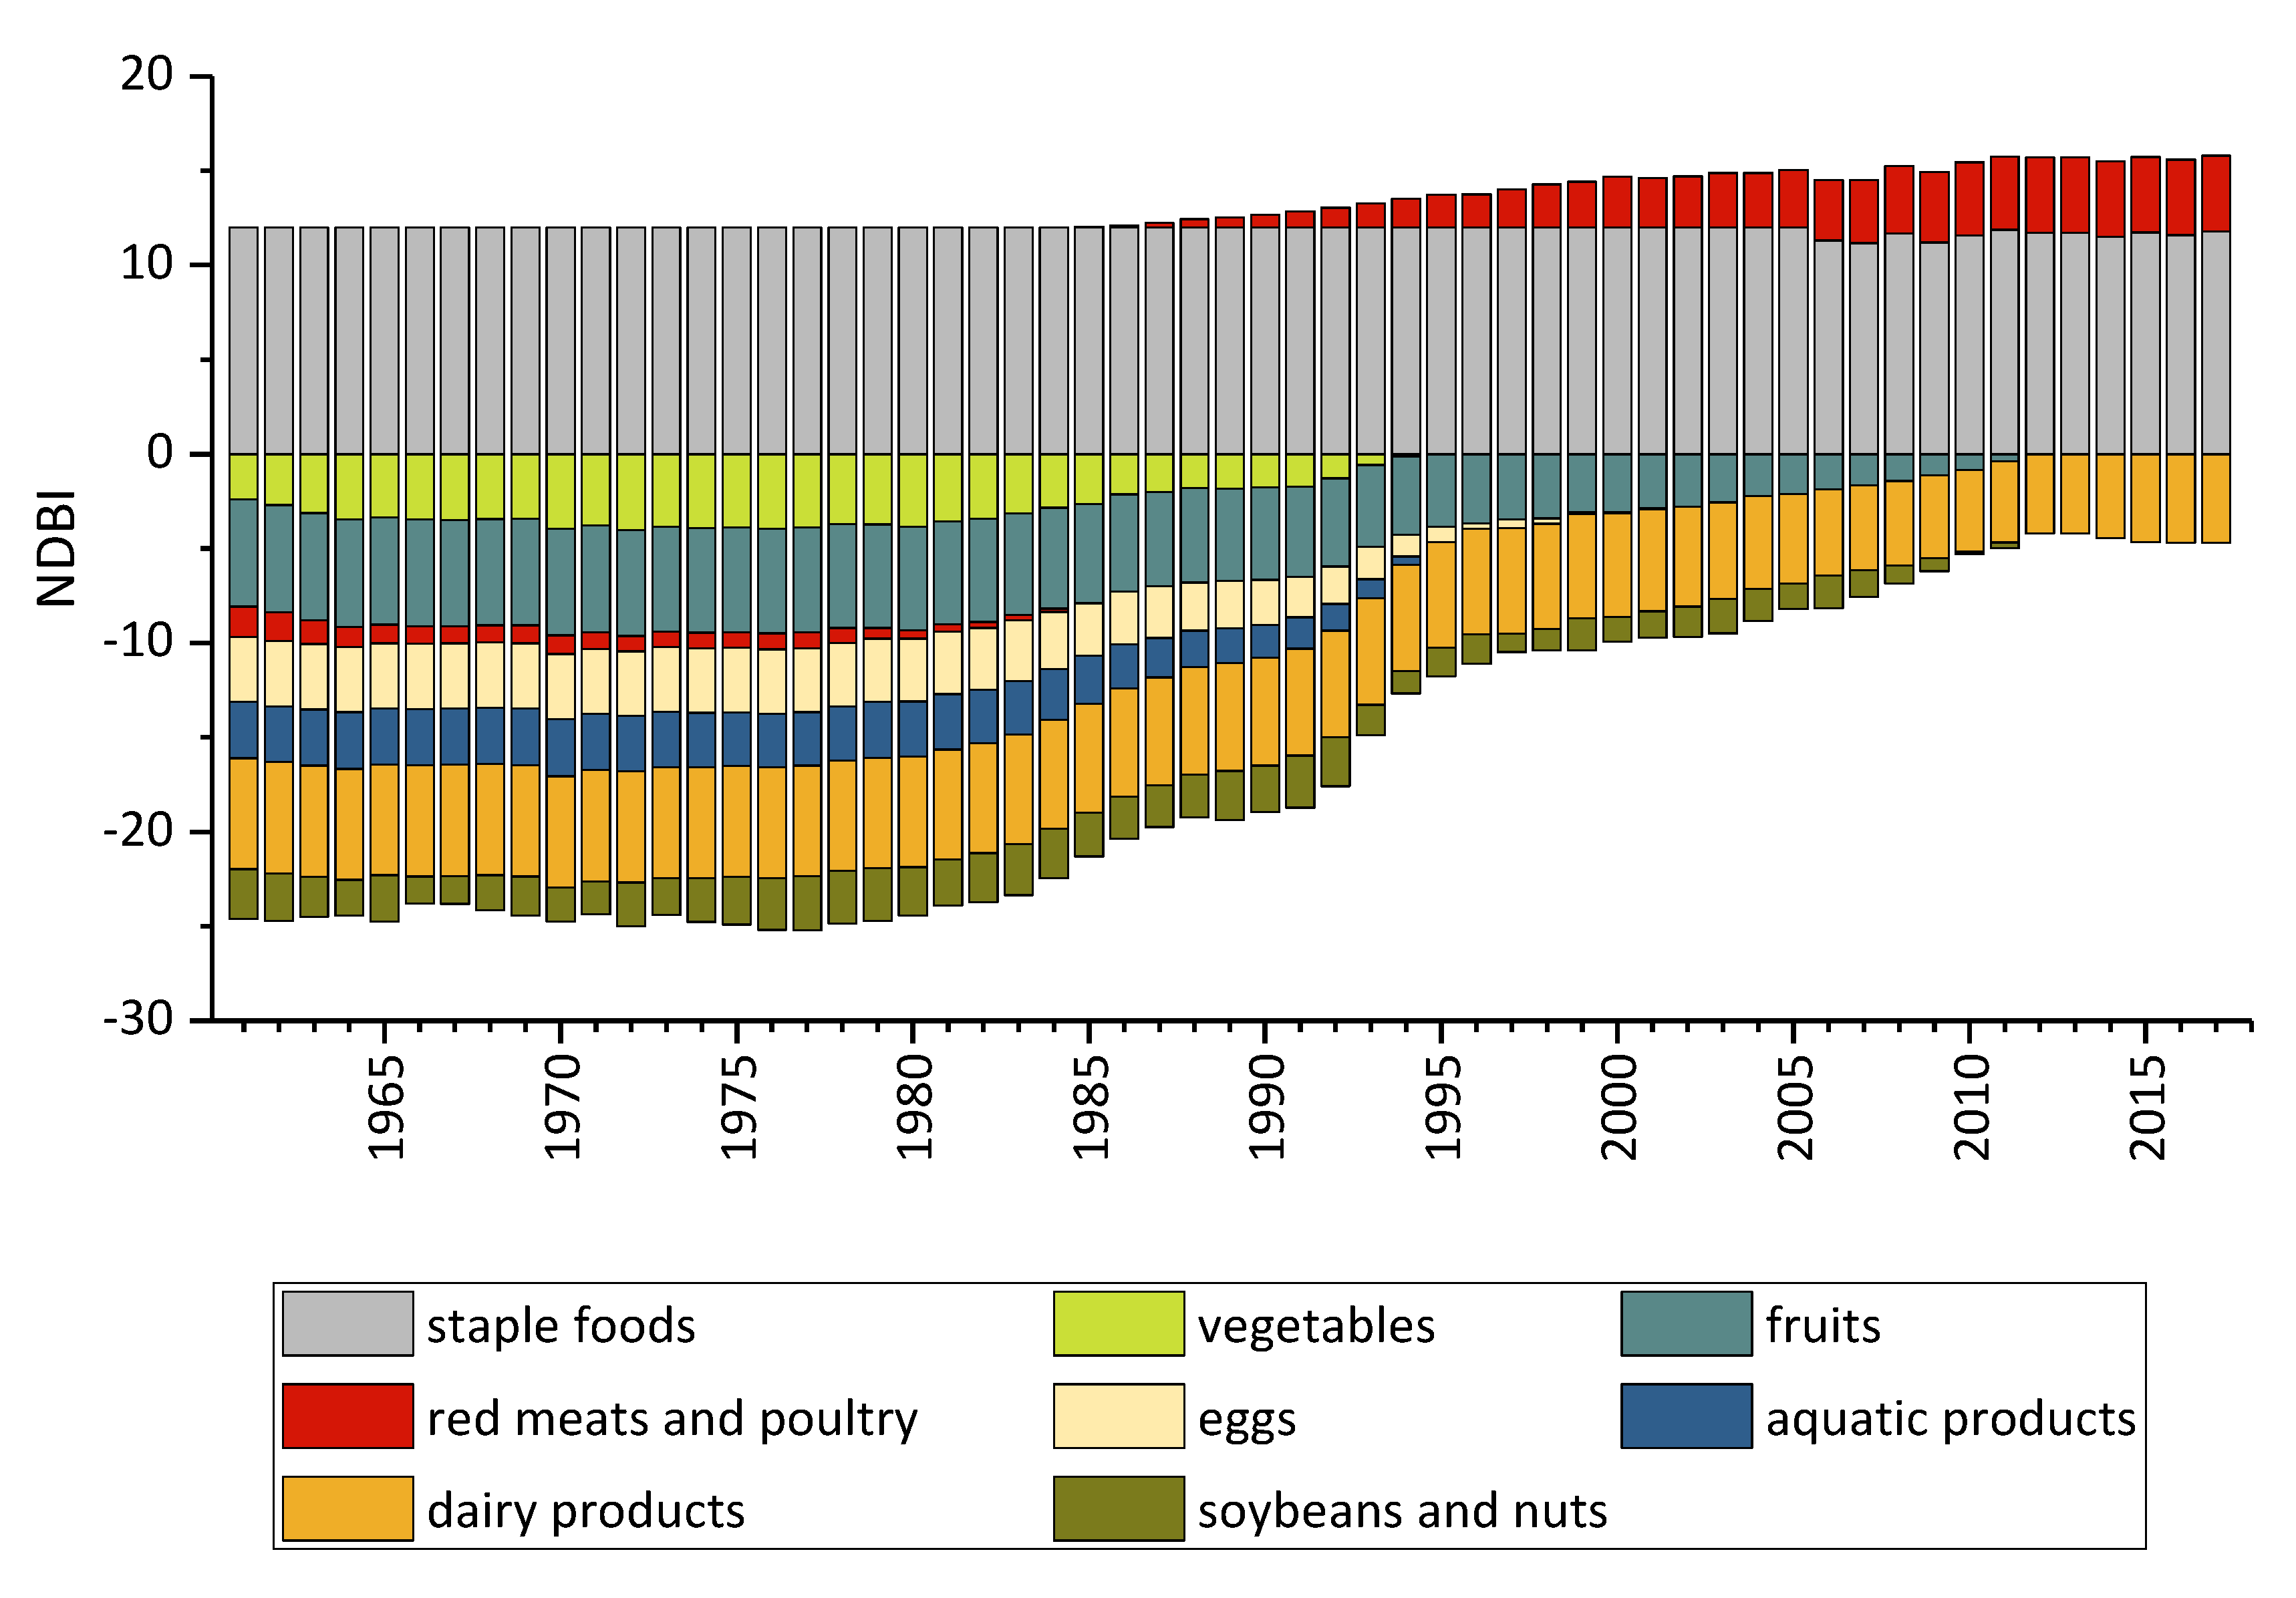
3.1. Staple Foods
3.2. Fruits and Vegetables
3.3. Animal Products
3.4. Soybean and Nuts
3.5. Overall Evaluation
3.5.1. TS (Total Score)
3.5.2. DQD (Diet Quality Distance)
3.5.3. HBS (High Bound Score)
3.5.4. LBS (Low Bound Score)
4. Discussion
4.1. Strengths of Developing a New Dietary Evaluation System
4.2. The Implication of the Findings for the Health Profile of Chinese Population
5. Conclusions
Author Contributions
Funding
Conflicts of Interest
References
- Schwingshackl, L.; Bogensberger, B.; Hoffmann, G. Diet Quality as Assessed by the Healthy Eating Index, Alternate Healthy Eating Index, Dietary Approaches to Stop Hypertension Score, and Health Outcomes: An Updated Systematic Review and Meta-Analysis of Cohort Studies. J. Acad. Nutr. Diet. 2018, 118, 74–100. [Google Scholar] [CrossRef] [Green Version]
- Reicks, M.; Trofholz, A.C.; Stang, J.S.; Laska, M.N. Impact of cooking and home food preparation interventions among adults: Outcomes and implications for future programs. J. Nutr. Educ. Behav. 2014, 46, 259–276. [Google Scholar] [CrossRef] [Green Version]
- Kennedy, E.T.; Ohls, J.; Carlson, S.; Fleming, K. The healthy eating index: Design and applications. J. Am. Diet. Assoc. 1995, 95, 1103–1108. [Google Scholar] [CrossRef]
- Patterson, R.E.; Haines, P.S.; Popkin, B.M. Diet quality index: Capturing a multidimensional behavior. Am. Diet. Assoc. 1994, 94, 57–64. [Google Scholar] [CrossRef]
- Haines, P.S.; Siega-Riz, A.M.; Popkin, B.M. The diet quality index revised: A measurement instrument for populations. J. Am. Diet. Assoc. 1999, 99, 697–704. [Google Scholar] [CrossRef]
- Richter, C.K.; Skulas-Ray, A.C.; Kris-Etherton, P.M. Recent Findings of Studies on the Mediterranean diet: What are the implications for current dietary recommendations? Endocrinol. Metab. Clin. 2014, 43, 963–980. [Google Scholar] [CrossRef]
- Mattioli, A.V.; Palmiero, P.; Manfrini, O.; Puddu, P.E.; Nodari, S.; Dei Cas, A.; Mercuro, G.; Scrutinio, D.; Palermo, P.; Sciomer, S.; et al. Mediterranean diet impact on cardiovascular diseases: A narrative review. J. Cardiovasc. Med. 2017, 18, 925–935. [Google Scholar] [CrossRef]
- Panagiotakos, D.B.; Pitsavos, C.; Stefanadis, C. Dietary patterns: A Mediterranean diet score and its relation to clinical and biological markers of cardiovascular disease risk. Nutr. Metab. Cardiovasc. Dis. 2006, 16, 559–568. [Google Scholar] [CrossRef]
- Stookey, J.D.; Wang, Y.; Ge, K.; Lin, H.; Popkin, B.M. Measuring diet quality in China: The IN-FH-UNC-CH diet quality index. Eur. J. Clin. Nutr. 2000, 54, 811–821. [Google Scholar] [CrossRef] [Green Version]
- Xuan, D.; Gengsheng, H. A comparative study of healthy diet index and Chinese diet balance index. Health Res. 2009, 38, 244–247. [Google Scholar]
- Zhihao, Z.; Ying, G.; Yinyu, Z. The impact of income growth on the food consumption patterns of urban residents. Economics 2016, 15, 263–288. [Google Scholar]
- Zhang, W.; Shen, G.; Cao, H.; Xu, X.; Wang, H. Major Agricultural Products Consumption Trend, Influence and Policy: During the 13th Five-year Period. Agric. Econ. Issues. 2016, 37, 11–17. [Google Scholar]
- Huang, J. Forty Years of China’s Agricultural Development and Reform and the Way Forward in the Future. Agric. Technol. Econ. 2018, 3, 4–15. [Google Scholar]
- Chen, Z.M.; Guo, Q.H.; Jiang, H.M. Resident Food Consumption Upgrade and Chinese Agricultural Transformation. Mod. Econ. Res. 2018, 120–126. [Google Scholar]
- Zhang, Y.; Tian, Q.; Hu, H.; Yu, M. Water Footprint of Food Consumption by Chinese Residents. Int. J. Environ. Res. Public Health 2019, 16, 3979. [Google Scholar] [CrossRef] [Green Version]
- Lv, X.; Li, L.; Liu, M.L.; Wei, S.W.; Wang, S.M.; Fan, D.Q. Comparative Analysis of Food Consumption Transformation Characteristics of Chinese Urban and Rural Residents from 1984 to 2014. J. Shandong Agric. Univ. 2017, 19, 52–58. [Google Scholar]
- Xin, L.; Li, P. Food Consumption Patterns of Chinese Urban and Rural Residents Based on CHNS and Comparison with the Data of National Bureau of Statistics. J. Nat. Resour. 2018, 33, 75–84. [Google Scholar]
- Cao, Y.; Chai, L.; Yan, X.; Liang, Y. Drivers of the Growing Water, Carbon and Ecological Footprints of the Chinese Diet from 1961 to 2017. Int. J. Environ. Res. Public Health 2020, 17, 1803. [Google Scholar] [CrossRef] [Green Version]
- Crippa, A.; Larsson, S.C.; Discacciati, A.; Wolk, A.; Orsini, N. Red and Processed Meat Consumption and Risk of Bladder Cancer: A dose–response Meta-Analysis of Epidemiological Studies. Eur. J. Nutr. 2018, 57, 689–701. [Google Scholar] [CrossRef] [Green Version]
- Farvid, M.S.; Stern, M.C.; Norat, T.; Sasazuki, S.; Vineis, P.; Weijenberg, M.P.; Wolk, A.; Wu, K.; Stewart, B.W.; Cho, E. Consumption of Red and Processed Meat and Breast Cancer Incidence: A Systematic Review and meta-analysis of Prospective Studies. Int. J. Cancer 2018, 143, 2787–2799. [Google Scholar] [CrossRef]
- Squires, J.; Roebothan, B.; Buehler, S.; Sun, Z.; Cotterchio, M.; Younghusband, B.; Dicks, E.; Mclaughlin, J.R.; Parfrey, P.S.; Wang, P.P. Pickled Meat Consumption and Colorectal Cancer (CRC): A Case-Control Study in New found land and Labrador, Canada. Cancer Causes Control 2010, 21, 1513–1521. [Google Scholar] [CrossRef]
- Ren, Y.; Li, H.; Wang, X. Family Income and Nutrition-Related Health: Evidence from Food Consumption in China. Soc. Sci. Med. 2019, 232, 58–76. [Google Scholar] [CrossRef] [PubMed]
- Ponce, X.; Rodriguez-Ramirez, S.; Mundo-Rosas, V.; Shamah, T.; Barquera, S.; Gonzalez de Cossio, T. Dietary quality indices vary with sociodemographic variables and anthropometric status among Mexican adults: A cross-sectional study. Results from the 2006 National Health and Nutrition Survey. Public Health Nutr. 2014, 17, 1717–1728. [Google Scholar] [CrossRef] [Green Version]
- Van der Horst, K.; Brunner, T.A.; Siegrist, M. Fast food and take-away food consumption are associated with different lifestyle characteristics. J. Hum. Nutr. Diet. 2011, 24, 596–602. [Google Scholar] [CrossRef] [PubMed]
- Chang, J.; Wang, Y. Chinese Nutrition and Health Surveillance 2010–2013; Beijing University Health Science Center Press: Beijing, China, 2016. [Google Scholar]
- Chinese Nutrition Society. 2016. Available online: https://www.cnsoc.org (accessed on 6 March 2020).
- Van Mierlo, K.; Rohmer, S.; Gerdessen, J.C. A model for composing meat replacers: Reducing the environmental impact of our food consumption pattern while retaining its nutritional value. J. Clean. Prod. 2017, 165, 930–950. [Google Scholar] [CrossRef]
- Li, Y.; Wang, D.D.; Ley, S.H.; Howard, A.G.; He, Y.; Lu, Y.; Danaei, G.; Hu, F.B. Potential Impact of Time Trend of Life-Style Factors on Cardiovascular Disease Burden in China. J. Am. Coll. Cardiol. 2016, 68, 818–833. [Google Scholar] [CrossRef] [PubMed]
- Chai, L.; Han, Z.; Liang, Y.; Su, Y.; Huang, G. Understanding the Blue Water Footprint of Households in China from a Perspective of Consumption Expenditure. J. Clean. Prod. 2020, 262, 121321. [Google Scholar] [CrossRef]
- Zang, J.; Yu, H.; Zhu, Z.; Lu, Y.; Liu, C.; Yao, C.; Bai, P.; Guo, C.; Jia, X.; Zou, S.; et al. Does the dietary pattern of shanghai residents change across seasons and area of residence: Assessing dietary quality using the Chinese diet balance index (DBI). Nutrients 2017, 9, 251. [Google Scholar] [CrossRef] [Green Version]
- Wang, J.; Yan, S.; Xiao, H.; Zhou, H.; Liu, S.; Zeng, Y.; Liu, B.; Li, R.; Yuan, Z.; Wu, J.; et al. Anti-Obesity Effect of a Traditional Chinese Dietary Habit-Blending Lard with Vegetable Oil while Cooking. Sci. Rep. 2017, 7, 1–10. [Google Scholar]
- Meng, L.; Wang, Y.; Li, T.; Loo-Bouwman, C.A.V.; Zhang, Y.; Man-Yau Szeto, I. Dietary Diversity and Food Variety in Chinese Children Aged 3–17 Years: Are they Negatively Associated with Dietary Micronutrient Inadequacy? Nutrients 2018, 10, 1674. [Google Scholar] [CrossRef] [Green Version]
- United Nations, Department of Economic and Social Affairs, Population Division. World Population Prospects 2019; Online Edition. Rev. 1; United Nations: New York, NY, USA, 2019. [Google Scholar]
- FAO. Actual Chinese Household Consumption Data from 1961 to 2017. Food and Agriculture Organization of United Nations (FAO), 1961–2017, Rome. Available online: http://www.fao.org/faostat/en/#data/FBSH (accessed on 21 March 2020).
- Du, S.F.; Wang, H.J.; Zhang, B.; Zhai, F.Y.; Popkin, B.M. China in the period of transition from scarcity and extensive undernutrition to emerging nutrition-related non-communicable diseases, 1949–1992. Obes. Rev. 2014, 15, 8–15. [Google Scholar] [CrossRef]
- Huang, C.; Lu, Y.; Zang, J.; Wang, Z.; Zhou, J.; Zhu, Z.; Zou, S. The Trend in Dietary Structure and Nutrition Transition among Residents in Shanghai, from 1982 to 2012. J. Environ. Occup. Med. 2016, 33, 845–848. [Google Scholar]
- Wang, Y.; Li, S. Worldwide trends in dairy production and consumption and calcium intake: Is promoting consumption of dairy products a sustainable solution for inadequate calcium intake? Food Nutr. Bull. 2008, 29, 172–185. [Google Scholar] [CrossRef] [PubMed]
- Vandenplas, Y. Lactose intolerance. Asia Pac. J. Clin. Nutr. 2015, 24 (Suppl. 1), S9–S13. [Google Scholar] [PubMed]
- Popkin, B.M. Synthesis and Implications: China’s Nutrition Transition in the Context of Changes Across Other Low- and Middle-Income Countries. Obes. Rev. Off. J. Int. Assoc. Study Obes. 2014, 15, 60–67. [Google Scholar] [CrossRef] [Green Version]
- Popkin, B.M.; Du, S. Dynamics of the nutrition transition toward the animal foods sector in China and its implications: A worried perspective. J. Nutr. 2003, 133, 3898S–3906S. [Google Scholar] [CrossRef] [Green Version]
- Zhai, F.Y. Dynamics of the Chinese diet and the role of urbanicity, 1991–2011. Obes. Rev. 2014, 15, 16–26. [Google Scholar] [CrossRef] [Green Version]
- Popkin, B.M.; Keyou, G.; Zhai, F.; Guo, X.; Ma, H.; Zohoori, N. The nutrition transition in China: A cross-sectional analysis. Eur. J. Clin. Nutr. 1993, 47, 333–346. [Google Scholar]
- Chang, X.; DeFries, R.S.; Liu, L.; Davis, K. Understanding Dietary and Staple Food Transitions in China from Multiple Scales. PLoS ONE 2018, 13, e0195775. [Google Scholar] [CrossRef] [Green Version]
- Popkin, B.M.; Reardon, T. Obesity and the Food System Transformation in Latin America: Obesity and Food System Transformation. Obes. Rev. 2018, 19, 1028–1064. [Google Scholar] [CrossRef]
- Du, S.; Mroz, T.A.; Zhai, F.; Popkin, B.M. Rapid income growth adversely affects diet quality in China-particularly for the poor. Soc. Sci. Med. 2004, 59, 1505–1515. [Google Scholar] [CrossRef] [PubMed]


| Food Groups | Food Items | Score Range | Recommended Level |
|---|---|---|---|
| C1 | cereals | (−12) to 12 | moderate |
| legumes (excl. soybean) | |||
| tubers | |||
| C2 | vegetables | (−6) to 0 | encouraged |
| fruits | (−6) to 0 | encouraged | |
| C3 | red meats and poultry | (−4) to 4 | moderate |
| eggs | (−4) to 4 | moderate | |
| aquatic products | (−4) to 0 | encouraged | |
| C4 | dairy products | (−6) to 0 | encouraged |
| soybean and nuts | (−6) to 0 | encouraged |
© 2020 by the authors. Licensee MDPI, Basel, Switzerland. This article is an open access article distributed under the terms and conditions of the Creative Commons Attribution (CC BY) license (http://creativecommons.org/licenses/by/4.0/).
Share and Cite
Han, A.; Sun, T.; Ming, J.; Chai, L.; Liao, X. Are the Chinese Moving toward a Healthy Diet? Evidence from Macro Data from 1961 to 2017. Int. J. Environ. Res. Public Health 2020, 17, 5294. https://0-doi-org.brum.beds.ac.uk/10.3390/ijerph17155294
Han A, Sun T, Ming J, Chai L, Liao X. Are the Chinese Moving toward a Healthy Diet? Evidence from Macro Data from 1961 to 2017. International Journal of Environmental Research and Public Health. 2020; 17(15):5294. https://0-doi-org.brum.beds.ac.uk/10.3390/ijerph17155294
Chicago/Turabian StyleHan, Aixi, Tianhao Sun, Jing Ming, Li Chai, and Xiawei Liao. 2020. "Are the Chinese Moving toward a Healthy Diet? Evidence from Macro Data from 1961 to 2017" International Journal of Environmental Research and Public Health 17, no. 15: 5294. https://0-doi-org.brum.beds.ac.uk/10.3390/ijerph17155294