Association between Walking Pace and Diabetes: Findings from the Chilean National Health Survey 2016–2017

 , , , , , , and
Abstract
:1. Introduction
2. Materials and Methods
2.1. Study Design
2.2. Walking Pace
2.3. Diabetes Mellitus
2.4. Sociodemographics, Health, and Lifestyle
2.5. Statistical Analyses
3. Results
4. Discussion
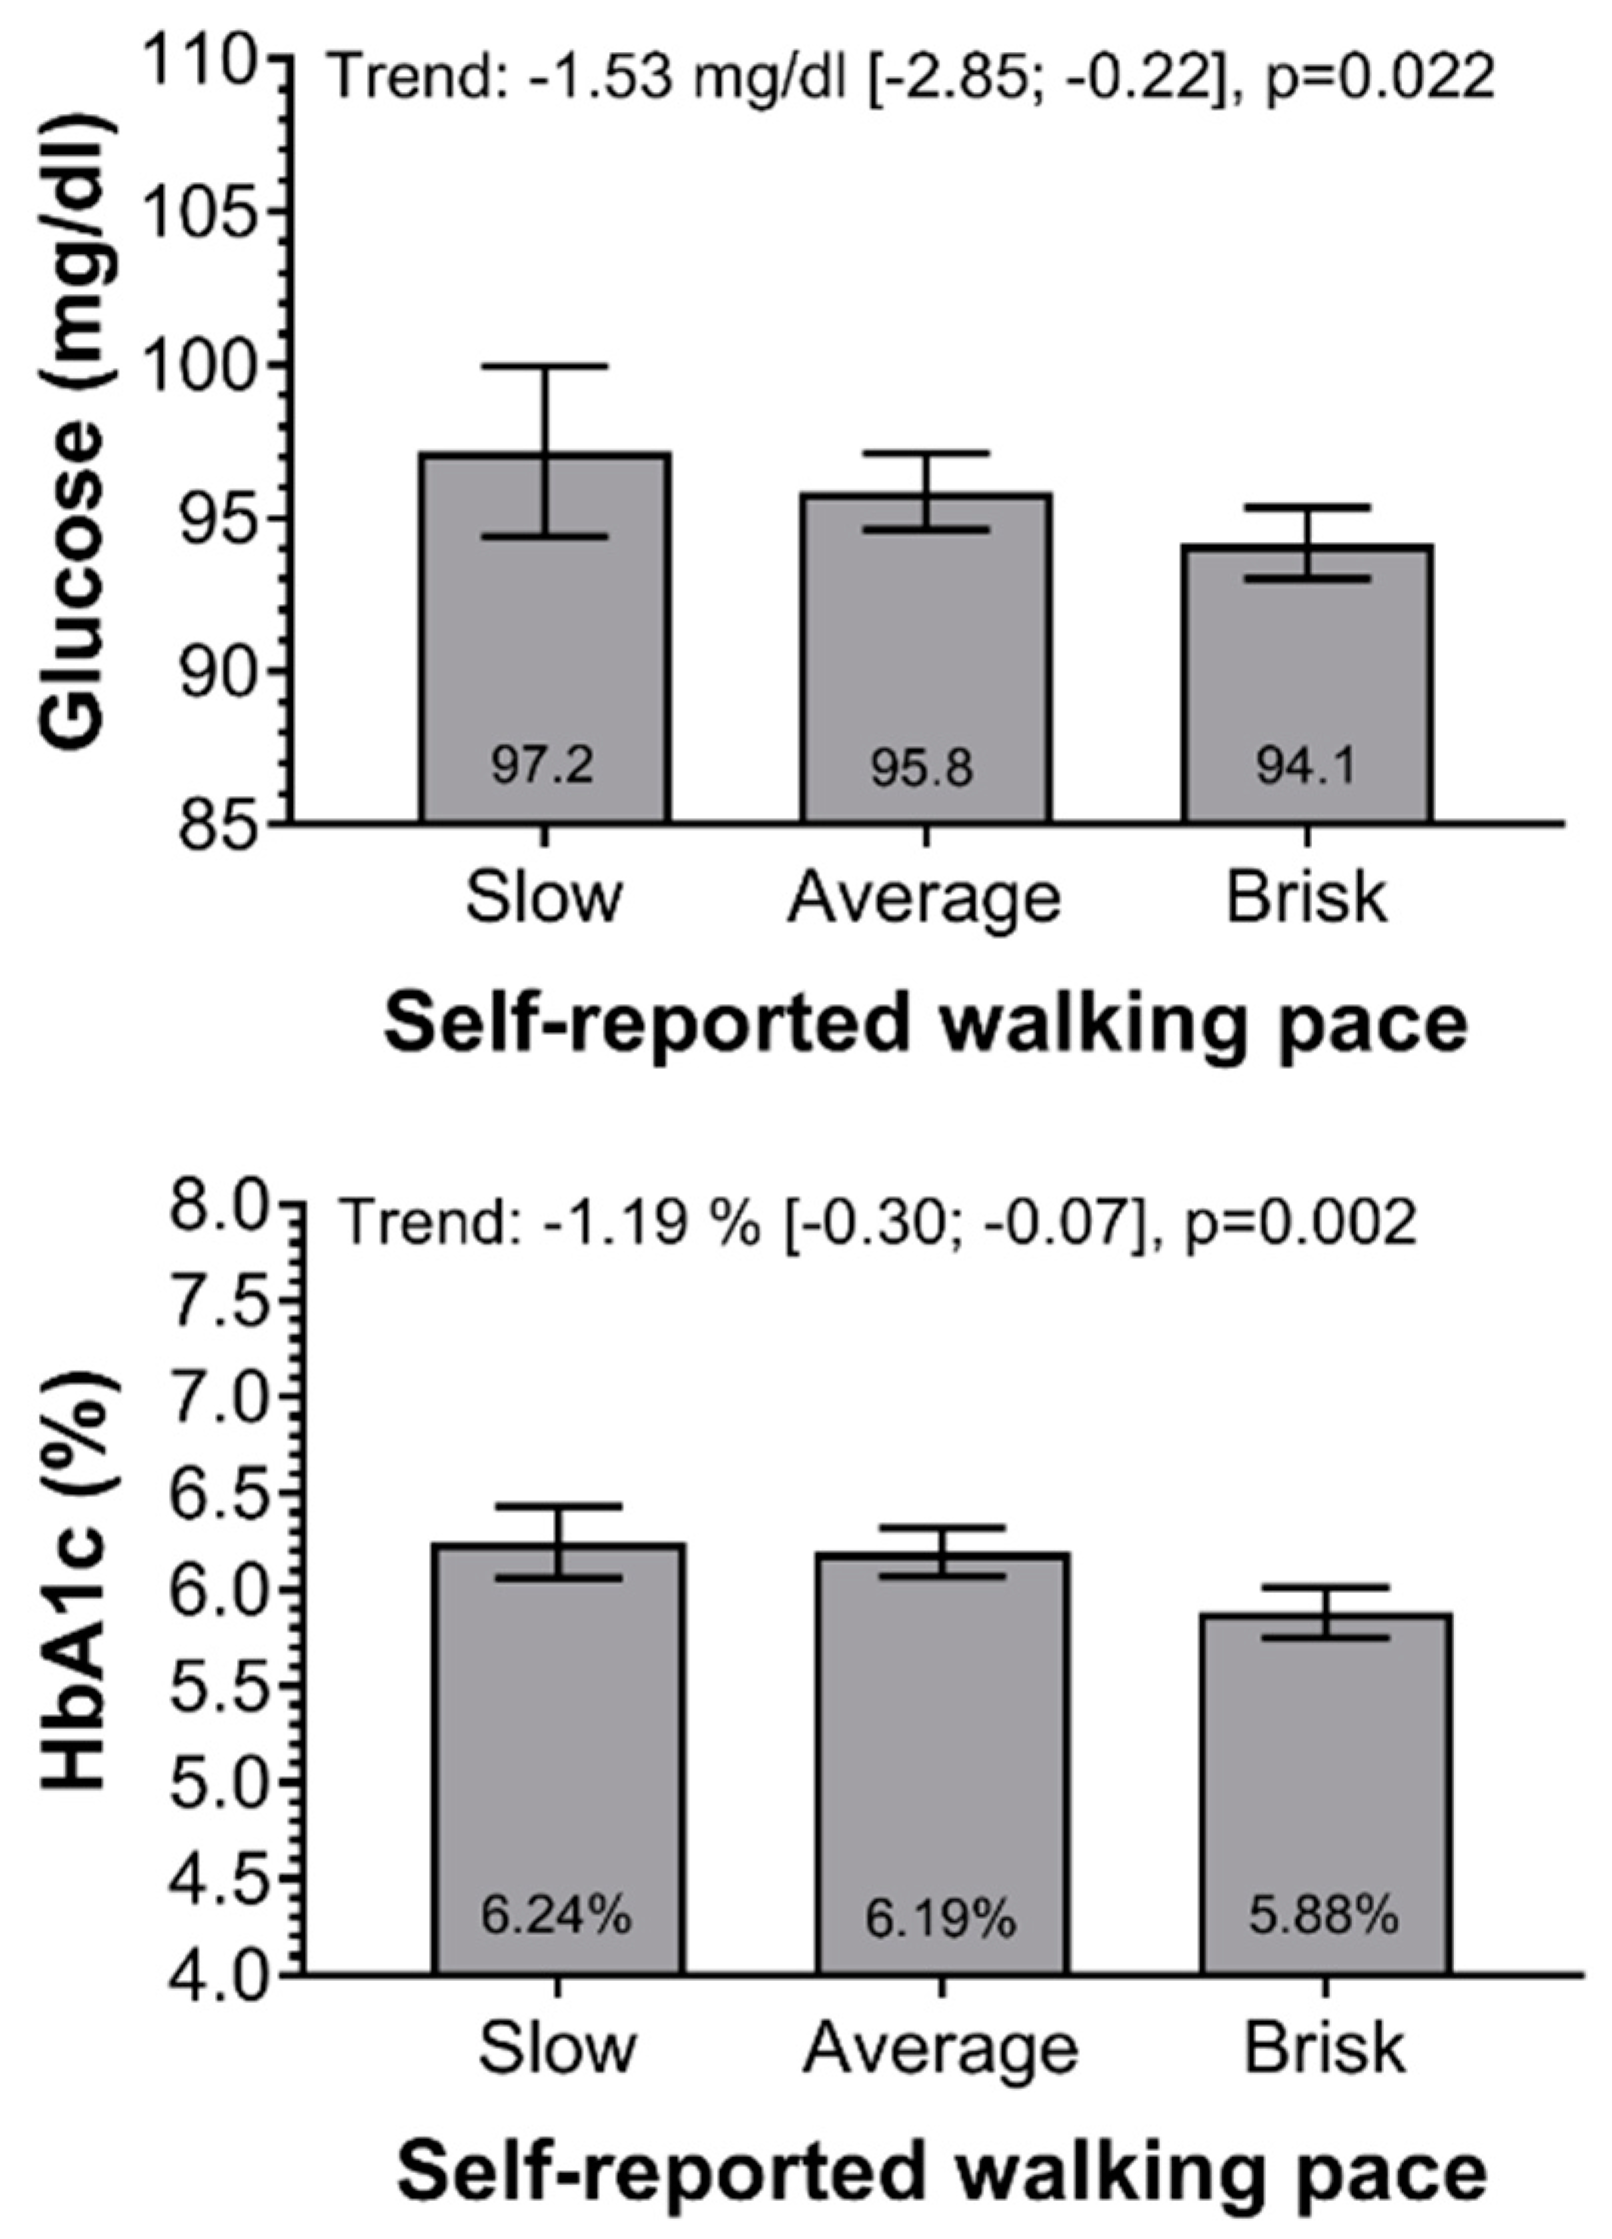
4.1. Walking Pace and Diabetes Biomarkers
4.2. What Was Already Known About This Subject?
4.3. How Does This Study Contribute to Science?
4.4. Strengths and Limitations
5. Conclusions
Author Contributions
Funding
Conflicts of Interest
References
- International Diabetes Federation. Diabetes atlas. In IDF Diabetes Atlas, 7th ed.; IDF: Madrid, Spain, 2015. [Google Scholar]
- Wild, S.; Rogeic, G.; Green, A.; Sicree, R.; King, H. Global prevalence of diabetes. Diabetes Care 2004, 27, 1047–1053. [Google Scholar] [CrossRef] [PubMed] [Green Version]
- Pontificia Universidad Católica, Facultad de Medicina. Encuestas y Estudios Longitudinales. Encuesta Nacional de Salud ENS 2016–2017 Chile; PUC: Santiago, Chile, 2016. [Google Scholar]
- Organización Mundial de la Salud. Informe Mundial de la Diabetes; OMS: Genova, Switzerland, 2019. [Google Scholar]
- Keevil, V.L.; Luben, R.; Hayat, S.; Sayer, A.A.; Wareham, N.J.; Khaw, K.T. Physical capability predicts mortality in late mid-life as well as in old age: Findings from a large British cohort study. Arch. Gerontol. Geriatr. 2018, 74, 77–82. [Google Scholar] [CrossRef] [PubMed]
- Wanigatunga, A.A.; Di, J.; Zipunnikov, V.; Urbanek, J.K.; Simonsick, E.M.; Kuo, P.-L.; Ferruci, L.; Schrack, J.A. Association of total daily physical activity and fragmented physical activity with mortality in older adults. JAMA Netw. Open 2019, 2, e1912352. [Google Scholar] [CrossRef] [PubMed]
- Celis-Morales, C.A.; Gray, S.; Petermann, F.; Iliodromiti, S.; Welsh, P.; Lyall, D.M.; Anderson, J.; Pellicori, P.; Mackay, D.F.; Pell, J.P. Walking pace is associated with lower risk of all-cause and cause-specific mortality. Med. Sci. Sports. Exerc. 2019, 51, 472–480. [Google Scholar] [CrossRef] [PubMed] [Green Version]
- Yates, T.; Zaccardi, F.; Dhalwani, N.; Davies, M.J.; Bakrania, K.; Celis-Morales, C.; Gill, J.M.R.; Franks, P.W.; Khunti, K. Association of walking pace and handgrip strength with all-cause, cardiovascular, and cancer mortality: A UK Biobank observational study. Eur. Heart J. 2017, 38, 3232–3240. [Google Scholar] [CrossRef]
- Argyridou, S.; Zaccardi, F.; Davies, M.J.; Khunti, K.; Yates, T. Walking pace improves all-cause and cardiovascular mortality risk prediction: A UK Biobank prognostic study. Eur. J. Prev. Cardiol. 2019, 7, 2047487319887281. [Google Scholar] [CrossRef]
- Pamoukdjian, F.; Paillaud, E.; Zelek, L.; Laurent, M.; Lévy, V.; Landre, T.; Sabbane, G. Measurement of gait speed in older adults to identify complications associated with frailty: A systematic review. J. Geriatr. Oncol. 2015, 6, 484–496. [Google Scholar] [CrossRef]
- Artaud, F.; Singh-Manoux, A.; Dugravot, A.; Tzourio, C.; Elbaz, A. Decline in fast gait speed as a predictor of disability in older adults. J. Am. Geriatr. Soc. 2015, 63, 1129–1136. [Google Scholar] [CrossRef]
- Abellan van Kan, G.; Rolland, Y.; Andrieu, S.; Bauer, J.; Beauchet, O.; Bonnefoy, M.; Cesari, M.; Donini, L.M.; Gillette Guyonnet, S.; Inzitari, M.; et al. Gait speed at usual pace as a predictor of adverse outcomes in community-dwelling older people an international academy on nutrition and aging (IANA) task force. J. Nutr. Health Aging 2009, 13, 881–889. [Google Scholar] [CrossRef]
- García, F.; Cozar, M.; Munoz, M.; Soto Hermoso, V.; Latorre Roman, P. Gait speed in older people: An easy test for detecting cognitive impairment, functional independence, and health state. Phicogeriatrics 2015, 16, 165–171. [Google Scholar]
- Peel, N.M.; Kuys, S.S.; Klein, K. Gait speed as a measure in geriatric assessment in clinical settings: A systematic review. J. Gerontol. A Biol. Sci. Med. Sci. 2013, 68, 39–46. [Google Scholar] [CrossRef] [PubMed]
- Kim, M.; Won, C. Sarcopenia is associated with cognitive impairment mainly due to slow gait speed: Results from the Korean frailty and aging cohort study (KFACS). Int. J. Environm. Res. Public Health 2019, 16, 1491. [Google Scholar] [CrossRef] [PubMed] [Green Version]
- Rodríguez, G.; Burga-Cisneros, D.; Cipriano, G.; Ortiz, P.; Tello, T.; Casas, P.; Aliaga, E.; Varela, L.F. Factors associated with slow walking speed in older adults of a district in Lima, Peru. Rev. Perú. Med. Exp. Salud Publica 2017, 34, 619–626. [Google Scholar] [CrossRef] [PubMed]
- Cigarroa, I.; Lasserre, N.; Zapata-Lamana, R.; Leiva, A.M.; Troncoco-Pantoja, C.; Martinez, M.A.; Villagrán, M.; Nazar, G.; Diaz, X.; Petermann-Rocha, F.; et al. Una velocidad de marcha lenta se asocia a un mayor riesgo de deterioro cognitivo en adultos mayores. Gerokomos 2020, in press. [Google Scholar]
- Celis-Morales, C.; Salas, C.; Alduhishy, A.; Sanzana, R.; Martínez, M.A.; Leiva, A.; Diaz, X.; Martínez, C.; Álvarez, C.; Leppe, J.; et al. Socio-demographic patterns of physical activity and sedentary behaviour in Chile: Results from the National Health Survey 2009–2010. J. Public Health 2016, 38, e98–e105. [Google Scholar] [CrossRef] [Green Version]
- Concha-Cisternas, Y.; Petermann Rocha, F.; Garrido-Méndez, A.; Díaz-Martínez, X.; Leiva, A.M.; Salas-Bravo, C.; Martínez-Sanguinetti, M.A.; Iturra-González, J.A.; Matus, C.; Vásquez Gómez, J.A.; et al. Patterns of physical activity in Chilean adults across the lifespan. Nutr. Hosp. 2019, 36, 149–158. [Google Scholar]
- Colberg, S.R.; Sigal, R.; Yardley, J.E.; Riddell, M.C.; Dunstan, D.W.; Dempsey, P.C.; Horton, E.S.; Castorino, K.; Tate, D.F. Physical activity/exercise and diabetes: A position statement of the american diabetes association. Diabetes Care 2016, 39, 2065–2079. [Google Scholar] [CrossRef] [Green Version]
- Hoos, T.; Espinoza, N.; Marshall, S.; Arredondo, E.M. Validity of the global physical activity questionnaire (GPAQ) in adult Latinas. J. Phys. Act. Health 2012, 9, 698–705. [Google Scholar] [CrossRef] [Green Version]
- Word Health Organization. Global Physical Activity Questionnaire: GPAQ Version 2.0; WHO: Geneva, Switzerland, 2009. [Google Scholar]
- Word Health Organization. Obesity: Preventing and Managing the Global Epidemic; WHO: Geneva, Switzerland, 2000. [Google Scholar]
- International Diabetes Federation. IDF Diabetes Atlas, 8th ed.; IDF: Madrid, Spain, 2015. [Google Scholar]
- Kalyani, R.; Tra, Y.; Yhe, H.; Egan, J.; Ferruci, L.; Brancati, F. Quadriceps strength, quadriceps power, and gait speed in older U.S. adults with diabetes mellitus: Results from the national health and nutrition examination survey, 1999–2002. J. Am. Geriatr. Soc. 2013, 61, 769–775. [Google Scholar] [CrossRef]
- Volpato, S.; Bianchi, L.; Ferrucci, J. Role of muscle mass and muscle quality in the association between diabetes and gait speed. Diabetes Care 2012, 35, 1672–1679. [Google Scholar] [CrossRef] [Green Version]
- Hwan, S.; Sook, Y.; Hee, Y.; Jung, H.; Rock, S. Comparison of gait speed and peripheral nerve function between chronic kidney disease patients with and without diabetes. Ann. Rehabil. Med. 2017, 41, 72–79. [Google Scholar]
- Stamatakis, E.; Kelly, P.; Strain, T.; Murtagh, E.M.; Ding, D.; Murphy, M.H. Self-rated walking pace and all-cause, cardiovascular disease and cancer mortality: Individual participant pooled analysis of 50 225 walkers from 11 population British cohorts. Br. J. Sports Med. 2018, 52, 761–768. [Google Scholar] [CrossRef] [PubMed] [Green Version]
- Aune, D.; Norat, T.; Leitzmann, M.; Toustad, S.; Vatten, L. Physical activity and the risk of type 2 diabetes: A systematic review and dose–response meta-analysis. Eur. Epidemiol. 2015, 30, 529–542. [Google Scholar] [CrossRef] [PubMed]
- Jeon, C.Y.; Lokken, R.P.; Hu, F.B.; van Dam, R.M. Physical activity of moderate intensity and risk of type 2 diabetes: A systematic review. Diabetes Care 2007, 30, 744–752. [Google Scholar] [CrossRef] [Green Version]
- Williams, P.T. Reduced total and cause-specific mortality from walking and running in diabetes. Med. Sci. Sports Exerc. 2014, 46, 933–939. [Google Scholar] [CrossRef] [Green Version]
- Quan, M.; Xun, P.; Chen, C.; Wen, J.; Wang, Y.; Wang, R.; Chen, P.; He, K. Walking pace and the risk of cognitive decline and dementia in elderly populations: A meta-analysis of prospective cohort studies. J. Gerontol. A Biol. Sci. Med. Sci. 2017, 72, 266–270. [Google Scholar] [CrossRef] [Green Version]
- Imran, T.; Orkaby, A.; Chen, J.; Selvaraj, S.; Driver, J.A.; Gaziano, J.M.; Djouseé, L. Walking pace is inversely associated with risk of death and cardiovascular disease: The Physicians’ Health Study. Atherosclerosis 2019, 289, 51–56. [Google Scholar] [CrossRef]
- Fonseca Alves, D.J.; Bartholomeu-Neto, J.; Júnior, E.R.; Ribeiro Zarricueta, B.S.; Nóbrega, O.T.; Córdova, C. Walking speed, risk factors, and cardiovascular events in older adults-systematic review. J. Strength Cond Res. 2017, 31, 3235–3244. [Google Scholar] [CrossRef]
- Stringhini, S.; Carmeli, C.; Jokela, M.; Avendaño, M.; McCrory, C.; d’Errico, A.; Bochud, M.; Barros, H.; Costa, G.; Chadeau-Hyam, M.; et al. Socioeconomic status, non-communicable disease risk factors, and walking speed in older adults: Multi-cohort population based study. BMJ 2018, 360, k1046. [Google Scholar] [CrossRef] [Green Version]
- Leiva, A.M.; Martínez-Sanguinetti, M.A.; Petermann-Rocha, F.; Garrido-Méndez, A.; Poblete-Valderrama, F.; Díaz-Martínez, X.; Celis-Morales, C. Risk factors associated with type 2 diabetes in Chile. Nutr. Hosp. 2018, 35, 400–407. [Google Scholar]
- Osses, R.; Yáñez, J.; Barría, P.; Palacios, S.; Dreyse, J.; Díaz, O.; Lisboa, C. Reference values for the 6-minutes walking test in healthy subjects 20–80 years old. Rev. Méd. Chile 2010, 138, 1124–1130. [Google Scholar]
- Lisboa, C.; Barría, P.; Yáñez, J.; Aguirre, M.; Díaz, O. Six minutes walk for the assessment of patients with chronic obstructive pulmonary disease. Rev. Méd. Chile 2008, 136, 1056–1064. [Google Scholar]
- Ganna, A.; Ingelsson, E. 5 year mortality predictors in 498,103 UK Biobank participants: A prospective population-based study. Lancet 2015, 386, 533–540. [Google Scholar] [CrossRef]
- Qiu, S.; Cai, X.; Schumann, U.; Velders, M.; Sun, Z.; Steinacker, J.M. Impact of walking on glycemic control and other cardiovascular risk factors in type 2 diabetes: A meta-analysis. PLoS ONE 2014, 9, e109767. [Google Scholar] [CrossRef] [Green Version]
- Tudor-Locke, C.E.; Myers, A.M.; Bell, R.C.; Harris, S.B.; Wilson, R.N. Preliminary outcome evaluation of the First Step Program: A daily physical activity intervention for individuals with type 2 diabetes. Patient Educ. Couns. 2002, 47, 23–28. [Google Scholar] [CrossRef]
- Johnson, S.T.; Tudor-Locke, C.E.; McCargar, L.; Bell, R.C. Measuring habitual walking speed of people with type 2 diabetes. Diabetes Care 2005, 28, 1503–1504. [Google Scholar] [CrossRef] [Green Version]


| Variables | Slow Pace | Average Pace | Brisk Pace |
|---|---|---|---|
| n (%) | 1371 (22.2) | 3429 (55.5) | 1383 (22.4) |
| Sociodemographic | |||
| Age (years) * | 55.7 (53.6; 57.8) | 41.0 (40.0; 42.0) | 39.1 (37.7; 40.5) |
| Sex, % | |||
| Women | 60.8 (55.7; 65.7) | 47.4 (44.2; 50.5) | 51.1 (46.3; 55.9) |
| Men | 39.2 (34.2; 44.2) | 52.6 (49.4; 55.7) | 48.9 (44.1; 53.7) |
| Place of residence, % | |||
| Urban | 84.7 (81.6; 87.3) | 88.7 (87.1; 90.2) | 92.5 (90.5; 94.1) |
| Rural | 15.3 (12.6; 18.3) | 11.3 (9.8; 12.8) | 7.5 (5.8; 9.5) |
| Educational Level, % | |||
| ≤8 years | 36.8 (32.4; 41.4) | 13.0 (11.1; 15.0) | 9.6 (7.3; 12.6) |
| 9–12 years | 48.0 (43.0; 53.1) | 59.0 (55.8; 62.2) | 55.2 (50.3; 59.9) |
| >12 years | 15.2 (11.6; 19.6) | 28.0 (50.3; 59.6) | 35.2 (30.7; 40.1) |
| Lifestyle | |||
| Smoking, % | |||
| Regular smoker | 18.7 (14.9; 23.2) | 26.3 (23.5; 29.4) | 24.1 (20.2; 28.5) |
| Occasional smoker | 6.4 (4.1; 9.7) | 9.3 (7.5; 11.5) | 7.8 (5.6; 10.7) |
| Ex-smoker | 27.3 (23.4; 31.6) | 24.7 (21.9; 27.6) | 26.5 (22.4; 31.0) |
| Non-smoking | 47.6 (42.5; 52.6) | 39.7 (36.7; 42.7) | 41.6 (37.0; 46.3) |
| Alcohol use, % | |||
| High consumption (AUDIT) | 4.3 (1.8; 10.2) | 5.0 (4.0; 7.3) | 6.1 (3.7; 9.8) |
| F&V intake, % | |||
| Eats less than 5 F&V | 87.7 (84.2; 90.5) | 86.2 (83.6; 88.5) | 81.5 (77.4; 85.0) |
| Salt intake (g/day) * | 9.5 (9.2; 9.8) | 9.1 (8.9; 9.2) | 8.9 (8.6; 9.2) |
| Sleep hours, % | |||
| 7–8 h | 45.2 (40.4; 50.3) | 54.2 (50.6; 57.3) | 52.5 (47.8; 57.3) |
| ≥9 h | 25.9 (21.6; 30.6) | 25.6 (23.0; 28.5) | 23.4 (19.7; 27.6) |
| ≤6 h | 28.9 (24.4; 33.8) | 20.2 (17.7; 23.0) | 24.1 (20.2; 28.4) |
| Physical Activity | |||
| Total PA (MET/min/day) * | 771.1 (633.1; 909.1) | 1200.0 (1100.5; 1301.2) | 1412.9 (1232.4; 1591.5) |
| Transport PA (min/day) * | 46.6 (32.8; 60.4) | 72.5 (64.2; 80.7) | 78.5 (65.8; 91.1) |
| Sedentary Time (min/day) * | 214.4 (196.9; 231.8) | 198.8 (187.6; 210.1) | 208.0 (190.3; 225.6) |
| Moderate PA (min/day) * | 192.5 (162.7; 222.2) | 231.0 (211.1; 250.9) | 235.1 (202.9; 267.3) |
| Vigorous PA (min/day) * | 261.9 (211.9; 311.8) | 202.1 (181.2; 223.0) | 220.8 (186.1; 255.5) |
| Physical Inactivity, % | 38.8 (34.1; 43.6) | 23.9 (21.3; 26.7) | 18.9 (15.5; 22.8) |
| Adiposity | |||
| Body weight (kg) * | 76.3 (74.6; 78.1) | 75.7 (74.7; 76.7) | 74.7 (73.3; 76.2) |
| BMI (kg/m2) * | 30.2 (29.6; 30.9) | 28.4 (28.1; 28.7) | 27.7 (27.3; 28.1) |
| Nutritional status, % | |||
| Underweight | 1.1 (0.0; 2.6) | 1.5 (0.1; 2.6) | 0.8 (0.0; 0.2) |
| Normal | 21.8 (17.8; 26.4) | 24.2 (21.6; 27.0) | 27.0 (23.0; 31.4) |
| Overweight | 29.9 (25.6; 34.6) | 41.7 (38.6; 44.9) | 42.4 (37.7; 47.3) |
| Obese | 47.2 (42.1; 52.3) | 32.6 (29.7; 35.6) | 29.8 (25.6; 34.3) |
| Waist circumference (cm) * | 98.3 (96.9; 99.8) | 92.6 (91.7; 93.5) | 91,3 (90.1; 92.4) |
| Central obesity, % | |||
| >102 cm men and >88 cm women | 59.0 (53.9; 63.9) | 41.3 (38.3; 44.4) | 39.2 (34.6; 43.9) |
| Variables | Slow Pace | Average Pace | Brisk Pace | ||
|---|---|---|---|---|---|
| β (95% CI) | p-Value | β (95% CI) | p-Value | ||
| Fasting Glucose (mg/dL) | |||||
| Model 0 | 1.00 (Ref.) | −7.74 (−11.08; −4.40) | <0.0001 | −11.05 (−14.36; −7.75) | <0.0001 |
| Model 1 | 1.00 (Ref.) | −2.55 (−5.67; 0.56) | 0.109 | −4.84 (−7.91; −1.79) | 0.002 |
| Model 2 | 1.00 (Ref.) | −1.70 (−4.86; 1.34) | 0.266 | −3.64 (−6.72; −0.57) | 0.020 |
| Model 3 | 1.00 (Ref.) | −1.31 (−4.43; 1.80) | 0.410 | −3.00 (−5.99; −0.11) | 0.049 |
| HbA1c (%) | |||||
| Model 0 | 1.00 (Ref.) | −0.34 (−0.57; −0.11) | 0.004 | −0.72 (−0.94; −0.49) | <0.0001 |
| Model 1 | 1.00 (Ref.) | −0.08 (−0.30; 0.13) | 0.464 | −0.40 (−0.61; −0.17) | <0.0001 |
| Model 2 | 1.00 (Ref.) | −0.08 (−0.29; −0.14) | 0.493 | −0.39 (−0.62; −0.16) | 0.001 |
| Model 3 | 1.00 (Ref.) | −0.05 (−0.28; 0.18) | 0.665 | −0.37 (−0.60; −0.13) | 0.002 |
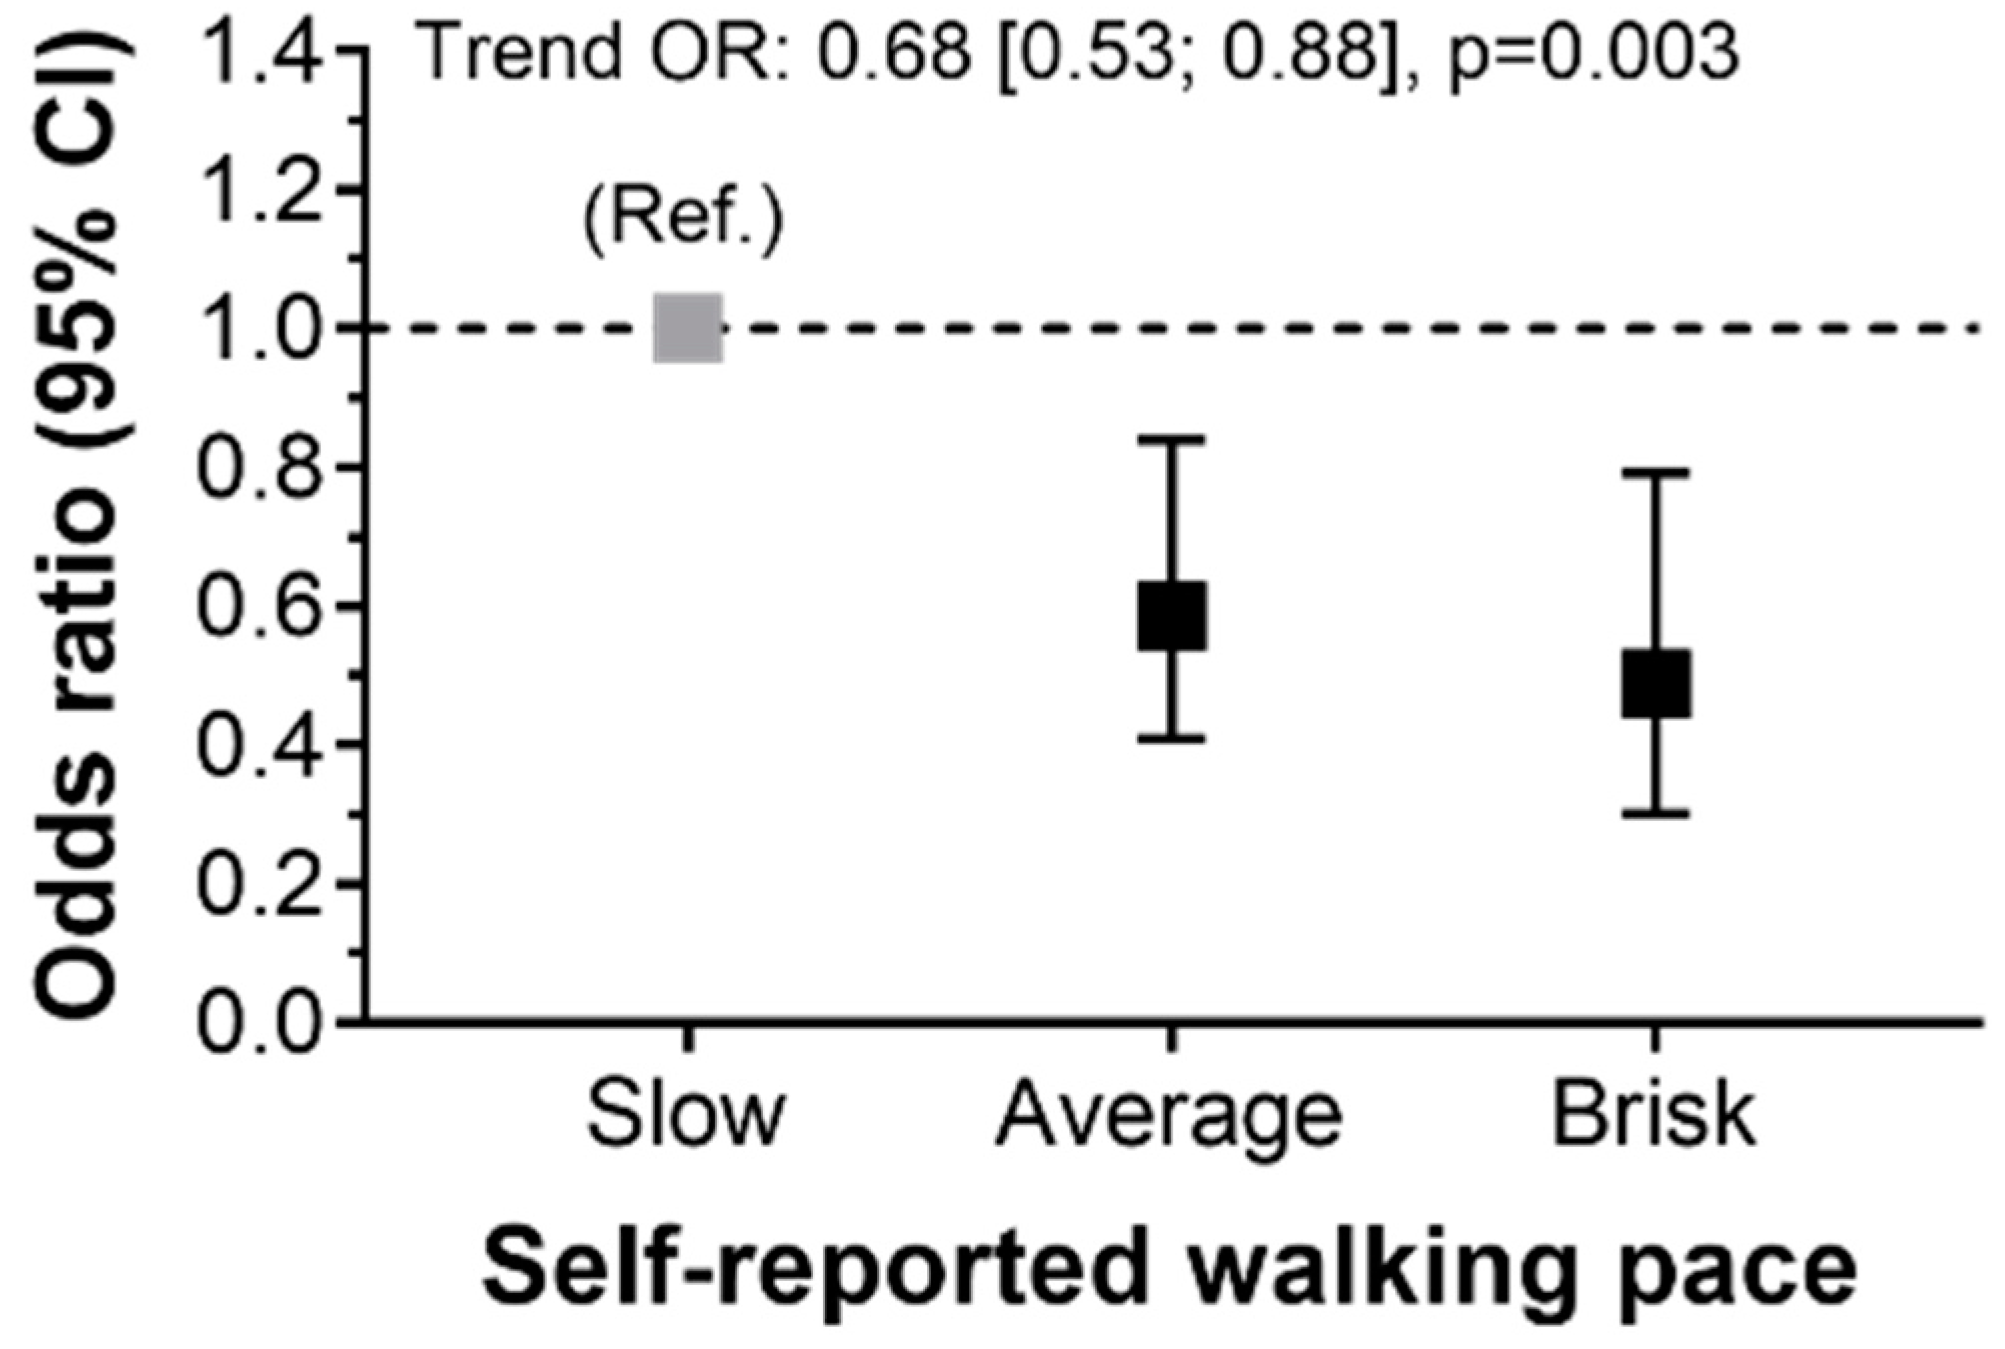
| Variable | Slow Pace | Average Pace | Brisk Pace | ||
|---|---|---|---|---|---|
| OR (95% CI) | p-Value | OR (95% CI) | p-Value | ||
| T2D | |||||
| Model 0 | 1.00 (Ref.) | 0.32 (0.4; 0.43) | <0.0001 | 0.22 (0.15; 0.34) | <0.0001 |
| Model 1 | 1.00 (Ref.) | 0.54 (0.38; 0.77) | 0.001 | 0.42 (0.26; 0.66) | <0.0001 |
| Model 2 | 1.00 (Ref.) | 0.58 (0.41; 0.83) | 0.003 | 0.48 (0.31; 0.77) | 0.002 |
| Model 3 | 1.00 (Ref.) | 0.59 (0.41; 0.84) | 0.004 | 0.48 (0.30; 0.79) | 0.004 |
© 2020 by the authors. Licensee MDPI, Basel, Switzerland. This article is an open access article distributed under the terms and conditions of the Creative Commons Attribution (CC BY) license (http://creativecommons.org/licenses/by/4.0/).
Share and Cite
Cigarroa, I.; Espinoza-Sanhueza, M.J.; Lasserre-Laso, N.; Diaz-Martinez, X.; Garrido-Mendez, A.; Matus-Castillo, C.; Martinez-Sanguinetti, M.A.; Leiva, A.M.; Petermann-Rocha, F.; Parra-Soto, S.; et al. Association between Walking Pace and Diabetes: Findings from the Chilean National Health Survey 2016–2017. Int. J. Environ. Res. Public Health 2020, 17, 5341. https://0-doi-org.brum.beds.ac.uk/10.3390/ijerph17155341
Cigarroa I, Espinoza-Sanhueza MJ, Lasserre-Laso N, Diaz-Martinez X, Garrido-Mendez A, Matus-Castillo C, Martinez-Sanguinetti MA, Leiva AM, Petermann-Rocha F, Parra-Soto S, et al. Association between Walking Pace and Diabetes: Findings from the Chilean National Health Survey 2016–2017. International Journal of Environmental Research and Public Health. 2020; 17(15):5341. https://0-doi-org.brum.beds.ac.uk/10.3390/ijerph17155341
Chicago/Turabian StyleCigarroa, Igor, María José Espinoza-Sanhueza, Nicole Lasserre-Laso, Ximena Diaz-Martinez, Alex Garrido-Mendez, Carlos Matus-Castillo, María Adela Martinez-Sanguinetti, Ana Maria Leiva, Fanny Petermann-Rocha, Solange Parra-Soto, and et al. 2020. "Association between Walking Pace and Diabetes: Findings from the Chilean National Health Survey 2016–2017" International Journal of Environmental Research and Public Health 17, no. 15: 5341. https://0-doi-org.brum.beds.ac.uk/10.3390/ijerph17155341