Article

Transcriptional Profiling and Biological Pathway(s) Analysis of Type 2 Diabetes Mellitus in a Pakistani Population †

1
HealthCare Biotechnology, Atta-Ur-Rahman School of Applied Biosciences, National University of Sciences and Technology (NUST), Islamabad 44000, Pakistan
2
Departments of Oncology and of Biostatistics, Georgetown University, Washington, DC 20057, USA
3
Department of Pediatrics and Child Health, College of Medicine, Howard University, Washington, DC 20059, USA
4
Department of Biology, Howard University, Washington, DC 20059, USA
5
Department of Surgery, Rawalpindi Medical College, Rawalpindi, Punjab 46000, Pakistan
*
Author to whom correspondence should be addressed.
Presented as poster in part at the Research Centers at Minority Institutions (RCMI) Translational Science 2019 Conference, Washington DC.
Int. J. Environ. Res. Public Health 2020, 17(16), 5866; https://0-doi-org.brum.beds.ac.uk/10.3390/ijerph17165866
Submission received: 25 June 2020 / Revised: 3 August 2020 / Accepted: 6 August 2020 / Published: 13 August 2020

Abstract

:
The epidemic of type 2 diabetes mellitus (T2DM) is an important global health concern. Our earlier epidemiological investigation in Pakistan prompted us to conduct a molecular investigation to decipher the differential genetic pathways of this health condition in relation to non-diabetic controls. Our microarray studies of global gene expression were conducted on the Affymetrix platform using Human Genome U133 Plus 2.0 Array along with Ingenuity Pathway Analysis (IPA) to associate the affected genes with their canonical pathways. High-throughput qRT-PCR TaqMan Low Density Array (TLDA) was performed to validate the selected differentially expressed genes of our interest, viz., ARNT, LEPR, MYC, RRAD, CYP2D6, TP53, APOC1, APOC2, CYP1B1, SLC2A13, and SLC33A1 using a small population validation sample (n = 15 cases and their corresponding matched controls). Overall, our small pilot study revealed a discrete gene expression profile in cases compared to controls. The disease pathways included: Insulin Receptor Signaling, Type II Diabetes Mellitus Signaling, Apoptosis Signaling, Aryl Hydrocarbon Receptor Signaling, p53 Signaling, Mitochondrial Dysfunction, Chronic Myeloid Leukemia Signaling, Parkinson’s Signaling, Molecular Mechanism of Cancer, and Cell Cycle G1/S Checkpoint Regulation, GABA Receptor Signaling, Neuroinflammation Signaling Pathway, Dopamine Receptor Signaling, Sirtuin Signaling Pathway, Oxidative Phosphorylation, LXR/RXR Activation, and Mitochondrial Dysfunction, strongly consistent with the evidence from epidemiological studies. These gene fingerprints could lead to the development of biomarkers for the identification of subgroups at high risk for future disease well ahead of time, before the actual disease becomes visible.

1. Introduction

Type 2 Diabetes Mellitus (T2DM), the predominant form of diabetes, is a chronic, multifactorial, metabolic disorder characterized by hyperglycemia and has become a public health challenge worldwide [1,2,3]. T2DM accounts for 90% to 95% of all diabetes cases with the heritability ranging between 40% and 70% [4,5]. Beta cell dysfunction, impaired insulin secretion, and increased insulin resistance cause the chronic dysregulation of the hyperglycemia state and are critical in pathophysiological determinants of the disease’s progression and pathogenesis [6,7]. T2DM can lead to life-threatening complications, viz., neuropathy, cerebrovascular disease, nephropathy, peripheral vascular disease, coronary artery disease, and retinopathy [8,9].
T2DM has emerged as a global pandemic affecting 451 million people worldwide [10]. Globally, the number of affected people has quadrupled in the past three decades, and diabetes mellitus is the ninth major cause of death. Asia is a major area of the rapidly emerging T2DM global epidemic, with China and India the top two epicenters [11]. Pakistan is close behind [12]. The occurrence of T2DM varies extensively from one geographical area to another and within nations as well, as is typical for a multifactorial disorder. Complex interactions between genetic factors and environmental risk factors contribute to T2DM’s pathogenesis [13,14,15]. The environmental risk factors like sedentary lifestyle, physical inactivity [16], high caloric intake, obesity, high consumption of red meat [17], alcohol consumption, and smoking have been recognized as significant contributors [18].
According to a Centre for Disease Control and Prevention (CDC) report, 34.2 (10.5%) million people in the USA have diabetes in 2020, with 8 million adults aged 18 years or older having prediabetes (34.5% of the adult US population) [19]: (https://www.cdc.gov/diabetes/data/statistics/statistics-report.html). The worldwide diabetes prevalence for 2019 is estimated to be 9.3% with 463 million people and is expected to rise 10.2% by 2030 with 578 million people and 10.9% by 2045 including 700 million people. It has been observed that the worldwide prevalence of diabetes is higher in urban areas (10.8%) as compared to rural areas (7.2%) and in high-income countries (10.4%) as compared to low income countries (4.0%) [20]. The prevalence of T2DM in all Asian countries is rising and is expected to rise further in future, imposing huge economic burdens on their healthcare systems [21,22]. In South Asia, India is deemed as the world’s capital of diabetes. The diabetic population in the country is close to hitting the alarming mark of 69.9 million by 2025 and 80 million by 2030, an increase of 266% [23]. The World Health Organization (WHO) has projected that T2DM is expected to be the seventh primary cause of death by 2030, when low- and middle-income countries will account for more than 80% of all deaths related to diabetes [24].
Research has revealed that in the last two decades many developing countries have been embracing aspects of the Western lifestyle including over consumption of high caloric food and lack of physical activity. About 90% of T2DM subjects are exclusively attributed to excess weight [25]. The prevalence of T2DM and prediabetes is much higher than previously thought in Pakistan [26]. The T2DM prevalence is increasing dramatically in Pakistan as compared to other countries due to growing urbanization and adopting western lifestyle, making it the sixth highest country for T2DM prevalence in the world [27,28]. According to the International Diabetes Foundation (IDF), it is estimated that almost 11.5 million people in Pakistan will have diabetes by the year 2025, which will place Pakistan fifth by the IDF ranking [29,30]. The current prevalence of T2DM in Pakistan is 11.77% overall, slightly higher in males (11.20%) than females (9.19%), and there is additional variation across regions of the country, from <9% to 16% [31].
Many people are exposed to polluted environments and increasing evidence has shown epidemiological associations between exposures to persistent organic pollutants (POPs) and the risk of T2DM [32]. A study of selected POPs in the NHANES 1999–2002 data set has reported an association between waist circumferences and Body Mass Index (BMI) in subjects with detectable levels of POPs, perhaps suggesting that these chemicals are plausible contributors to the obesity epidemic [33]. Supporting that hypothesis, a prospective analysis in the Nurses’ Health Study based on two prospective studies and Meta-analysis indicates that higher plasma Hexachlorobenzene (HCB) and total Polychlorinated Biphenyls (PCB) concentrations at baseline were significantly associated with increased incidence of diabetes development [34]. In the Nurses’ Health Study II—a nested case-controlled study involving middle-aged US women—conducted on plasma-POPs (including 3 organochlorine pesticides [OCPs] and 20 polychlorinated biphenyls [PCBs]) indicated a higher risk of T2DM during more than 11 years of follow up. Age, breastfeeding history, previous weight change, and concurrent body weight were among the primary determinants of circulating POP concentrations [35].
Our team recently published the results of a descriptive study of Pakistani patients with T2DM, which confirmed gender differences and suggested possible associations with environmental factors [1]. The present study extends those observations to investigate a pilot study of global gene expression patterns in the same patients, using microarrays coupled with Ingenuity Pathway Analysis (IPA) and followed by selective gene validation. The results have informed our insights into the underlying gene expressions changes that may pose an early sign of developing comorbidities in later life.

2. Methods

2.1. Study Participants, Ethics, and Selection of Participants for Gene-Expression Assays

We randomly selected our study subjects from our previously reported cohort recruited from the out-patient departments of four different regional hospitals of Pakistan, i.e., Islamabad, Rawalpindi, Lahore, and Abbottabad (see details in [1]). The study was undertaken with the prior approval by the Howard University Institutional Review Board (IRB-17-MED-43), and the informed consent was obtained from volunteers as per the approval of the Institutional Review Board (IRB) of Atta-ur-Rahman School of Applied Biosciences (ASAB), National University of Sciences and Technology (NUST) (28/IRB; dated. 20 April 2016).
We have retrieved the detailed background information of our participants from our earlier cohort report [1], where besides age and gender, their HbA1C, plasma glucose (mg/dl), BMI, locality, literacy, history of T2DM, medication use, and smoking history were also captured (see additional information in supplemental Table S2). This review of the records established that the study subjects in the present report were free of obesity (high BMI) and had abstained from use of alcohol (due to cultural practice) The subjects were 2 adults from the T2DM group and 2 from the control group (one male and female from each group): they were gender- and weight- matched, with average age of 68 ± 14.1 years. HbA1C (13.35 ± 0.15%), fasting plasma glucose level (315 ± 35 mg/dl), and BMI (29 ± 0.5) in our T2DM subjects were compared to controls (HbA1: 4.9 ± 0.1 %), fasting plasma glucose level: 113 ± 15 mg/dl, and BMI: 21.5 ± 1.3), and the differences were in the expected directions. Smokers were excluded from selection. Other than T2DM, the selected subjects were free of other chronic diseases and had not undergone any major surgical procedures that required general anesthesia during the last 5 years.

2.2. Blood Collection and RNA Preparation

Whole blood was collected in PAXgene® Blood RNA Tubes (BD, Cat. # 762165) in Pakistan from the outpatient department of the hospitals by experienced phlebotomist and were dispatched later through a specialized courier service under frozen conditions (dry ice) to the Department of Biology at Howard University, Washington DC, USA, according to the specific protocol of the manufacturer (Qiagen MD). RNA was extracted from the PAXgene tubes using the PAXgene Blood RNA Kit IVD (Qiagen, Cat. # 762164 of PreAnalytiX GmbH, Germany), according to the manufacturer’s instructions. Contaminating DNA was removed with the Invitrogen DNA-free kit (ThermoFisher, CA, Cat # AM 1906). RNA content was determined spectrophotometrically on a nanodrop at 230, 260 and 280 λ. RNA quality was also verified by Agilent bioanalyzer analysis using an RNA 6000 nanochip before microarray chip hybridization, with RNA stored at −80 °C.

2.3. cDNA Synthesis and Microarrays

Total RNA was reverse-transcribed to cDNA by using High-Capacity cDNA Reverse Transcription Kits (Part # 4387406; Applied Biosystems, CA, USA) according to manufacturer’s instruction. The reaction mixture (20 μL total volumes) was incubated at 25 °C for 10 min and then at 37 °C for 60 min followed by 95 °C for 5 min. Finally, the mixture was heated at 95 °C for 5 min. The cDNAs were stored in −15 to −25 °C, if not used immediately (within 24 h), or stored in 2 to 8 °C (See [36,37,38] for detailed methods).
The oligonucleotide microarray experiments were conducted by EpigenDx (Boston, MA, USA) using the Affymetrix U133 Plus 2.0 Array platform, which has a comprehensive coverage of the whole transcribed human genome on a single array. Chips were run in triplicate form on each individual subject. Expression profiling data were obtained for each sample individually with standard operating procedures and following the protocols of [39] for quality control (also see detailed procedure in [37,40]).

2.4. Gene Expression Data Analysis

Differentially expressed gene sets were analyzed with microarray results using a one-way ANOVA model by Partek Genomics Suite (Partek GS). Briefly, the raw microarray values from the Affymetrix.cel files were imported into Partek Genomics Suite, (Partek Inc., St. Louis, MI, USA). The probe summarization and probe set normalization were done using the GC-RMA algorithm [41], which included GC-RMA background correction, quantile normalization, log2 transformation and median polish probe set summarization. The results yielded the expected proportion of truly null hypotheses among all the rejected null hypotheses [42] and kept the false positive rate below five percent. We selected gene sets that had the statistical significance level < 0.05. This analysis generated two highly significant sets of differentially expressed genes that originated from comparing the T2DM dataset with Control subjects (see details in [38,43]).

2.5. Identification of Cellular Processes and Pathways Involved by Ingenuity Pathways Analysis (IPA®)

Data sets containing gene identifiers and corresponding expression values (fold change) from the microarray experiment were uploaded into Ingenuity Pathway Analysis software (Ingenuity® Systems, www.ingenuity.com). Each gene identifier was plotted to its similar gene entity in the Ingenuity Pathways Knowledge Base. To advance our pathway analysis, we incorporated an additional 527 gene transcripts from the IPA knowledge base to our results. We used the data sources from Ingenuity expert findings and used the “Core Analysis” function to interpret the data in the perspective of biological processes, pathways, and networks. Differentially expressed gene identifiers were defined as value parameters for analysis and identified the relationship between gene expression alterations and related changes in biofunctions under the subcategories of Molecular and Cellular Functions, Physiological System Development and Function, and Disease and Disorders. Genes differentially expressed with p < 0.05 were overlaid onto global molecular networks developed from information contained in the IPA knowledge base. Networks were then algorithmically generated based on their connectivity. Networks were “named” on the most prevalent functional group(s) present. Canonical Pathway (CP) analysis identified function specific genes significantly present within the networks.

2.6. Validation by High-Throughput TaqMan® Low Density Array (TLDA)

To validate the altered gene expressions that emerged from the microarray experiment, we used predesigned TLDA cards (in a 16 Format, Applied Biosystems®, CA, USA) to examine the expression of genes of interest, viz., 18s (Hs99999901_s1; manufacturing control), GAPDH (Hs99999905_m1; Internal control), ACTBL2, APC, ARNT, ATP1B1, BCL2, CCK, CD3G, CYP2D6, ENTPD3, LEPR, LRP12, MYC, RRAD, APOC1, APOC2, CYP1B1, SLC2A13, SLC33A1, TP53, MYC, as identified in the methods described above. We randomly selected an additional 15 cases (see supplemental Table S2) and their corresponding controls, gender-, age-, and weight-matched, from the original cohort for TLDA analysis. The details of the experimental procedures are reported in [37,40].

2.7. TLDA Data Analysis

The TLDA data were analyzed by SDS Ver. 2.4 software (ABI, CA). Threshold cycle (Ct) data for all target genes and the internal control gene 18s RNA were used to calculate ΔCt values [ΔCt = Ct (target gene) − Ct (18s RNA)]. Then, ΔΔCt values were calculated by subtracting the calibrator (control) from the ΔCt values of each target. To visualize and further expression analysis, the data were exported in plate centric format to RQ Manager (ABI, V 2.4), which allowed us to inspect the status of each gene in the study population.

3. Results

3.1. Differential Expression of Genes of T2DM Subjects

Through our microarray gene expression studies, a total number of 31,136 genes were observed to have differential expression in the subjects analyzed (among a total of 53,618 total transcripts on the gene chip). Of these, a total of 1657 genes were significantly different between cases and controls (p value < 0.05), among which 61% (1017 genes) were downregulated, and 39% (640 genes) were upregulated with a fold change ranging between −189 (downregulation) to +14 (upregulation) (supplemental Table S1). These significantly expressed genes were used for downstream IPA analysis, as shown below.

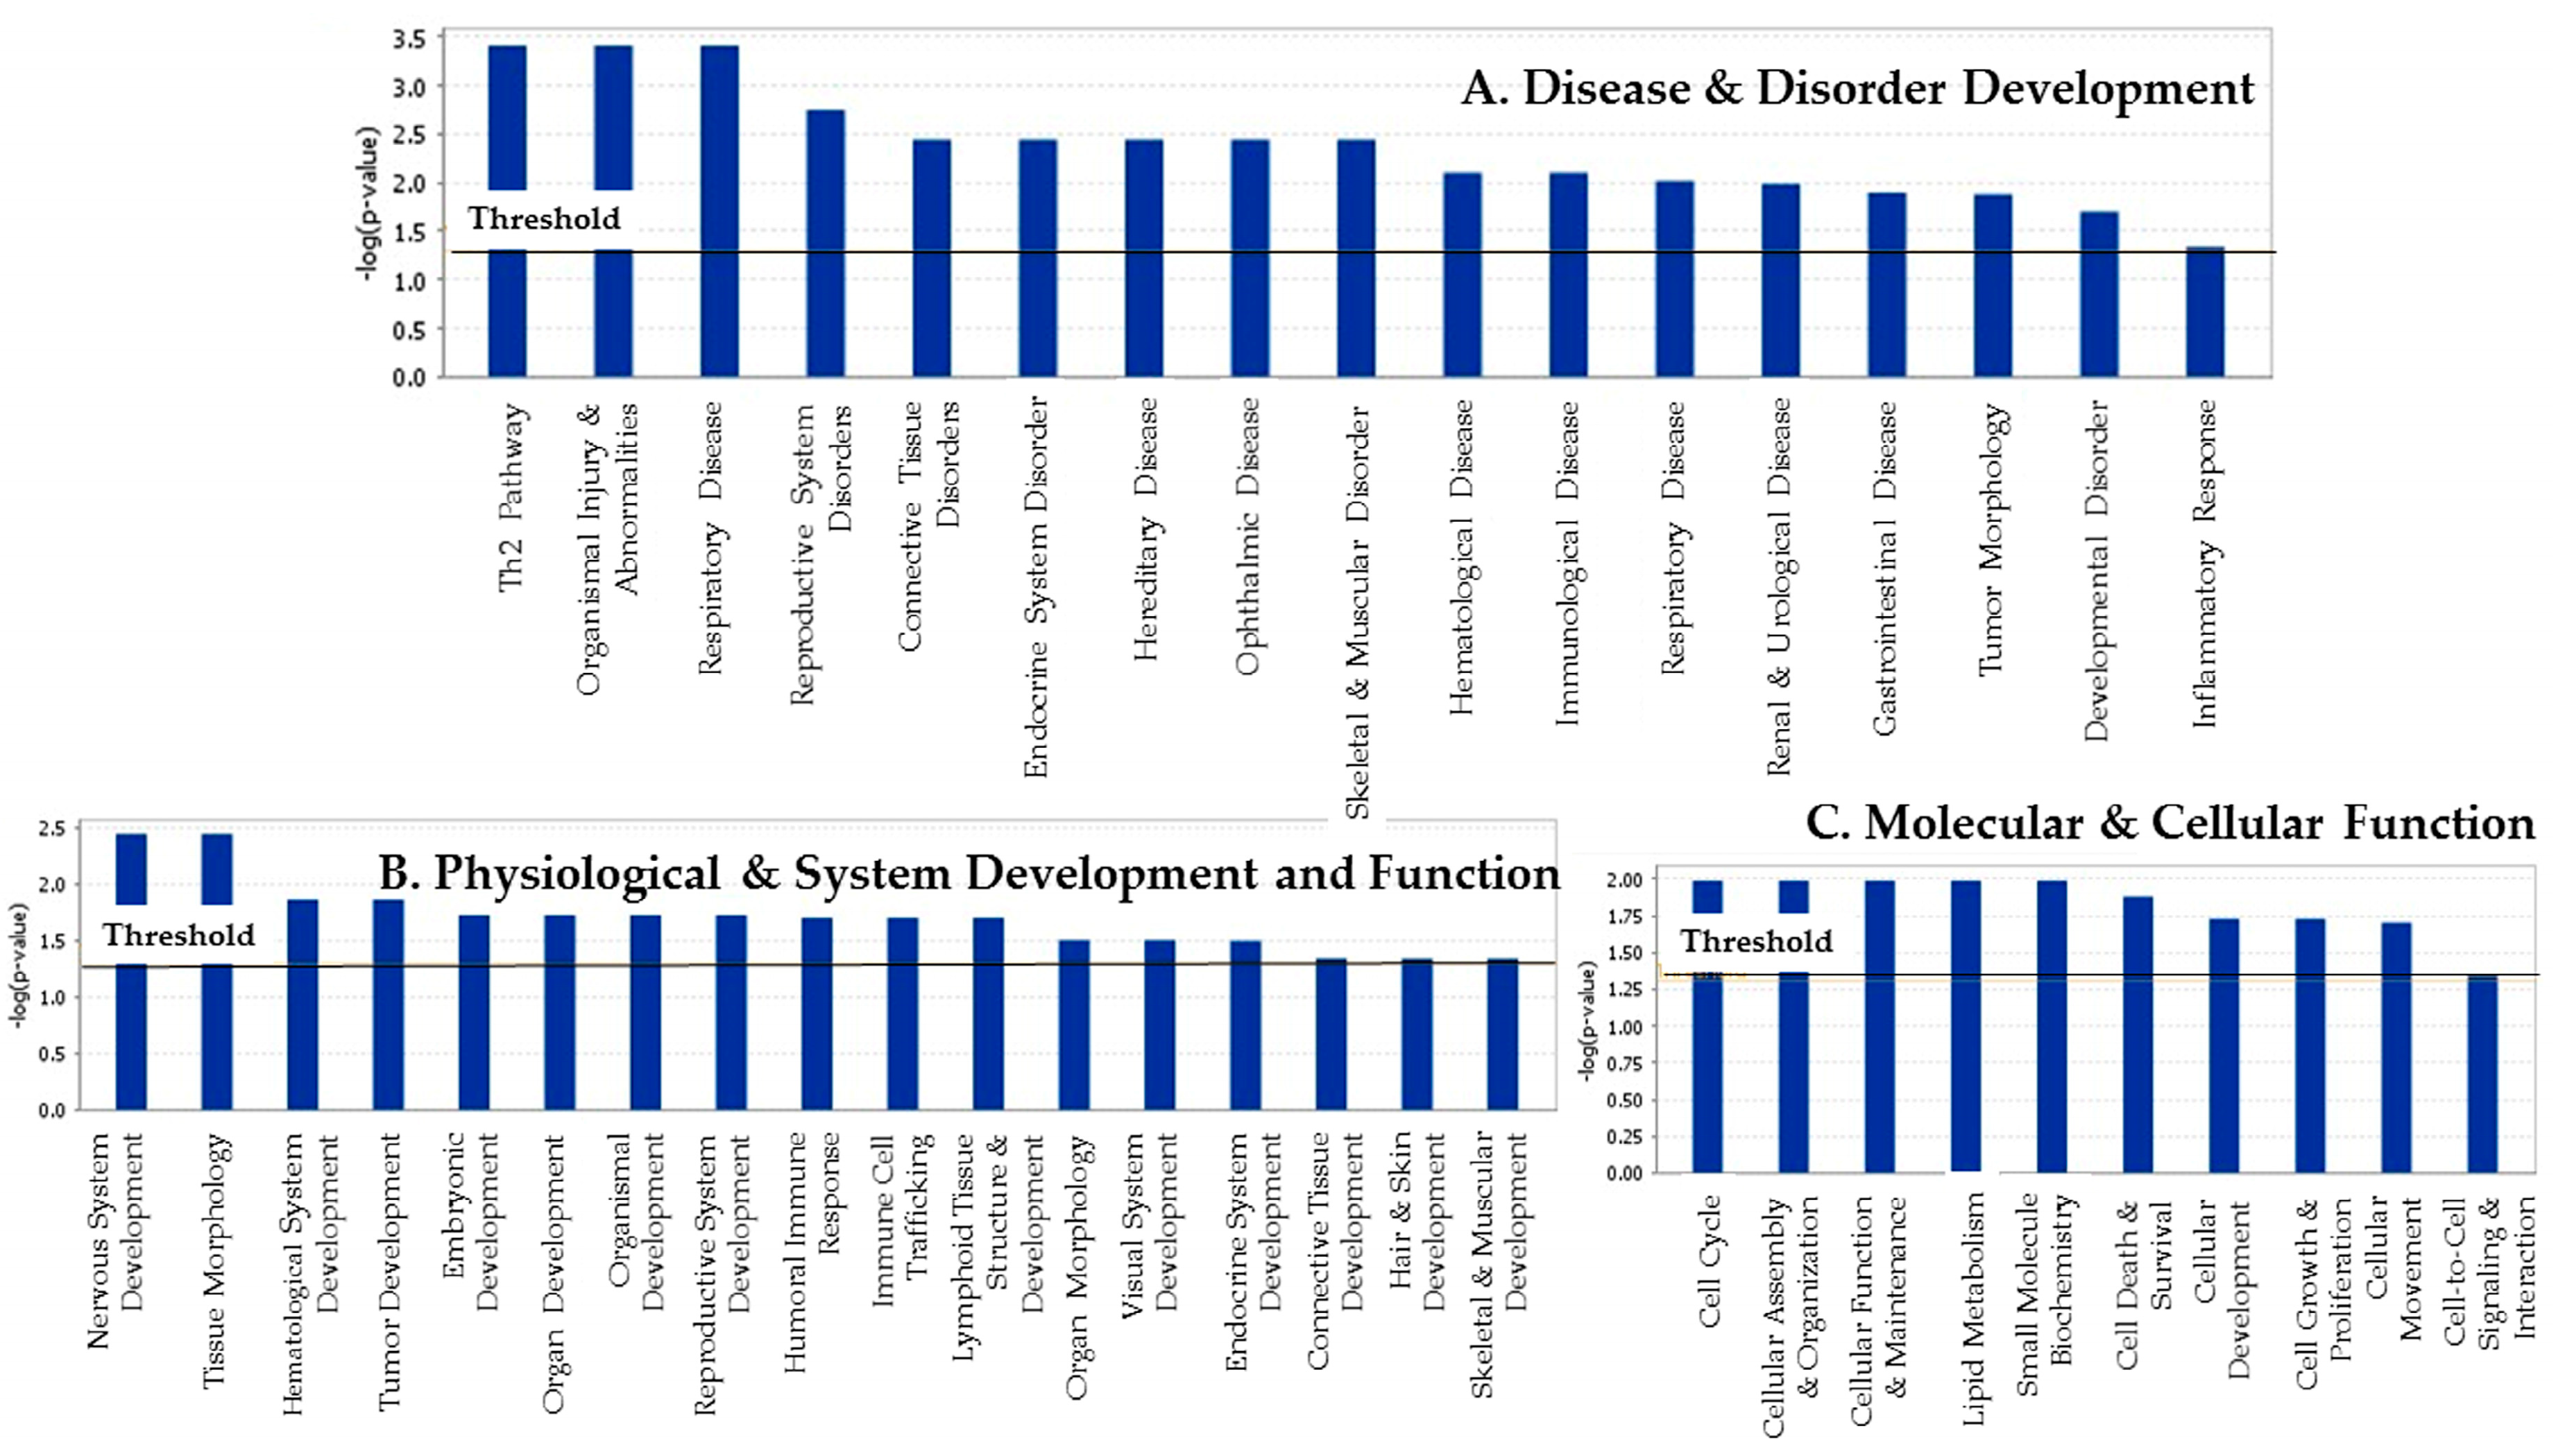
3.2. The Attribution of Differentially Expressed Genes to Their Biofunctions and Associated Diseases and Disorders

The list of potential biological effects due to differential gene expression in our pilot study can be described in three different levels: canonical pathways and biofunctions (Table 1), and networks (Table 2). Analysis of the genes identified above revealed 5 significant genetic networks (score ≥ 8.0), as listed in Table 2. The top-scoring networks reflect associations with diseases and disorders that primarily include: Endocrine System Disorders, Genetic Disorders, Respiratory Disease, Cancer, Dermatological Disease and Conditions, Developmental Disorders, Hematological Disease, Immunological Disease, Connective Tissue Disorder, Hereditary Disorder, and Skeletal and Muscular Disorders (Figure 1; panel A). In the Physiological System Development and Functions network, notable functions were Nervous System Development and Function, Tissue Morphology, Tissue Development, Hematological System Development and Function, Immune Cell T Trafficking, Endocrine System Development and Function, Connective Tissue Development and Function, and Visual System Development and Function (Figure 1, panel B). Among the genes in the Molecular and Cellular Functions network, Lipid Metabolism, Cell Cycle, Cellular Assembly and Organization, Cellular Functions and Maintenance, Small Molecule Biochemistry, Cell Death and Survival, Cellular Development, Cellular Growth and Proliferation, and Cell-To-Cell Signaling and Interaction functions were revealed (Figure 1; panel C).

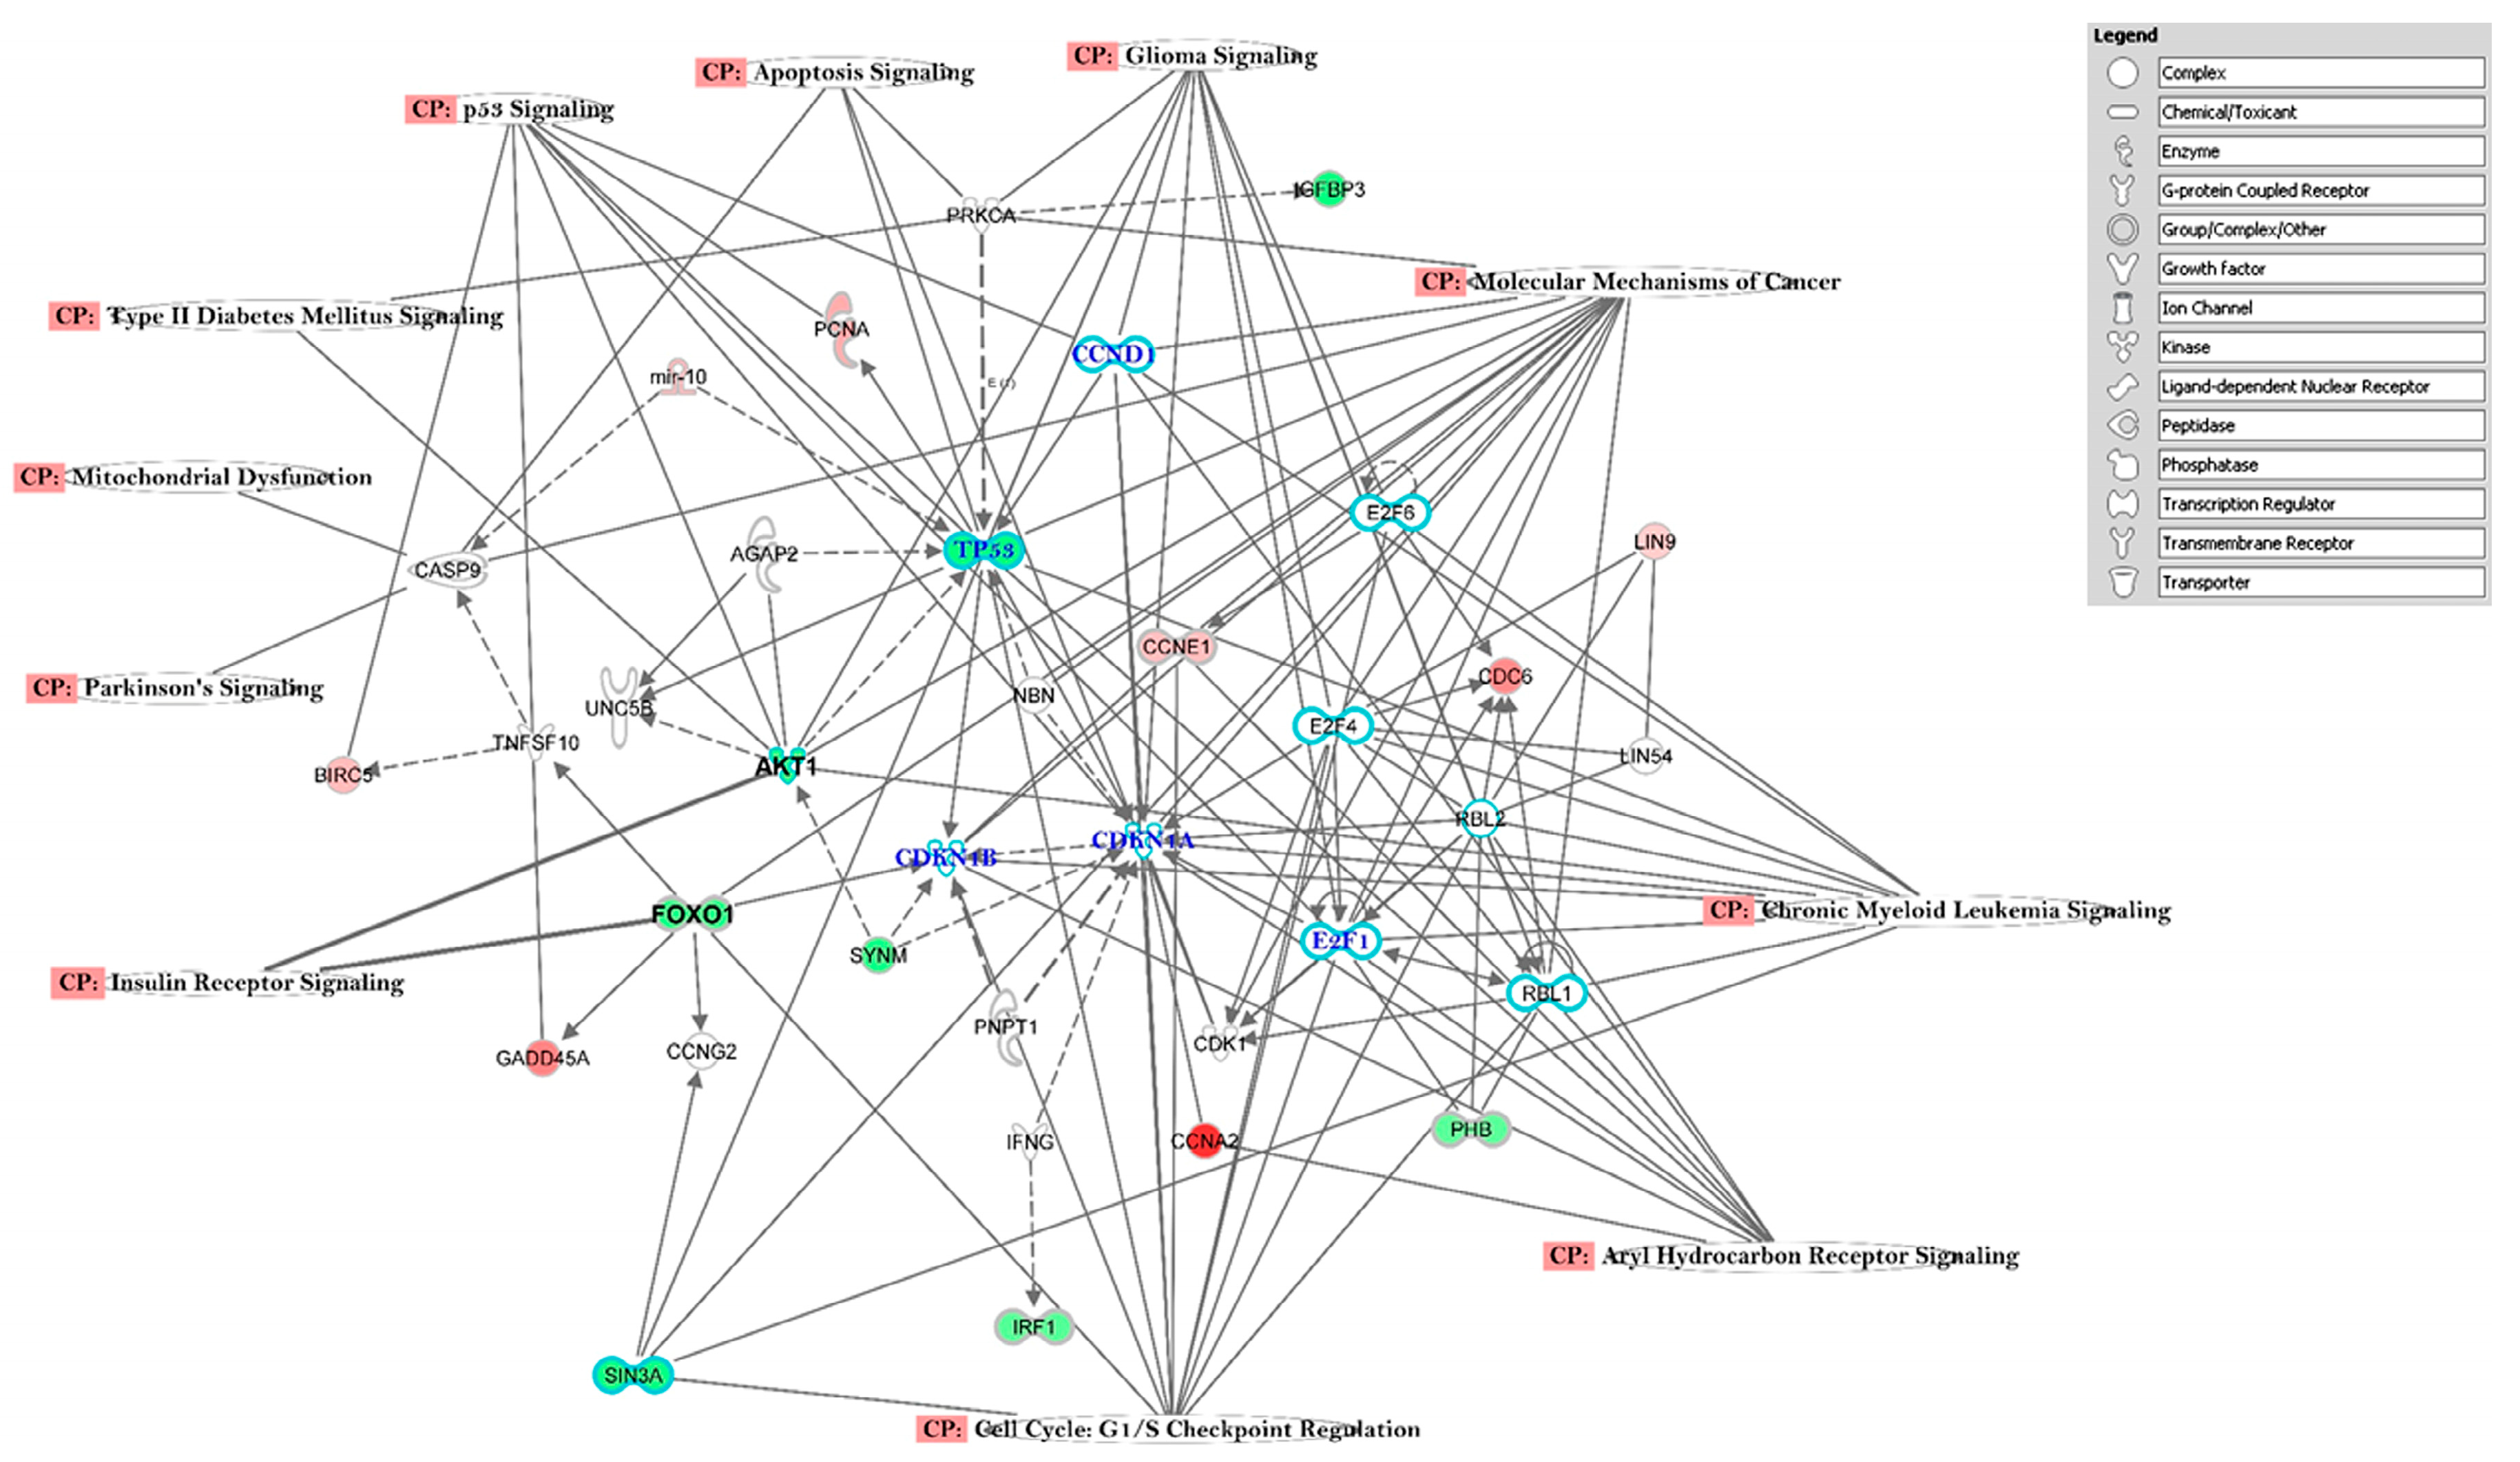
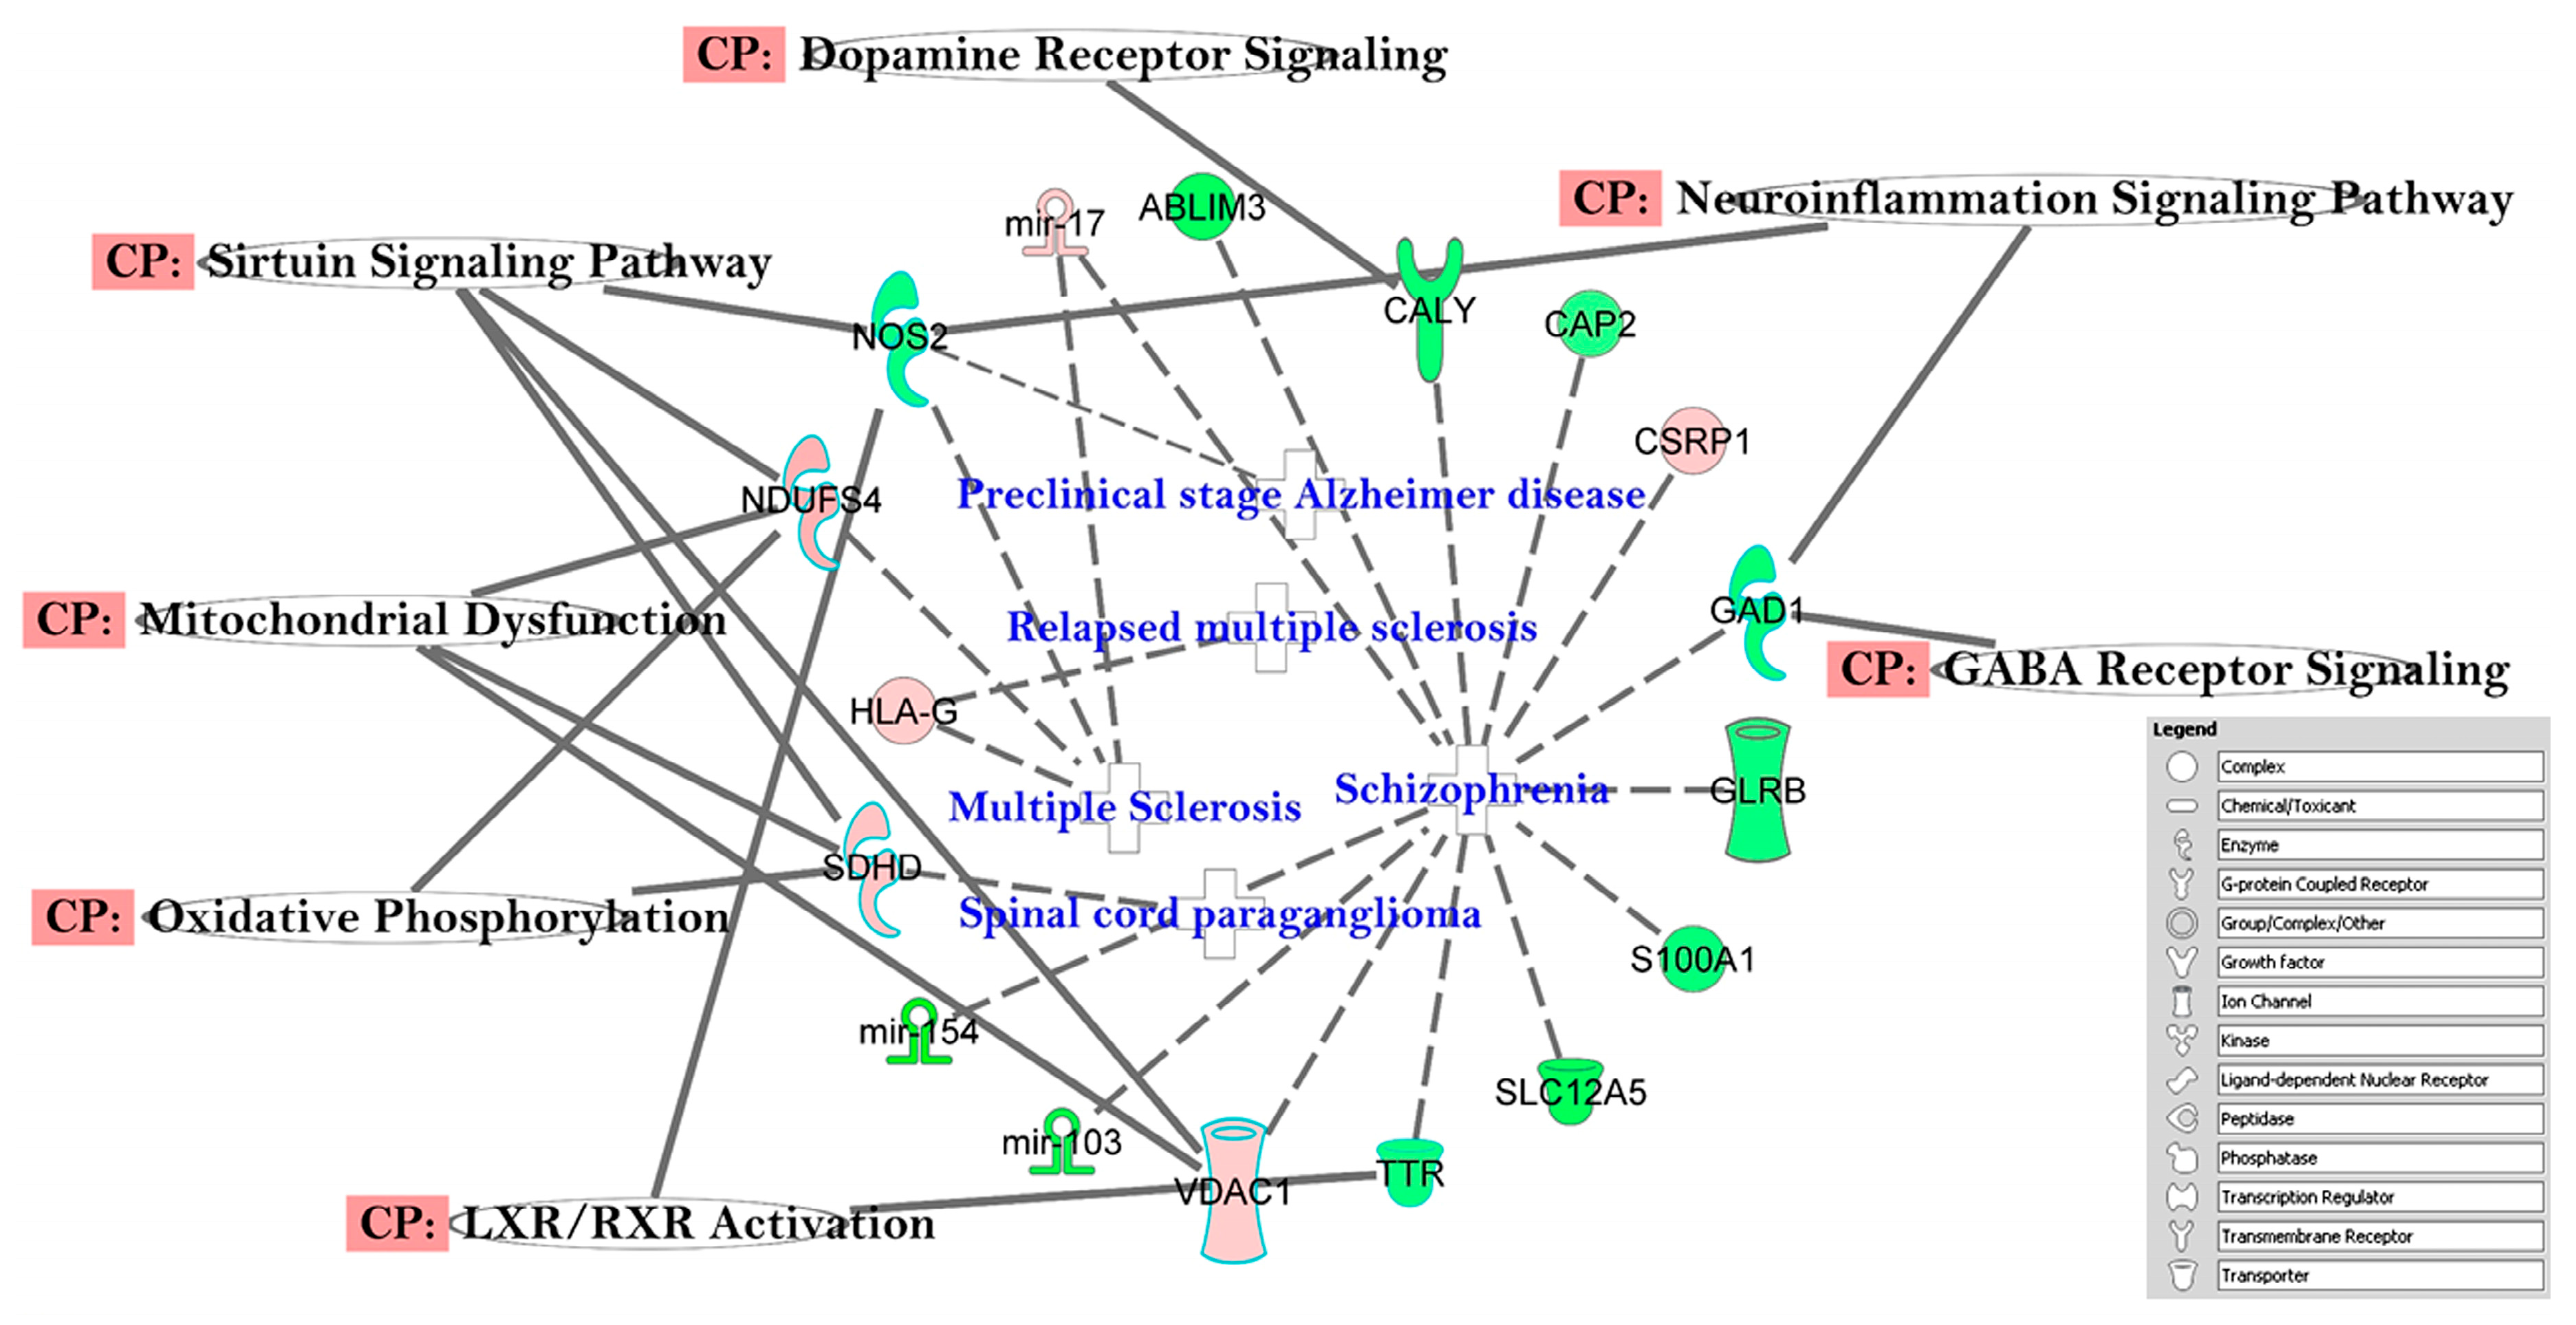
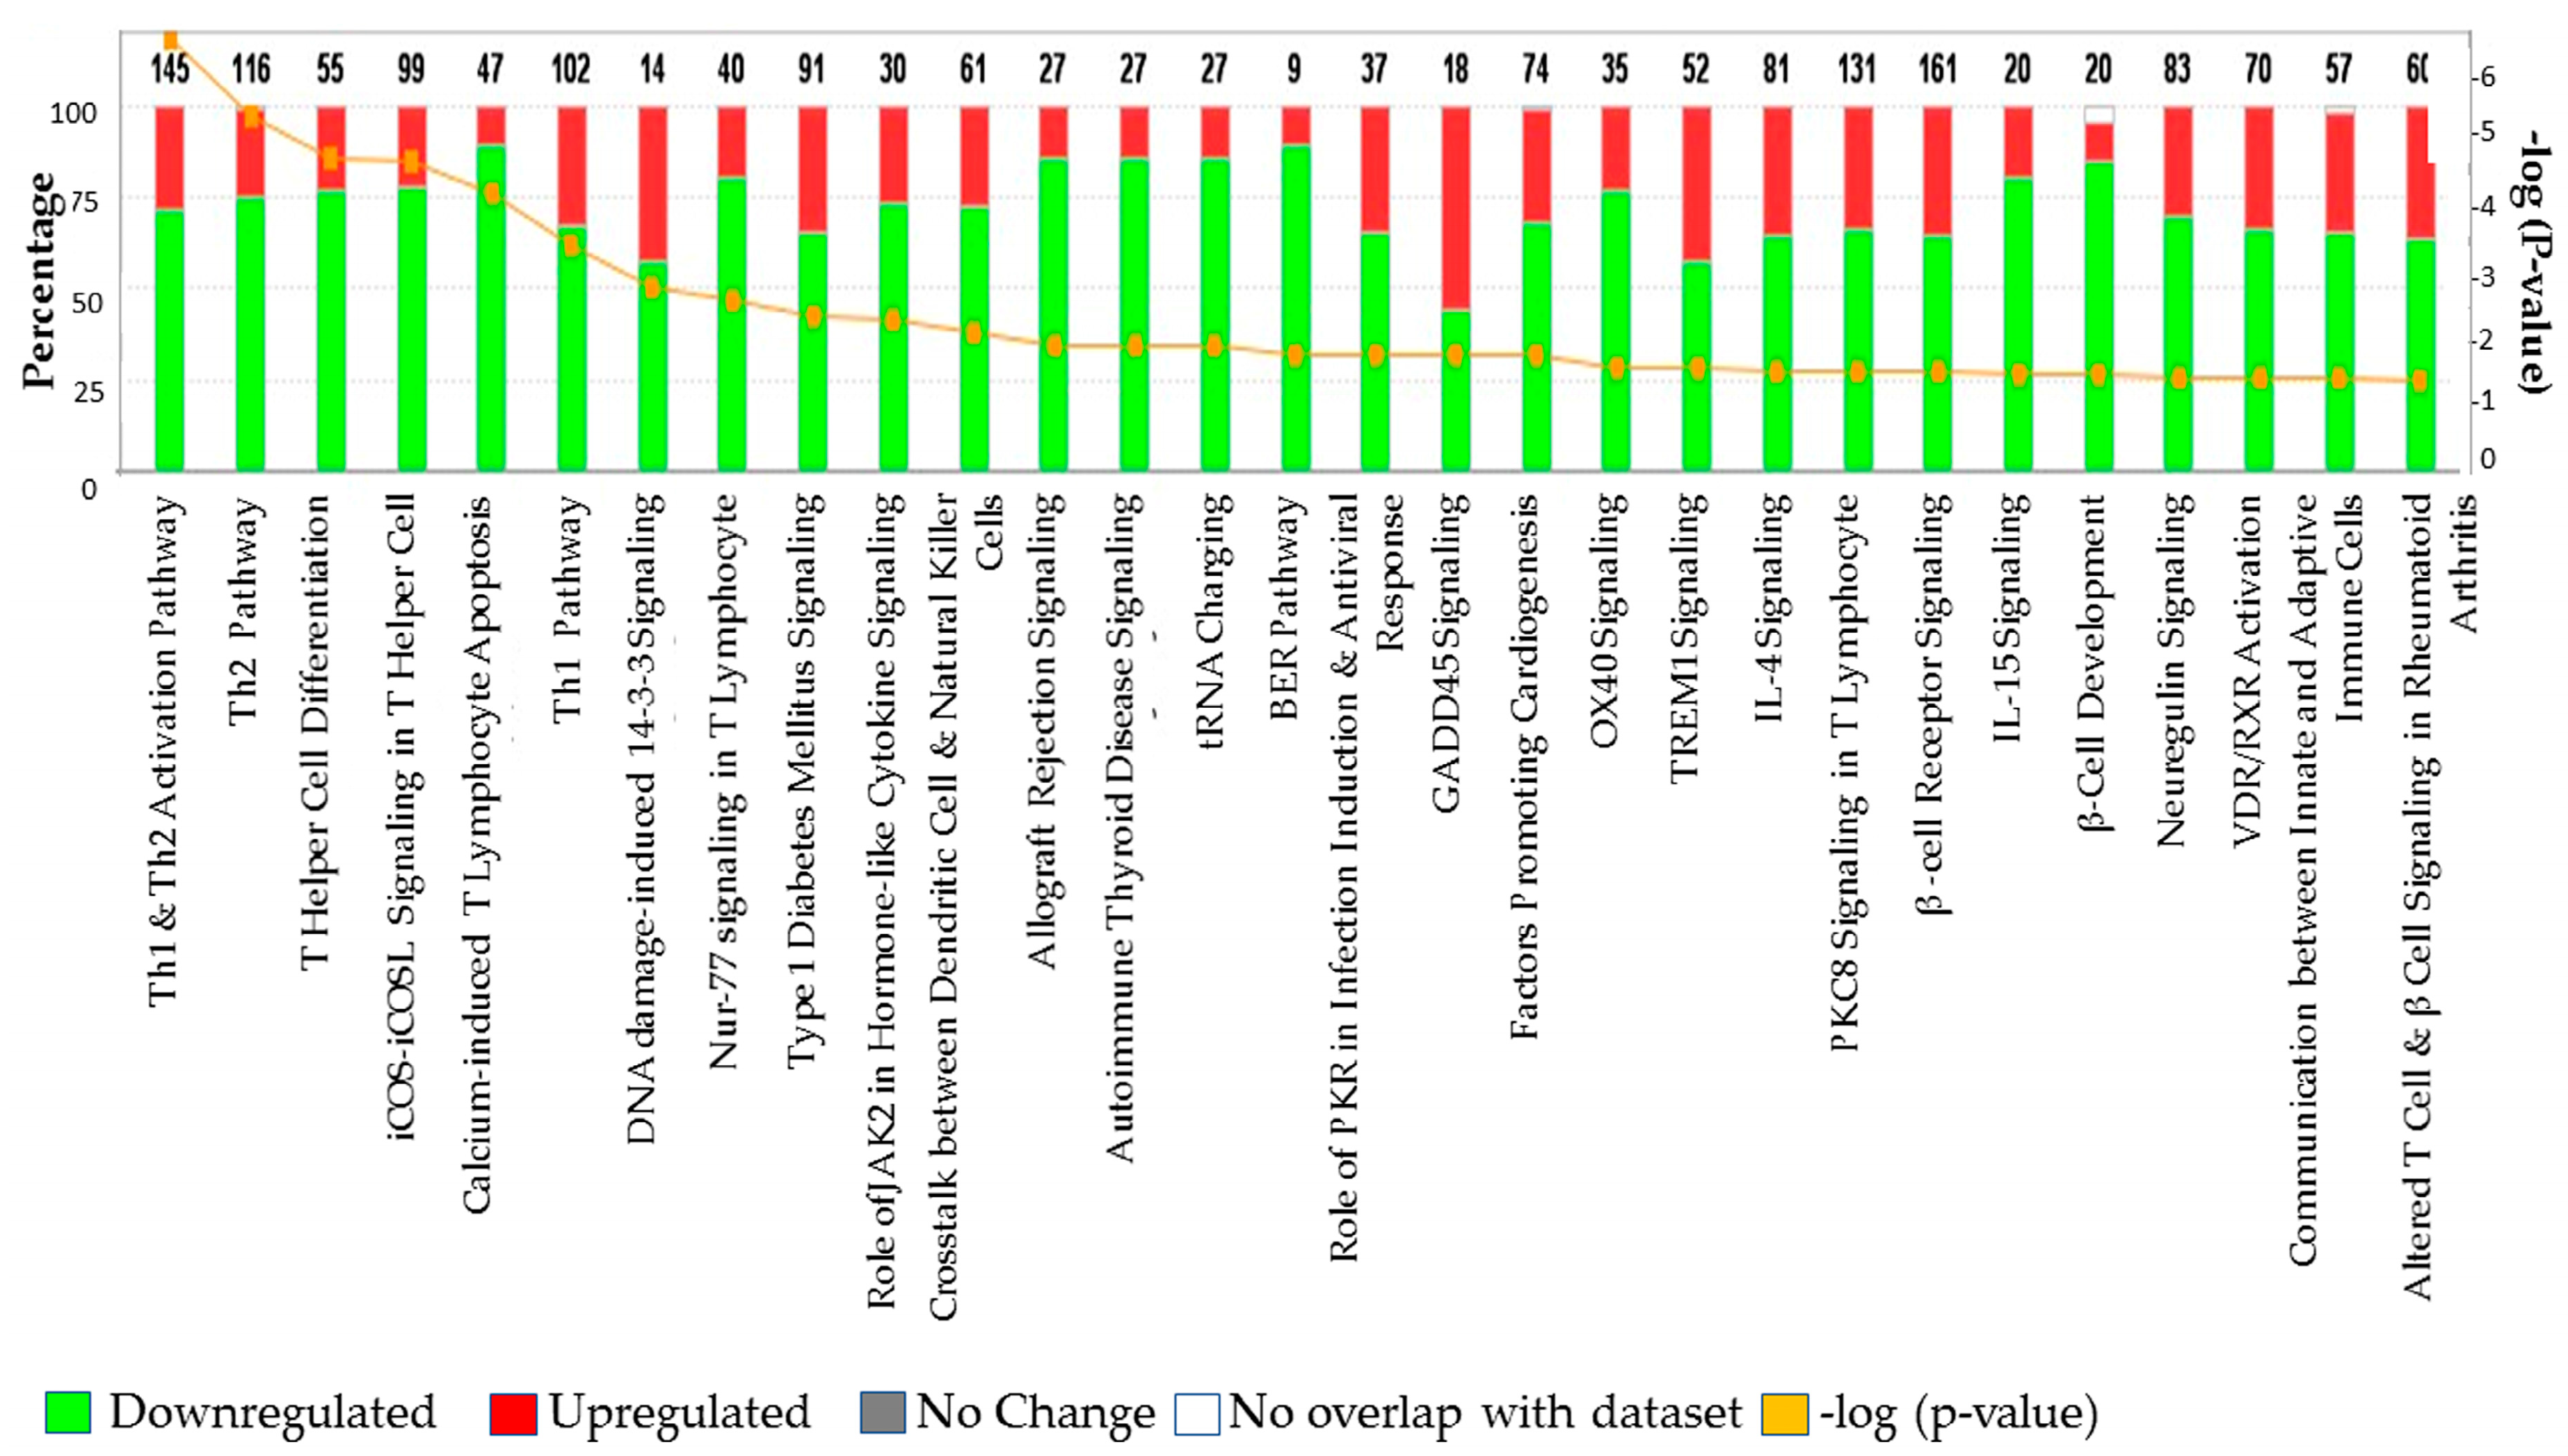
3.3. The Canonical Pathways (CP) and Gene Ontology (GO) Enrichment of Biological Processes

In the canonical pathway analysis, we chose to build the pathways connecting the top 3 networks (Networks 1–3, Total Score ≥ 30, Table 2). The top eleven (11) pathways identified through this approach were: Insulin Receptor Signaling, Type II Diabetes Mellitus Signaling, Apoptosis Signaling, Aryl Hydrocarbon Receptor Signaling, p53 Signaling, Mitochondrial Dysfunction, Chronic Myeloid Leukemia Signaling, Parkinson’s Signaling, Molecular Mechanism of Cancer, Glioma Signaling, and Cell Cycle G1/S Checkpoint Regulation (Figure 2). Further in-depth analysis also identified some additional pathways, i.e., GABA Receptor Signaling, Neuroinflammation Signaling Pathway, Dopamine Receptor Signaling, Sirtuin Signaling Pathway, Oxidative Phosphorylation, LXR/RXR Activation, and Mitochondrial Dysfunction (Figure 3).

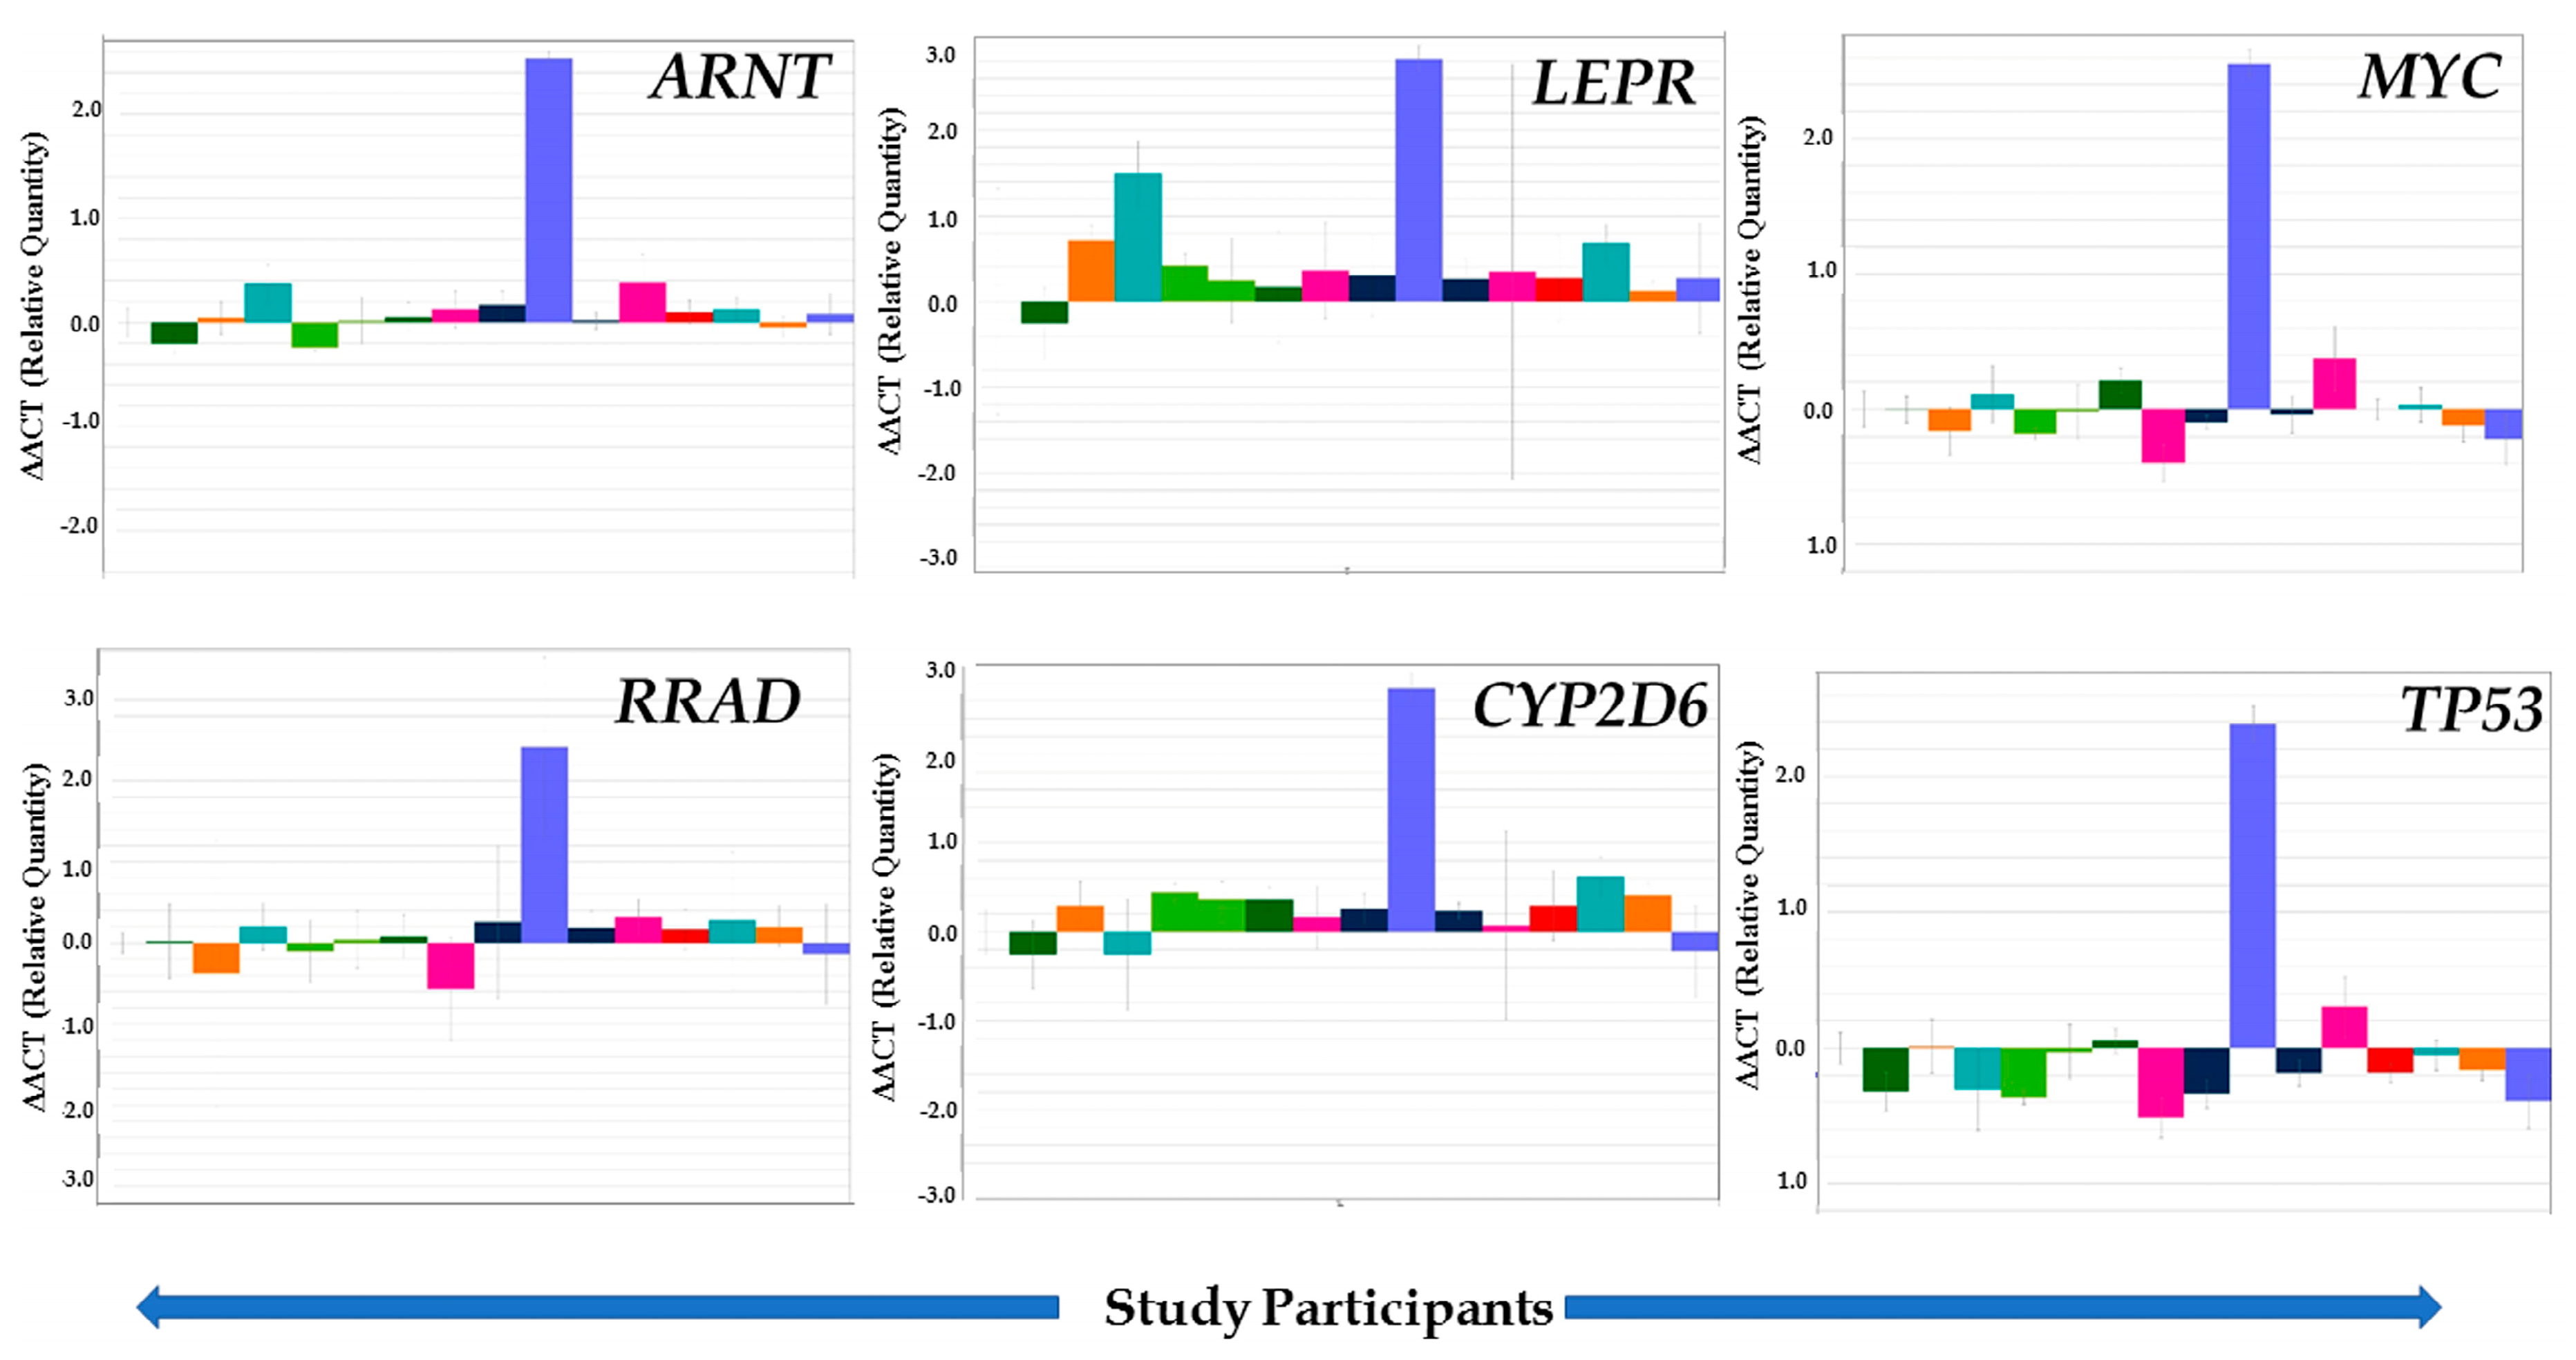
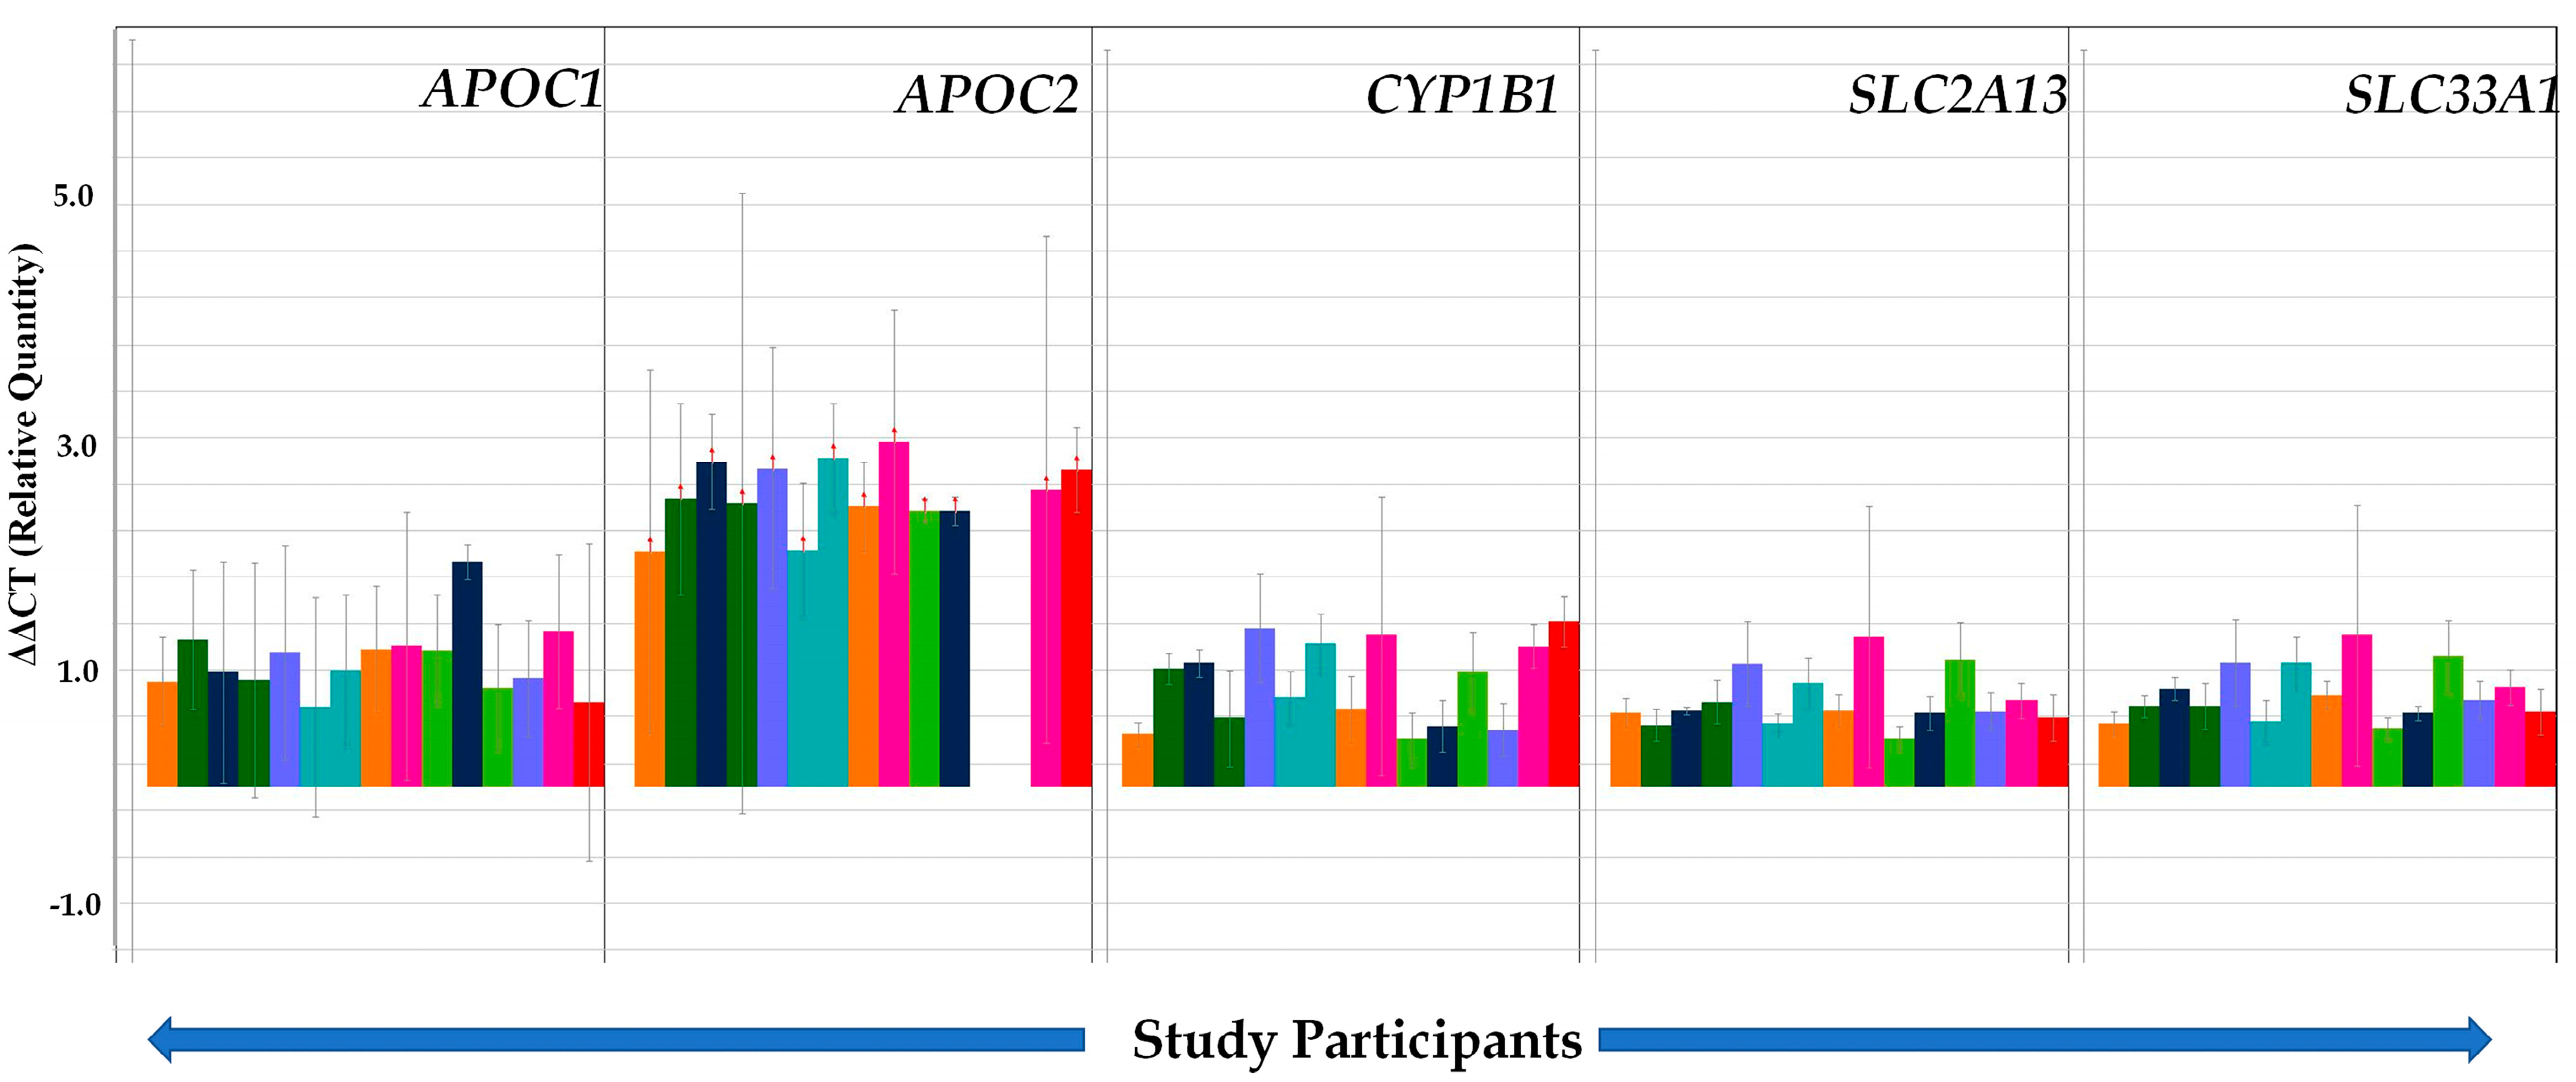
3.4. Validation of Selected Genes through TLDA

Our validation set of cases and controls revealed that the genes ARNT, LEPR, RRAD, and CYP2D6 were strongly upregulated in T2DM subjects compared to controls, except in a few individuals (Table 3; Figure 4). In addition, ARNT, LEPR, and RRAD genes were mostly upregulated in T2DM patients below 70 years of age, while in the older age group ARNT, LEPR, and RRAD were either upregulated or downregulated (data not shown). The results also showed that TP53 and MYC genes were mostly downregulated in our studied subjects (Figure 4), while expression of APOC1, APOC2, CYP1B1, SLC2AB, and SLC33A1 genes was highly upregulated in all subjects (Figure 5). IPA core analysis of the 29 signaling pathways we report here also revealed that the majority were downregulated (Figure 6), which corroborated our validation analysis.

4. Discussion

The delayed diagnosis of T2DM and its insidious inception are the main causes of the large number of mortality and morbidity cases worldwide, especially in developing countries like Pakistan [44,45]. The current pilot study, the first ever reported from that country, examined the gene expression profile data, significant signaling pathways, and distinct biological mechanisms associated with T2DM by high-throughput microarray analysis coupled with IPA analysis. Our gene expression results, however, indicated “cancer” genes as being differentially expressed in T2DM cases compared to controls, which was revealed through the IPA analysis (Figure 1), network connectivity (Figure 2, where TP53 stands as a central molecule in P53 Signaling Pathway), as well as a small pilot population validation of TP53 gene (Figure 4), where this tumor suppression gene is mostly downregulated. Combining all the observed results, there is a strong suggestion that continued observation and surveillance of this cohort is warranted in regard to potential cancer risk. The resulting differential gene expression patterns probably reflect the common effects of several underlying biological functions, wherein a single gene can be involved in multiple biological processes. Thus, it is imperative to understand gene regulatory pathways and networks that control phenotypically relevant biological mechanisms and extract the most biologically relevant biomarkers to assess the current disease state and to anticipate the possible future comorbid risks in this population.

4.1. Genes Associated with T2DM

In the current study, we identified several candidate genes (ARNT, LEPR, RRAD, CYP2D6, APOC1, APOC2, CYP181, SLC2A13, SLC33A1, MYC, and TP53) which presented statistically significant gene expression profiles. Here, we briefly summarize the knowledge base for each of these genes, as reported in the literature, and speculate on its potential role in T2DM.
ARNT (Aryl Hydrocarbon Receptor Nuclear Translocator), also known as HIF1β (hypoxia inducible factor-1β), is a heterodimer of the basic helix-loop-helix (bHLH-PAS) family of transcription factors including HIF1α, HIF2α, and AhR. ARNT is positioned on human chromosome 1q21–q24, and research has revealed that this region has presented a well replicated linkage to T2DM; alteration in the ARNT gene increases the risk of T2DM by impaired insulin secretion [46]. ARNT forms heterodimeric complexes with HIF1α, HIF2α, and AhR and is responsible for regulating the gene expression involved in glucose metabolism and glucose transport [47]. ARNT is required to stimulate beta-cells to increase insulin production, and expression of the transcription factor of ARNT is reduced in the islets of humans with T2DM [48]. In our pilot study, the ARNT gene expression was upregulated (Figure 4,) and may have also triggered the down regulation of FOX01 and AKT with Insulin Receptor Signaling and Type 2 Diabetes Mellitus Signaling among the important canonical pathways (Figure 2), consistent with prior reports [49].
Two other genes of interest in our diabetic subjects, viz., LEPR and RRAD, are marker proteins for metabolic dysfunction, which were mostly upregulated in our validation study (Figure 4). Leptin, a precursor of adipokines, is secreted by adipose tissues and acts by stimulating leptin receptor (LEPR) once it reaches the central nervous and peripheral nervous systems through the circulation. LEPR gene is located on chromosome 1p31 and is involved in the blood glucose, insulin secretion, and lipid metabolism [50,51]. LEPR gene is present in pancreatic beta cells and is expressively associated with chronic hyperglycemia, uncontrolled T2DM, and diabetes related disorders [52,53,54,55]. In our validation experiment, the LEPR gene was upregulated in 93% of the cases. This observation is concordant with previous studies, which showed upregulated gene expression of LEPR in this disease [56,57,58,59]. It was also identified as a future disease risk marker for metabolic dysfunction in a Slovakian population with severe environmental chemical exposures [36]. The strong associations between LEPR genetic variations and mutations and risk of T2DM has been reported by population-based studies [60,61,62,63].
RRAD is a member of the Ras-related family of small GTP binding proteins. Rad 35-kDa (Ras Associated with Diabetes) Ras-guanosine triphospha-tase (GTPase) is positively expressed in response to insulin [64]. The over expression of RRAD inhibits the glucose uptake and is associated with insulin resistance and T2DM [65]. We observed that RRAD gene expression was mostly upregulated in the cases we studied (80%, Table 3, Figure 4). This is in accord with the other studies that demonstrated increased expression level after giving insulin therapy or treatment [66]. RRAD’s primary target of expression is skeletal muscle, which is considered as a major site for glucose disposal and insulin resistance. Studies have also demonstrated its overexpression in the muscles of diabetic patients compared to controls [67,68].
Cytochrome P450 (CYP) is a large family of integral membrane proteins and its CYP isoenzymes involve almost 57 CYP genes in human [69]. These proteins have a heme group and are involved in the oxidative metabolism of many endogenous and exogenous compounds. CYP2D6 and CYP1B1, which we found to be upregulated in diabetic subjects, are two important CYP genes, which are functionally polymorphic and mediate an estimated 40% of all drug metabolism [70]. CYP1B1 catalyzes xenobiotic metabolism and is regulated by transcription factors like AHR nuclear translocator (ARNT) complex (AHR/ARNT) [71,72]. Our results agree with previous studies in which CYP1B1 gene expression level was also upregulated in T2DM, and whose gene polymorphisms are considered as responsible for increasing T2DM risk [73].
The human apolipoproteins C1 (APOC1) and C2 (APOC2) are the protein variants of Apolipoprotein E (APOE) constituents of chylomicrons, very low-density lipoprotein (VLDL), and high-density lipoprotein (HDL). APOC1 is expressed in adipose tissues, brain, liver, spleen, and lungs, and APOC2 is an important cofactor for lipoprotein lipase activation. Lipoprotein lipase is an enzyme that helps to hydrolyze triglyceride in blood plasma and aids in transferring the fatty acids to all tissues [74,75]. In our pilot study, we observed that APOC1 and APOC2 expression levels are highly upregulated in cases compared to controls (Figure 5). This is largely consistent with a previous study in which APOC1 showed increased expression levels in T2DM [76,77]. Interestingly, APOC2 has been found to be associated with Alzheimer’s disease [78]. There are proposed models of glucose-mediated neurodegeneration, mostly from studies in Alzheimer’s disease (AD), that provide a mechanistic understanding of the connections between the two diseases [79]. In our study, we speculate that progression to AD could be influenced by insulin signaling pathway (Figure 2), which in turn might lead to the impairment of several crucial cascades, such as synaptogenesis, neurotrophy, and apoptosis, which are regulated by insulin, cholesterol, and glucose metabolism [80], all of which were identified in our results (Figure 2; Table 1).
MYC, a proto-oncogene, is known as a transcription factor that helps to promote apoptosis, proliferation, and cell cycle progression. The MYC signaling pathways and networks control the utilization of glucose in cells [81]. Previous studies have shown that MYC is over-expressed in T2DM and concluded that MYC in beta cells activates the apoptosis mechanism, resulting in extensive beta cell loss that ultimately triggers the development of T2DM [82,83]. The MYC gene expression is mostly downregulated in our study subjects. Our results are opposite to those of some previous studies that observed that MYC gene expression is highly upregulated in diabetes [84,85,86].
Finally, the solute carrier family 2 (SLC2) genes are comprised of 14 members, which are essential for the maintenance of glucose uptake and survival of tumor cells. SLC2A13 and SLC33A1 are the specific genes of interest from that family based on the IPA knowledge base. There is some information implicating them as potential prognostic biomarkers in acute myeloid leukemia [87]. Both genes were upregulated in all our study subjects (Table 3) with a clear connection to the Chronic Myeloid Leukemia Signaling pathway (Figure 2).

4.2. Altered Pathways in T2DM

Insulin resistance is the hallmark of diabetes at the cellular level and negatively affects mitochondrial function [88]. Our IPA analysis suggests that several relevant canonical pathways are affected by T2DM, i.e., Mitochondrial Dysfunctions and Insulin Receptor Signaling (Figure 2). These two pathways may, in turn, trigger additional dysfunctions in intersecting pathways such as Oxidative Phosphorylation, LAX/RXR Activation, Sirtuin Signaling, Dopamine Receptor Signaling, Neuroinflammation Signaling, and Gaba Receptor Signaling (Figure 3), as previously reported in other studies [89].
Our gene expression and IPA analysis showed some evidence that T2DM may affect molecular pathways of relevance to developing cancer. However, the population does not yet show any symptoms of the disease, and hence we view it as a potential future disease risk. The clearest evidence was our unexpected result showing that the tumor suppressor gene TP53 was affected. TP53 (tumor suppressor gene) is a transcription factor that mediates the cell’s response to certain stresses and regulates the genes involved in apoptosis, DNA repair, cellular damage, and cell cycle arrest. In our study, this gene was downregulated in nearly all the patients with T2DM, as has been noted in some prior studies [90,91]. TP53 is also involved in glucose regulation, mitochondrial integrity, fatty acid metabolism, and antioxidant mechanisms [92]. It also regulates the expression of genes including glucose transporter genes Glut 1 and Glut 4 as well as the genes involved in cellular mechanism and glucose homeostasis [93].
The IPA core analysis of significant canonical pathways in T2DM subjects has also highlighted certain interconnected signaling pathways including P53 Signaling and Type 2 Diabetes Insulin Signaling in tandem with clear manifestations of Apoptosis Signaling, Molecular Mechanism of Cancer, Chronic Myeloid Leukemia, and Cell Cycle G1/S Checkpoint Regulation. TP53 is a central molecule that connects many of these pathways (Figure 2),s consistent with previous studies [94], and has been associated with increased cancer risks among persons with T2DM [95,96,97,98,99,100].

4.3. Strengths and Weaknesses

This study has some strengths, notably, being among the first in Pakistan to investigate altered gene expression in T2DM versus non-diabetic subjects, where we mapped those genes to their affected pathways. It builds upon our prior establishment of a cohort of T2DM patients from different regions of Pakistan [1]. Obesity is one of the major drivers in developing T2DM and is becoming increasingly prevalent in the developing world, including southeast Asian countries like Pakistan and India. According to recent consensus and American Diabetes Association position statements, the BMI cutoff for overweight (≥23 kg/m2) and obesity (≥25 kg/m2) is lower in Asians [101]. A BMI of 23 kg/m2 is then classified as overweight, and a substantial proportion of our T2DM cases therefore fit the overweight and obese categories. We also note that the gold standard for assessing insulin resistance in humans is the hyperinsulinemic-euglycemic clamp. Insulin resistance is generally associated with overweight and obesity, but without having insulin glucose clamp studies at this point, we could not definitively conclude that the participants in our study are insulin resistant. Although the gene expression work was limited by the small sample size, we used a rigorous validation process to highlight the most prominent associations. In the future, larger sample size studies for T2DM are required to confirm these associations and further identify both the underlying mechanisms of disease onset and progression and identifying avenues for treatment and prevention based on such knowledge.

5. Conclusions

In conclusion, this small pilot study generated information on potential genetic biomarkers for T2DM through microarray analysis and validated by qRT-PCR TLDA. These genetic variants along with their signaling pathways provide potential insights into certain biological mechanisms and pathogenesis of T2DM in a Pakistani population, which faces a major public health threat from the rising incidence and prevalence of the disease. In the future, larger population-based study designs deploying molecular biomarkers should spur the development of new tools to bridge the current knowledge gaps in understanding how T2DM develops and progresses, and how its impacts on the population can be blunted and ultimately prevented.

Supplementary Materials

The following are available online at https://0-www-mdpi-com.brum.beds.ac.uk/1660-4601/17/16/5866/s1. Table S1: T2DM-PAK-Genes p value 0.05.xlsx. Table S2: Demographic and clinical data of the small population that underwent pilot gene validation studies.

Author Contributions

Z.N., C.A.L., S.G. and A.B. together conceptualized the work and the manuscript. Z.N., A.B., J.S.K., and P.J. completed the field epidemiological and background data collection along with the disease states of the participants. J.S.K. coordinated the abstraction of clinical information and bio-sampling. G.N.-B. provided supervision, visualization, writing, reviewing, and editing. Z.N., J.J.S., and T.N. performed the laboratory, analytical work, and helped writing. J.J.S. performed the statistical analysis. A.B., C.A.L., and S.G. participated in writing, reviewing, and editing. All authors have read and agreed to the published version of the manuscript.

Funding

The authors are indebted for generous support by the 2-U54 MD00759731 grant (PI: Southerland) from the National Institute of Minority Health and Disparity (NIMHD/NIH),1-P20 CA262617-01 (PI: Ghosh). This work also received support from Higher Education Commission (HEC), Pakistan (1-8/HEC/HRD/2017/6867) to Zarish Noreen. Supporting funding was also received from ASAB (NUST) (Grant # 20-2321/R&D/HEC/14, PI: Bhatti & Grant # 5965/Federal/NRPU/R&D/2016, PI: John). Authors are highly indebted to Vijay Chandra, Primus Hospital, New Delhi, India, and Siddhartha Sankar Jana, Indian Association for the Cultivation of Science, Kolkata, India, for careful review and critical intellectual support. The contents of this report are solely the responsibility of the authors.

Conflicts of Interest

The authors declare no conflicts of interest.

References

  1. Noreen, Z.; DeJesus, J.; Bhatti, A.; Loffredo, C.A.; John, P.; Khan, J.S.; Ghosh, S. Epidemiological Investigation of Type 2 Diabetes and Alzheimer’s Disease in a Pakistani Population. Int. J. Environ. Res. Public Health 2018, 15, 1582. [Google Scholar] [CrossRef] [PubMed] [Green Version]
  2. Bar-Tana, J. Type 2 diabetes—Unmet need, unresolved pathogenesis, mTORC1-centric paradigm. Rev. Endocr. Metab. Disord. 2020, 1–17. [Google Scholar] [CrossRef] [PubMed] [Green Version]
  3. Lee, M.K.; Han, K.; Kim, M.K.; Koh, E.S.; Kim, E.S.; Nam, G.E.; Kwon, H.S. Changes in metabolic syndrome and its components and the risk of type 2 diabetes: A nationwide cohort study. Sci. Rep. 2020, 10, 1–8. [Google Scholar] [CrossRef] [PubMed]
  4. Bonnefond, A.; Froguel, P. Rare and common genetic events in type 2 diabetes: What should biologists know? Cell Metab. 2015, 21, 357–368. [Google Scholar] [CrossRef] [Green Version]
  5. González, E.M.; Johansson, S.; Wallander, M.A.; Rodríguez, L.G. Trends in the prevalence and incidence of diabetes in the UK: 1996–2005. J. Epidemiol. Community Health 2009, 63, 332–336. [Google Scholar] [CrossRef]
  6. Cohrs, C.M.; Panzer, J.K.; Drotar, D.M.; Enos, S.J.; Kipke, N.; Chen, C.; Brennand, A. Dysfunction of persisting β cells is a key feature of early type 2 diabetes pathogenesis. Cell Rep. 2020, 31, 107469. [Google Scholar] [CrossRef]
  7. Abdul-Ghani, M.A.; Tripathy, D.; DeFronzo, R.A. Top of Form Contributions of beta-cell dysfunction and insulin resistance to the pathogenesis of impaired glucose tolerance and impaired fasting glucose. Diabetes Care. 2006, 29, 1130–1139. [Google Scholar] [CrossRef]
  8. Abedini, M.R.; Bijari, B.; Miri, Z.; Emampour, F.S.; Abbasi, A. The quality of life of the patients with diabetes type 2 using EQ-5D-5 L in Birjand. Health Qual. Life Outcomes 2020, 18, 18. [Google Scholar] [CrossRef] [Green Version]
  9. Muñoz-Torres, A.V.; Medina-Bravo, P.; Valerio-Pérez, B.E.; Mendoza-Salmeron, G.; Escobedo-dela-Peña, J.; Velázquez-López, L. Positive health beliefs are associated with improvement of glycated hemoglobin and lipid profiles in Mexican patients with type 2 diabetes mellitus: A cross-sectional study. BMC Public Health 2020, 20, 761. [Google Scholar] [CrossRef]
  10. Cho, N.H.; Shaw, J.E.; Karuranga, S.; Huang, Y.; da Rocha Fernandes, J.D.; Ohlrogge, A.W.; Malanda, B. IDF Diabetes Atlas: Global estimates of diabetes prevalence for 2017 and projections for 2045. Diabetes Res. Clin. 2018, 138, 271–281. [Google Scholar] [CrossRef]
  11. Zheng, Y.; Ley, S.H.; Hu, F.B. Global aetiology and epidemiology of type 2 diabetes mellitus and its complications. Nat. Rev. Endocrinol. 2018, 14, 88. [Google Scholar] [CrossRef] [PubMed]
  12. Uddin, F.; Ali, B.; Junaid, N. Prevalence of diabetic complications in newly diagnosed type 2 diabetes patients in Pakistan: Findings from national registry. J. Ayub Med. Coll. Abbottabad 2019, 30, S652–S658. [Google Scholar]
  13. Patel, C.J.; Chen, R.; Kodama, K.; Ioannidis, J.P.; Butte, A.J. Systematic identification of interaction effects between genome-and environment-wide associations in type 2 diabetes mellitus. Hum. Genet. 2013, 132, 495–508. [Google Scholar] [CrossRef] [PubMed] [Green Version]
  14. Prasad, R.B.; Groop, L. Genetics of type 2 diabetes—Pitfalls and possibilities. Genes 2015, 6, 87–123. [Google Scholar] [CrossRef] [Green Version]
  15. Sanghera, D.K.; Blackett, P.R. Type 2 diabetes genetics: Beyond GWAS. J. Diabetes Metab. 2012, 3, 6948. [Google Scholar] [CrossRef] [Green Version]
  16. Balk, E.M.; Earley, A.; Raman, G.; Avendano, E.A.; Pittas, A.G.; Remington, P.L. Combined Combined diet and physical activity promotion programs to prevent type 2 diabetes among persons at increased risk: A systematic review for the Community Preventive Services Task Force. Ann. Intern. Med. 2015, 163, 437–451. [Google Scholar] [CrossRef] [Green Version]
  17. Overvad, K.; Dahm, C.C. Association between dietary meat consumption and incident type 2 diabetes: The EPIC-InterAct study. Diabetologia 2013, 56, 47–59. [Google Scholar]
  18. Kohei, K. Pathophysiology of type 2 diabetes and its treatment policy. Jpn. Med. Assoc. J. 2010, 53, 41–46. [Google Scholar]
  19. Centers for Disease Control and Prevention. National Diabetes Statistics Report. 2020. Available online: https://www.cdc.gov/diabetes/pdfs/data/statistics/national-diabetes-statistics-report.pdf (accessed on 2 June 2020).
  20. Saeedi, P.; Petersohn, I.; Salpea, P.; Malanda, B.; Karuranga, S.; Unwin, N.; Shaw, J.E. Global and regional diabetes prevalence estimates for 2019 and projections for 2030 and 2045: Results from the International Diabetes Federation Diabetes Atlas. Diabetes Res. Clin. 2019, 157, 107843. [Google Scholar] [CrossRef] [Green Version]
  21. Hussain, A.; Ali, I. Diabetes mellitus in Pakistan: A major public health concern. Arch. Pharm. Pr. 2016, 7, 30–33. [Google Scholar]
  22. Jayawardena, R.; Ranasinghe, P.; Byrne, N.M.; Soares, M.J.; Katulanda, P.; Hills, A.P. Prevalence and trends of the diabetes epidemic in South Asia: A systematic review and meta-analysis. BMC Public Health 2012, 12, 380. [Google Scholar] [CrossRef] [PubMed] [Green Version]
  23. Pandey, S.K.; Sharma, V. World Diabetes Day 2018: Battling the Emerging Epidemic of Diabetic Retinopathy. Indian J. Ophthalmol. 2018, 66, 1652–1653. [Google Scholar] [CrossRef] [PubMed]
  24. Mathers, C.D.; Loncar, D. Projections of global mortality and burden of disease from 2002 to 2030. PLoS Med. 2006, 3, 442. [Google Scholar] [CrossRef] [PubMed] [Green Version]
  25. Hossain, P.; Kawar, B.; El-Nahas, M. Obesity and diabetes in the developing world—A growing challenge. N. Engl. J. Med. 2007, 356, 213–215. [Google Scholar] [CrossRef] [Green Version]
  26. Aamir, A.H.; Ul-Haq, Z.; Mahar, S.A.; Qureshi, F.M.; Ahmad, I.; Jawa, A.; Ishtiaq, O. Diabetes Prevalence Survey of Pakistan (DPS-PAK): Prevalence of type 2 diabetes mellitus and prediabetes using HbA1c: A population-based survey from Pakistan. BMJ. Open 2019, 9, e025300. [Google Scholar] [CrossRef]
  27. Forouhi, N.G.; Luan, J.; Hennings, S.; Wareham, N.J. Incidence of Type 2 diabetes in England and its association with baseline impaired fasting glucose: The Ely study 1990–2000. Diabet. Med. 2007, 24, 200–207. [Google Scholar] [CrossRef]
  28. Wild, S.; Roglic, G.; Green, A.; Sicree, R.; King, H. Global prevalence of diabetes: Estimates for the year 2000 and projections for 2030. Diabetes Care 2004, 27, 1047–1053. [Google Scholar] [CrossRef] [Green Version]
  29. Basit, A.; Riaz, M.; Fawwad, A. Improving diabetes care in developing countries: The example of Pakistan. Diabetes Res. Clin. 2015, 107, 224–232. [Google Scholar] [CrossRef]
  30. Guariguata, L.; Whiting, D.; Hambleton, I.R.; Beagley, J.; Linnenkamp, U.; Shaw, J.E. Global estimates of diabetes prevalence for 2013 and projections for 2035. Diabetes Res. Clin. 2014, 103, 137–149. [Google Scholar] [CrossRef]
  31. Meo, S.A.; Zia, I.; Bukhari, I.A.; Arain, S.A. Type 2 diabetes mellitus in Pakistan: Current prevalence and future forecast. J. Pak. Med Assoc. 2016, 66, 1637–1642. [Google Scholar]
  32. Hu, F.B. Globalization of diabetes: The role of diet, lifestyle, and genes. Diabetes Care 2011, 34, 1249–1257. [Google Scholar] [CrossRef] [PubMed] [Green Version]
  33. Elobeid, M.A.; Padilla, M.A.; Brock, D.W.; Ruden, D.M.; Allison, D.B. Endocrine disruptors and obesity: An examination of selected persistent organic pollutants in the NHANES 1999–2002 data. Int. J. Environ. Res. Public Health 2010, 7, 2988–3005. [Google Scholar] [CrossRef] [PubMed] [Green Version]
  34. Wu, H.; Bertrand, K.A.; Choi, A.L.; Hu, F.B.; Laden, F.; Grandjean, P.; Sun, Q. Persistent organic pollutants and type 2 diabetes: A prospective analysis in the nurses’ health study and meta-analysis. Environ. Health Perspect. 2013, 121, 153–161. [Google Scholar] [CrossRef] [PubMed] [Green Version]
  35. Zong, G.; Valvi, D.; Coull, B.; Göen, T.; Hu, F.B.; Nielsen, F.; Sun, Q. Persistent organic pollutants and risk of type 2 diabetes: A prospective investigation among middle-aged women in Nurses’ Health Study II. Environ. Int. 2018, 114, 334–342. [Google Scholar] [CrossRef] [PubMed] [Green Version]
  36. Ghosh, S.; Murinova, L.; Trnovec, T.; Loffredo, C.A.; Washington, K.; Mitra, P.S.; Dutta, S.K. Biomarkers linking PCB exposure and obesity. Curr. Pharm. Biotechnol. 2014, 15, 1058–1068. [Google Scholar] [CrossRef] [PubMed] [Green Version]
  37. Ghosh, S.; Mitra, P.S.; Loffredo, C.A.; Trnovec, T.; Murinova, L.; Sovcikova, E.; Dutta, S.K. Transcriptional profiling and biological pathway analysis of human equivalence PCB exposure in vitro: Indicator of disease and disorder development in humans. Environ. Res. 2015, 138, 202–216. [Google Scholar] [CrossRef] [Green Version]
  38. Ghosh, S.; Trnovec, T.; Palkovicova, L.; Hoffman, E.P.; Washington, K.; Dutta, S.K. Status of LEPR gene in PCB-exposed population: A quick look. Int, J. Hum. Genet. 2013, 13, 27–32. [Google Scholar] [CrossRef] [Green Version]
  39. Zhao, P.; Hoffman, E.P. Embryonic myogenesis pathways in muscle regeneration. Dev. Dyn. 2004, 229, 380–392. [Google Scholar] [CrossRef]
  40. Ghosh, S.; Loffredo, C.A.; Mitra, P.S.; Trnovec, T.; Murinova, L.P.; Sovcikova, E.; Dutta, S.K. PCB exposure and potential future cancer incidence in Slovak children: An assessment from molecular finger printing by Ingenuity Pathway Analysis (IPA®) derived from experimental and epidemiological investigations. Environ. Sci. Pollut. Res. 2018, 25, 16493–16507. [Google Scholar] [CrossRef]
  41. Wu, Z.; Irizarry, R.A. Preprocessing of oligonucleotide array data. Nat. Biotechnol. 2004, 22, 656–658. [Google Scholar] [CrossRef]
  42. Kaizer, E.C.; Glaser, C.L.; Chaussabel, D.; Banchereau, J.; Pascual, V.; White, P.C. Gene expression in peripheral blood mononuclear cells from children with diabetes. J. Clin. Endocrinol. Metab. 2007, 92, 3705–3711. [Google Scholar] [CrossRef] [PubMed] [Green Version]
  43. Mitra, P.S.; Ghosh, S.; Zang, S.; Sonneborn, D.; Hertz-Picciotto, I.; Trnovec, T.; Dutta, S.K. Analysis of the toxicogenomic effects of exposure to persistent organic pollutants (POPs) in Slovakian girls: Correlations between gene expression and disease risk. Environ. Int. 2012, 39, 188–199. [Google Scholar] [CrossRef] [Green Version]
  44. Aschner, P.; Gagliardino, J.J.; Ilkova, H.; Lavalle, F.; Ramachandran, A.; Mbanya, J.C.; Chan, J.C. Persistent poor glycaemic control in individuals with type 2 diabetes in developing countries: 12 years of real-world evidence of the International Diabetes Management Practices Study (IDMPS). Diabetologia 2020, 63, 711–721. [Google Scholar] [CrossRef] [PubMed] [Green Version]
  45. Farmanfarma, K.K.; Ansari-Moghaddam, A.; Zareban, I.; Adineh, H.A. Prevalence of type 2 diabetes in Middle–East: Systematic review& meta-analysis. Prim. Care Diabetes 2020, 14, 297–304. [Google Scholar]
  46. Das, S.K.; Sharma, N.K.; Chu, W.S.; Wang, H.; Elbein, S.C. Aryl hydrocarbon receptor nuclear translocator (ARNT) gene as a positional and functional candidate for type 2 diabetes and prediabetic intermediate traits: Mutation detection, case-control studies, and gene expression analysis. BMC Med. Genet. 2008, 9, 16. [Google Scholar] [CrossRef] [Green Version]
  47. Semenza, G.L. Regulation of mammalian O2 homeostasis by hypoxia-inducible factor. Annu. Rev. Cell Dev. Biol. 1999, 15, 551–578. [Google Scholar] [CrossRef]
  48. Lau, S.M.; Cha, K.M.; Karunatillake, A.; Stokes, R.A.; Cheng, K.; McLean, M.; Gunton, J.E. Beta-cell ARNT is required for normal glucose tolerance in murine pregnancy. PLoS ONE 2013, 8, e77419. [Google Scholar] [CrossRef]
  49. Hu, Z.; Jiao, R.; Wang, P.; Zhu, Y.; Zhao, J.; De Jager, P.; Bennett, D.A.; Jin, L.; Xiong, M. Shared Causal Paths underlying Alzheimer’s dementia and Type 2 Diabetes. Sci. Rep. 2020, 10, 4107. [Google Scholar] [CrossRef] [Green Version]
  50. Abella, V.; Scotece, M.; Conde, J.; Pino, J.; Gonzalez-Gay, M.A.; Gomez-Reino, J.J.; Gualillo, O. Leptin in the interplay of inflammation, metabolism and immune system disorders. Nat. Rev. Rheumatol. 2017, 13, 100. [Google Scholar] [CrossRef]
  51. Zhang, F.; Chen, Y.; Heiman, M.; DiMarchi, R. Leptin: Structure, function and biology. Vitam. Horm. 2005, 71, 345–372. [Google Scholar]
  52. Denroche, H.C.; Huynh, F.K.; Kieffer, T.J. The role of leptin in glucose homeostasis. J. Diabetes Invest. 2012, 3, 115–119. [Google Scholar] [CrossRef] [PubMed] [Green Version]
  53. Liao, W.L.; Chen, C.C.; Chang, C.T.; Wu, J.Y.; Chen, C.H.; Huang, Y.C.; Tsai, F.J. Gene polymorphisms of adiponectin and leptin receptor are associated with early onset of type 2 diabetes mellitus in the Taiwanese population. Int. J. Obes. 2012, 36, 790. [Google Scholar] [CrossRef] [PubMed] [Green Version]
  54. Mohammadzadeh, G.; Nikzamir, A.; Mohammadi, J.; Pourdashti, S.; Shabazian, H.; Latifi, S.M. Association of the 223A/G LEPR polymorphism with serum leptin levels in Iranian subjects with type 2 diabetes. Arch. Iran. Med. 2013, 16, 636–641. [Google Scholar] [PubMed]
  55. Yang, M.M.; Wang, J.; Fan, J.J.; Ng, T.K.; Sun, D.J.; Guo, X.; Li, Y.B. Variations in the obesity gene “LEPR” contribute to risk of type 2 diabetes mellitus: Evidence from a meta-analysis. J. Diabetes Res. 2016, 2016, 5412084. [Google Scholar] [CrossRef] [PubMed] [Green Version]
  56. Cherian, P.T.; Al-Khairi, I.; Sriraman, D.; Al-Enezi, A.; Al-Sultan, D.; Al-Otaibi, M.; Abu-Farha, M. Increased Circulation and Adipose Tissue Levels of DNAJC27/RBJ in Obesity and Type 2-Diabetes. Front. Endocrinol. 2018, 9, 423. [Google Scholar] [CrossRef]
  57. Hur, J.; Sullivan, K.A.; Pande, M.; Hong, Y.; Sima, A.A.; Jagadish, H.V.; Feldman, E.L. The identification of gene expression profiles associated with progression of human diabetic neuropathy. Brain 2011, 134, 3222–3235. [Google Scholar] [CrossRef]
  58. Liu, X.; Li, X.; Li, C.; Gong, C.; Liu, S.; Shi, Y. Study on regulation of adipokines on body fat distribution and its correlation with metabolic syndrome in type 2 diabetes mellitus. Minerva Endocrinol. 2019, 44, 259–263. [Google Scholar] [CrossRef]
  59. Qadir, M.I.; Ahmed, Z. lep Expression and its role in obesity and type-2 diabetes. Crit. Rev. Eukaryot. Gene 2017, 27, 47–51. [Google Scholar] [CrossRef]
  60. Dagdan, B.; Chuluun-Erdene, A.; Sengeragchaa, O.; Malchinkhuu, M.; Janlav, M. Leptin gene G2548A polymorphism among mongolians with metabolic syndrome. Med Sci. 2019, 7, 3. [Google Scholar] [CrossRef] [Green Version]
  61. Li, Y.Y.; Wang, H.; Yang, X.X.; Wu, J.J.; Geng, H.Y.; Kim, H.J.; Wang, L.S. LEPR gene Gln223Arg polymorphism and type 2 diabetes mellitus: A meta-analysis of 3,367 subjects. Oncotarget 2017, 8, 61927. [Google Scholar] [CrossRef] [Green Version]
  62. Su, S.; Zhang, C.; Zhang, F.; Li, H.; Yang, X.; Tang, X. The association between leptin receptor gene polymorphisms and type 2 diabetes mellitus: A systematic review and meta-analysis. Diabetes Res. Clin. 2016, 121, 49–58. [Google Scholar] [CrossRef]
  63. Zhang, L.; Qin, Y.; Liang, D.; Li, L.; Liang, Y.; Chen, L.; Zhang, H. Association of polymorphisms in LEPR with type 2 diabetes and related metabolic traits in a Chinese population. Lipids Health Dis. 2018, 17, 2. [Google Scholar] [CrossRef] [Green Version]
  64. Laville, M.; Auboeuf, D.; Khalfallah, Y.; Vega, N.; Riou, J.P.; Vidal, H. Acute regulation by insulin of phosphatidylinositol-3-kinase, Rad, Glut 4, and lipoprotein lipase mRNA levels in human muscle. J. Clin. Invest. 1996, 98, 43–49. [Google Scholar] [CrossRef]
  65. Moyers, J.S.; Bilan, P.J.; Reynet, C.; Kahn, C.R. Overexpression of Rad inhibits glucose uptake in cultured muscle and fat cells. J. Biol. 1996, 271, 23111–23116. [Google Scholar] [CrossRef] [Green Version]
  66. Sreekumar, R.; Halvatsiotis, P.; Schimke, J.C.; Nair, K.S. Gene expression profile in skeletal muscle of type 2 diabetes and the effect of insulin treatment. Diabetes 2002, 51, 1913–1920. [Google Scholar] [CrossRef] [Green Version]
  67. Ilany, J.; Bilan, P.J.; Kapur, S.; Caldwell, J.S.; Patti, M.E.; Marette, A.; Kahn, C.R. Overexpression of Rad in muscle worsens diet-induced insulin resistance and glucose intolerance and lowers plasma triglyceride level. Proc. Natl. Acad. Sci. USA 2006, 103, 4481–4486. [Google Scholar] [CrossRef] [Green Version]
  68. Reynet, C.; Kahn, C.R. Rad: A member of the Ras family overexpressed in muscle of type II diabetic humans. Science 1993, 262, 1441–1444. [Google Scholar] [CrossRef]
  69. Nelson, D.R.; Zeldin, D.C.; Hoffman, S.M.; Maltais, L.J.; Wain, H.M.; Nebert, D.W. Comparison of cytochrome P450 (CYP) genes from the mouse and human genomes, including nomenclature recommendations for genes, pseudogenes and alternative-splice variants. Pharmacogenetics 2004, 14, 1–18. [Google Scholar] [CrossRef] [Green Version]
  70. Bernard, S.; Neville, K.A.; Nguyen, A.T.; Flockhart, D.A. Interethnic differences in genetic polymorphisms of CYP2D6 in the US population: Clinical implications. Clin. Oncol. 2006, 11, 126–135. [Google Scholar]
  71. Nebert, D.W.; Dalton, T.P.; Okey, A.B.; Gonzalez, F.J. Role of aryl hydrocarbon receptor-mediated induction of the CYP1 enzymes in environmental toxicity and cancer. J. Biol. 2004, 279, 23847–23850. [Google Scholar] [CrossRef] [Green Version]
  72. Sissung, T.M.; Price, D.K.; Sparreboom, A.; Figg, W.D. Pharmacogenetics and regulation of human cytochrome P450 1B1: Implications in hormone-mediated tumor metabolism and a novel target for therapeutic intervention. Mol. Cancer Res. 2006, 4, 135–150. [Google Scholar] [CrossRef] [Green Version]
  73. Elfaki, I.; Almutairi, F.M.; Mir, R.; Khan, R.; Abu-Duhier, F. Cytochrome P450 Cyp1b1*2 Gene And Its Association with T2d In Tabuk Population, Northwestern Region Of Saudi Arabia. Asian J. Pharm. Clin. Res. 2018, 11, 55–59. [Google Scholar] [CrossRef] [Green Version]
  74. Cohn, J.S.; Tremblay, M.; Boulet, L.; Jacques, H.; Davignon, J.; Roy, M.; Bernier, L. Plasma concentration and lipoprotein distribution of ApoC-I is dependent on ApoE genotype rather than the Hpa I ApoC-I promoter polymorphism. Atherosclerosis 2003, 169, 63–70. [Google Scholar] [CrossRef]
  75. Lauer, S.J.; Walker, D.; Elshourbagy, N.A.; Reardon, C.A.; Levy-Wilson, B.; Taylor, J.M. Two copies of the human apolipoprotein CI gene are linked closely to the apolipoprotein E gene. J. Biol. 1988, 263, 7277–7286. [Google Scholar]
  76. Hubacek, J.A.; Pitha, J.; Adamkova, V.; Skodova, Z.; Lanska, V.; Poledne, R. Apolipoprotein E and apolipoprotein CI polymorphisms in the Czech population: Almost complete linkage disequilibrium of the less frequent alleles of both polymorphisms. Physiol. Res. 2003, 52, 195–200. [Google Scholar]
  77. Xu, Y.; Berglund, L.; Ramakrishnan, R.; Mayeux, R.; Ngai, C.; Holleran, S.; Shachter, N.S. A common Hpa I RFLP of apolipoprotein CI increases gene transcription and exhibits an ethnically distinct pattern of linkage disequilibrium with the alleles of apolipoprotein E. J. Lipid Res. 1999, 40, 50–58. [Google Scholar]
  78. Hao, K.; Di Narzo, A.F.; Ho, L.; Luo, W.; Li, S.; Chen, R.; Pasinetti, G.M. Shared genetic etiology underlying Alzheimer’s disease and type 2 diabetes. Mol. Asp. Med. 2015, 43, 66–76. [Google Scholar] [CrossRef]
  79. Madhusudhanan, J.; Suresh, G.; Devanathan, V. Neurodegeneration in type 2 diabetes: Alzheimer’s as a case study. Brain Behav. 2020, 10, e01577. [Google Scholar] [CrossRef] [Green Version]
  80. Rad, S.K.; Arya, A.; Karimian, H.; Madhavan, P.; Rizwan, F.; Koshy, S.; Prabhu, G. Mechanism involved in insulin resistance via accumulation of β-amyloid and neurofibrillary tangles: Link between type 2 diabetes and Alzheimer’s disease. Drug Des. Dev. Ther. 2018, 12, 3999. [Google Scholar]
  81. Nasi, S.; Ciarapica, R.; Jucker, R.; Rosati, J.; Soucek, L. Making decisions through Myc. FEBS Lett. 2001, 490, 153–162. [Google Scholar] [CrossRef] [Green Version]
  82. Kaneto, H.; Sharma, A.; Suzuma, K.; Laybutt, D.R.; Xu, G.; Bonner-Weir, S.; Weir, G.C. Induction of c-Myc expression suppresses insulin gene transcription by inhibiting NeuroD/BETA2-mediated transcriptional activation. J. Biol. 2002, 277, 12998–13006. [Google Scholar] [CrossRef] [Green Version]
  83. Pelengaris, S.; Khan, M.; Evan, G.I. Suppression of Myc-induced apoptosis in β cells exposes multiple oncogenic properties of Myc and triggers carcinogenic progression. Cell 2002, 109, 321–334. [Google Scholar] [CrossRef] [Green Version]
  84. Laybutt, D.R.; Weir, G.C.; Kaneto, H.; Lebet, J.; Palmiter, R.D.; Sharma, A.; Bonner-Weir, S. Overexpression of c-Myc in β-cells of transgenic mice causes proliferation and apoptosis, downregulation of insulin gene expression, and diabetes. Diabetes 2002, 51, 1793–1804. [Google Scholar] [CrossRef] [Green Version]
  85. Riu, E.; Ferre, T.; Hidalgo, A.; Mas, A.; Franckhauser, S.; Otaegui, P.; Bosch, F. Overexpression Overexpression of c-myc in the liver prevents obesity and insulin resistance. FASEB J. 2003, 17, 1715–1717. [Google Scholar] [CrossRef] [Green Version]
  86. Yang, Y.; Wang, Y.; Zhou, K.; Hong, A. Constructing regulatory networks to identify biomarkers for insulin resistance. Genes 2014, 539, 68–74. [Google Scholar] [CrossRef] [Green Version]
  87. Lai, B.; Lai, Y.; Zhang, Y.; Zhou, M.; Sheng, L.; OuYang, G. The Solute Carrier Family 2 Genes Are Potential Prognostic Biomarkers in Acute Myeloid Leukemia. Technol. Cancer Res. Treat. 2020, 19, 1533033819894308. [Google Scholar] [CrossRef]
  88. Hong, C.T.; Chen, K.Y.; Wang, W.; Chiu, J.Y.; Wu, D.; Chao, T.Y.; Bamodu, O.A. Insulin Resistance Promotes Parkinson’s Disease through Aberrant Expression of α-Synuclein, Mitochondrial Dysfunction, and Deregulation of the Polo-Like Kinase 2 Signaling. Cells 2020, 9, 740. [Google Scholar] [CrossRef] [Green Version]
  89. De Felice, F.G.; Ferreira, S.T. Inflammation, defective insulin signaling, and mitochondrial dysfunction as common molecular denominators connecting type 2 diabetes to Alzheimer disease. Diabetes 2014, 63, 2262–2272. [Google Scholar] [CrossRef] [Green Version]
  90. Yoshida, Y.; Shimizu, I.; Minamino, T. The pathological role of adipose tissue aging in the progression of systemic insulin resistance. Inflamm. Regen. 2015, 35, 178–184. [Google Scholar] [CrossRef] [Green Version]
  91. Zhang, P.; Tu, B.; Wang, H.; Cao, Z.; Tang, M.; Zhang, C.; Zhao, Y. Tumor suppressor p53 cooperates with SIRT6 to regulate gluconeogenesis by promoting FoxO1 nuclear exclusion. Proc. Natl. Acad. Sci. USA 2014. [Google Scholar] [CrossRef] [Green Version]
  92. Kuricova, K.; Kuricova, L.; Dvorakova, V.; Kankova, K. Association of the Arg72Pro polymorphism in p53 with progression of diabetic nephropathy in T2DM subjects. J. Nephrol. Ther. 2014, 4. [Google Scholar] [CrossRef] [Green Version]
  93. Hager, K.M.; Gu, W. Understanding the non-canonical pathways involved in p53-mediated tumor suppression. Carcinogenesis 2013, 35, 740–746. [Google Scholar] [CrossRef] [PubMed]
  94. Krook, A.; Roth, R.A.; Jiang, X.J.; Zierath, J.R.; Wallberg-Henriksson, H. Insulin-stimulated Akt kinase activity is reduced in skeletal muscle from NIDDM subjects. Diabetes 1998, 47, 1281–1286. [Google Scholar] [CrossRef] [PubMed]
  95. Ambika, S.; Donna, S.; Edward, G.; Frank, B.H. Type 2 diabetes and risk of cancer. BMJ 2015, 350, g7707. [Google Scholar]
  96. Anastasi, E.; Filardi, T.; Tartaglione, S.; Lenzi, A.; Angeloni, A.; Morano, S. Linking type 2 diabetes and gynecological cancer: An introductory overview. Clin. Chem. Lab. Med. 2018, 56, 1413–1425. [Google Scholar] [CrossRef]
  97. Chen, Y.; Wu, F.; Saito, E.; Lin, Y.; Song, M.; Luu, H.; Gupta, P.; Sawada, N.; Tamakoshi, A.; Shu, X.; et al. Association between type 2 diabetes and risk of cancer mortality: A pooled analysis of over 771,000 individuals in the Asia Cohort Consortium. Diabetologia 2017, 60, 1022–1032. [Google Scholar] [CrossRef]
  98. Pan, X.; He, M.; Yu, C.; Lv, J.; Guo, Y.; Bian, Z.; Yang, L.; Chen, Y.; Wu, T.; Chen, Z.; et al. Type 2 Diabetes and Risk of Incident Cancer in China: A Prospective Study Among 0.5 Million Chinese Adults. Am. J. Epidemiol. 2018, 187, 1380–1391. [Google Scholar] [CrossRef]
  99. Suh, S.; Kim, K. Diabetes and Cancer: Cancer Should Be Screened in Routine Diabetes Assessment. Diabetes Metab. J. 2019, 43, 733–743. [Google Scholar] [CrossRef]
  100. Vincent, E.E.; Yaghootkar, H. Using genetics to decipher the link between type 2 diabetes and cancer: Shared aetiology or downstream consequence? Diabetologia 2020. [Google Scholar] [CrossRef]
  101. Misra, A. Ethnic-Specific Criteria for Classification of Body Mass Index: A Perspective for Asian Indians and American Diabetes Association Position Statement. Diabetes Technol. Ther. 2015, 17, 667–671. [Google Scholar] [CrossRef] [Green Version]
Figure 1. The key bio-functions associated with Type 2 Diabetes subjects including: disease and disorder development (A), physiological system development and functions (B), and molecular and cellular functions (C). The most statistically significant biofunctions that were identified in the IPA core analysis are listed here according to their p value (-Log). The threshold line corresponds to a p value of 0.05.
Ijerph 17 05866 g001
Figure 2. Connectivity of differentially expressed genes in the important signaling pathways in the Type 2 Diabetes subjects, relative to non-diabetic controls, depicting the connectivity between differentially expressed genes (those with ≥ 2-fold change, t-test, p < 0.05). Geometric figures in red denote upregulated genes, and those that are green indicate downregulation. Genes in the top 3 networks (from our experimental set of 1657 genes) were allowed to grow our pathway with the direct/indirect relationship from the IPA knowledge base. Solid interconnecting lines show the genes that are directly connected, and the dotted lines signify the indirect connections between the genes and cellular functions. Canonical pathways for signaling that are highly represented are shown within the box. Genes in uncolored notes were integrated into computational generated networks based on evidence stored in the IPA knowledge base.
Ijerph 17 05866 g002
Figure 3. Gene networks created by IPA Analysis that correspond to important canonical pathways reflective of potential future neurological disease/disorders are shown here for our pilot study of subjects with Type 2 Diabetes. Indirect relationships in this context are indicated in blue in the center. Canonical pathways are shown within the box.
Ijerph 17 05866 g003
Figure 4. Quantitative real-time PCR (qRT-PCR) results are shown here from our validation of 6 selected genes: ARNT, LEPR, MYC, RRAD, CYP2D6, and TP53. Results were obtained by Taqman Low Density Array (TLDA) on the ABI platform (7900HT Fast Real-Time PCR System) after analysis by SDS RQ Manager Version 1.2.1 (ΔΔCt). Results represented here are the direct snapshots where each panel shows the relative quantification of the selected genes (up- or downregulation) among the study subjects (n = 15 cases with type 2 diabetes and respective controls).
Ijerph 17 05866 g004
Figure 5. Quantitative real-time PCR (qRT-PCR) results are shown here for validation of APOC1, APOC2, CYP1B1, SLC2A13, and SLC33A1. The same methods described under Figure 4 were used to generate these results.
Ijerph 17 05866 g005
Figure 6. Summary of total upregulated (red) and downregulated (green) genes representing 29 important signaling and disease pathways in Type 2 diabetes cases compared to non-diabetic controls in the core analysis, reflecting the differential gene expressions obtained from the microarrays (1657 gene sets with ≥ 2-fold change, t-test, p < 0.05).
Ijerph 17 05866 g006
Table 1. Summary of the Ingenuity Pathway Analysis (IPA) gene expression analysis results associated with differentially expressed genes in a Pakistani Population with Type 2 Diabetes.
CategoryTop Functions and DiseaseSignificance (p-Value)
Top Canonical Pathways
B-Cell Development/Receptor SignalingImmunological Disease/Cell Morphology/Immune Response8.17 × 10−6
Altered B Cell SignalingHematological System development and Functions1.70 × 10−4
Allograft Rejection SignalingCell to Cell Communication/Cellular Growth and Proliferation1.08 × 10−3
Autoimmune Thyroid Disease Signaling 1.08 × 10⁻³
Cyclins and Cell Cycle RegulationsPost-Translational Modification/Cell Cycle/ Connective Tissue Development1.77 × 102
Role of NFAT in Regulation of ImmuneCellular Development, Growth and Proliferation1.86 × 10−2
Response
PI3K/AKT SignalingCardiovascular Disease/Cardiovascular System Development and Function1.99 × 10−2
NK-kB ActivationCellular Development, Growth and Proliferation/ Hematological System Development and Function2.47 × 10−2
PPAR SignalingGene Expression/Cardiovascular System Development and Function3.24 × 10−2
Important Molecules
Disease and Disorders
CancerPPAR2, TP53, UBC, AKT1, CCL2, LRP63.87 × 10−4
Organismal Injury and AbnormalityCCL2, CD48, PARP1, CCND2, TFP1, TP53, YUGB13.87 × 10−4
Respiratory DiseaseCCL2, CUBN, AKT1, KIF20A, CCR6, IGF20A3.87 × 10−4
Reproductive System DiseaseATP78,BIRC5, CCL2, CITED2, PSMA1, RELA, TP531.97 × 10−3
Connective Tissue DisorderTERT, TP533.59 × 103
Endocrine System DisorderAPCS, CALR, EZH2, PRDX6, TERT, TP533.59 × 10−3
Ophthalmic DiseaseTERT, TP533.59 × 10−3
Immunological DiseaseCD79A, CD79B,EZH2, LRP6, TNFRSF14, TP537.90 × 10−3
Tumor MorphologyBIRC5, CD40, CD40LG, TP531.31 × 10−2
Molecular and Cellular Functions
Cell CycleAURKA, TERT1.03 × 10−2
Cellular Assembly and OrganizationCOL17A1, DST1.03 × 10−2
Lipid MetabolismALG2, CD40LG1.03 × 10−2
Small Molecule BiochemistryALG2, CD40LG1.03 × 10−2
Cell Death and SurvivalBIRC5, TP53, APOD, AKT1, SMARCA4, COL17A11.31 × 10−2
Physiological System Development and Function
Nervous System Development and FunctionCNTF,mir-196, OPN1MW3.59 × 10−3
Tissue MorphologyCNTF, TP533.59 × 10−3
Hematological System Development and FunctionCCL2, FTL3LG, CD4, CD401.31 × 10−2
Tissue DevelopmentCCL2, DCM1, BMP15, ACVR1, ITGA51.37 × 10−2
Endocrine System Development and FunctionCCNE1, TCIM3.18 × 10−2
Genes in Bold = Upregulated; Italicized = Downregulated; p-value = Fischer’s exact test was used to calculate a p-value determining the probability that each biological function and/or disease was different in cases and controls.
Table 2. High-scoring networks identified by Ingenuity® Pathway Analysis in a population of patients with Type 2 Diabetes in Pakistan: Top Five affected networks.
Network IDGenes in NetworkScoreFocus MoleculesFunctions
1ADH1A, ADH4, APCS, CCNA2, CCNE1, CD40LG CDCA2, CDK2, CDK6, CDKN18, CENPE, CFHCKS2, CRP, FOXMI, HNF1A, IL6, KIF20A, MIF4GD PCK1, PCNA, TACR3, TGFB1, TMED10, AKT11416Cell Cycle, DNA Replication, Recombination and Repair, Organismal Survival
2ACTL6A, CLAR, CAV1, CITED2, COL1A1, COL1A2, FDXR, FUT1, HDAC1, HUWE1, JARID2, ENSA, EZH2 MCL1, MECP2, mir-196, NOTCH1, NTF4, PARP1, PRPF8 PIGER3, RCOR1, SERP1NB2, SF1, SIN3A, SMURF2, SNAI1, SP1, SSPN, TBX1, TP53, TP63, TRIM6, USP48, DNMT11016Cellular Development, Organismal Development, Embryonic Development
3ADAMTS3, ASPM, BIRC5, CCNB, CD44, DLGAP5 FOXM1, FOX01, HMMR, JAG1, JAK1, JUN, KIF18A, KLK6, LRP6, MAPK14, MITF, MYC, NCAPG, OSM, PBX1, PDX1, PGR, RBPJ, SERPINA3, SLC2A2, SPC25, TCF7L2, TFP1, TGFB1, TNC, TSPAN8, TXNIP, VEGA, EHF1016Cancer, Cellular Growth and Proliferation Cellular Development
4BID, CCL28, CCND2, CPT1A, CRCP, DSG2, HCAR3, ICAM1, IKBKE, IL18, ITGAV, JUN, MMD, MORF4L1, NAUK1, OAS1, PDPN, RRM2, TAP1, TGFB1, TGFBR2, TNF, VCAM1, VCL, WISP1, ZNF365913Cell-To-Cell Signaling and Interaction, Hematological System Development and Function Inflammatory Response
5ACTN4, ATF3, CCL2, CD40, CD80, CDC6, CDK6, CDKN2A, COL17A1, CXCL8, CXCL9, DST, E2F1, ESR2, FOS, HDAC3, IL13, 1L15, IL37, IL6, ITGA6, ITGB4, mir-181, NCOR2, NFKB1, NFKB1A, RAC1, RBI, RELA, SOD2, SP1 TERT, TLR9, TNSFL2, 814Cancer, Cell Death and Survival Hematological Disease
The genes found to be differentially expressed in our experiments (comparing cases and controls) and the number of such genes displayed in the ‘‘Focus Molecules’’ column have been highlighted in bold print and meet the criteria cutoff and/or filter criteria (IPA Core Analysis) and were mapped along with their corresponding genes derived from IPA Knowledge base (Normal = Upregulated; Italicized = Downregulated). The score is generated using a p-value (< 0.05). This score indicates the likelihood that the assembly of a set of focus genes in a network could be explained by random chance alone. The data base attributed general cellular functions to each network, which are determined by interrogating the Ingenuity Pathway Knowledge base for relationships between the genes in the network and the cellular functions they impact.
Table 3. Differential expression of genes of interest through relative quantification (ΔΔCt) that were selected for high-throughput TaqMan Low Density Array (TLDA) card design and their corresponding Probe sets in a small validation study of patients (n = 15) with Type 2 diabetes in Pakistan, relative to corresponding matched controls.
Gene Name (Probe Sets)Descriptions/FunctionsGene Regulation% Change in Studied Subjects * (Number)Average Relative Quantification **
Metabolic Disease and Disorder
LEPR (Hs00174492_m1)Leptin receptor (Obesity)Down7% (n = 1)−0.35
Up93% (n = 14)+0.66
RRAD (Hs00188163_m1)Ras-related associated with diabetesDown29% (n = 4)−0.36+ 0.66
Up71% (n = 11)
ARNT (Hs01121918_m1)Encodes a protein that binds to ligand-bound aryl hydrocarbon receptor, involved in xenobiotic metabolismDown20% (n = 3)−0.25
Up80% (n = 12)+0.44
Neurobehavioral
CYP2D6 (Hs02576168_m1)A member of Cytochrome P450 superfamily enzymeDown20% (n = 3)−0.27
Up80% (n = 12)+0.52
APOC1 (Hs03037377_m1)Apolipoprotein C1 Family; plays central role in HDL and VLDL metabolismUp100% (n = 15)+1.13
APOC2(Hs000173442_m1)Apolipoprotein C2 family that encodes a lipid-binding protein belonging to the apolipoprotein gene family, dysfunction or mutation results into hyperlipoproteinemia type IB, characterized by hypertriglyceridemia, xanthomas, and increased risk of pancreatitis and early atherosclerosis.Up87% (n = 13)+2.54
ND13% (n = 2)_
CYP1B1(Hs00164385_m1)Cytochrome P450 family 1 subfamily B member 1, which catalyzes many reactions involved in drug metabolism and synthesis of cholesterol, steroids, and other lipids.Up100% (n = 15)+1.12
SLC2A13(Hs00369423_m1)Solute carrier family 2 member 13, a member of mitochondrial carrier familyUp100% (n = 15)+0.71
SLC33A1(Hs00270469_m1)Solute carrier family 33 member 1, required for the formation of O-acetylated (Ac) Gangliosides, disorder characterized by congenital cataracts, severe psychomotor retardation, and hearing lossUp100% (n = 15)+0.74
Cancer
MYC (Hs00153408_m1)Proto-oncogene, cell cycle progression, apoptosis.Down47% (n = 7)−0.11
Up47% (n = 7)+0.54
ND6% (n = 1)-
TP53 (Hs01034249_m1)Tumor suppressor protein p53Down73% (n = 11)−0.27
Up27% (n = 4)+0.84
** Data represented as ΔΔCt changes (relative quantification) with downregulation (−)/upregulation (+). *Number (n) in parenthesis is the total number of subjects where such changes were observed. % calculation (in parenthesis) was made only among the subjects with amplification under this validation platform. 18s (Hs99999901_s1; manufacturing control), and GAPDH (Hs99999905_m1; Internal control). ND—Not Detected.

