Using Deep Learning with Convolutional Neural Network Approach to Identify the Invasion Depth of Endometrial Cancer in Myometrium Using MR Images: A Pilot Study


Abstract
:1. Introduction
2. Materials and Methods
2.1. Study Population
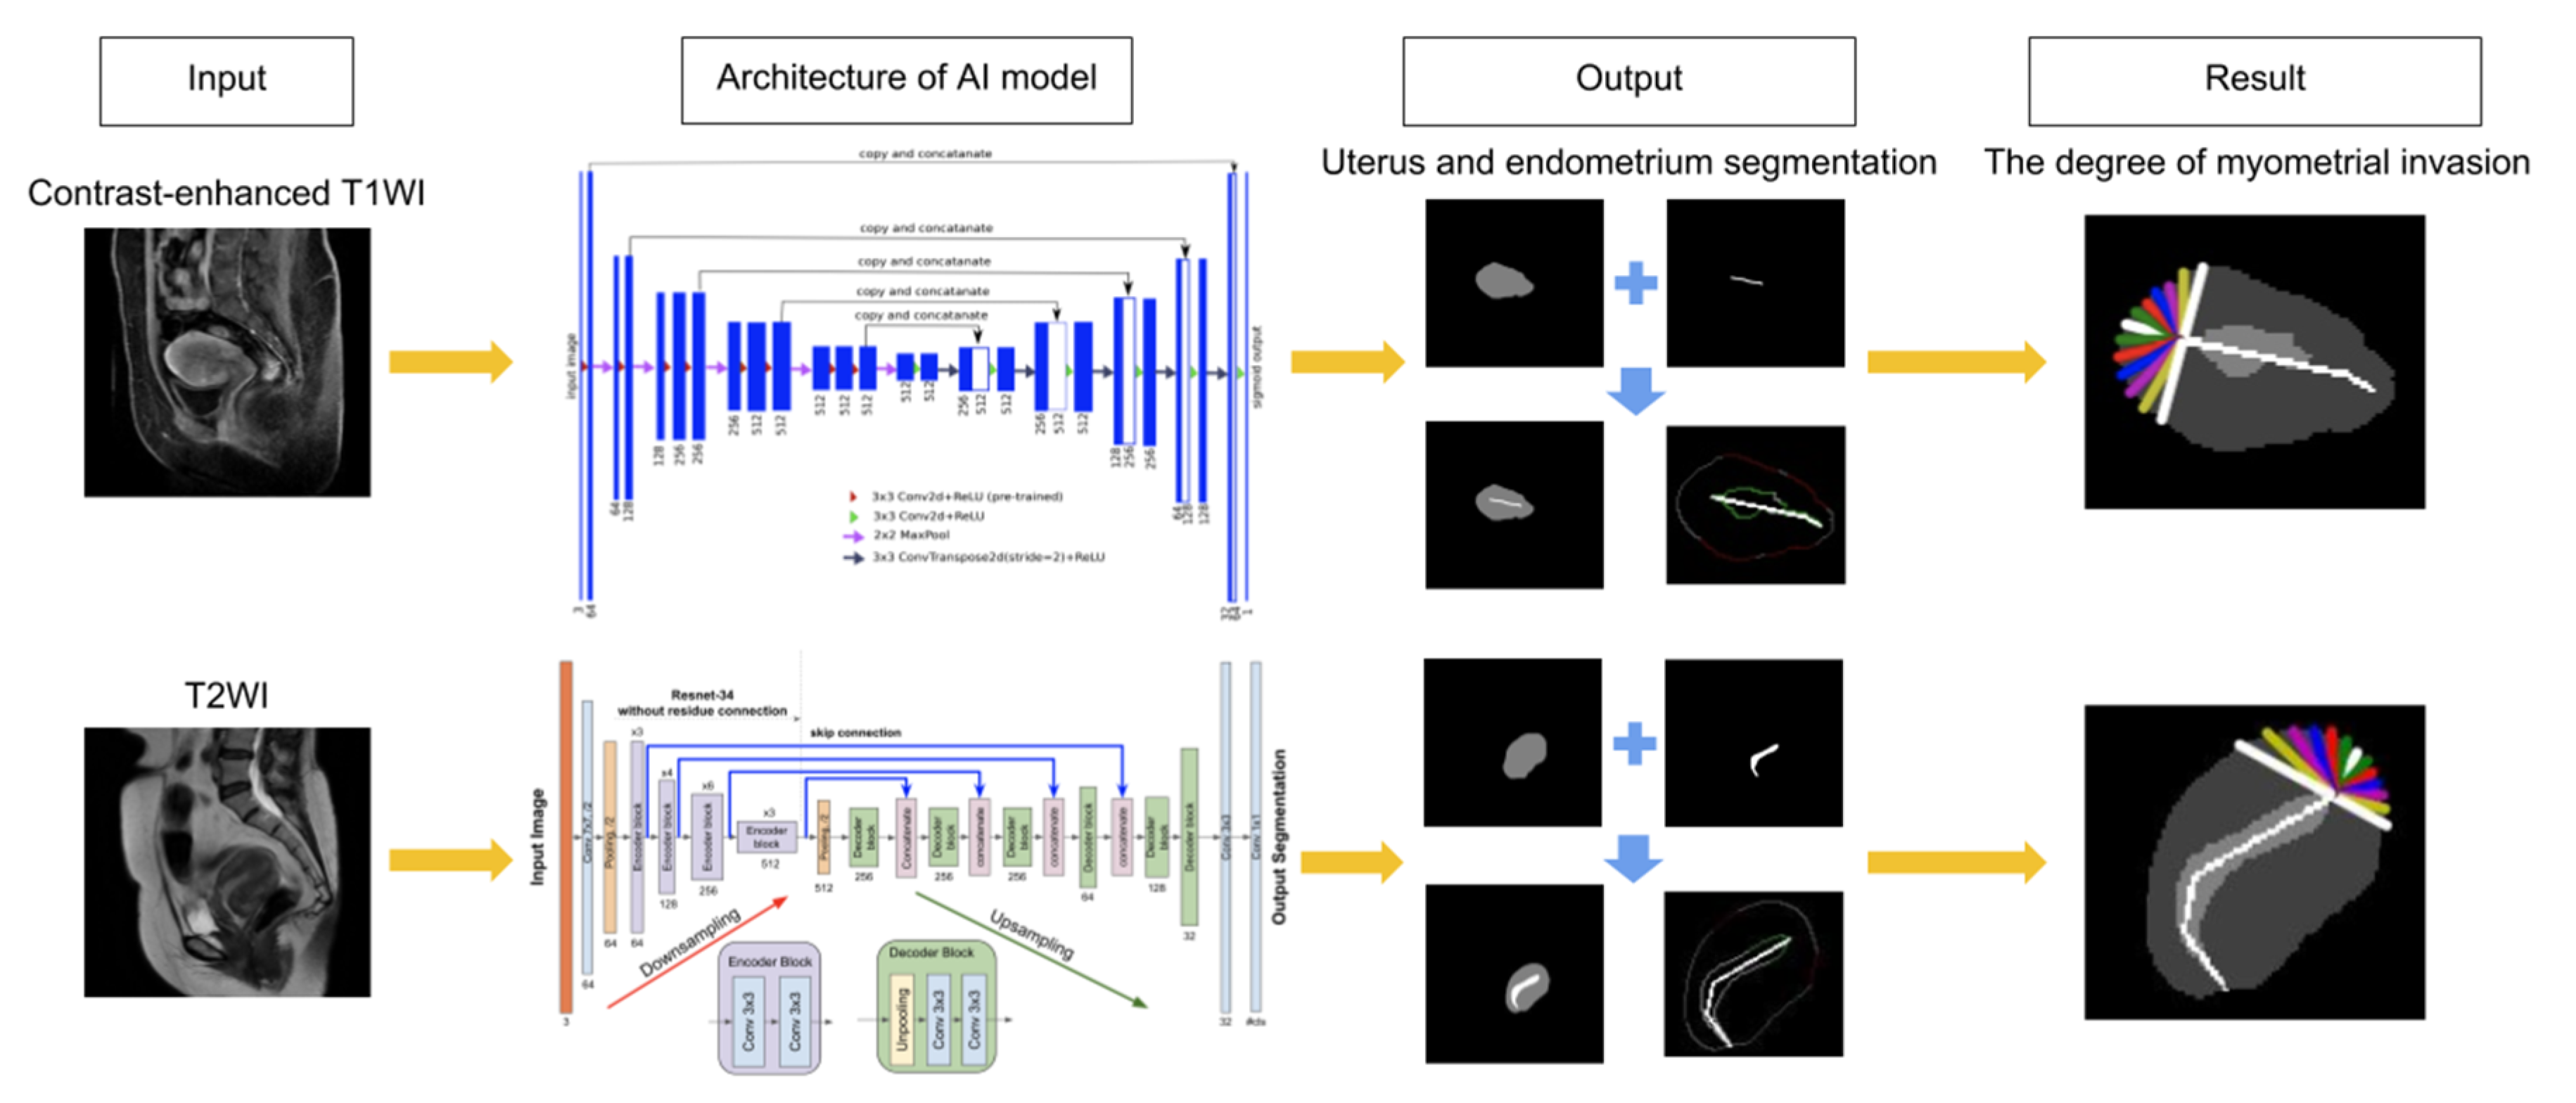
2.2. Artificial Intelligence Systems Selection
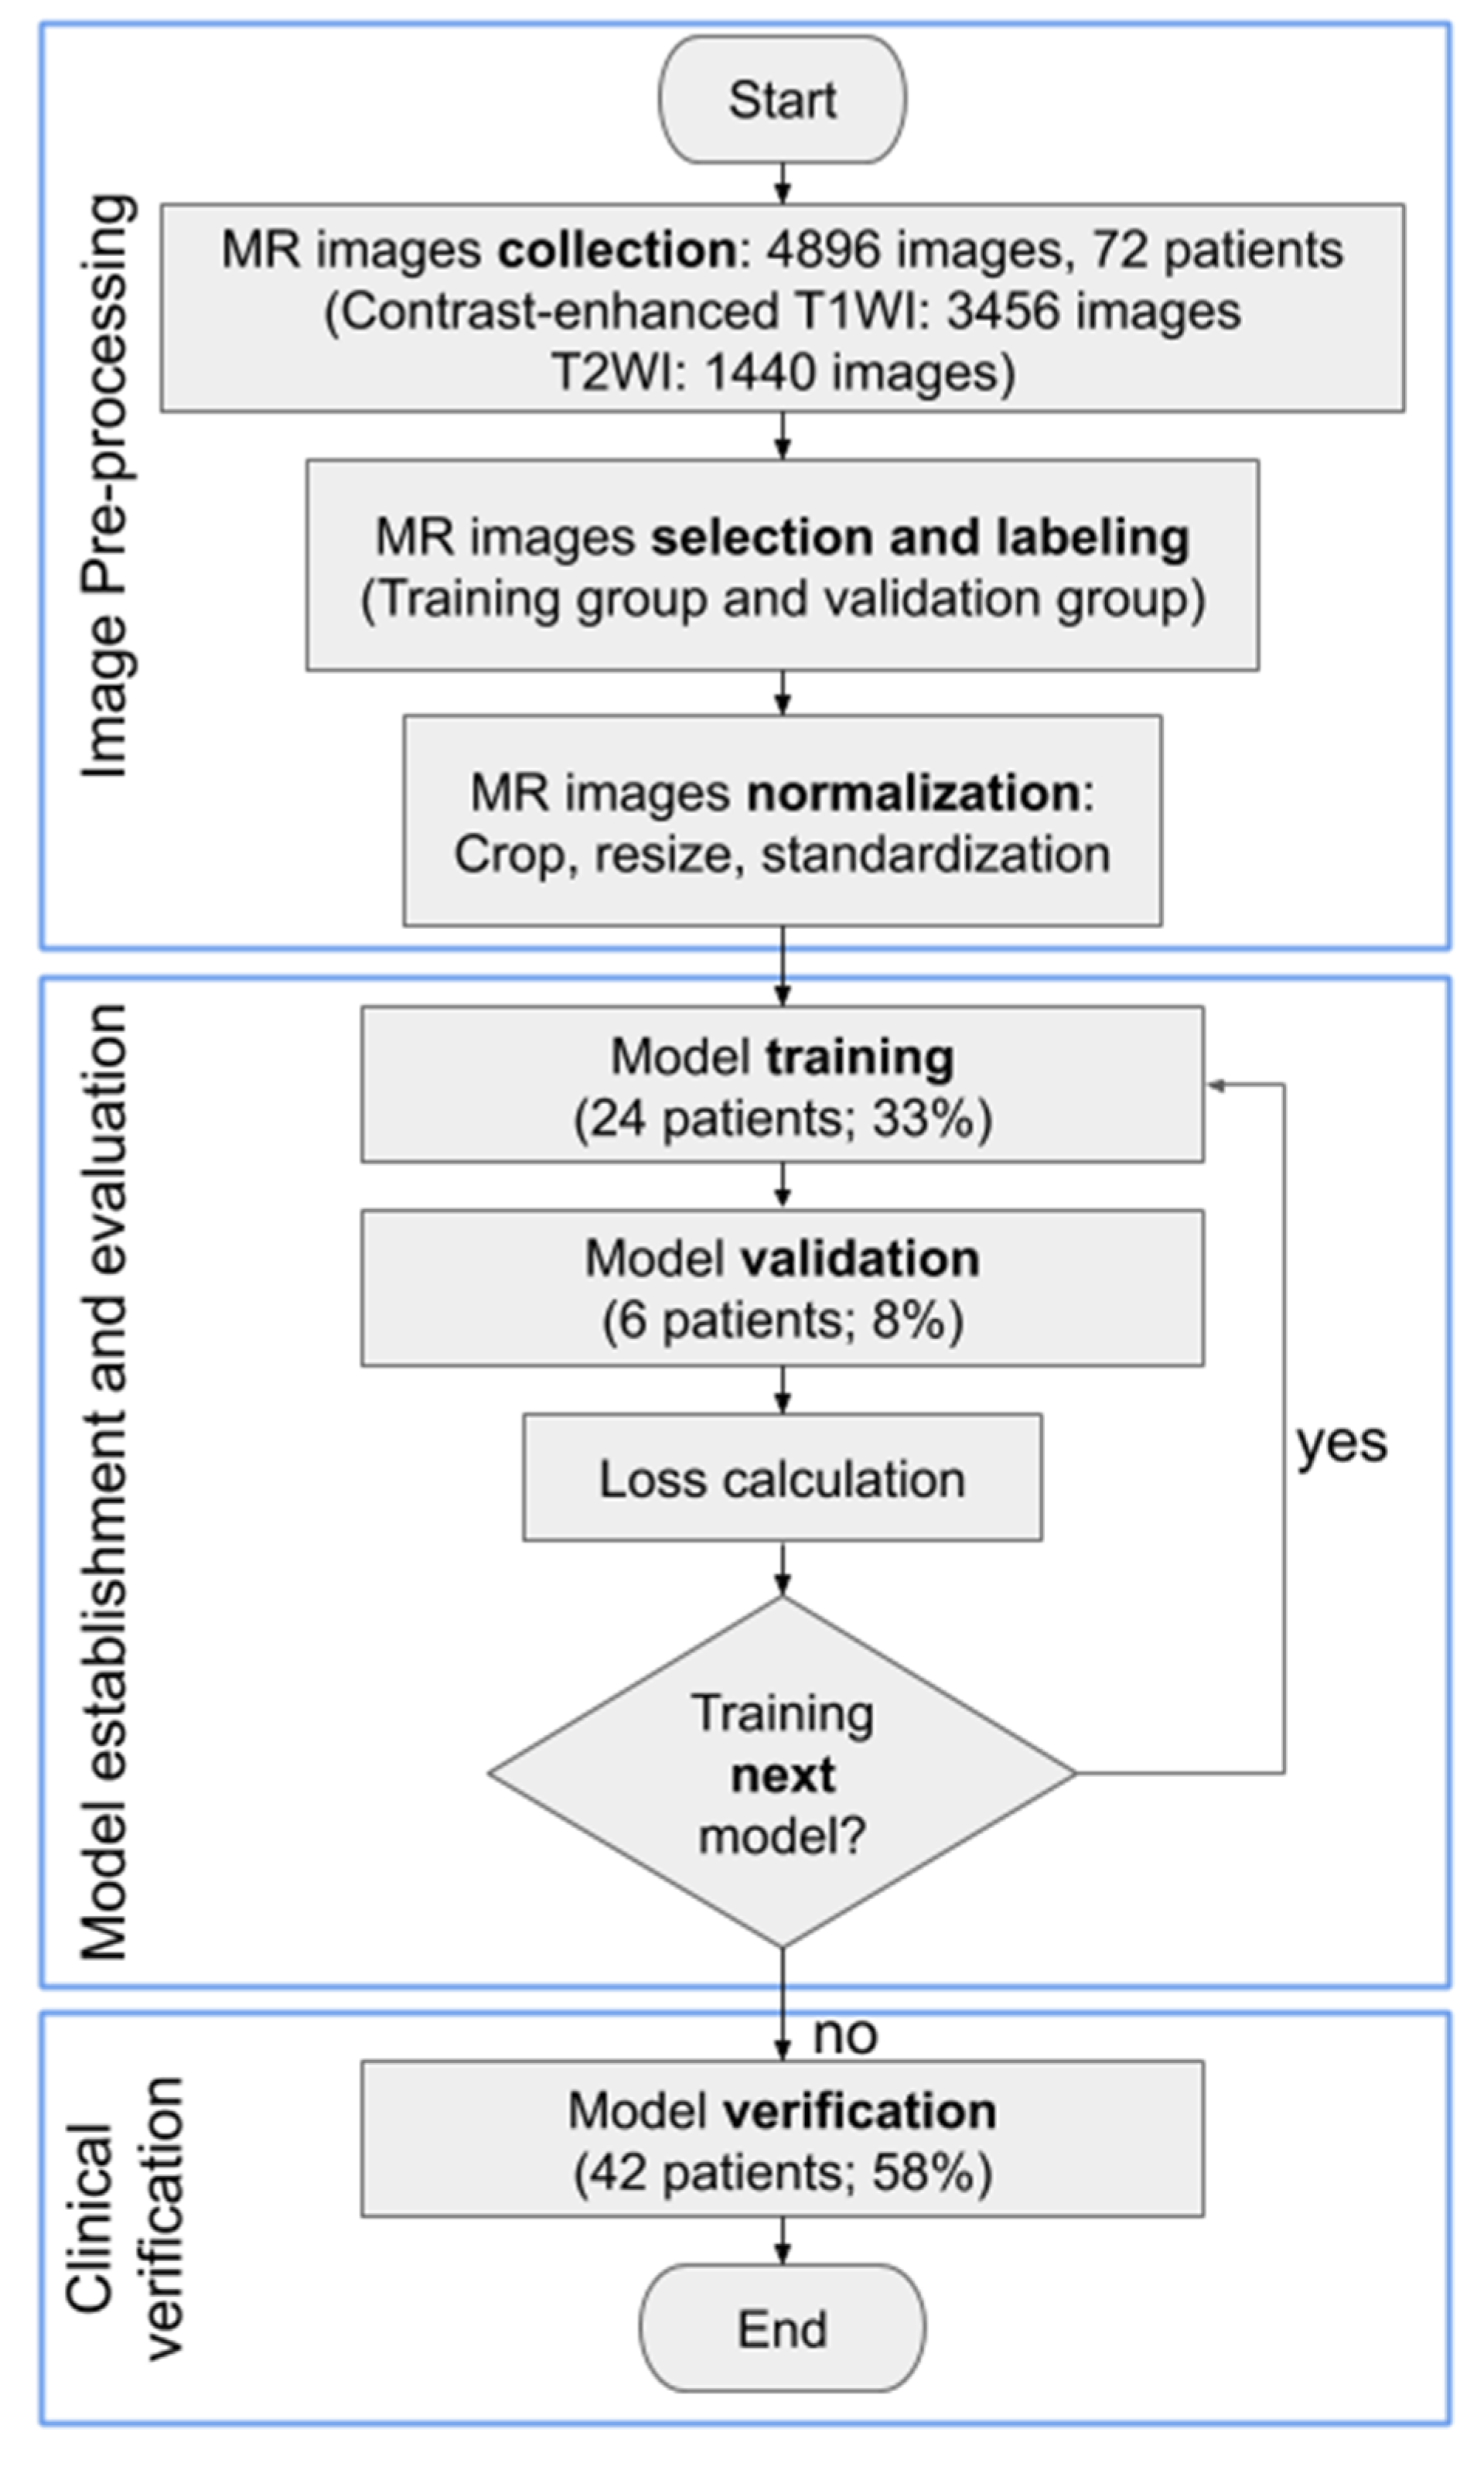
2.3. Images Processing and Analysis
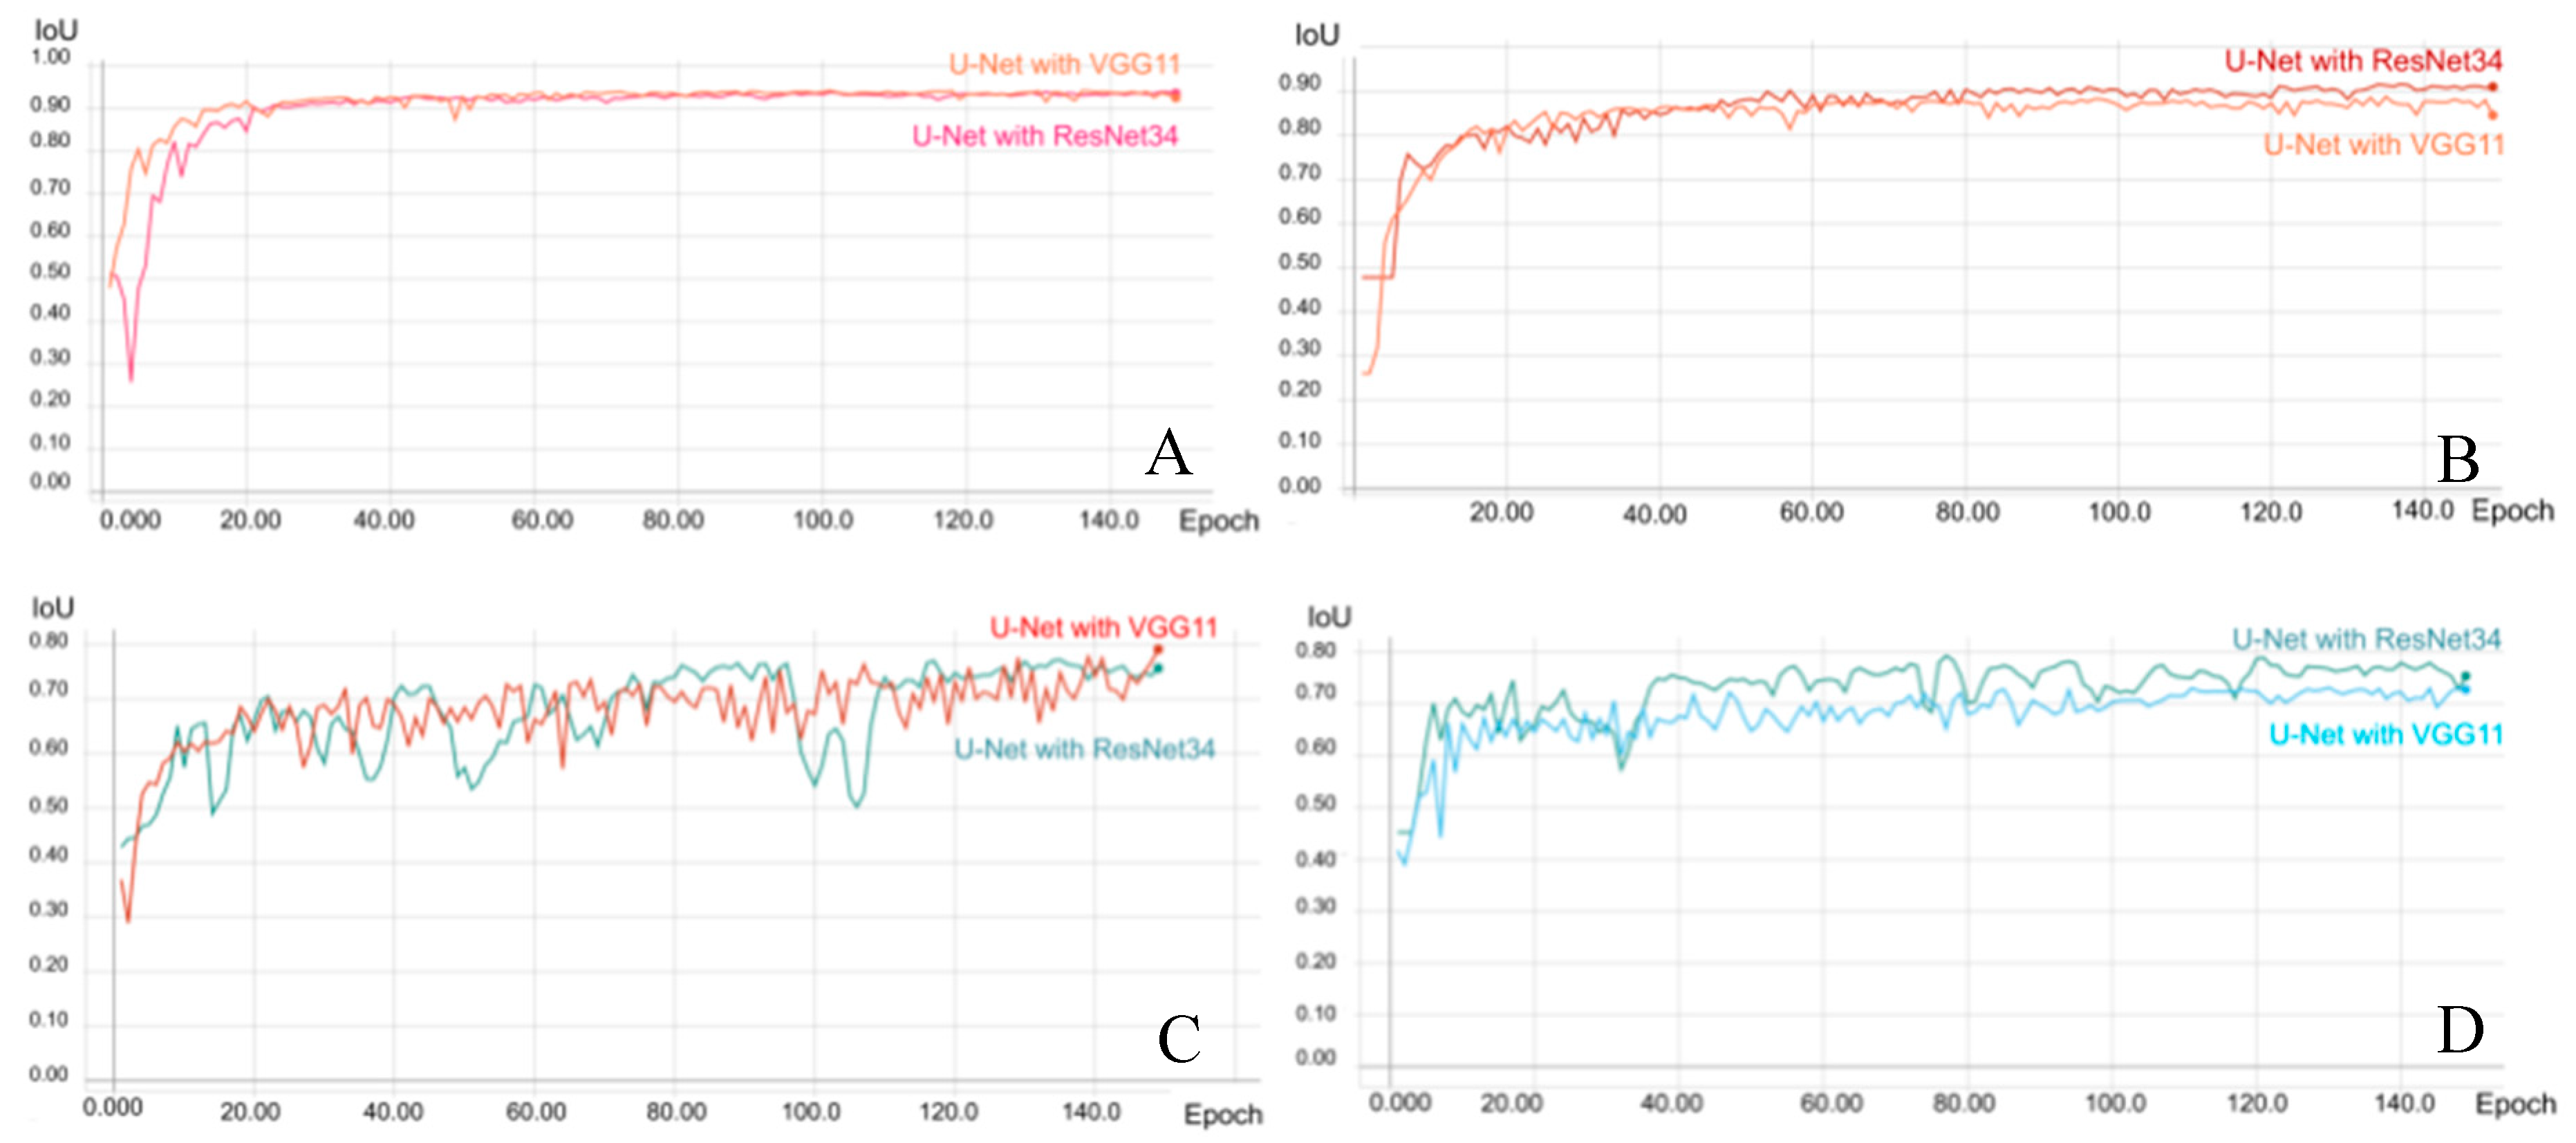
2.4. Establishing AI Models
2.5. Statistical Analysis
2.6. Ethical Approval
3. Results
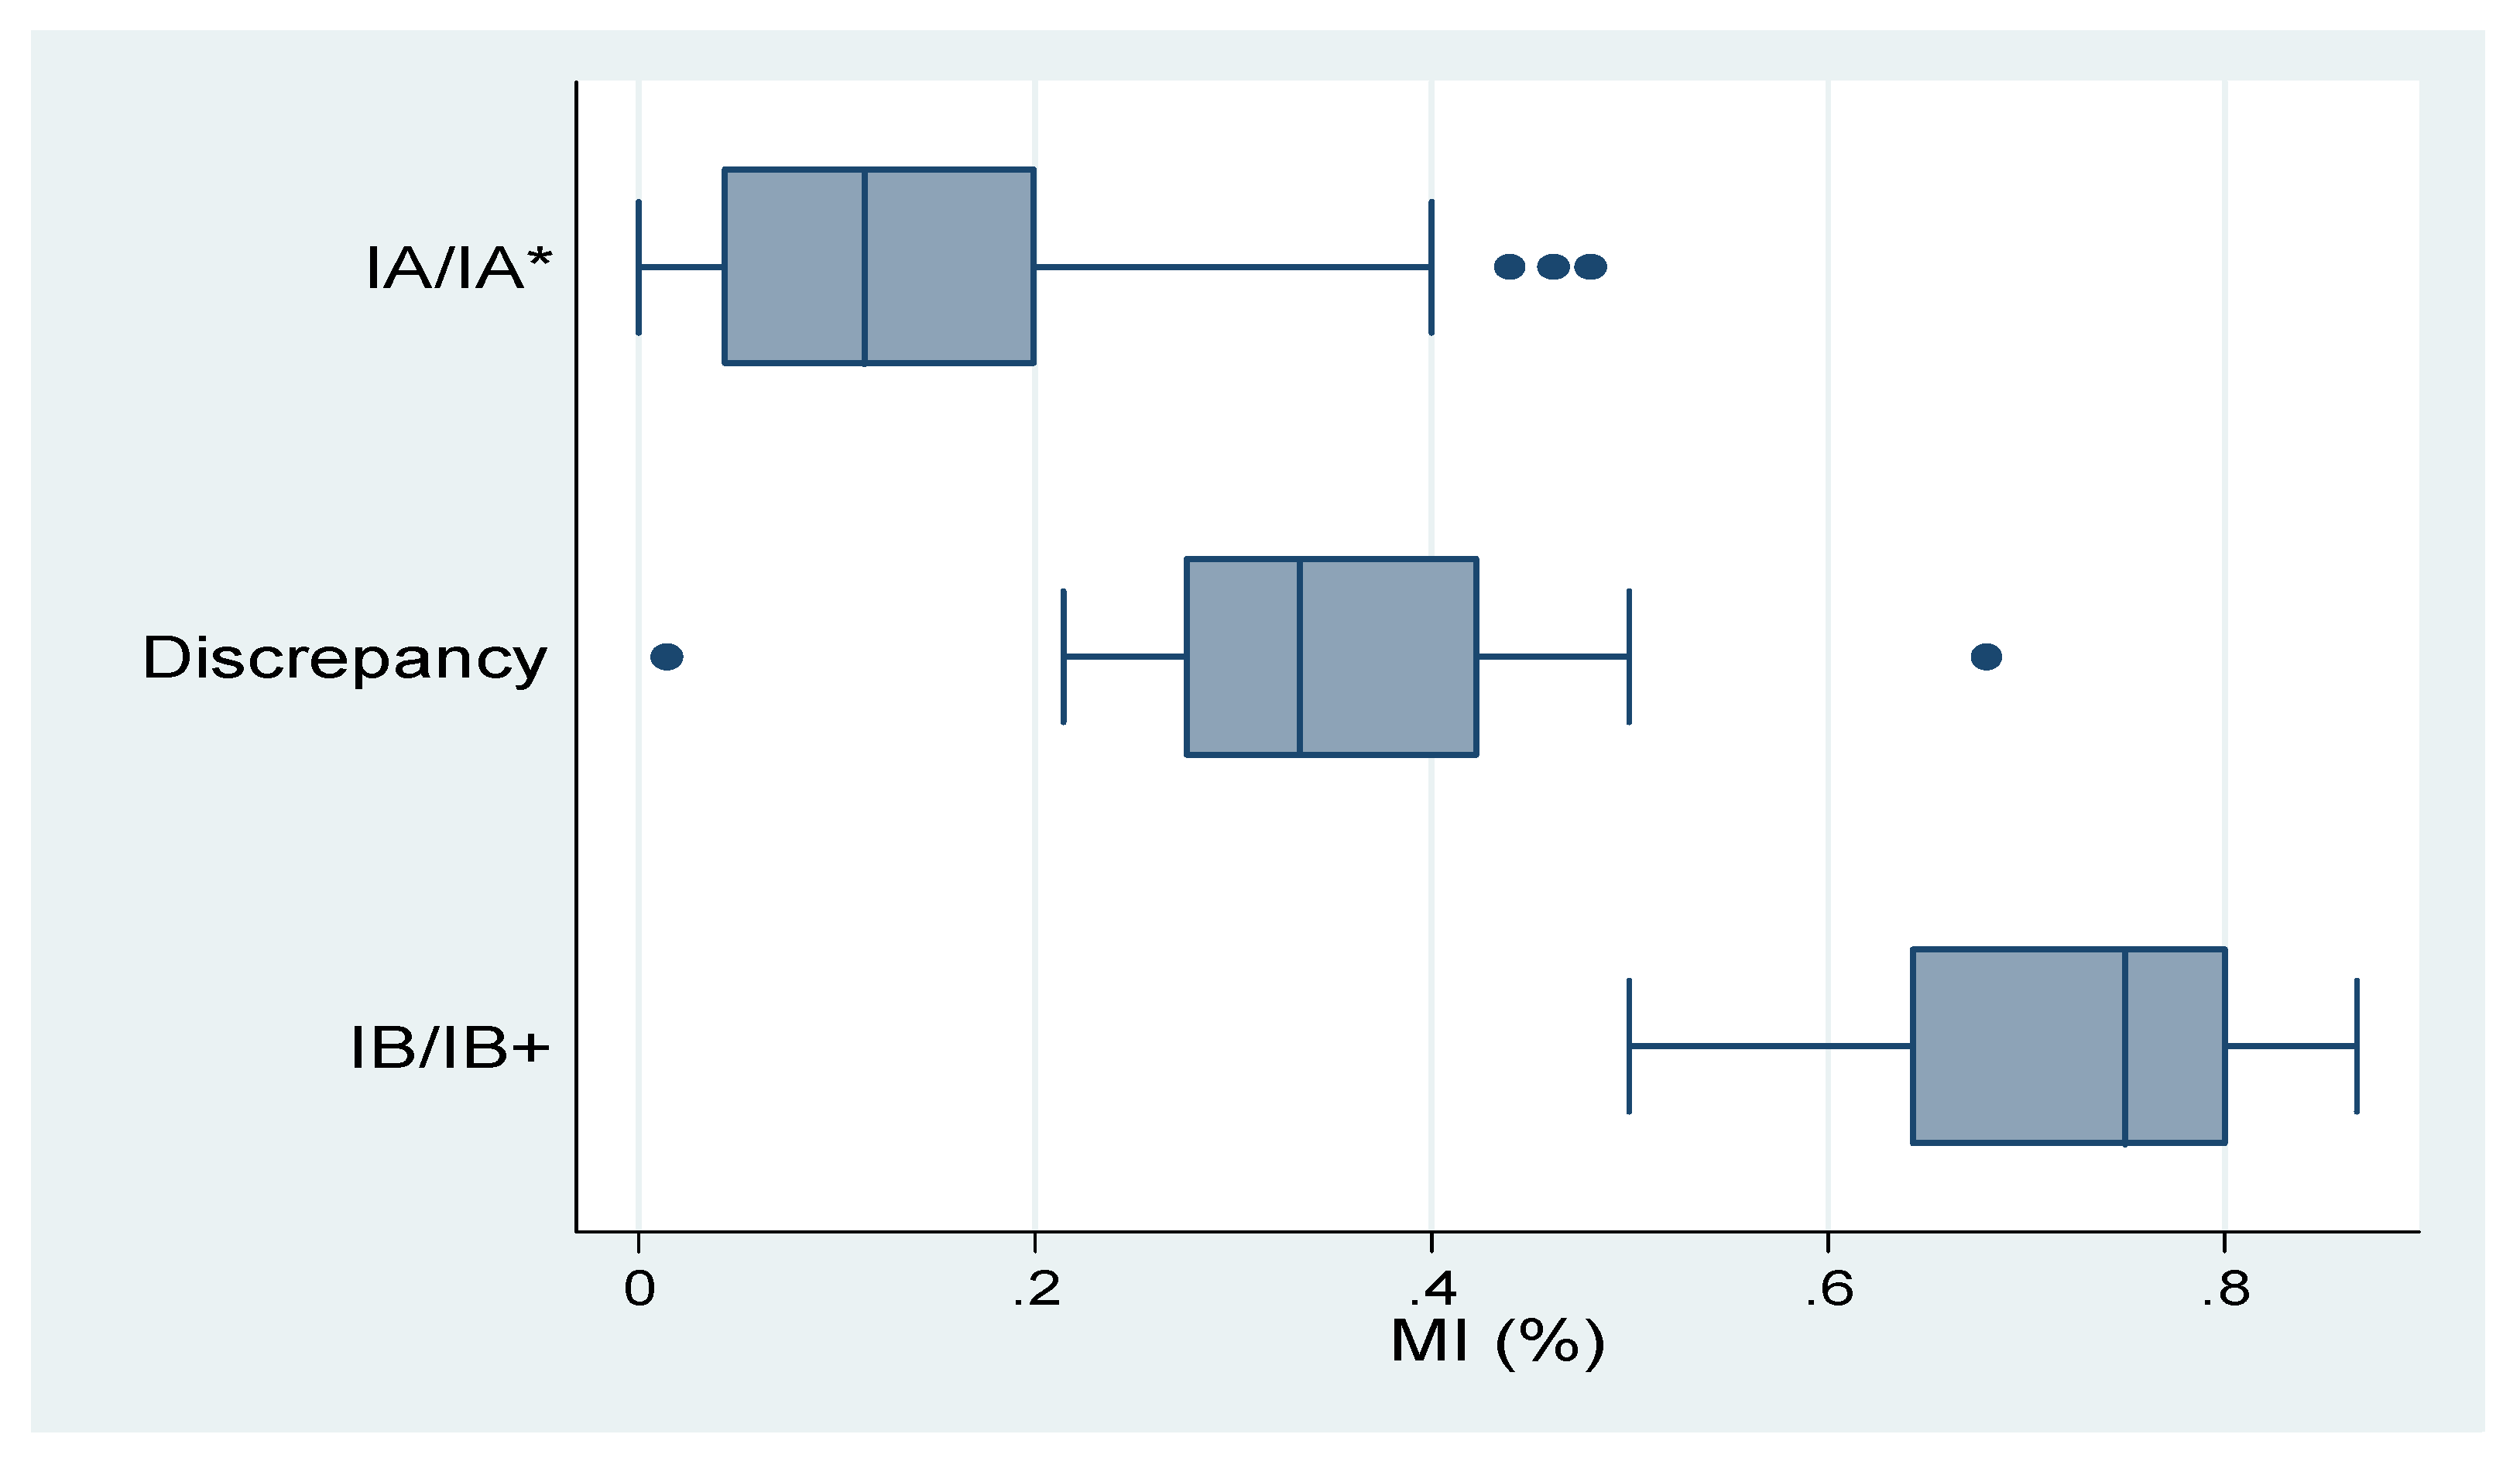
3.1. Verification of the Final Model
3.2. Effects of Concomitant Conditions on MR Image Interpretation
4. Discussion
5. Conclusions
Author Contributions
Funding
Acknowledgments
Conflicts of Interest
Appendix A


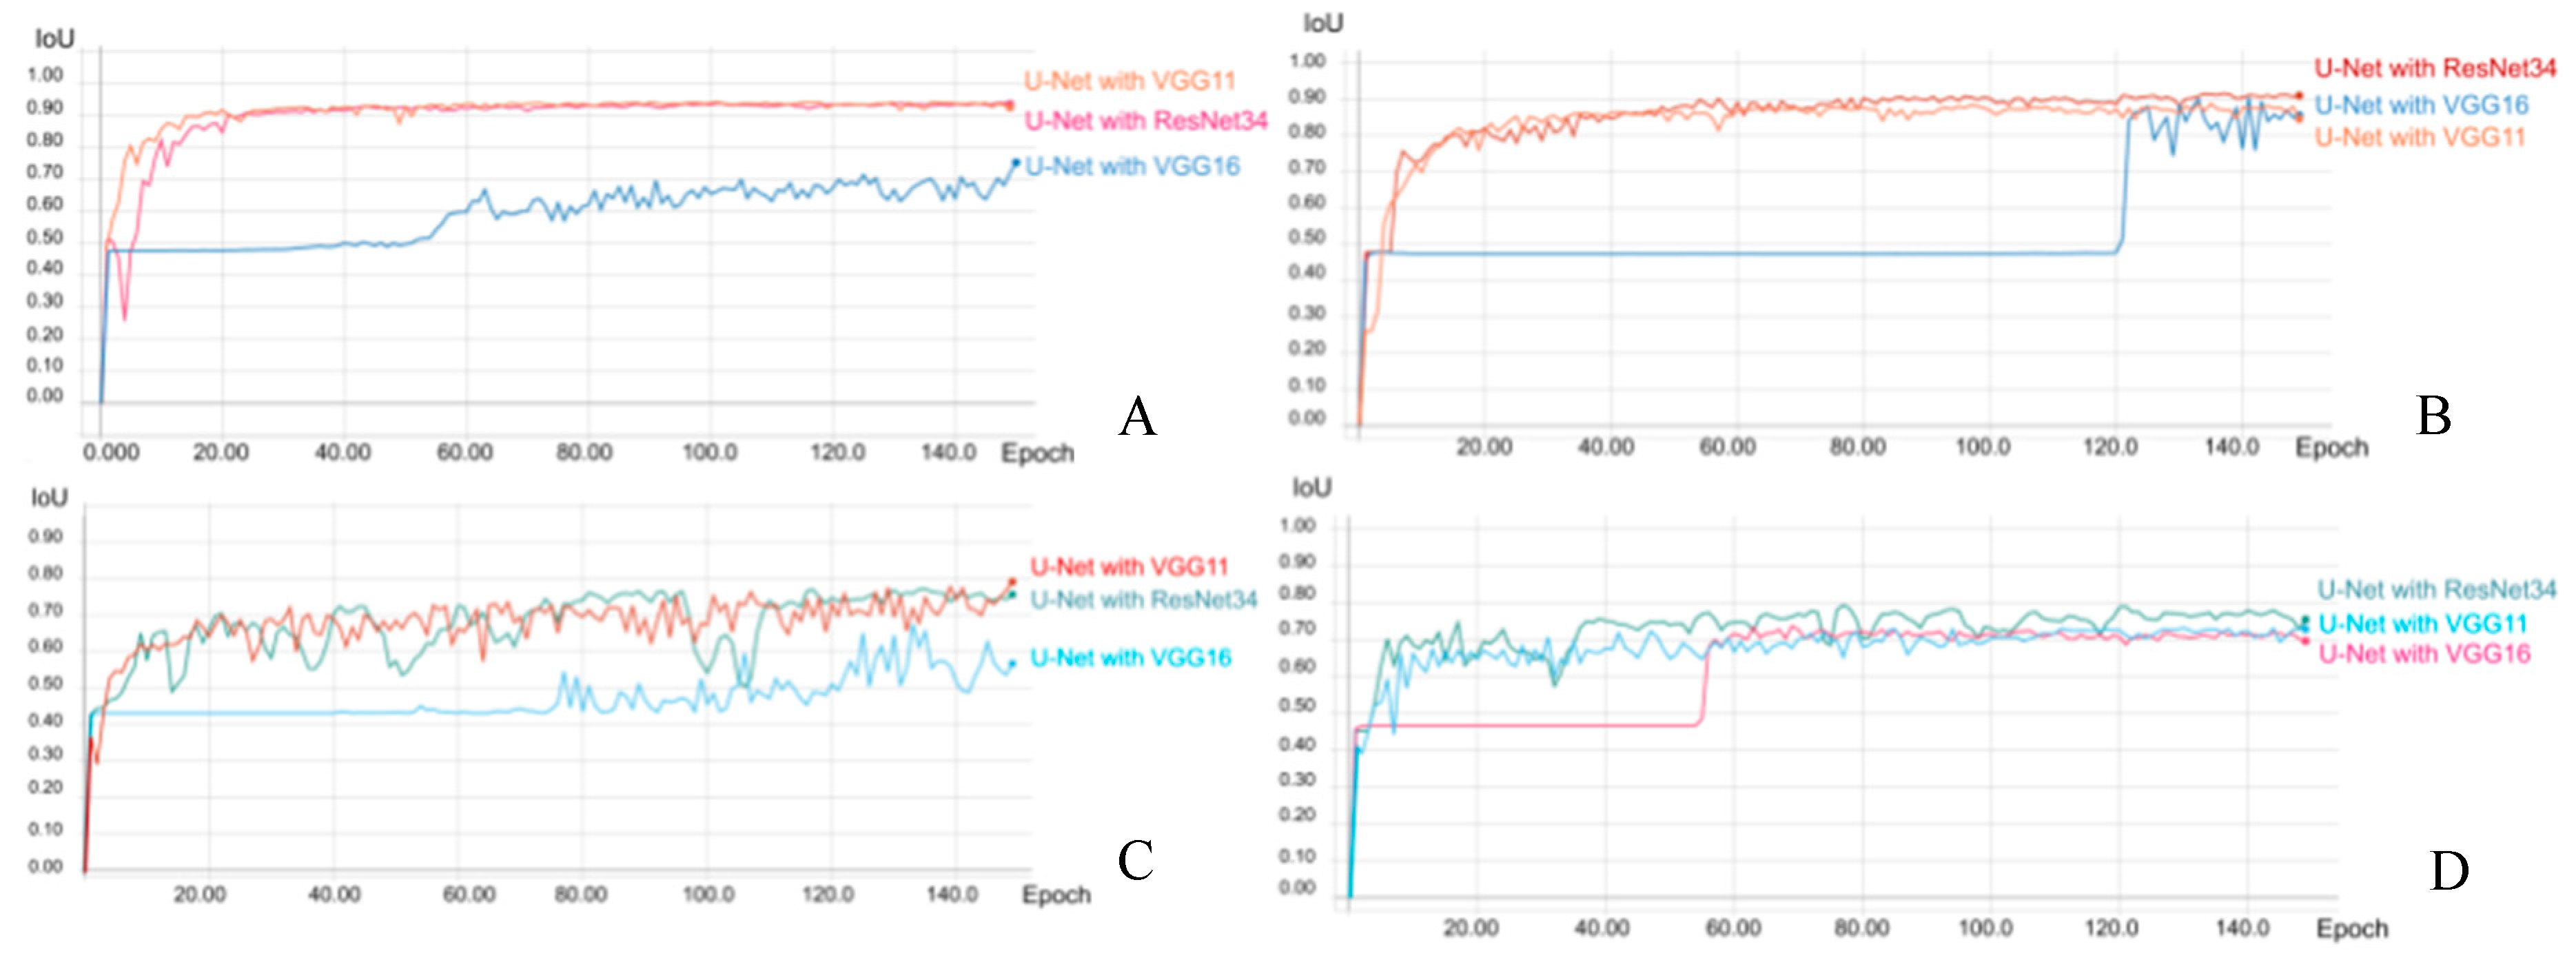
| U-Net with VGG 11 | U-Net with VGG 16 | U-Net with ResNet34 | |
|---|---|---|---|
| Accuracy (Uterus) | 96.83% | 76.83% | 97.06% |
| Accuracy (Endometrium) | 85.96% | 73.13% | 84.31% |
| Mean loU (Uterus) | 94.20% | 75.30% | 93.92% |
| Mean loU (Endometrium) | 79.16% | 67.54% | 77.23% |
| Mean Dice (Uterus) | 96.94% | 84.01% | 96.78% |
| Mean Dice (Endometrium) | 87.62% | 78.22% | 86.24% |
| Mean Precision (Uterus) | 97.05% | 97.44% | 96.51% |
| Mean Precision (Endometrium) | 89.54% | 88.86% | 88.53% |
| Mean Recall (Uterus) | 96.83% | 76.83% | 97.06% |
| Mean Recall (Endometrium) | 85.96% | 73.13% | 84.31% |
| Mean Specificity (Uterus) | 96.83% | 76.83% | 97.06% |
| Mean Specificity (Endometrium) | 85.96% | 73.13% | 84.31% |
| U-Net with VGG 11 | U-Net with VGG 16 | U-Net with ResNet34 | |
|---|---|---|---|
| Accuracy (Uterus) | 95.80% | 95.49% | 96.86% |
| Accuracy (Endometrium) | 83.60% | 82.88% | 87.34% |
| Mean loU (Uterus) | 88.78% | 90.61% | 91.66% |
| Mean loU (Endometrium) | 73.18% | 73.63% | 79.31% |
| Mean Dice (Uterus) | 93.75% | 94.88% | 95.49% |
| Mean Dice (Endometrium) | 82.60% | 82.95% | 87.56% |
| Mean Precision (Uterus) | 91.90% | 94.28% | 94.20% |
| Mean Precision (Endometrium) | 81.67% | 83.02% | 87.78% |
| Mean Recall (Uterus) | 95.80% | 95.50% | 96.86% |
| Mean Recall (Endometrium) | 83.60% | 82.88% | 87.34% |
| Mean Specificity (Uterus) | 95.80% | 95.49% | 96.86% |
| Mean Specificity (Endometrium) | 83.60% | 82.88% | 87.34% |
| Contrast-Enhanced T1w | T2w | |
|---|---|---|
| Type | Uterus / Endometrium | |
| Architecture | U-Net with VGG 11 | U-Net with ResNet34 |
| Optimizer | Adam | |
| Learning Rate | 1e-4 | |
| Batch size | 16 | |
| Total number of epochs run during training | 150 | |
| Epochs with the maximum value of loU (best model) | 89/95 | 137/77 |
| Mean loU of validation of Uterus/Endometrium (best model) | 92.64%/80.40% | 91.66%/79.31% |
| Loss Weight | Batch Size | Loss | Learning Rate | Architecture (U-Net with #) | Data | Augmentation | Best Epoch | Mean IoU (%) | IoU 0 (%) | IoU 1 (%) | Mean Dice (%) | Dice 0 (%) | Dice 1 (%) |
|---|---|---|---|---|---|---|---|---|---|---|---|---|---|
| 10 | 16 | dice | 0.0001 | VGG11 | T1WI | TRUE | 101 | 94.20 | 99.45 | 88.95 | 96.94 | 99.73 | 94.15 |
| 10 | 16 | Cross Entropy | 0.0001 | VGG11 | T1WI | TRUE | 98 | 94.10 | 99.44 | 88.76 | 96.88 | 99.72 | 94.04 |
| 10 | 16 | dice | 0.0001 | VGG16 | T1WI | TRUE | 150 | 75.30 | 97.70 | 52.89 | 84.01 | 98.83 | 69.19 |
| 10 | 16 | dice | 0.0001 | ResNet34 | T1WI | TRUE | 131 | 93.92 | 99.42 | 88.42 | 96.78 | 99.71 | 93.86 |
| 10 | 16 | dice | 0.0001 | ResNet34 | T1WI | FALSE | 133 | 92.06 | 99.24 | 84.87 | 95.72 | 99.62 | 91.82 |
| 10 | 32 | dice | 0.0001 | ResNet34 | T1WI | FALSE | 115 | 91.62 | 99.18 | 84.06 | 95.46 | 99.59 | 91.34 |
| 10 | 32 | dice | 0.0001 | ResNet34 | T1WI | TRUE | 140 | 93.66 | 99.40 | 87.93 | 96.64 | 99.70 | 93.57 |
| 10 | 32 | Cross Entropy | 0.0001 | ResNet34 | T1WI | TRUE | 104 | 91.17 | 99.26 | 83.08 | 95.19 | 99.63 | 90.76 |
| Loss Weight | Batch Size | Loss | Learning Rate | Architecture (U-Net with #) | Data | Augmentation | Best Epoch | Mean IoU (%) | IoU 0 (%) | IoU 1 (%) | Mean Dice (%) | Dice 0 (%) | Dice 1 (%) |
|---|---|---|---|---|---|---|---|---|---|---|---|---|---|
| 10 | 16 | dice | 0.0001 | VGG11 | T1WI | TRUE | 149 | 79.16 | 93.74 | 64.59 | 87.62 | 96.77 | 78.48 |
| 10 | 16 | dice | 0.0001 | VGG11 | T1WI | FALSE | 32 | 73.53 | 91.86 | 55.19 | 83.44 | 95.75 | 71.13 |
| 10 | 16 | dice | 0.0001 | VGG16 | T1WI | TRUE | 133 | 67.54 | 91.07 | 44.01 | 78.22 | 95.33 | 61.12 |
| 10 | 16 | dice | 0.0001 | VGG16 | T1WI | FALSE | 4 | 47.37 | 94.73 | 0.00 | 48.65 | 97.29 | 0.00 |
| 10 | 16 | dice | 0.0001 | ResNet34 | T1WI | FALSE | 113 | 75.38 | 92.34 | 58.42 | 84.89 | 96.02 | 73.75 |
| 10 | 16 | dice | 0.0001 | ResNet34 | T1WI | TRUE | 72 | 79.59 | 93.82 | 65.36 | 87.93 | 96.81 | 79.05 |
| 10 | 32 | dice | 0.0001 | ResNet34 | T1WI | TRUE | 135 | 77.23 | 93.13 | 61.33 | 86.24 | 96.44 | 76.03 |
| 10 | 32 | dice | 0.0001 | ResNet34 | T1WI | FALSE | 85 | 75.93 | 97.12 | 54.75 | 84.65 | 98.54 | 70.76 |
| Loss Weight | Batch Size | Loss | Learning Rate | Architecture (U-Net with #) | Data | Augmentation | Best Epoch | Mean IoU (%) | IoU 0 (%) | IoU 1 (%) | Mean Dice (%) | Dice 0 (%) | Dice 1 (%) |
|---|---|---|---|---|---|---|---|---|---|---|---|---|---|
| 10 | 16 | dice | 0.0001 | VGG11 | T2WI | TRUE | 135 | 88.78 | 98.92 | 78.64 | 93.75 | 99.46 | 88.04 |
| 10 | 16 | dice | 0.0001 | VGG11 | T2WI | FALSE | 59 | 85.59 | 98.55 | 72.64 | 91.71 | 99.27 | 84.15 |
| 10 | 16 | dice | 0.0001 | VGG16 | T2WI | TRUE | 141 | 90.61 | 98.92 | 82.30 | 94.88 | 99.46 | 90.29 |
| 10 | 16 | dice | 0.0001 | VGG16 | T2WI | FALSE | 115 | 87.56 | 98.70 | 76.41 | 92.99 | 99.34 | 86.63 |
| 10 | 16 | dice | 0.0001 | ResNet34 | T2WI | FALSE | 148 | 85.73 | 98.52 | 72.94 | 91.80 | 99.25 | 84.35 |
| 10 | 16 | dice | 0.0001 | ResNet34 | T2WI | TRUE | 137 | 91.66 | 99.19 | 84.14 | 95.49 | 99.59 | 91.38 |
| 10 | 32 | dice | 0.0001 | ResNet34 | T2WI | FALSE | 149 | 78.67 | 97.53 | 59.82 | 86.80 | 98.75 | 74.86 |
| 10 | 32 | dice | 0.0001 | ResNet34 | T2WI | TRUE | 124 | 89.25 | 98.92 | 79.58 | 94.04 | 99.46 | 88.63 |
| 5 | 64 | dice | 0.00005 | ResNet34 | T2WI | TRUE | 148 | 83.45 | 98.16 | 68.73 | 90.27 | 99.07 | 81.46 |
| 5 | 64 | dice | 0.0001 | ResNet34 | T2WI | TRUE | 143 | 88.84 | 98.88 | 78.80 | 93.79 | 99.43 | 88.14 |
| 5 | 64 | dice | 0.0002 | ResNet34 | T2WI | TRUE | 136 | 90.90 | 99.12 | 82.68 | 95.04 | 99.56 | 90.52 |
| 10 | 64 | dice | 0.00005 | ResNet34 | T2WI | TRUE | 148 | 82.10 | 98.00 | 66.21 | 89.33 | 98.99 | 79.67 |
| 10 | 64 | dice | 0.0001 | ResNet34 | T2WI | TRUE | 141 | 87.93 | 98.77 | 77.10 | 93.22 | 99.38 | 87.07 |
| 10 | 64 | dice | 0.0002 | ResNet34 | T2WI | TRUE | 127 | 90.30 | 99.02 | 81.58 | 94.68 | 99.51 | 89.85 |
| 20 | 64 | dice | 0.00005 | ResNet34 | T2WI | TRUE | 133 | 86.37 | 98.62 | 74.13 | 92.22 | 99.31 | 85.14 |
| 20 | 64 | dice | 0.0001 | ResNet34 | T2WI | TRUE | 132 | 89.42 | 98.96 | 79.87 | 94.14 | 99.48 | 88.81 |
| 20 | 64 | dice | 0.0002 | ResNet34 | T2WI | TRUE | 135 | 91.33 | 99.16 | 83.49 | 95.29 | 99.58 | 91.00 |
| 10 | 16 | Cross Entropy | 0.0001 | ResNet34 | T2WI | TRUE | 134 | 91.50 | 99.19 | 83.80 | 95.39 | 99.59 | 91.19 |
| 10 | 72 | Cross Entropy | 0.0001 | ResNet34 | T2WI | TRUE | 124 | 88.57 | 98.85 | 78.29 | 93.62 | 99.42 | 87.82 |
| 10 | 72 | Cross Entropy | 0.0002 | ResNet34 | T2WI | TRUE | 131 | 90.22 | 99.03 | 81.40 | 94.63 | 99.51 | 89.74 |
| 10 | 72 | Cross Entropy | 0.0004 | ResNet34 | T2WI | TRUE | 80 | 90.07 | 99.04 | 81.11 | 94.54 | 99.52 | 89.57 |
| Loss Weight | Batch Size | Loss | Learning Rate | Architecture (U-Net with #) | Data | Augmentation | Best Epoch | Mean IoU (%) | IoU 0 (%) | IoU 1 (%) | Mean Dice (%) | Dice 0 (%) | Dice 1 (%) |
|---|---|---|---|---|---|---|---|---|---|---|---|---|---|
| 10 | 16 | dice | 0.0001 | VGG11 | T2WI | FALSE | 18 | 77.88 | 94.63 | 61.12 | 86.56 | 97.24 | 75.87 |
| 10 | 16 | dice | 0.0001 | VGG11 | T2WI | TRUE | 43 | 79.07 | 95.23 | 62.90 | 87.39 | 97.56 | 77.23 |
| 10 | 16 | dice | 0.0001 | VGG16 | T2WI | FALSE | 69 | 73.63 | 95.56 | 51.70 | 82.95 | 97.73 | 68.16 |
| 10 | 16 | dice | 0.0001 | VGG16 | T2WI | TRUE | 3 | 46.67 | 93.33 | 0.00 | 48.28 | 96.55 | 0.00 |
| 10 | 16 | dice | 0.0001 | ResNet34 | T2WI | TRUE | 77 | 79.31 | 95.39 | 63.24 | 87.56 | 97.64 | 77.48 |
| 10 | 64 | dice | 0.00005 | ResNet34 | T2WI | TRUE | 136 | 77.87 | 95.17 | 60.57 | 86.48 | 97.52 | 75.44 |
| 20 | 64 | dice | 0.00005 | ResNet34 | T2WI | TRUE | 143 | 78.31 | 95.35 | 61.27 | 86.80 | 97.62 | 75.98 |
References
- American Cancer Society. Global Cancer Facts & Figures, 4th ed.; American Cancer Society: Atlanta, GA, USA, 2018. [Google Scholar]
- Lortet-Tieulent, J.; Ferlay, J.; Bray, F.; Jemal, A. International patterns and trends in endometrial cancer incidence, 1978–2013. J. Natl. Cancer Inst. 2018, 110, 354–361. [Google Scholar] [CrossRef]
- SGO Clinical Practice Endometrial Cancer Working Group; Burke, W.M.; Orr, J.; Leitao, M.; Salom, E.; Gehrig, P.; Olawaiye, A.B.; Brewer, M.; Boruta, D.; Herzog, T.J.; et al. Endometrial cancer: A review and current management strategies: Part I. Gynecol. Oncol. 2014, 134, 385–392. [Google Scholar] [CrossRef]
- SGO Clinical Practice Endometrial Cancer Working Group; Burke, W.M.; Orr, J.; Leitao, M.; Salom, E.; Gehrig, P.; Olawaiye, A.B.; Brewer, M.; Boruta, D.; Herzog, T.J.; et al. Endometrial cancer: A review and current management strategies: Part II. Gynecol. Oncol. 2014, 134, 393–402. [Google Scholar] [CrossRef]
- Colombo, N.; Creutzberg, C.L.; Amant, F.; Bosse, T.; González-Martín, A.; Ledermann, J.; Marth, C.; Nout, R.; Querleu, D.; Mirza, M.; et al. ESMO-ESGO-ESTRO consensus conference on endometrial cancer: Diagnosis, treatment and follow-up. Int. J. Gynecol. Cancer 2016, 26, 2–30. [Google Scholar] [CrossRef] [Green Version]
- Meissnitzer, M.; Forstner, R. MRI of endometrium cancer—How we do it. Meissnitzer Forstner Cancer Imaging 2016, 16, 11. [Google Scholar] [CrossRef] [Green Version]
- Larson, D.M.; Connor, G.P.; Broste, S.K.; Krawisz, B.R.; Johnson, K.K. Prognostic significance of gross myometrial invasion with endometrial cancer. Obstet. Gynecol. 1996, 88, 394–398. [Google Scholar] [CrossRef]
- Mitamura, T.; Watari, H.; Todo, Y.; Kato, T.; Konno, Y.; Hosaka, M.; Sakuragi, N. Lymphadenectomy can be omitted for low-risk endometrial cancer based on preoperative assessments. J. Gynecol. Oncol. 2014, 25, 301–305. [Google Scholar] [CrossRef] [PubMed] [Green Version]
- Alcázar, J.L.; Gastón, B.; Navarro, B.; Salas, R.; Aranda, J.; Guerriero, S. Transvaginal ultrasound versus magnetic resonance imaging for preoperative assessment of myometrial infiltration in patients with endometrial cancer: A systematic review and meta-analysis. J. Gynecol. Oncol. 2017, 28, e86. [Google Scholar] [CrossRef] [PubMed] [Green Version]
- Hricak, H.; Rubinstein, L.V.; Gherman, G.M.; Karstaedt, N. MR imaging evaluation of endometrial carcinoma: Results of an NCI cooperative study. Radiology 1991, 179, 829–832. [Google Scholar] [CrossRef] [PubMed]
- Choi, H.-J.; Lee, S.; Park, B.K.; Kim, T.-J.; Kim, C.K.; Park, J.J.; Choi, C.H.; Lee, Y.-Y.; Lee, J.-W.; Bae, D.-S.; et al. Long-term outcomes of magnetic resonance imaging-invisible endometrial cancer. J. Gynecol. Oncol. 2016, 27, e38. [Google Scholar] [CrossRef] [Green Version]
- Bi, W.L.; Hosny, A.; Schabath, M.B.; Giger, M.L.; Birkbak, N.J.; Mehrtash, A.; Allison, T.; Arnaout, O.; Abbosh, C.; Dunn, I.F.; et al. Artificial intelligence in cancer imaging: Clinical challenges and applications. CA Cancer J. Clin. 2019, 69, 127–157. [Google Scholar] [CrossRef] [PubMed] [Green Version]
- Weidlich, V.; Weidlich, G.A. Artificial intelligence in medicine and radiation oncology. Cureus 2018, 10, e2475. [Google Scholar] [CrossRef] [PubMed] [Green Version]
- Mendelson, E.B. Artificial intelligence in breast imaging—Potentials and limitations. AJR Am. J. Roentgenol. 2019, 212, 293–299. [Google Scholar] [CrossRef] [PubMed]
- Hwang, D.-K.; Hsu, C.-C.; Chang, K.-J.; Chao, D.; Sun, C.-H.; Jheng, Y.-C.; Yarmishyn, A.A.; Wu, J.-C.; Tsai, C.-Y.; Wang, M.-L.; et al. Artificial intelligence-based decision-making for age-related macular degeneration. Theranostics 2019, 9, 232–245. [Google Scholar] [CrossRef]
- Esteva, A.; Kuprel, B.; Novoa, R.A.; Ko, J.; Swetter, S.M.; Blau, H.M.; Thrun, S. Dermatologist-level classification of skin cancer with deep neural networks. Nature 2017, 542, 115–118. [Google Scholar] [CrossRef]
- Litjens, G.; Kooi, T.; Bejnordi, B.E.; Setio, A.A.A.; Ciompi, F.; Ghafoorian, M.; Van Der Laak, J.A.; Van Ginneken, B.; Sánchez, C.I. A survey on deep learning in medical image analysis. Med. Image Anal. 2017, 42, 60–88. [Google Scholar] [CrossRef] [Green Version]
- Woo, S.; Kim, S.Y.; Cho, J.Y.; Kim, S.H. Assessment of deep myometrial invasion of endometrial cancer on MRI: Added value of second-opinion interpretations by radiologists subspecialized in gynaecologic oncology. Eur. Radiol. 2017, 27, 1877–1882. [Google Scholar] [CrossRef]
- Beddy, P.; Moyle, P.; Kataoka, M.; Yamamoto, A.K.; Joubert, I.; Lomas, D.J.; Crawford, R.; Sala, E. Evaluation of depth of myometrial invasion and overall staging in endometrial cancer: Comparison of diffusion-weighted and dynamic contrast-enhanced MR imaging. Radiology 2012, 262, 530–537. [Google Scholar] [CrossRef]
- Sun, H.; Zeng, X.; Xu, T.; Peng, G.; Ma, Y. Computer-aided diagnosis in histopathological images of the endometrium using a convolutional neural network and attention mechanisms. IEEE J. Biomed. Health Inform. 2019, 24, 1664–1676. [Google Scholar] [CrossRef] [Green Version]
- Yasaka, K.; Abe, O. Deep learning and artificial intelligence in radiology: Current applications and future directions. PLoS Med. 2018, 15, e1002707. [Google Scholar] [CrossRef] [Green Version]
- Kermany, D.S.; Goldbaum, M.; Cai, W.; Valentim, C.C.; Liang, H.; Baxter, S.L.; McKeown, A.; Yang, G.; Wu, X.; Yan, F.; et al. Identifying medical diagnoses and treatable diseases by image-based deep learning. Cell 2018, 172, 1122–1131. [Google Scholar] [CrossRef] [PubMed]
- Ronneberger, O.; Fischer, P.; Brox, T. U-Net: Convolutional networks for biomedical image segmentation. arXiv 2015, arXiv:1505.04597. Available online: https://arxiv.org/abs/1505.04597 (accessed on 17 August 2020).
- Iglovikov, V.; Shvets, A. TernausNet: U-Net with VGG11 encoder pre-trained on ImageNet for image segmentation. arXiv 2018, arXiv:1801.05746v1. Available online: https://arxiv.org/abs/1801.05746 (accessed on 17 August 2020).
- Shvets, A.A.; Iglovikov, V.I.; Rakhlin, A.; Kalinin, A.A. Angiodysplasia detection and localization using deep convolutional neural networks. In Proceedings of the 2018 17th IEEE International Conference on Machine Learning and Applications, Orlando, FL, USA, 17–20 December 2018. [Google Scholar]
- He, K.; Zhang, X.; Ren, S.; Sun, J. Deep residual learning for image recognition. arXiv 2015, arXiv:1512.03385. Available online: https://arxiv.org/abs/1512.03385 (accessed on 17 August 2020).
- Iglovikov, V.; Mushinskiy, S.; Osin, V. Satellite imagery feature detection using deep convolutional neural network: A Kaggle competition. arXiv 2017, arXiv:1706.06169. Available online: https://arxiv.org/abs/1706.06169 (accessed on 17 August 2020).
- Iglovikov, V.; Rakhlin, A.; Kalinin, A.; Shvets, A. Pediatric bone age assessment using deep convolutional neural networks. arXiv 2017, arXiv:1712.05053. Available online: https://arxiv.org/abs/1712.05053 (accessed on 17 August 2020).
- Ching, T.; Himmelstein, D.S.; Beaulieu-Jones, B.K.; Kalinin, A.A.; Do, B.T.; Way, G.P.; Ferrero, E.; Agapow, P.-M.; Zietz, M.; Hoffman, M.M.; et al. Opportunities and obstacles for deep learning in biology and medicine. bioRxiv 2017, 142760. [Google Scholar] [CrossRef] [Green Version]
- Wang, G.; Li, W.; Ourselin, S.; Vercauteren, T. Automatic brain tumor segmentation using cascaded anisotropic convolutional neural networks. arXiv 2017, arXiv:1709.00382v2. Available online: https://arxiv.org/pdf/1709.00382.pdf (accessed on 17 August 2020).
- Paszke, A.; Chaurasia, A.; Kim, S.; Culurciello, E. ENet: A deep neural network architecture for real-time semantic segmentation. arXiv 2016, arXiv:1606.02147v1. Available online: https://arxiv.org/abs/1606.02147 (accessed on 17 August 2020).
- Arieno, A.; Chan, A.; Destounis, S.V. A review of the role of augmented intelligence in breast imaging: From automated breast density assessment to risk stratification. AJR 2019, 212, 259–270. [Google Scholar] [CrossRef]
- Yuheng, S.; Hao, Y. Image segmentation algorithms overview. arXiv 2017, arXiv:1707.02051. Available online: https://arxiv.org/abs/1707.02051 (accessed on 17 August 2020).
- Vargas, H.A.; Akin, O.; Zheng, J.; Moskowitz, C.; Soslow, R.A.; Abu-Rustum, N.; Barakat, R.R.; Hricak, H. The value of MR imaging when the site of uterine cancer origin is uncertain. Radiology 2011, 258, 785–792. [Google Scholar] [CrossRef] [PubMed]
- Walker, J.L.; Piedmonte, M.R.; Spirtos, N.M.; Eisenkop, S.M.; Schlaerth, J.B.; Mannel, R.S.; Barakat, R.; Pearl, M.L.; Sharma, S.K. Recurrence and survival after random assignment to laparoscopy versus laparotomy for comprehensive surgical staging of uterine cancer: Gynecologic Oncology Group LAP2 Study. J. Clin. Oncol. 2012, 30, 695–700. [Google Scholar] [CrossRef] [PubMed] [Green Version]
- Khadra, G.; Hannah, D.; Andrew, B.; Alberto, D.L. Laparoscopy versus laparotomy for the management of early stage endometrial cancer. Cochrane Database Syst. Rev. 2018, 10, CD006655. [Google Scholar]
- Andrea, M.; Maurice, J.W.; Gary, L.K.; Michael, G.H.; Giliola, C.; Karl, C.P. Low-risk corpus cancer: Is lymphadenectomy or radiotherapy necessary? Am. J. Obstet. Gynecol. 2000, 182, 1506–1519. [Google Scholar]
- Ueno, Y.; Forghani, B.; Forghani, R.; Dohan, A.; Zeng, X.Z.; Chamming’S, F.; Arseneau, J.; Fu, L.; Gilbert, L.; Gallix, B.; et al. Endometrial Carcinoma: MR Imaging-based Texture Model for Preoperative Risk Stratification-A Preliminary Analysis. Radiology 2017, 284, 748–757. [Google Scholar] [CrossRef] [Green Version]
- Ytre-Hauge, S.; Dybvik, J.A.; Lundervold, A.; Salvesen, Ø.O.; Krakstad, C.; Fasmer, K.E.; Werner, H.M.; Ganeshan, B.; Høivik, E.; Bjørge, L.; et al. Preoperative tumor texture analysis on MRI predicts high-risk disease and reduced survival in endometrial cancer. J. Magn. Reson. Imaging 2018, 48, 1637–1647. [Google Scholar] [CrossRef]


| Characteristics | n = 72 |
|---|---|
| Age (year) [mean ± SD a] (range) | 59.7 ± 9.08 (39–85) |
| Menopausal status | |
| Postmenopausal | 63 (87.5%) |
| Premenopausal | 9 (12.5%) |
| ECOG b performance status | |
| 0 | 54 |
| 1 | 18 |
| 2 | 0 |
| 3 | 0 |
| 4 | 0 |
| FIGO c Stage | |
| IA | 53 (73.6%) |
| IB | 19 (26.4%) |
| Histology subtype | |
| Type I | |
| Grade 1 endometrioid | 27 (37.5%) |
| Grade 2 endometrioid | 32 (44.4%) |
| Type II | |
| Grade 3 endometrioid | 4 (5.6%) |
| Serous | 5 (6.9%) |
| Clear cell | 1 (1.4%) |
| Mixed | 3 (4.2%) |
| Histology grade | |
| 1 | 27 (37.5%) |
| 2 | 32 (44.4%) |
| 3 | 13 (18.1%) |
| Uterine leiomyomas | |
| Present | 29 (40.3%) |
| Absent | 43 (59.7%) |
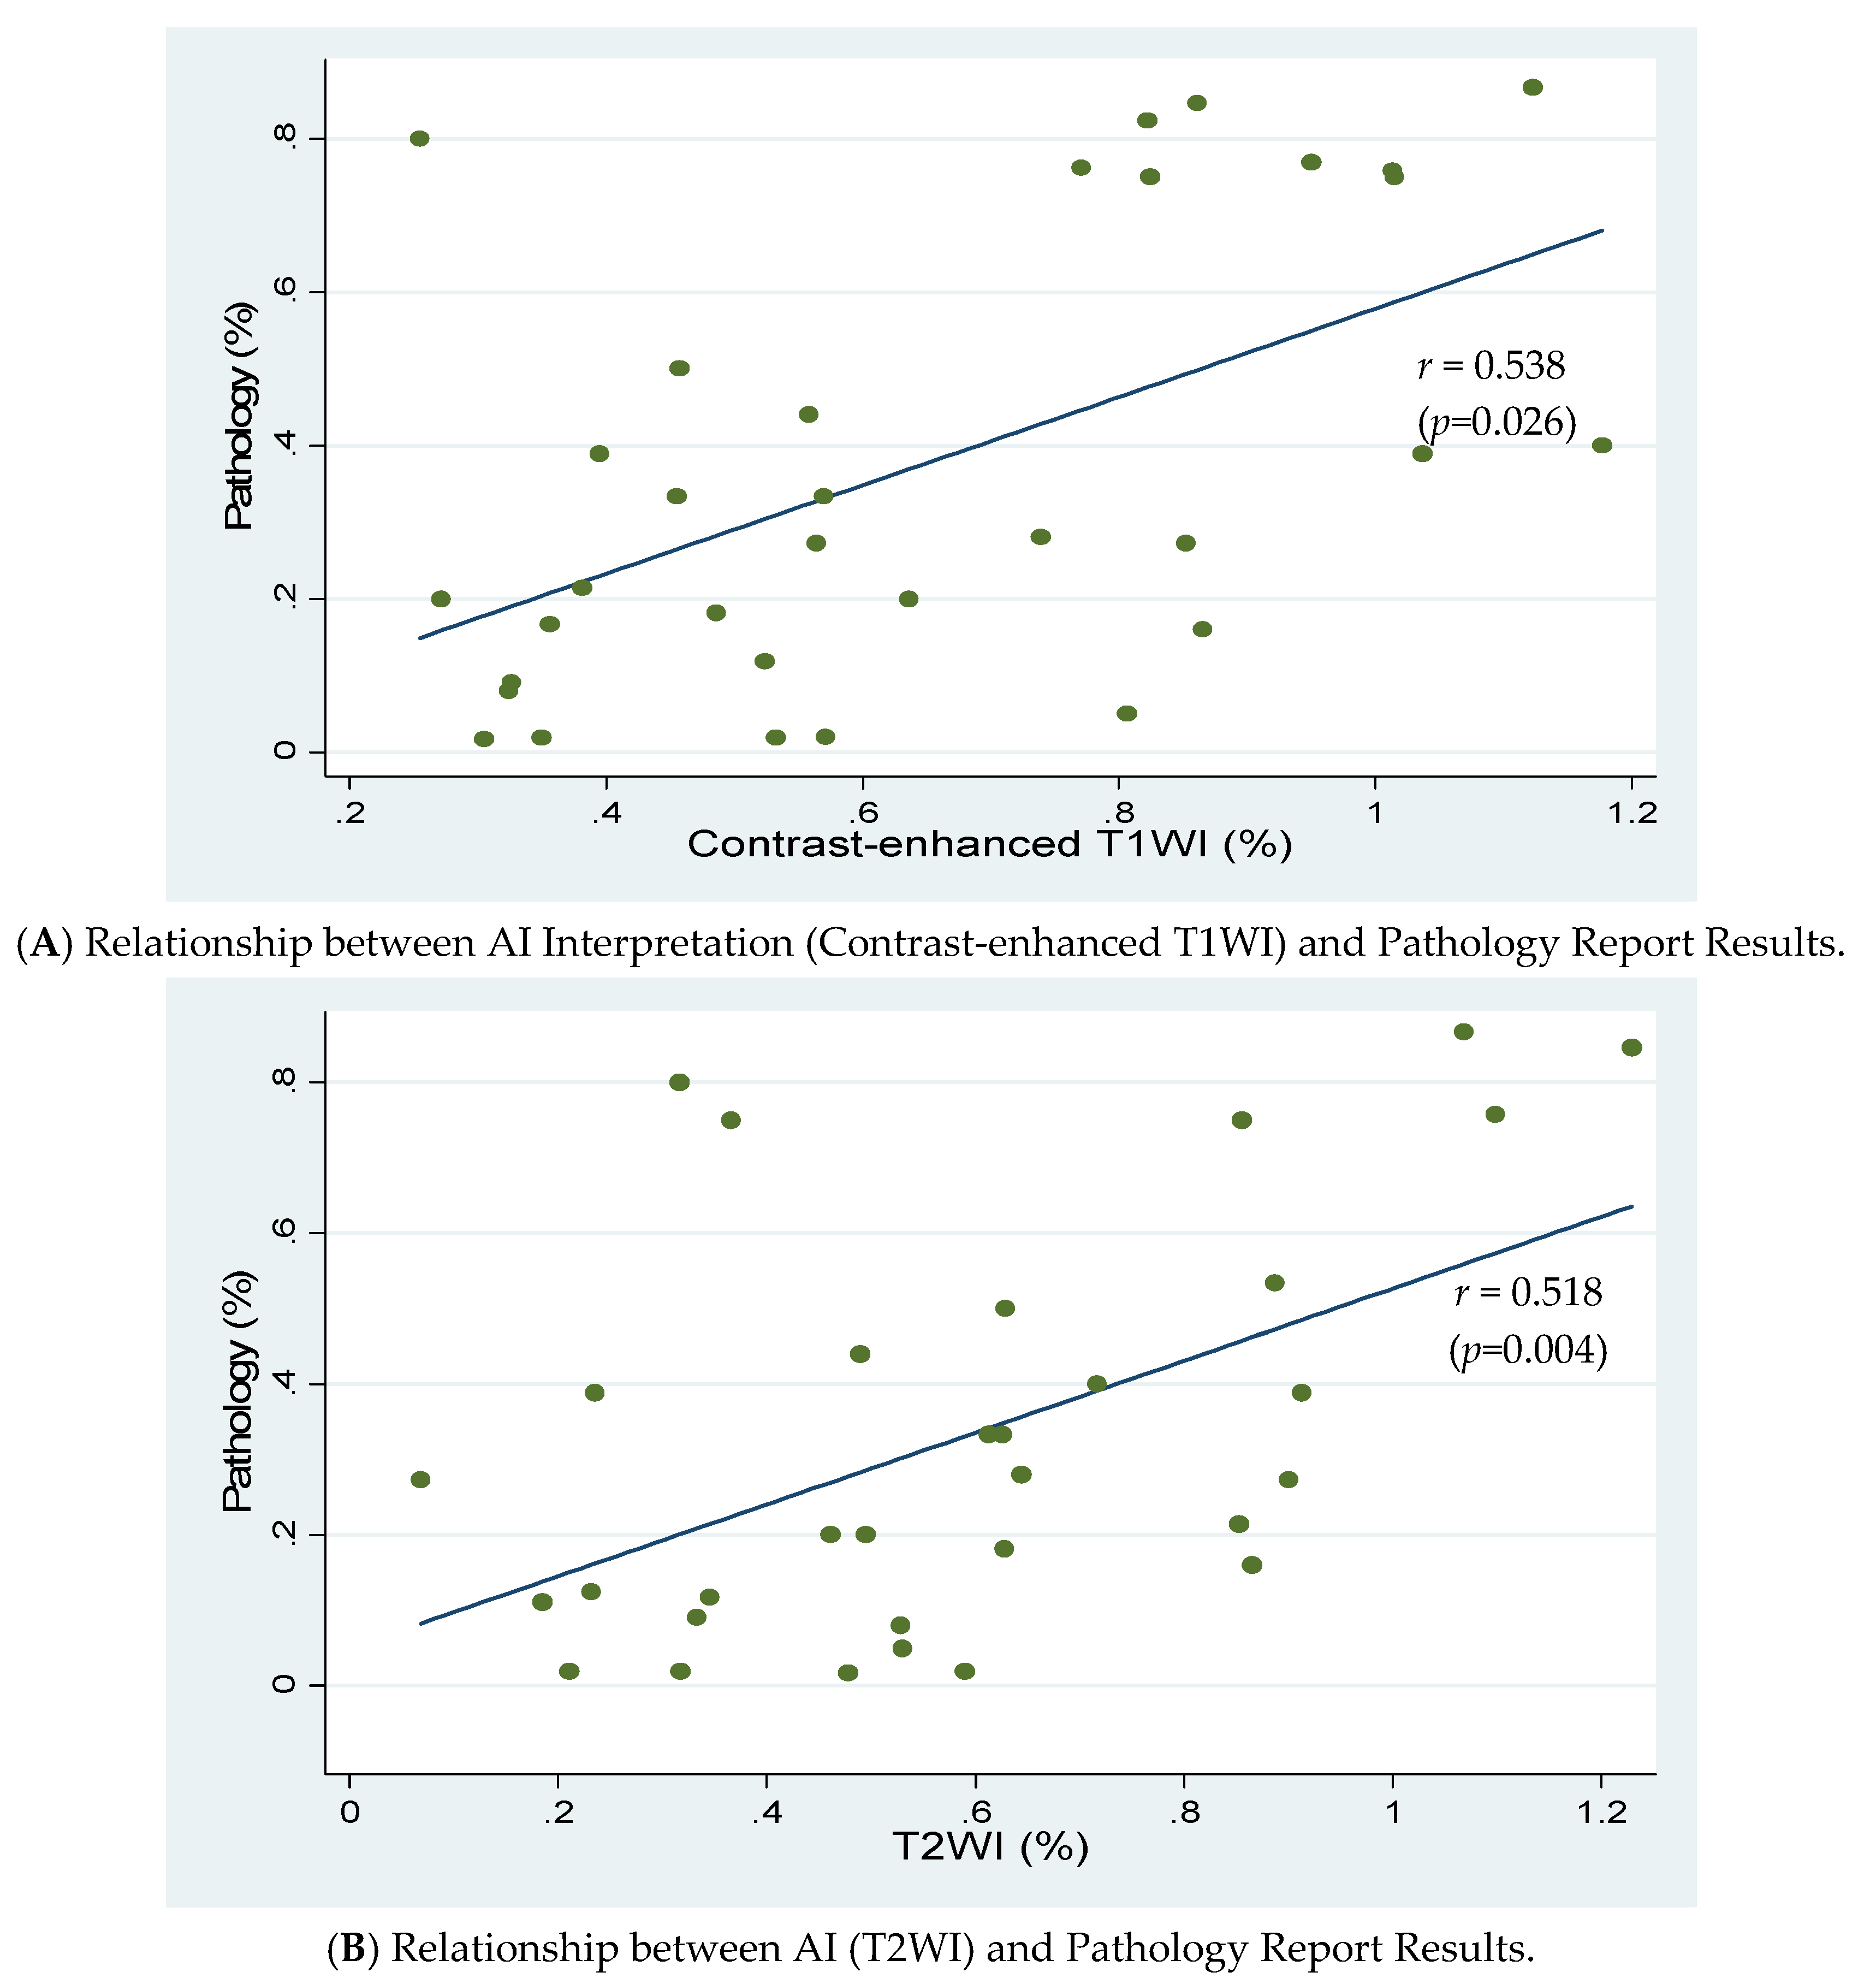
| Results | Pathology Report | Accuracy Rates | |
|---|---|---|---|
| IA | IB | ||
| AI Interpretation | |||
| Contrast-enhanced T1w | 79.2% (38/48) | ||
| <50% Invasion | 30 (compatible) | 3 (under diagnosed) | |
| ≥50% Invasion | 7 (over diagnosed) | 8 (compatible) | |
| T2w | 70.8% (34/48) | ||
| <50% Invasion | 29 (compatible) | 5 (under diagnosed) | |
| ≥50% Invasion | 9 (over diagnosed) | 5 (compatible) | |
| Radiologists’ Diagnoses | 77.8% (56/72) | ||
| IA | 39 (compatible) | 2 (under diagnosed) | |
| IB | 14 (over diagnosed) | 17 (compatible) | |
| Pathology Report | ||||||
|---|---|---|---|---|---|---|
| Results | IA | IB | IA | IB | Accuracy Rates | p-Value |
| Uterine leiomyoma | + | − | +/− | |||
| AI Interpretation | ||||||
| Contrast-enhanced T1w | 60%/87.9% | 0.027 | ||||
| <50% Invasion | 9 * | 1 | 21 * | 2 | ||
| ≥50% Invasion | 5 | 0 * | 2 | 8 * | ||
| T2w | 56.3%/78.1% | 0.115 | ||||
| <50% Invasion | 8 * | 1 | 21 * | 4 | ||
| ≥50% Invasion | 6 | 1 * | 3 | 4 * | ||
| Radiologists’ Diagnoses (MR stage) | 69%/83.7% | 0.140 | ||||
| IA | 16 ** | 1 | 23 ** | 1 | ||
| IB | 8 | 4 ** | 6 | 13** | ||
| Histology | Type I | Type II | Type I/II | |||
| AI Interpretation | ||||||
| Contrast-enhanced T1w | 81.1%/72.7% | 0.549 | ||||
| <50% Invasion | 26 * | 2 | 4 * | 1 | ||
| ≥50% Invasion | 5 | 4 * | 2 | 4 * | ||
| T2w | 71.1%/70% | 0.727 | ||||
| <50% Invasion | 25 * | 4 | 4 * | 1 | ||
| ≥50% Invasion | 7 | 2 * | 2 | 3 * | ||
| Radiologists’ Diagnoses (MR stage) | 79.7%/69.2% | 0.413 | ||||
| IA | 35 ** | 1 | 4 ** | 1 | ||
| IB | 11 | 12 ** | 3 | 5 ** | ||
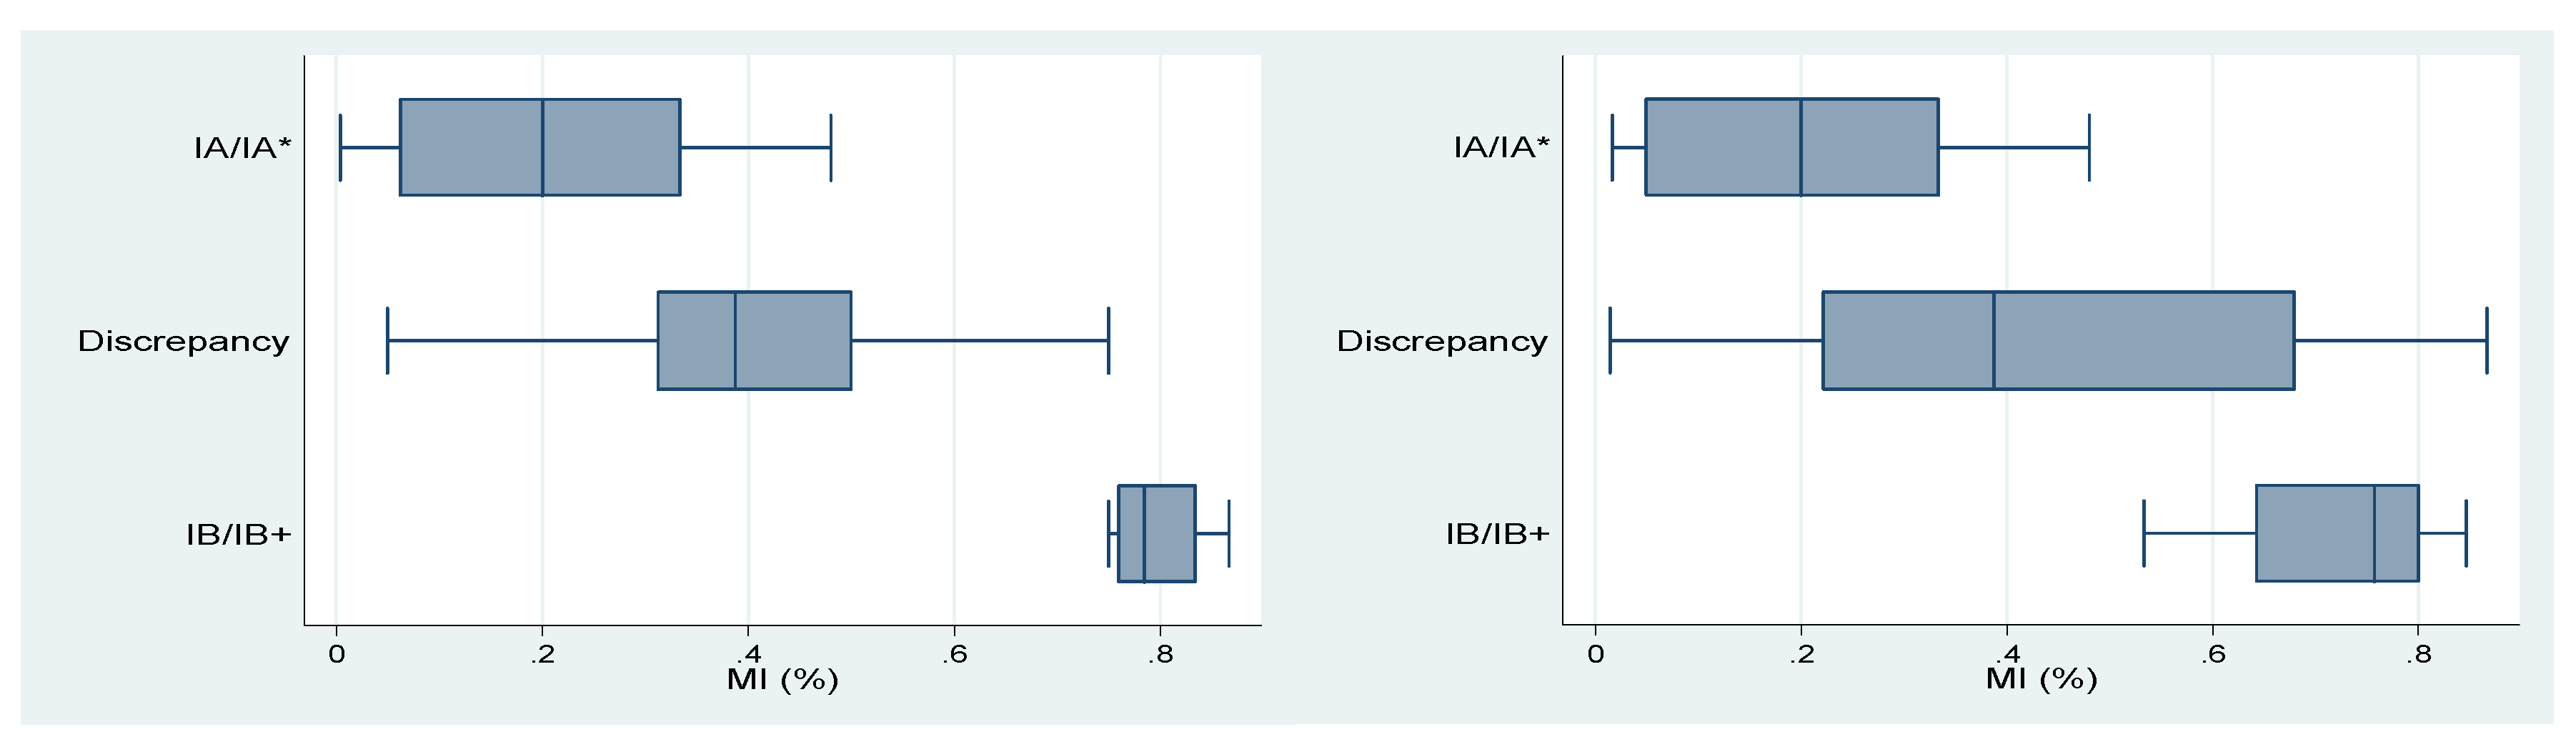
| Results | Min | Q1 | Median | Q3 | Max |
|---|---|---|---|---|---|
| IA/IA * (compatible) | 0 | 0.043 | 0.114 | 0.2 | 0.48 |
| Discrepancy | 0.015 | 0.276 | 0.333 | 0.422 | 0.68 |
| IB/IB+ (compatible) | 0.5 | 0.643 | 0.75 | 0.8 | 0.867 |
| Contrast-Enhanced T1w | T2w | ||||||||||
|---|---|---|---|---|---|---|---|---|---|---|---|
| Min | Q1 | Median | Q3 | Max | Min | Q1 | Median | Q3 | Max | ||
| IA/IA * (Compatible) | 0.004 | 0.063 | 0.2 | 0.333 | 0.48 | IA/IA * (compatible) | 0.017 | 0.05 | 0.2 | 0.333 | 0.48 |
| Discrepancy | 0.05 | 0.313 | 0.388 | 0.5 | 0.75 | Discrepancy | 0.015 | 0.222 | 0.388 | 0.68 | 0.867 |
| IB/IB+ (Compatible) | 0.75 | 0.76 | 0.785 | 0.835 | 0.867 | IB/IB+ (compatible) | 0.533 | 0.643 | 0.758 | 0.8 | 0.846 |
© 2020 by the authors. Licensee MDPI, Basel, Switzerland. This article is an open access article distributed under the terms and conditions of the Creative Commons Attribution (CC BY) license (http://creativecommons.org/licenses/by/4.0/).
Share and Cite
Dong, H.-C.; Dong, H.-K.; Yu, M.-H.; Lin, Y.-H.; Chang, C.-C. Using Deep Learning with Convolutional Neural Network Approach to Identify the Invasion Depth of Endometrial Cancer in Myometrium Using MR Images: A Pilot Study. Int. J. Environ. Res. Public Health 2020, 17, 5993. https://0-doi-org.brum.beds.ac.uk/10.3390/ijerph17165993
Dong H-C, Dong H-K, Yu M-H, Lin Y-H, Chang C-C. Using Deep Learning with Convolutional Neural Network Approach to Identify the Invasion Depth of Endometrial Cancer in Myometrium Using MR Images: A Pilot Study. International Journal of Environmental Research and Public Health. 2020; 17(16):5993. https://0-doi-org.brum.beds.ac.uk/10.3390/ijerph17165993
Chicago/Turabian StyleDong, Hsiang-Chun, Hsiang-Kai Dong, Mu-Hsien Yu, Yi-Hsin Lin, and Cheng-Chang Chang. 2020. "Using Deep Learning with Convolutional Neural Network Approach to Identify the Invasion Depth of Endometrial Cancer in Myometrium Using MR Images: A Pilot Study" International Journal of Environmental Research and Public Health 17, no. 16: 5993. https://0-doi-org.brum.beds.ac.uk/10.3390/ijerph17165993