Effectiveness of Lifestyle Interventions for Prevention of Harmful Weight Gain among Adolescents from Ethnic Minorities: A Systematic Review


Abstract
:1. Introduction
2. Materials and Methods
2.1. Identification of Studies
2.2. Eligibility Criteria
2.3. Study Selection
2.4. Data Extraction
2.5. Quality Assessment
2.6. Grading of Recommendations Assessment, Development and Evaluation Assessment
3. Results
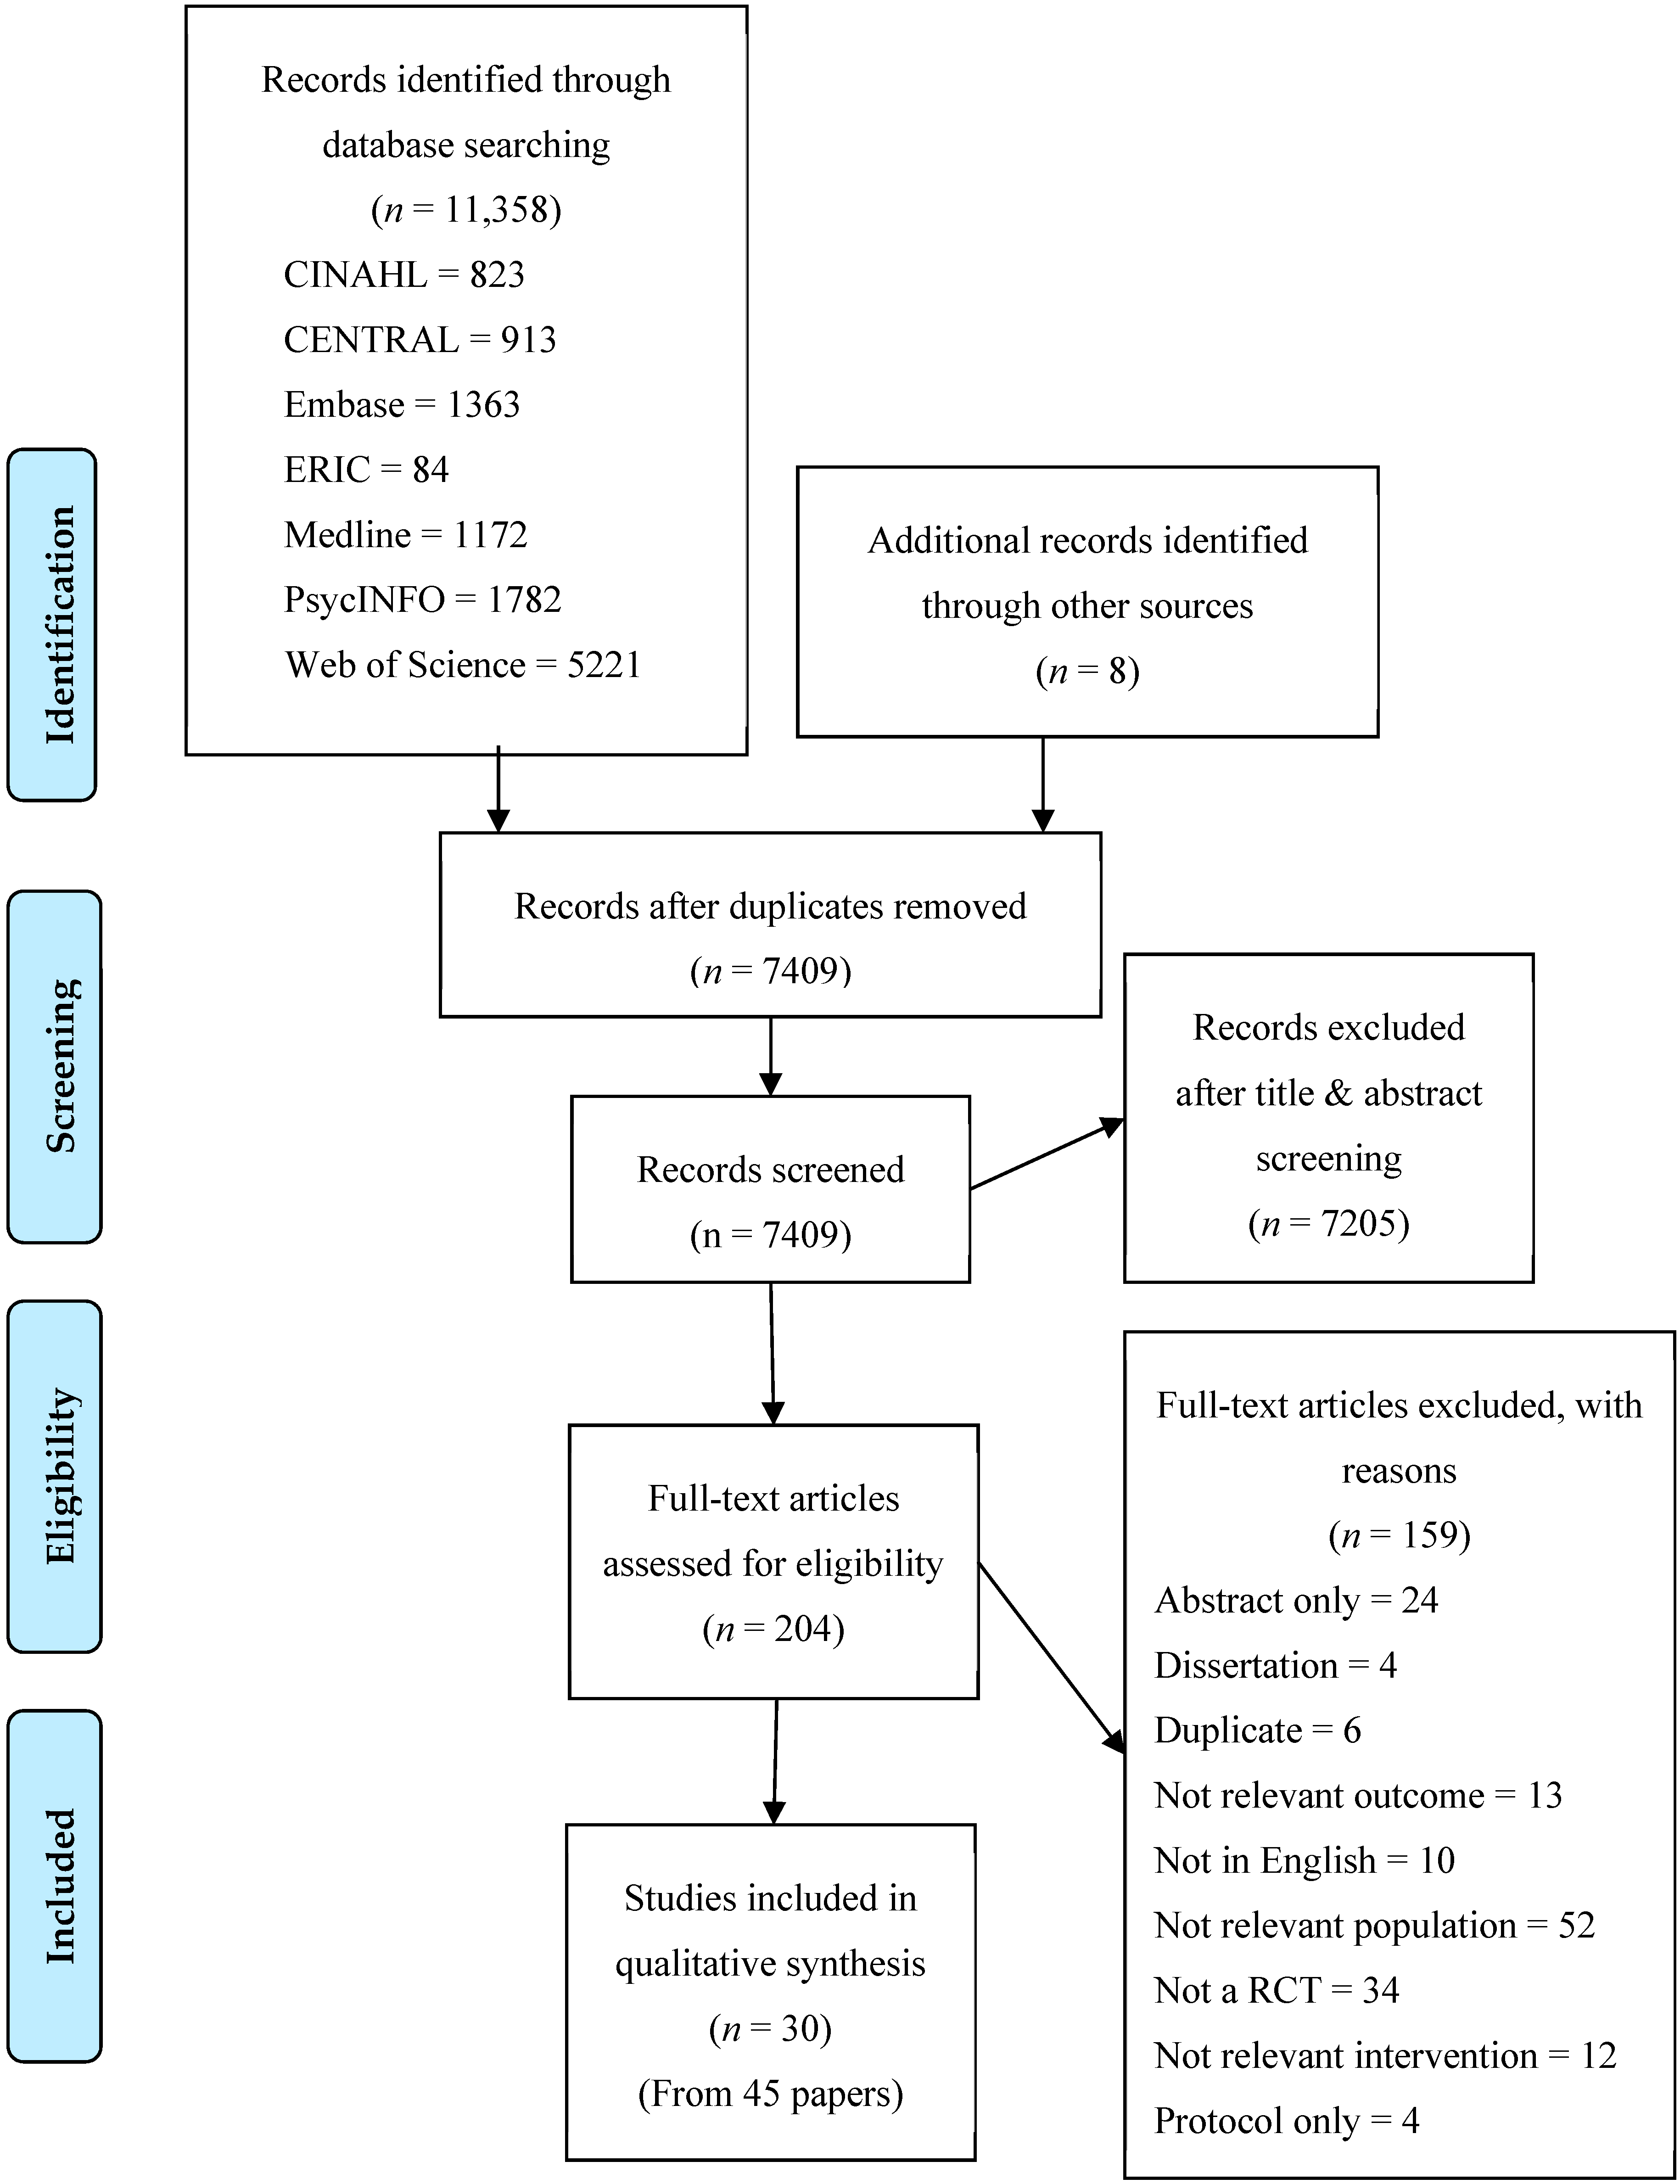
3.1. Study Selection
3.2. Setting and Study Design
3.3. Study Characteristics
3.4. Participants’ Characteristics and Recruitment Strategies
3.5. Primary and Secondary Outcomes; General and Targeted
3.6. Risk of Bias
3.7. Grading of Recommendations Assessment, Development and Evaluation Quality Rating
3.7.1. Study Limitations
3.7.2. Consistency
3.7.3. Directness
3.7.4. Precision
3.7.5. Publication Bias
4. Discussion
4.1. Effectiveness of Interventions in Preventing Harmful Weight Gain in Adolescents from Ethnic Minorities: Primary Outcomes
4.2. Effectiveness of Interventions in Preventing Harmful Weight Gain in Adolescents from Ethnic Minorities: Secondary Outcomes
4.3. Setting: School or Community?
4.4. Indigenous and First Nations
4.5. Study Strengths and Limitations
4.6. Review Strengths and Limitations
5. Conclusions
Supplementary Materials
Author Contributions
Funding
Acknowledgments
Conflicts of Interest
References
- Friedrich, M.J. Global Obesity Epidemic Worsening. JAMA 2017, 318, 603. [Google Scholar] [CrossRef] [PubMed]
- Hales, C.M.C.; Fryar, C.D.; Ogden, C.L. Prevalence of Obesity among Adults and Youth: United States, 2015–2016; U.S Department of Health and Human Services: Hyattsville, MD, USA, 2017; pp. 1–8.
- Australian Bureau of Statistics. Children’s Risk Factors. Available online: http://www.abs.gov.au/ausstats/[email protected]/Lookup/by%20Subject/4338.0~2011-13~Main%20Features~Children’s%20risk%20factors~10010 (accessed on 6 June 2018).
- Aitken, R.J.; Allman-Farinelli, M.A.; King, L.A.; Bauman, A.E. Current and future costs of cancer, heart disease and stroke attributable to obesity in Australia—A comparison of two birth cohorts. Asia Pac. J. Clin. Nutr. 2009, 18, 63–70. [Google Scholar]
- Warren, M.; Beck, S.; Rayburn, J. The State of Obesity: Better Policies for a Healthier America 2018; Trust for America’s Health: Washington, DC, USA, 2018; pp. 12–13.
- Lassi, Z.S.; Moin, A.; Das, J.K.; Salam, R.A.; Bhutta, Z.A. Systematic review on evidence-based adolescent nutrition interventions. Ann. N. Y. Acad. Sci. 2017, 1393, 34–50. [Google Scholar] [CrossRef] [PubMed] [Green Version]
- Rose, T.; Barker, M.; Maria Jacob, C.; Morrison, L.; Lawrence, W.; Strommer, S.; Vogel, C.; Woods-Townsend, K.; Farrell, D.; Inskip, H.; et al. A Systematic Review of Digital Interventions for Improving the Diet and Physical Activity Behaviors of Adolescents. J. Adolesc. Health. 2017, 61, 669–677. [Google Scholar] [CrossRef] [PubMed] [Green Version]
- Andrade, S.C.D.; Previdelli, Á.N.; Cesar, C.L.G.; Marchioni, D.M.L.; Fisberg, R.M. Trends in diet quality among adolescents, adults and older adults: A population-based study. Prev. Med. Rep. 2016, 4, 391–396. [Google Scholar] [CrossRef] [Green Version]
- Reedy, J.; Krebs-Smith, S.M. Dietary Sources of Energy, Solid Fats, and Added Sugars among Children and Adolescents in the United States. J. Am. Diet Assoc. 2010, 110, 1477–1484. [Google Scholar] [CrossRef] [Green Version]
- Australian Bureau of Statistics. Australian Health Survey: Consumption of Food Groups from the Australian Dietary Guidelines. Available online: http://www.ausstats.abs.gov.au/Ausstats/subscriber.nsf/0/12E8766EBAB492B0CA257FAF001A3CFD/$File/43640do002_20112012.pdf (accessed on 22 March 2018).
- Australian Bureau of Statistics. Key Findings. Available online: http://www.abs.gov.au/ausstats/[email protected]/Lookup/4364.0.55.004Chapter1002011-12 (accessed on 22 March 2018).
- Hardy, L.L.; Mihrshahi, S.; Drayton, B.A.; Bauman, A. NSW Schools Physical Activity and Nutrition Survey (SPANS); NSW Department of Health: Sydney, Australia, 2017.
- U.S.D.o.H.H. Childhood Obesity Facts. Available online: https://www.cdc.gov/obesity/data/childhood.html (accessed on 22 March 2018).
- Falconer, C.L.; Park, M.H.; Croker, H.; Kessel, A.S.; Saxena, S.; Viner, R.M.; Kinra, S. Can the relationship between ethnicity and obesity-related behaviours among school-aged children be explained by deprivation? A cross-sectional study. BMJ Open 2014, 4, e003949. [Google Scholar] [CrossRef] [PubMed] [Green Version]
- Menigoz, K.; Nathan, A.; Turrell, G. Ethnic differences in overweight and obesity and the influence of acculturation on immigrant bodyweight: Evidence from a national sample of Australian adults. BMC Public Health 2016, 16, 932. [Google Scholar] [CrossRef] [Green Version]
- Avery, C.L.; Holliday, K.M.; Chakladar, S.; Engeda, J.C.; Hardy, S.T.; Reis, J.P.; Schreiner, P.J.; Shay, C.M.; Daviglus, M.L.; Heiss, G.; et al. Disparities in Early Transitions to Obesity in Contemporary Multi-Ethnic U.S. Populations. PLoS ONE 2016, 11, e0158025. [Google Scholar] [CrossRef]
- Racial and Ethnic Identity. Available online: https://apastyle.apa.org/style-grammar-guidelines/bias-free-language/racial-ethnic-minorities (accessed on 20 April 2020).
- Moher, D.; Liberati, A.; Tetzlaff, J.; Altman, D.G.; Group, P. Preferred reporting items for systematic reviews and meta-analyses: The PRISMA statement. J. Clin. Epidemiol 2009, 62, 1006–1012. [Google Scholar] [CrossRef]
- Summerbell, C.D.; Waters, E.; Edmunds, L.D.; Kelly, S.; Brown, T.; Campbell, K.J. Interventions for preventing obesity in children. Cochrane Database Syst. Rev. 2005, CD001871. [Google Scholar] [CrossRef] [Green Version]
- Wells, J.; Lewis, L. Internet Access in U.S. Public Schools and Classrooms: 1994–2005; National Centre for Education Statistics: Washington, DC, USA, 2006. [Google Scholar]
- Cochrane Handbook for Systematic Reviews of Interventions. Version 5.0.0. Available online: https://training.cochrane.org/handbook/archive/v5.0.0/ (accessed on 29 February 2008).
- Weeks, B.K.; Beck, B.R. Twice-weekly, in-school jumping improves lean mass, particularly in adolescent boys. Pediatr. Obes. 2012, 7, 196–204. [Google Scholar] [CrossRef] [PubMed] [Green Version]
- Thakur, J.S.; Bharti, B.; Tripathy, J.P.; Dhawan, V.; Bhansali, A. Impact of 20 Week Lifestyle Intervention Package on Anthropometric Biochemical and Behavioral Characteristics of Schoolchildren in North India. J. Trop. Pediatr. 2016, 62, 368–376. [Google Scholar] [CrossRef] [PubMed] [Green Version]
- Neumark-Sztainer, D.R.; Friend, S.E.; Flattum, C.F.; Hannan, P.J.; Story, M.T.; Bauer, K.W.; Feldman, S.B.; Petrich, C.A. New moves-preventing weight-related problems in adolescent girls a group-randomized study. Am. J. Prev. Med. 2010, 39, 421–432. [Google Scholar] [CrossRef] [PubMed] [Green Version]
- Melnyk, B.M.; Jacobson, D.; Kelly, S.; Belyea, M.; Shaibi, G.; Small, L.; O’Haver, J.; Marsiglia, F.F. Promoting Healthy Lifestyles in High School Adolescents A Randomized Controlled Trial. Am. J. Prev. Med. 2013, 45, 407–415. [Google Scholar] [CrossRef] [PubMed] [Green Version]
- Leme, A.C.; Lubans, D.R.; Guerra, P.H.; Dewar, D.; Toassa, E.C.; Philippi, S.T. Preventing obesity among Brazilian adolescent girls: Six-month outcomes of the Healthy Habits, Healthy Girls-Brazil school-based randomized controlled trial. Prev. Med. 2016, 86, 77–83. [Google Scholar] [CrossRef]
- French, S.A.; Gerlach, A.F.; Mitchell, N.R.; Hannan, P.J.; Welsh, E.M. Household obesity prevention: Take Action—A group-randomized trial. Obesity 2011, 19, 2082–2088. [Google Scholar] [CrossRef]
- Ezendam, N.P.; Brug, J.; Oenema, A. Evaluation of the Web-based computer-tailored FATaintPHAT intervention to promote energy balance among adolescents: Results from a school cluster randomized trial. Arch. Pediatr. Adolesc. Med. 2012, 166, 248–255. [Google Scholar] [CrossRef]
- Ebbeling, C.B.; Feldman, H.A.; Osganian, S.K.; Chomitz, V.R.; Ellenbogen, S.J.; Ludwig, D.S. Effects of decreasing sugar-sweetened beverage consumption on body weight in adolescents: A randomized, controlled pilot study. Pediatrics 2006, 117, 673–680. [Google Scholar] [CrossRef] [Green Version]
- Higgins, J.P.; Altman, D.G.; Gotzsche, P.C.; Juni, P.; Moher, D.; Oxman, A.D.; Savovic, J.; Schulz, K.F.; Weeks, L.; Sterne, J.A.; et al. The Cochrane Collaboration’s tool for assessing risk of bias in randomised trials. BMJ 2011, 343, d5928. [Google Scholar] [CrossRef] [Green Version]
- Atkins, D.; Best, D.; Briss, P.A.; Eccles, M.; Falck-Ytter, Y.; Flottorp, S.; Guyatt, G.H.; Harbour, R.T.; Haugh, M.C.; Henry, D.; et al. Grading quality of evidence and strength of recommendations. BMJ 2004, 328, 1490. [Google Scholar] [CrossRef] [PubMed] [Green Version]
- Amaro, S.; Di Costanzo, A.; Madeo, I.; Viggiano, A.; Baccari, M.E.; Marchitelli, E.; Raia, M.; Viggiano, E.; Deepak, S.; Monda, M.; et al. Kaledo, a new educational board-game, gives nutritional rudiments and encourages healthy eating in children: A pilot cluster randomized trial. Eur. J. Pediatrics 2006, 165, 630–635. [Google Scholar] [CrossRef] [PubMed]
- Black, M.M.; Hager, E.; Le, K.; Anliker, J.; Arteaga, S.S.; DiClemente, C.; Gittelsohn, J.; Magder, L.; Snitker, S.; Papas, M.; et al. Challenge! A mentorship model of health promotion and obesity prevention among urban, African American Adolescents. Pediatrics 2010, 126, 280–288. [Google Scholar] [CrossRef] [PubMed] [Green Version]
- Bonsergent, E.; Agrinier, N.; Thilly, N.; Tessier, S.; Legrand, K.; Lecomte, E.; Aptel, E.; Hercberg, S.; Collin, J.-F.; Briancon, S. Overweight and obesity prevention for adolescents: A cluster randomized controlled trial in a school setting. Am. J. Prev. Med. 2013, 44, 30–39. [Google Scholar] [CrossRef] [PubMed]
- Briancon, S.; Bonsergent, E.; Agrinier, N.; Tessier, S.; Legrand, K.; Lecomte, E.; Aptel, E.; Hercberg, S.; Collin, J.-F.; Group, P.T.; et al. PRALIMAP: Study protocol for a high school-based, factorial cluster randomised interventional trial of three overweight and obesity prevention strategies. Trials 2010, 11, 119. [Google Scholar] [CrossRef] [PubMed]
- Chen, J.-L.; Weiss, S.; Heyman, M.B.; Cooper, B.; Lustig, R.H. The efficacy of the Web-Based Childhood Obesity Prevention Program in Chinese American Adolescents (Web ABC Study). J. Adolesc. Health 2011, 49, 148–154. [Google Scholar] [CrossRef] [Green Version]
- Dewar, D.L.; Morgan, P.J.; Plotnikoff, R.C.; Okely, A.D.; Collins, C.E.; Batterham, M.; Callister, R.; Lubans, D.R. The nutrition and enjoyable activity for teen girls study: A cluster randomized controlled trial. Am. J. Prev. Med. 2013, 45, 313–317. [Google Scholar] [CrossRef]
- Dunker, K.L.L.; Claudino, A.M. Preventing weight-related problems among adolescent girls: A cluster randomized trial comparing the Brazilian ‘New Moves’ program versus observation. Obes. Res. Clin. Pract. 2018, 12, 102–115. [Google Scholar] [CrossRef]
- Ezendam, N.P.; Brug, J.; Borsboom, G.; van Empelen, P.; Oenema, A. Differential effects of the computer-tailored FATaintPHAT programme on dietary behaviours according to sociodemographic, cognitive and home environmental factors--CORRIGENDUM. Public Health Nutr. 2015, 18, 1713. [Google Scholar] [CrossRef] [Green Version]
- Haerens, L.; Deforche, B.; Maes, L.; Stevens, V.; Cardon, G.; De Bourdeaudhuij, I. Body mass effects of a physical activity and healthy food intervention in middle schools. Obesity (Silver Spring) 2006, 14, 847–854. [Google Scholar] [CrossRef]
- Hollis, J.L.; Sutherland, R.; Campbell, L.; Morgan, P.J.; Lubans, D.R.; Nathan, N.; Wolfenden, L.; Okely, A.D.; Davies, L.; Williams, A.; et al. Effects of a ‘school-based’ physical activity intervention on adiposity in adolescents from economically disadvantaged communities: Secondary outcomes of the ‘Physical Activity 4 Everyone’ RCT. Int. J. Obes. (Lond.) 2016, 40, 1486–1493. [Google Scholar] [CrossRef] [PubMed] [Green Version]
- Leme, A.C.B.; Baranowski, T.; Thompson, D.; Nicklas, T.; Philippi, S.T. Sustained impact of the “Healthy Habits, Healthy Girls—Brazil” school-based randomized controlled trial for adolescents living in low-income communities. Prev. Med. Rep. 2018, 10, 346–352. [Google Scholar] [CrossRef] [PubMed]
- Leme, A.C.B.; Philippi, S.T. The “Healthy Habits, Healthy Girls” randomized controlled trial for girls: Study design, protocol, and baseline results. Cad. Saude. Publica. 2015, 31, 1381–1394. [Google Scholar] [CrossRef] [PubMed] [Green Version]
- Lindgren, E.C.; Baigi, A.; Apitzsch, E.; Bergh, H. Impact of a six-month empowerment-based exercise intervention programme in non-physically active adolescent Swedish girls. Health Educ. J. 2011, 70, 9–20. [Google Scholar] [CrossRef] [Green Version]
- Lubans, D.R.; Morgan, P.J.; Aguiar, E.J.; Callister, R. Randomized controlled trial of the Physical Activity Leaders (PALs) program for adolescent boys from disadvantaged secondary schools. Prev. Med. 2011, 52, 239–246. [Google Scholar] [CrossRef] [PubMed]
- Lubans, D.R.; Morgan, P.J.; Dewar, D.; Collins, C.E.; Plotnikoff, R.C.; Okely, A.D.; Batterham, M.J.; Finn, T.; Callister, R. The Nutrition and Enjoyable Activity for Teen Girls (NEAT girls) randomized controlled trial for adolescent girls from disadvantaged secondary schools: Rationale, study protocol, and baseline results. BMC Public Health 2010, 10, 652. [Google Scholar] [CrossRef] [Green Version]
- Lubans, D.R.; Morgan, P.J.; Okely, A.D.; Dewar, D.; Collins, C.E.; Batterham, M.; Callister, R.; Plotnikoff, R.C. Preventing obesity among adolescent girls: One-year outcomes of the nutrition and enjoyable activity for teen girls (NEAT Girls) cluster randomized controlled trial. Arch. Pediatrics Adolesc. Med. 2012, 166, 821–827. [Google Scholar] [CrossRef] [Green Version]
- Lubans, D.R.; Smith, J.J.; Plotnikoff, R.C.; Dally, K.A.; Okely, A.D.; Salmon, J.; Morgan, P.J. Assessing the sustained impact of a school-based obesity prevention program for adolescent boys: The ATLAS cluster randomized controlled trial. Int. J. Behav. Nutr. Phys. Act. 2016, 13, 92. [Google Scholar] [CrossRef] [Green Version]
- Mihas, C.; Mariolis, A.; Manios, Y.; Naska, A.; Arapaki, A.; Mariolis-Sapsakos, T.; Tountas, Y. Evaluation of a nutrition intervention in adolescents of an urban area in Greece: Short- and long-term effects of the VYRONAS study. Public Health Nutr. 2010, 13, 712–719. [Google Scholar] [CrossRef] [Green Version]
- Nollen, N.L.; Hutcheson, T.; Carlson, S.; Rapoff, M.; Goggin, K.; Mayfield, C.; Ellerbeck, E. Development and functionality of a handheld computer program to improve fruit and vegetable intake among low-income youth. Health Educ. Res. 2012, 28, 249–264. [Google Scholar] [CrossRef] [Green Version]
- Nollen, N.L.; Mayo, M.S.; Carlson, S.E.; Rapoff, M.A.; Goggin, K.J.; Ellerbeck, E.F. Mobile technology for obesity prevention: A randomized pilot study in racial- and ethnic-minority girls. Am. J. Prev. Med. 2014, 46, 404–408. [Google Scholar] [CrossRef] [PubMed] [Green Version]
- Patrick, K.; Calfas, K.J.; Norman, G.J.; Zabinski, M.F.; Sallis, J.F.; Rupp, J.; Covin, J.; Cella, J. Randomized controlled trial of a primary care and home-based intervention for physical activity and nutrition behaviors: PACE+ for adolescents. Arch. Pediatr. Adolesc. Med. 2006, 160, 128–136. [Google Scholar] [CrossRef] [PubMed] [Green Version]
- Peralta, L.R.; Jones, R.A.; Okely, A.D. Promoting healthy lifestyles among adolescent boys: The Fitness Improvement and Lifestyle Awareness Program RCT. Prev. Med. 2009, 48, 537–542. [Google Scholar] [CrossRef] [PubMed]
- Rabiei, L.; Masoudi, R.; Lotfizadeh, M. Evaluation of the Effectiveness of Nutritional Education based on Health Belief Model on Self-Esteem and BMI of Overweight and at Risk of Overweight Adolescent Girls. Int. J. Pediatr.-Masshad 2017, 5, 5419–5430. [Google Scholar] [CrossRef]
- Rodearmel, S.J.; Wyatt, H.R.; Stroebele, N.; Smith, S.M.; Ogden, L.G.; Hill, J.O. Small changes in dietary sugar and physical activity as an approach to preventing excessive weight gain: The America on the Move family study. Pediatrics 2007, 120, e869–e879. [Google Scholar] [CrossRef] [Green Version]
- Saez, L.; Langlois, J.; Legrand, K.; Quinet, M.H.; Lecomte, E.; Omorou, A.Y.; Briancon, S.; Grp, P.-I.T. Reach and Acceptability of a Mobile Reminder Strategy and Facebook Group Intervention for Weight Management in Less Advantaged Adolescents: Insights From the PRALIMAP-INES Trial. Jmir. Mhealth Uhealth 2018, 6, e110. [Google Scholar] [CrossRef]
- Simons, M.; Brug, J.; Chinapaw, M.J.M.; De Boer, M.; Seidell, J.; De Vet, E. Replacing non-active video gaming by active video gaming to prevent excessive weight gain in adolescents. PLoS ONE 2015, 10, e0126023. [Google Scholar] [CrossRef]
- Simons, M.; Chinapaw, M.J.M.; van de Bovenkamp, M.; de Boer, M.R.; Seidell, J.C.; Brug, J.; de Vet, E. Active video games as a tool to prevent excessive weight gain in adolescents: Rationale, design and methods of a randomized controlled trial. BMC Public Health 2014, 14, 275. [Google Scholar] [CrossRef] [Green Version]
- Singh, A.S.; Chin, A.; Paw, M.J.M.; Kremers, S.P.J.; Visscher, T.L.S.; Brug, J.; van Mechelen, W. Design of the Dutch Obesity Intervention in Teenagers (NRG-DOiT): Systematic development, implementation and evaluation of a school-based intervention aimed at the prevention of excessive weight gain in adolescents. BMC Public Health 2006, 6, 304. [Google Scholar] [CrossRef] [Green Version]
- Singh, A.S.; Chin, A.P.M.J.; Brug, J.; van Mechelen, W. Short-term effects of school-based weight gain prevention among adolescents. Arch. Pediatr. Adolesc. Med. 2007, 161, 565–571. [Google Scholar] [CrossRef]
- Singh, A.S.; Paw, M.; Brug, J.; van Mechelen, W. Dutch Obesity Intervention in Teenagers Effectiveness of a School-Based Program on Body Composition and Behavior. Arch. Pediatr. Adolesc. Med. 2009, 163, 309–317. [Google Scholar] [CrossRef] [PubMed]
- Singhal, N.; Misra, A.; Shah, P.; Gulati, S. Effects of controlled school-based multi-component model of nutrition and lifestyle interventions on behavior modification, anthropometry and metabolic risk profile of urban Asian Indian adolescents in North India. Eur. J. Clin. Nutr. 2010, 64, 364–373. [Google Scholar] [CrossRef] [PubMed] [Green Version]
- Smith, J.J.; Morgan, P.J.; Plotnikoff, R.C.; Dally, K.A.; Salmon, J.; Okely, A.D.; Finn, T.L.; Babic, M.J.; Skinner, G.; Lubans, D.R. Rationale and study protocol for the ‘active teen leaders avoiding screen-time’ (ATLAS) group randomized controlled trial: An obesity prevention intervention for adolescent boys from schools in low-income communities. Contemp. Clin. Trials 2014, 37, 106–119. [Google Scholar] [CrossRef] [PubMed] [Green Version]
- Smith, J.J.; Morgan, P.J.; Plotnikoff, R.C.; Dally, K.A.; Salmon, J.; Okely, A.D.; Finn, T.L.; Lubans, D.R. Smart-phone obesity prevention trial for adolescent boys in low-income communities: The ATLAS RCT. Pediatrics 2014, 134, e723–e731. [Google Scholar] [CrossRef] [Green Version]
- Sutherland, R.; Campbell, E.; Lubans, D.R.; Morgan, P.J.; Okely, A.D.; Nathan, N.; Wolfenden, L.; Jones, J.; Davies, L.; Gillham, K.; et al. A cluster randomised trial of a school-based intervention to prevent decline in adolescent physical activity levels: Study protocol for the ‘Physical Activity 4 Everyone’ trial. BMC Public Health 2013, 13, 57. [Google Scholar] [CrossRef] [Green Version]
- Sutherland, R.; Campbell, E.; Lubans, D.R.; Morgan, P.J.; Okely, A.D.; Nathan, N.; Wolfenden, L.; Wiese, J.; Gillham, K.; Hollis, J.; et al. ‘Physical Activity 4 Everyone’ school-based intervention to prevent decline in adolescent physical activity levels: 12 month (mid-intervention) report on a cluster randomised trial. Br. J. Sports Med. 2016, 50, 488–495. [Google Scholar] [CrossRef] [Green Version]
- Viggiano, E.; Di Costanzo, A.; Andreozzi, E.; Romano, V.; Rianna, I.; Vicidomini, C.; Gargano, G.; Incarnato, L.; Fevola, C.; Volta, P.; et al. Kaledo, a board game for nutrition education of children and adolescents at school: Cluster randomized controlled trial of healthy lifestyle promotion. Eur. J. Pediatrics 2015, 174, 217–228. [Google Scholar] [CrossRef]
- Whittemore, R.; Jeon, S.; Grey, M. An internet obesity prevention program for adolescents. J. Adolesc. Health 2013, 52, 439–447. [Google Scholar] [CrossRef] [Green Version]
- Ebbeling, C.B.; Feldman, H.A.; Chomitz, V.R.; Antonelli, T.A.; Gortmaker, S.L.; Osganian, S.K.; Ludwig, D.S. A randomized trial of sugar-sweetened beverages and adolescent body weight. N. Engl. J. Med. 2012, 367, 1407–1416. [Google Scholar] [CrossRef] [Green Version]
- Stone, E.J.; McKenzie, T.L.; Welk, G.J.; Booth, M.L. Effects of physical activity interventions in youth. Review and synthesis. Am. J. Prev. Med. 1998, 15, 298–315. [Google Scholar] [CrossRef]
- Waters, E.; de Silva-Sanigorski, A.; Hall, B.J.; Brown, T.; Campbell, K.J.; Gao, Y.; Armstrong, R.; Prosser, L.; Summerbell, C.D. Interventions for preventing obesity in children. Cochrane Database Syst. Rev. 2011, CD001871. [Google Scholar] [CrossRef] [PubMed]
- Wang, Y.C.; McPherson, K.; Marsh, T.; Gortmaker, S.L.; Brown, M. Health and economic burden of the projected obesity trends in the USA and the UK. Lancet (Lond. Engl.) 2011, 378, 815–825. [Google Scholar] [CrossRef]
- Marcus, M.D.; Hirst, K.; Kaufman, F.; Foster, G.D.; Baranowski, T. Lessons learned from the HEALTHY primary prevention trial of risk factors for type 2 diabetes in middle school youth. Curr. Diab. Rep. 2013, 13, 63–71. [Google Scholar] [CrossRef] [PubMed] [Green Version]
- Chen, J.-L.; Guedes, C.M.; Cooper, B.A.; Lung, A.E. Short-Term Efficacy of an Innovative Mobile Phone Technology-Based Intervention for Weight Management for Overweight and Obese Adolescents: Pilot Study. Interact. J. Med. Res. 2017, 6, e12. [Google Scholar] [CrossRef]
- Bagherniya, M.; Mostafavi Darani, F.; Sharma, M.; Maracy, M.R.; Allipour Birgani, R.; Ranjbar, G.; Taghipour, A.; Safraian, M.; Keshavarz, S.A. Assessment of the Efficacy of Physical Activity Level and Lifestyle Behavior Interventions Applying Social Cognitive Theory for Overweight and Obese Girl Adolescents. J. Res. Health Sci. 2018, 18, e00409. [Google Scholar]
- Freedman, D.S.; Mei, Z.; Srinivasan, S.R.; Berenson, G.S.; Dietz, W.H. Cardiovascular risk factors and excess adiposity among overweight children and adolescents: The Bogalusa Heart Study. J. Pediatr. 2007, 150, 12–17.e12. [Google Scholar] [CrossRef]
- Turconi, G.; Celsa, M.; Rezzani, C.; Biino, G.; Sartirana, M.A.; Roggi, C. Reliability of a dietary questionnaire on food habits, eating behaviour and nutritional knowledge of adolescents. Eur. J. Clin. Nutr. 2003, 57, 753–763. [Google Scholar] [CrossRef] [Green Version]
- Baranowski, T.; Cullen, K.W.; Nicklas, T.; Thompson, D.; Baranowski, J. School-based obesity prevention: A blueprint for taming the epidemic. Am. J. Health Behav. 2002, 26, 486–493. [Google Scholar] [CrossRef]
- Gonzalez-Suarez, C.; Worley, A.; Grimmer-Somers, K.; Dones, V. School-based interventions on childhood obesity: A meta-analysis. Am. J. Prev. Med. 2009, 37, 418–427. [Google Scholar] [CrossRef]
- Harris, K.C.; Kuramoto, L.K.; Schulzer, M.; Retallack, J.E. Effect of school-based physical activity interventions on body mass index in children: A meta-analysis. CMAJ 2009, 180, 719–726. [Google Scholar] [CrossRef] [Green Version]
- Kropski, J.A.; Keckley, P.H.; Jensen, G.L. School-based obesity prevention programs: An evidence-based review. Obesity (Silver Spring, Md.) 2008, 16, 1009–1018. [Google Scholar] [CrossRef] [PubMed]
- Sharma, M. School-based interventions for childhood and adolescent obesity. Obes. Rev. 2006, 7, 261–269. [Google Scholar] [CrossRef] [PubMed]
- Stice, E.; Shaw, H.; Marti, C.N. A meta-analytic review of obesity prevention programs for children and adolescents: The skinny on interventions that work. Psychol. Bull. 2006, 132, 667–691. [Google Scholar] [CrossRef] [PubMed] [Green Version]
- Brown, T.; Summerbell, C. Systematic review of school-based interventions that focus on changing dietary intake and physical activity levels to prevent childhood obesity: An update to the obesity guidance produced by the National Institute for Health and Clinical Excellence. Obes. Rev. 2009, 10, 110–141. [Google Scholar] [CrossRef] [PubMed] [Green Version]
- Koplan, J.P.; Liverman, C.T.; Kraak, V.I.; Committee on Prevention of Obesity in Children and Youth. Preventing childhood obesity: Health in the balance: Executive summary. J. Am. Diet Assoc. 2005, 105, 131–138. [Google Scholar] [CrossRef]
- Yackobovitch-Gavan, M.; Wolf Linhard, D.; Nagelberg, N.; Poraz, I.; Shalitin, S.; Phillip, M.; Meyerovitch, J. Intervention for childhood obesity based on parents only or parents and child compared with follow-up alone. Pediatr. Obes. 2018, 13, 647–655. [Google Scholar] [CrossRef]
- Anderson, M.; Jiang, J. Teens, Social Media & Technology 2018. Available online: https://www.pewinternet.org/2018/05/31/teens-technology-acknowledgements/ (accessed on 20 April 2020).
- Gillespie, J.; Midmore, C.; Hoeflich, J.; Ness, C.; Ballard, P.; Stewart, L. Parents as the start of the solution: A social marketing approach to understanding triggers and barriers to entering a childhood weight management service. J. Hum. Nutr. Diet. 2015, 28 (Suppl. 1), 83–92. [Google Scholar] [CrossRef]
- Murtagh, J.; Dixey, R.; Rudolf, M. A qualitative investigation into the levers and barriers to weight loss in children: Opinions of obese children. Arch. Dis. Child 2006, 91, 920–923. [Google Scholar] [CrossRef] [Green Version]
- Australian Bureau of Statistics. Australian Aboriginal and Torres Strait Islander Health Survey: Updated Results, 2012–2013; ABS: Canberra, Australia, 2014.
- Vos, T.; Barker, B.; Begg, S.; Stanley, L.; Lopez, A.D. Burden of disease and injury in Aboriginal and Torres Strait Islander Peoples: The Indigenous health gap. Int. J. Epidemiol 2009, 38, 470–477. [Google Scholar] [CrossRef] [Green Version]
- Macartney, S.B.A.; Fontenot, K. Poverty Rates for Selected Detailed Race and Hispanic groups by State and Place: 2007–2011; U.S Census Bureau: Suitland-Silver Hill, MD, USA, 2013; p. 20.
- Foundation, K.F. Poverty Rate by Race/Ethnicity. Available online: https://www.kff.org/other/state-indicator/poverty-rate-by-raceethnicity/?currentTimeframe=0&sortModel=%7B%22colId%22:%22Location%22,%22sort%22:%22asc%22%7D (accessed on 15 September 2019).
- Willows, N.D.; Hanley, A.J.; Delormier, T. A socioecological framework to understand weight-related issues in Aboriginal children in Canada. Appl. Physiol. Nutr. Metab. 2012, 37, 1–13. [Google Scholar] [CrossRef]
- Sherriff, S.; Baur, L.; Lambert, M.; Dickson, M.; Eades, S.; Muthayya, S. Aboriginal childhood overweight and obesity: The need for Aboriginal designed and led initiatives. Public Health Res. Pract. 2019, 29, e2941925. [Google Scholar] [CrossRef] [PubMed] [Green Version]
- Moubarac, J.C. Persisting problems related to race and ethnicity in public health and epidemiology research. Rev. Saude Publica 2013, 47, 104–115. [Google Scholar] [CrossRef] [PubMed]
- Hayba, N.; Partridge, S.R.; Nour, M.M.; Grech, A.; Allman Farinelli, M. Effectiveness of lifestyle interventions for preventing harmful weight gain among young adults from lower socioeconomic status and ethnically diverse backgrounds: A systematic review. Obes. Rev. 2018, 19, 333–346. [Google Scholar] [CrossRef] [PubMed]


| First Author, Year, Country, Citation | Duration & Follow-Up | Study Characteristics | Participant Characteristics | Recruitment Methods | Funding | |||
|---|---|---|---|---|---|---|---|---|
| Study Design, Setting | Intervention Description/Comparator Description | n | Age | Ethnic/Racial Group | Sex | |||
| (a) Study and Participant Characteristics of interventions in the systematic review of effectiveness of prevention interventions for adolescents from ethnic/racial minorities (n = 7). | ||||||||
| Multicomponent Interventions | ||||||||
| Singh et al. 2006 [59], 2007 [60], 2009 [61] Netherlands RCT School | 8 mo (12, 20 mo) | Diet & PA, Environmental, Intervention mapping, Education, behaviour-change. I: 11 sessions on energy-related behaviours and reducing SSB, SB, High fat snacks + increasing active transport and sports. Individually computer-tailored advice, diary, pedometers + supportive video material. C: regular curriculum. | 1053, I:632C:476 | M: C: 12.9 ± 0.5 SD), I: 12.8 ± 0.5 (SD), F: C: 12.7 ± 0.5 (SD), I: 12.6 ± 0.5 (SD) | Ethnicity was tested in the regression model to determine any intervention but no stratified results shown. | F, M (50%) | Universal | Netherlands Heart Foundation, Ministry of VWS, Royal Association of Teachers of Physical Education |
| Black et al. 2010 [33] USA RCT Community | 12 wks (24 mo) | Diet & PA, Education, SCT & MI I: 12 sessions with mentees. D and PA goals setting, tracking and evaluation. Healthy food testing + PA activity. C: No intervention | 235, I:121, C:114 | 13.3 (11–16) | African American | I: F, M (48.8%), C: F, M (52.6%) | Targeted African American adolescents from low-income urban communities. | US Department of HHS, NCRR |
| Chen et al. 2011 [36] USA RCT Community (Internet) | 8 wks (6 mo) | Diet & PA, Educational, TTM, SCT, Parental Involvement I: 8 sessions teaching participants + parents on emotions, goals and self-efficacy for a healthy lifestyle. Culturally appropriate. C: Received non-tailored general health info from website | 54 I: 27, C: 27 | 12.52 ± 3.15 (SD) | NR | I: F, M (41%), C: F, M (52%) | Universal | NCRR, Hellman research grant, NIH |
| Ezendam et al. 2012 [28] Netherlands Cluster RCT School (Internet) | 10 wks (4, 24 mo) | Diet & PA, TPB, Precaution Adoption Process Model, Implementation Intentions, Education I: On healthy eating, reducing SB, increasing PA. Tailored feedback on behaviour + determinants to prompt goal setting and action planning. C: regular curriculum. | 883, I:485 C:398 | 12–13 | I: Western 66%, Non-Western 34%, C: Western 78.9%, Non-Western 21.1%, | I: F, M (58.6%) C: F, M (49.7%) | Universal | ZonMw (The Netherlands Organisation for Health Care Research and Development) |
| Whittemore et al.2013 [68] USA Cluster RCT School (Internet) | 6 mo | Diet & PA, SLT, Theory of Interactive Technology I: HeT program +stress reduction, assertive communication, conflict resolution and social problem skills) C: HeT program on nutrition, portion control, PA and metabolism. Individualized feedback and goal setting, encouraged self-monitoring of food intake and PA and opportunity to interact with health coach. | 384 | 15.31 ± 0.69 (SD) | 65% non-white | F, M (38%) | Universal | Jonas Centers for Nursing Excellence, NINR, NIH, |
| Single Component Dietary Interventions | ||||||||
| Ebbeling et al. 2006 [29] USA RCT Community | 25 wks | Diet, Environmental, Parental Involvement I: Home deliveries of non-caloric drinks. Magnets with possible side effects of SSBs mailed monthly. No SSB permitted. Telephone calls to participant + parent to reinforce and motivate. C: Continue as normal. Weekly non-caloric beverage delivery after completion of FU as incentive. | 103, I:53, C:50 | 15.9 ± 1.1 (SD) | White: C: 56%, I: 55%, Black: C: 24%, I: 24%, Asian: C: 4%, I: 4%, Multiple or other: C:17%, I: 18%, Hispanic: C: 17%, I: 25%, Non-Hispanic: C: 83%, I:75% | F, M (45.6%) | NR | None |
| Nollen et al. 2012 [50], 2014 [51], USA RCT Community (Internet) | 12 wks | D, Screen Time, Behaviour-based Both targeted F &V, SSB and Screen Time I: To set 2 daily goals + behaviour plan. Also prompted girls to self-monitor goal progression 5 times/day. Girls received 1 song/day if they responded to 80% of daily prompts C: Received manuals (snapshots of respective module) at wks 1, 5 and 9 only. | 51 | 11.3 ± 1.6 (SD) | Hispanic/Latina: total 7.8, Race: African American: 83.7 Bi- or Multi-racial: 8.2, American Indian/Alaska Native: 6.1, Asian/Pacific Islander: 2.0 | 100%F | Targeted: girls from racial and ethnic minorities from low income neighbourhoods | ORWH, NICHD, NIAID, NIMH, NHLBI |
| (b) Study and Participant Characteristics of interventions in the systematic review of effectiveness of prevention interventions for adolescents from ethnic/racial minorities (n = 24). | ||||||||
| Multicomponent Interventions | ||||||||
| Briancon et al. 2010 [35], France Bonsergent et al. 2013 [34], France RCT School | 24 wks | Education, Environmental, Screening, Parental Involvement 2 × 2 × 2 design, 3 Intervention types Education: Nutrition and PA lectures, problem solving re PA, eating habits and the environment. End of year parties for reinforcement. Environment: Increased availability of water, F & V, dairy, bread and PA in schools. Posters/signs promote changes. Screening: Students assessed against anthropometrics and psychological variables, at-risk students referred to care management implemented by external nutrition network. C: No intervention | 3538 | 15.8 ± 0.02 (SE) | NR | Sex: F, M (47.1%) | NR | Grants from Private and Public Sectors |
| Haerens et al. 2006 [40], Belgium Cluster-RCT School | 12 mo (24 mo) | Education, Environmental, TTM, TPB, Parental Involvement I: (Classroom lessons + individual computer tailored intervention for PA, fat and fruit + PA sessions and cheap/free fruit wkly. Schools received sports materials + free water cans.) I + P: Included Parental Involvement. Interactive meeting on PA, healthy food, obesity and health, newsletters, CD-ROM with computer intervention on fat intake and PA. C: NR | 13.06 ± 0.81 (SD) | NR | F, M (63.4%) | NR | Policy Research Centre Sport, Physical Activity, and Health funded by the Flemish Government | |
| Hollis et al. 2016 [41], Australia Sutherland et al. 2013 [65],2016 [66] Australia Cluster-RCT Schools | 19–24 mo | PA, Education, Environmental, Socio-ecological theory, SCT Parental Involvement I: Enhanced school sports program, strategies to increase PA in PE classes + school breaks + school policy changes, and parental + community engagement. C: Requested to follow usual PE and sports programs. | 1150 | 11–13 | Aboriginal and Torres Strait Islander, C: 8.8%, I: 8.4% | F, M (49%) | Universal | NSW Ministry of Health |
| Singhal et al. 2010 [62] India RCT School | 6 mo | Educational, Diet & PA, Environmental, Parental Involvement I: Lectures + activities to promote PA, diet, healthy lifestyle. Individual counselling, school policy changes, health camp with parents, parent counselling, training student volunteers C: No intervention | 201 | 15–17 | NR | F, M (60%) | Universal | World Diabetes Foundation |
| Thakur et al. 2016 [23], India Cluster-RCT School | 20 wks | Educational, Diet & PA, Environmental, Parental Involvement I: Diet and PA, environment, and lifestyle disorders. Mandatory inclusion one period of PA/day in school, healthy school canteen. Parents made Diet recommendations + reducing screen time. C: Diet and PA info if desired | 462 | 13.5 ± 0.7 (SD) | NR | F, M (81%) | Universal | Indian Council of Medical Research |
| Dunker et al. 2017 [38], Brazil Cluster-RCT School (Phone) | 9 wks (18 wks) | Education, PA, Diet, SCT, MI I: after-school PA and education. Individual counselling, didactic resources + lunch on days of activities C: No intervention | 270 | 13.4 ± 0.64 (SD) | NR | 100% F | Universal | Sao Paulo Research Foundation, CNPq |
| Leme et al. 2015 [43], 2016 [26], 2018 [42] Brazil Cluster-RCT School (Phone) | 6 mo (6 mo) | Diet & PA, Education, SCT, PI I: Cultural adaptation of NEAT Girls study, PA and low-cost healthy eating. C: No intervention | 253 | 14–18 | 62.8%% White, 11.5% Afro descendent, 0.8% Asian, 24.1% Brown, 0.8% Native Indian | 100% F | Universal | FAPESP, federal funds from USDA ARS |
| Lubans et al. 2010 [46],2012 [47] Australia Dewar et al. 2013 [37], Australia Cluster-RCT School (Phone) | 12 mo (2 yrs) | Diet & PA, Education, peer support, SCT, Parental Involvement I: Enhanced school sport & lunchtime PA, interactive educational seminars and nutrition workshops. Pedometers, handbooks for participants + parents and text prompt messages. Parents received termly newsletters. C: No intervention | 357 | 13.18 ± 0.45 (SD) | NR | 100% F | Universal | ARC Discovery Project Grant |
| Melnyk et al. 2013 [25], USA Cluster-RCT School | 15 wks (6 mo) | Educational, PA, CT, Parental Involvement I: Health education course with COPE taught cognitive-behavioural skills and focused on PA and diet info + PA sessions, homework activities, parental newsletters. Pedometers to increase step count 10%/wk. C: Received Healthy Teens program. Safety + common health topics (e.g., road safety, skin care, dental care). | 807 | 14.74 ± 0.73 (SD) | 2.5% American Native, 4% Asian, 9.9% black, 14.1% White, 67.5% Hispanic, 1% other | F, M (48.4%) | Universal | NIH, NINR |
| Neumark et al. 2010 [24] USA Cluster-RCT, School | 16 wks (9 mo) | Diet & PA, Education, SCT, TTM, Parental Involvement, MI I: New Moves curriculum during PE class. Nutrition education and social support/self-empowerment. Counselling sessions, lunch sessions and parent outreach activities. C: No intervention, told to conduct physical education classes as usual | 356 | 15.8 ± 1.17 (SD) | Over 75% of the girls were racial/ethnic minorities: Black/African America: 28.4% White: 24.4% Asian: 23% Hispanic: 14.3% Mixed/Other: 7.3% American Indian: 2.5% | 100% F | Targeted suburban areas for their diverse student bodies. | NIDDK, NIH |
| Patrick et al. 2006 [52] RCT Community (Primary Health Care Settings) (Phone) | 12 mo (2 yrs) | Behaviour change, TTM, Parental Involvement I: Participants participated in PACE+. Computer nutrition assessment (fat intake, F & V intake) + PA behaviours + stage of change, then developed a tailored behaviour change Progress Plan for 1 nutrition and 1 PA behaviour. Printed guide + telephone counselling + mailed worksheets and tips C: Received SunSmart Protection program.Parents encouraged to support via praising, active support and role-modelling. | 819 | 12.7 ± 1.3 (SD) | Asian or Pacific Islander: 3.2, African American: 6.6, Native American: 0.7, Hispanic: 13.1, White: 58.4, Multi-ethnic or other:18.0 | F, M (47%) | NR | NIH, NCI Bethesda, Md. |
| Peralta et al. 2009 [53] Australia RCT School | 16 wks (6 mo) | Educational, Diet & PA, SCT, Parental Involvement I: Received curriculum sessions on PA, SSB, ST, and increasing fruit consumption via increased self-efficacy. Practical components which promoted PA + parental newsletters. C: Regular PA sessions at same time. | 33 | 12.5 ± 0.4 | NR | M (100%) | Universal | Participating students, staff and broader intervention school community (partial) |
| Rodearmel et al. 2007 [55] USA RCT Community (household) | 24 wks | Diet and PA, I: To increase daily PA by 2000 steps/day + reduce EI by 420 kJ/day with changing sugar for non-caloric sweeteners C: Families were asked to maintain, monitor, and report their usual lifestyle for the duration of the study. All SM family members were asked to wear pedometers | 298 | I: 11.11 ± 2.08 (SD) C:11.28 ± 2.29 (SD) | I: White: 52.59% Black: 13.79% Hispanic: 13.79% Other: 19.38% NR: 0.00% C: White: 50.98% Black: 18.63% Hispanic: 12.75% Other: 15.69% NR: 1.96% | C: F, M (46%) I: F, M (49%) | Universal | McNeal Nutritionals, LLC, NIH |
| Single Component Dietary Interventions | ||||||||
| Amaro et al. 2006 [32], Italy Cluster-RCT School | 24 wks | Diet, Educational, Behaviour-change, I: Kaledo (board game) sessions re Mediterranean diet, energy intake, expenditure and balance. C: No Intervention | 291 | 11–14 | White | F, M (63%) | Universal | Italian Association Amici di Raoul Follereau, Commune of Naples, Second University of Naples |
| Mihas et al. 2009 [49], Greece Cluster-RCT School | 12 wks; (15 days + 12 mo) | Diet, Social Learning Theory Model, Parental Involvement I: Workbook covering dietary issues + dental healthy hygiene + consumption attitudes. Classroom modules included health and nutrition education. Included 2 educational parent meetings. C: No health education intervention + no parental education. Medical screening results sent to parents | 218 | 13.3 ± 0.9 (SD) | NR | C: F, M (49.5%) I: F, M (49%) | Universal | Ministry of Education, National Foundation for the Youth |
| Rabiei et al. 2017 [54], Iran RCT Schools | 2 mo, 3 mo | Educational, Diet, HBM, Parental Involvement I: Lectures, Q and A, educational booklets and pamphlets. Lectures targeted perceived susceptibility, severity and self-efficacy. C: NR | 140 | NR | NR | 100% F | Universal | Research Department of Isfahan University of Medical Sciences |
| Viggiano et al. 2015 [15], Italy Cluster-RCT School | 20 wks (6 + 8 mo) | Education, Diet, Behaviour-based I: Play sessions involving Kaledo (as per Amaro et al. 2006). C: No play sessions with Kaledo | 3110 | 9–19 | NR | F, M (55%) | Universal | Second University of Naples, Sport, Kaledo Cultural Association, Campania Region (Department of Education), Naples, Salerno, Cercola, Department of Sport, Foundation for Child Care |
| Single Component Environmental Interventions | ||||||||
| French et al. 2011 [27], USA Cluster-RCT Community (household) (Phone) | 1 yr | Environmental, Behaviour-based I: Group sessions, (time-limiting devices on TVs + home scale + guidelines for food availability), GS, positive reinforcement, self-monitoring), home activities + telephone support calls C: No intervention | 90 | 12–17 | 79% White | NR | Universal | NIH/NCI |
| Single Component Physical Activity Interventions | ||||||||
| Lindgren et al. 2011 [44], Sweden Cluster RCT School | 6 mo | PA, self-efficacy, Health Promotion I: Participants invited to master different exercise and sports activities in safe, non-judgmental environment with other non-active girls of similar age + discussion time (e.g., healthy lifestyles) C: No intervention | 110 | C: 15.5 ± 1.1 (SD), I: 15.3 ± 1.9 (SD) | NR | 100% F | Universal | Halland Regional Development Council, The Primary Health Care Research and Development Unit, Halland County Council, Falkenberg, Sweden. |
| Lubans et al. 2011 [45], 2016 [48] Australia Cluster-RCT School | 3 mo (6 mo) | Educational, PA, SCT I: Involved school sport and lunchtime PA sessions, interactive seminars, PA leadership + nutrition handbooks and pedometers for self-monitoring. C: No intervention | 100 | 14.3 ± 0.6 (SD) | NR | 100% M | Universal | HMRI, Rotary Club of Newcastle Enterprise |
| Simons et al. 2014 [58], 2015 [57] (Netherlands) RCT Community (Household) (Internet) | 10 mo | PA, Parental Involvement I: Received a PlayStation Move + 5 active video games. Encouraged to substitute non-active with active gaming for at least 1 hr/week C: No intervention | 270 | 13.9 ± 1.3 (SD) | White—83% | F, M (91%) | Universal | ZonMw—The Netherlands Organization for Health Research and Development |
| Smith et al. 2014 [63,64] Australia Cluster-RCT School (Phone) | 20 wks (8 + 18 mo) | Educational, PA, SDT, SCT, Parental Involvement I: Educational seminar, enhanced school sport +, lunch-time PA mentoring sessions. Pedometer + smartphone app for self-monitoring. School exercise equipment pack + 4 Parental newsletters C: Usual practice, provided with condensed program after 18-mo assessments. | 361 | 12.7 ± 0.5 (SD) | Australian 73.7%, European 17.3%, African 3.4%, Asian 1.7%, Middle Eastern 1.1% and other 2.8%. | 100% M | Universal | ARC, NHMRC NHFA Career Development Fellowship |
| Weeks et al. [22] 2012 Australia RCT School | 8 mo | PA I: 10 min of supervised jumping activities at beginning of each PE class C: Regular PE warm-ups and stretching directed by usual PE teacher | 99 | 13.8 ± 0.4 (SD) | NR | F, M (46%) | Universal | No external funding sources |
| First Author, Year, Citation, Country | Outcomes of Intervention | Intervention Subgroup Analysis by Racial/Ethnic Minority Status | Attrition (%) | Attrition Subgroup Analysis by Racial/Ethnic Minority Status | ||
| Primary | Secondary | Primary | Secondary | |||
| (a) Study outcomes of interventions in the systematic review of effectiveness of prevention interventions for adolescents from ethnic/racial minorities (n = 7) | ||||||
| Multicomponent Interventions | ||||||
| Singh et al. 2006 [59], 2007 [60], 2009 [61] Netherlands | F BMI ∆: −0.1 (−0.2 to 0.1) M BMI ∆: −0.0 (−0.1 to 0.2) Significant F BSF: −0.3 (−0.7 to 0.3) M BSF: −0.1 (−0.4 to 0.2) | Significant SSB F: −249 (−400 to −98), M: −287 (−527 to −47) Significant SB ∆: M at FU: −25 (−50.0 to −0.3) NS SB ∆: −22 (−55 to 2) | No effect | No effect | 21 | NR |
| Black et al. 2010 [33] USA | BMI z-score: −0.03 (0.06) SE (p = 0.574) Prevalence: −0.25 (0.09) (p = 0.006) | S & D: β = −2.21 (0.66) SE, (p = 0.001) β = −0.69 (0.31) SE (p = 0.026) at FU. Fibre: β = −4.37 (2.07) SE, (p = 0.036) F: β = 0.41 (0.18) SE(p = 0.021) PA: β = 10.76 (7.53) SE (p = 0.155) V: β = −0.18 (0.31) SE (p = 0.559) Milk: β = 0.13 (0.22) SE (p = 0.556) Non-diet soda: β = −0.04 (0.13) SE (p = 0.745) Fried foods: β = −0.08 (0.09) SE (p = 0.375) Calcium: β = 10.76 (7.53) SE (p = 0.155) Saturated Fat: β = −5.54 (3.37) SE (p = 0.102) Total Fat: β = 17.01 (9.28) SE (p = 0.069) Total energy: β = −459.73 (235.37) SE (p = 0.053) | NA (100% African American) | NA (100% African American) | 23.8 | NA (100% African American) |
| Chen et al. 2011 [36], USA | BMI: 0.01 (−0.3, 0.04), (p = 0.84) WHR: −0.01 (−0.01, −0.001), (p = 0.02) | F &V: 0.14 (0.06, 0.22) (p = 0.001) PA: 12.46 (6.62, 18.41) (p = 0.001) | NA (100% Chinese American) | NA (100% Chinese American) | 8.4 | NA (100% Chinese American) |
| Ezendam et al. 2012 [39] Netherlands | BMI: β = 0.14 (−0.17 to 0.45), WC: β = 0.60 (−0.44 to 1.64) | SSB (OR, 95% CI): 0.54 (0.34, 0.88) Snacks: β = −0.81 (−1.33, −0.29) V: β = 19.3 g/d (7.54, 31.21) At-risk students: F: β = 0.39 g/d (0.13, 0.66) Step Count: β = 14 228 steps/wk (678, 27,838) FU Whole Wheat Bread: OR 1.08 (0.67, 1.75) SB: β = −5.4 (−25.2, 14.5) | No effect | No effect | 14 | NR |
| Whittemore et al. 2013 [68] USA | BMI: I: 24.5 (5.4), 24.6 (5.4) C: 25.0 (5.7), 25.1 (5.6) (p = 0.87) | SB ∆: I: 5.6 (2.2), 5.3 (2.3), C: 5.4 (2.2), 5.2 (2.3) (p < 0.01) F&V: I: 4.9 (2.0), 5.1 (1.9), C: 5.0 (2.3), 4.9 (2.1) (p < 0.01) Total EB: I:56.8 (11.9), 56.4 (11.9), C: 56.6 (11.1), 57.2 (10.6) (p < 0.01) JF: I: 2.5 (2.2), 2.7 (2.4), C: 2.4 (2.0), 2.5 (1.9) (p < 0.01) VE: I: 4.1 (2.2), 4.1 (2.1), C: 3.7 (2.2), 4.1 (2.2) (p < 0.01) BF: I: 4.1 (2.6), 3.7 (2.7), C: 4.2 (2.4), 3.9 (2.5) (p = 0.9211) FF: I: 0.83 (1.09), 0.80 (1.03), C: 0.72 (0.91), 0.85 (1.00) (p = 0.0892) | No effect | No effect | 4.9 | NR |
| Single Component Dietary Interventions | ||||||
| Ebbeling et al. 2006 [29] USA | BMI: (−0.14 ± 0.21 kg/m2). If baseline BMI ≥ 25.6 kg/m: −0.75 ± 0.34 kg/m2, (p = 0.03) | SSB ∆: I: −1201± 836, C: −185 ± 945 (p < 0.001) Non caloric beverage ∆: I: 396 ± 493, C: 78 ± 523 (p = 0.002) PA∆: I: −0.12 ± 0.37, C: −0.03 ± 0.32 (p = 0.18) Television viewing∆: I: 0.05 ± 1.56, C: −0.19 ± 1.85 (p = 0.47) Total media time∆: I: −0.50 ± 2.56, C: −0.31 ± 3.33 (p = 0.75) | No effect | No effect | 0 | NR |
| Nollen et al. 2012 [50], 2014 [53] USA | ES = 0.03, (p = 0.91) | F&V: 0.44, (p = 0.13) SSB: −0.34 (p = 0.25) Screen time: 0.09 (p = 0.76) | No effect | No effect | 13.7 | NR |
| First Author, Year, Citation, Country | Outcomes of Intervention | Attrition (%) | Attrition Subgroup Analysis by Racial/Ethnic Minority Status | |||
| Primary | Secondary | |||||
| (b) Study outcomes of interventions in the systematic review of effectiveness of prevention interventions for adolescents from ethnic/racial minorities (n = 24) | ||||||
| Multicomponent Interventions | ||||||
| Briancon et al. 2010 [35] France Bonsergent et al. 2013 [34] France | Education BMI ∆: 0.71 ± 1.49 (p < 0.0001) BMI z-Score ∆: −0.07 ± 0.44 (p < 0.0001) No Education BMI ∆: 0.66 ± 1.45 (p < 0.0001) BMI z-Score: −0.07 ± 0.43 (p < 0.0001) Education vs. No Education: BMI ∆: 0.05 (−0.05, 0.15) (p = 0.2858) BMI z-score ∆: 0.004 (−0.026, 0.034) (p = 0.8118) Environment: BMI ∆: 0.71 ± 1.47 (p < 0.0001) BMI Z-score ∆: −0.06 ± 0.44 (p < 0.0001) Non Environment BMI ∆: 0.67 ± 1.47 (p < 0.0001) BMI Z-score ∆: −0.07 ± 0.43 (p < 0.0001) Environment vs. non environment: BMI ∆: 0.03 (−0.07, 0.13) (p = 0.5028) BMI z-score ∆: 0.005 (−0.025, 0.035) (p = 0.7460) Screening BMI ∆: 0.64 ± 1.44 (p < 0.0001), BMI z-score ∆: −0.09 ± 0.44 (p < 0.0001) No Screening BMI ∆: 0.72 ± 1.49 (p < 0.001) No screening BMI z-score ∆: −0.05 ± 0.43 (p < 0.0001) Screening vs. No screening: BMI ∆: −0.11 (−0.21, −0.01) (p = 0.303) BMI Z-score ∆: −0.036 (0.066, −0.007) (p = 0.0173) | N/A | 55.5 | NR | ||
| Haerens et al. 2006 [40] Belgium | M BMI: I + P: 19.24 ± 3.62, 19.79 ± 3.64, 20.52 ± 3.68 I: 19.32 ± 3.35, 19.98 ± 3.35, 20.86 ± 3.51 C: 18.58 ± 2.91, 18.99 ± 2.82, 19.67 ± 2.89 M BMI z-score: I + P: 0.07 ± 1.09, 0.17 ± 1.03, 0.16 ± 1.04 I: 0.10 ± 1.02, 0.22 ± 0.97, 0.25 ± 0.98 C: −0.07 ± 0.98, −0.02 ± 0.092, −0.04 ± 0.94 P = NS (NR) F BMI: I + P: 20.26 ± 3.95, 20.75 ±3.90, 21.34 ± 3.83 P = Significant (NR) I: 20.23 ± 3.60, 20.94 ± 3.54, 21.66 ± 3.68 C: 19.23 ± 3.52, 19.94 ± 3.65, 20.78 ± 3.66 P = NS (NR) F BMI z-score: I + P: 0.07 ± 1.09, 0.28 ± 1.08, 0.23 ± 1.12 P = Significant (NR) I: 0.09 ± 1.06, 0.39 ± 0.90, 0.27 ± 0.96 C: 0.07 ± 0.98, 0.11 ± 1.03, −0.01 ± 1.06 P = NS (NR) | n/A | NR | NR | ||
| Hollis et al. 2016 [41], Australia Sutherland et al. 2013 [65], 2016 [66] Australia | BMI ∆: −0.28 kg/m2 (−0.50; −0.06), (p = 0.01) −0.28 kg/m2 (−0.49; −0.06), (p = 0.01) FU BMI z-score ∆: −0.05 (−0.11; 0.01), (p = 0.13) −0.08 (−0.14; −0.02), (p = 0.02) FU Normal/Underweight: BMI ∆: −0.33 kg/m2 (−0.55; −0.10), (p = 0.01), BMI z-score ∆: −0.08 kg/m2 (−0.15; −0.01), (p = 0.01) FU Overweight BMI ∆: −0.39 kg/m2 (−1.01; 0.22), (p = 0.21) −0.18 kg/m2 (−0.80; 0.44), (p = 0.45) BMI z-score ∆: −0.07 (−0.21; 0.07), (p = 0.31) −0.00 (−0.14; 0.14), (p = 0.54). | n/A | 8.6 (14.3) | NR | ||
| Singhal et al. 2010 [62] India | BMI ∆:95% CI (−0.18 to 0.34), (p = NR), WC ∆: −2.43 to −0.17 (p = 0.02) | Milk ∆: I: 32.8% (p < 0.001), C: 7.8 %, (p = 0.152 Whole pulses: I: 6.6 (p = 0.392), C:0.7 (p = 1) Sprouts (>2 times/wk), I: 3.7 % (0.648), C: 2.5% (p = 0.644), Nuts: I: 9.4 % (p = 0.286), C: 14.9 % (p = 0.111), Green leafy veggies: I: 7.5% (p = 0.349), C: 5.7% (p = 0.636), Fresh fruits: I: 9.9%, (p = 0.856), C: 6.5% (p = 0.268), White bread: I: 11%, (p = 0.004), C: 3.4% (p = 0.608) Biscuits: I: 7.9% (p = 0.430), C: 0.7% (p = 0.749), Aerated drinks: I: 15.1% (p = 0.001), C: 7.7% (p = 0.265), Aerated drink: I: 0.2%, (p = 1), C: 9.8% (p = 0.087), Western junk: I: 8.9%, (p = 0.031), C: 0.7% (p = 1) Chips: 7.8% (p = 0.152), C: 0.5% (p = 1), Indian junk: I:6% (p = 0.265), C: 0.8% (p = 1), PA: 2.4%, (p = 0.169), C: 5.9% (p = 0.377), PA (time): 9.8%, (p = 0.164), C: 3% (p = 0.755), Bring tiffin home, I: 14.9%, (p = 0.004), C:1.8%, (p = 0.263), Fruit in tiffin: I: 30.7% (p < 0.001), C: 3.9% (p = 0.585), Fruit in tiffin (>3 times/wk): 14.5%, (p = 0.001), C: 1% inc (p = 1) Household chores I: 8%, (p = 0.215), C: 2% (p = 0.839), Eating Out: I:1.7% (p = 0.143), C: 10.8% (p = 0.027). Eating out (canteen): I: 13.1%, (p = 0.001), C: No change, (p = 1), Watching TV: I: 4.9%, (p = 0.302), C: 3%, p = 0.629), Board game (sed activity): I:4%, (p = 0.503), C: 3%, (p = 0.607), Tuition classes (sed activity): I: 5% (p = 0.267), C: No change (p = 1) | 3.8 | NR | ||
| Thakur et al. 2016 [23] India | BMI ∆: −0.09 (−0.19 to 0.01) (p = 0.09) | Energy change: −0.18 (−0.34 to−0.02) (p = 0.02), Protein: −0.25 (−0.40 to −0.10) (p = 0.001), Fat: −0.30 (−0.47 to −0.13) (p = 0.01), Dietary fibre: −0.22 (−0.42 to 0.02) (p = 0.03) School related MET: −0.56 (−0.75 to −0.37) (p < 0.001), Transport related MET: 0.30 (0.12 to 0.48) (p = 0.001), Total METs score: 0.06 (−0.12 to 0.25) (p = 0.50) | 19.3 | NR | ||
| Dunker et al. 2017 [38] Brazil | BMI: I: 21.6 (95% CI 20.75, 22.45), C: 22.28 (95% CI 21.47, 23.1) | n/A | 15.2 | NR | ||
| Leme et al. 2015 [43], 2016 [26], 2018 [42] Brazil | BMI ∆:−0.26 kg/m2 (p = 0.08) BMI z-score ∆: −0.07 (p = 0.14) WC ∆: −2.28 cm (p = 0.01) Prevalence of Overweight: I (20.4% vs. 19%), C: (16.2% to 18%) | F: 0.26 (0.13) (p = 0.010), V: 1.16 (0.60) (p = 0.009) Sweets: −0.62 (0.39) (p = 0.109) Oils: −0.48 (0.39) (p = 0.229) Sedentary (wknd): −0.92 (0.35) (p = 0.005) Computer time (wknd): −0.63 (0.24) (p = 0.015) | 24.9 | NR | ||
| Lubans et al. 2010 [46], 2012 [47] Australia Dewar et al. 2013 [37] Australia | BMI ∆: −0.19 (−0.70 to 0.33), 0.33 (−0.97 to 0.28) (p = 0.353) FU BMI z score ∆: −0.08 (−0.20 to 0.04), −0.12 (−0.27, 0.04), (p = 0.178) FU Body Fat ∆: −1.96, (−3.02, 0.89) (p = 0.006) | NS | 17.6 (33.6) | NR | ||
| Melnyk et al. 2013 [25] USA | BMI ∆: −0.20 (−0.35, −0.05) (p = 0.01), −0.34 (−0.56, −0.11) (p = 0.00) Proportion overweight: 0.45 (0.42, 50) (p = 0.03) | Steps/day ∆: 4061.83 (1437, 6686.66) (p = 0) | 13.6 (22.3) | NR | ||
| Neumark et al. 2010 [24] USA | BMI: −0.08 (p = 0.512), −0.10 (p = 0.446) FU | PA: 0.08 (p = 0.894), 1.20, (p = 0.068) F&V: 0.24 (p = 0.365), SSB: −0.05 (p = 0.751) Sedentary activity: −0.12, (p = 0.834), −1.26 (p = 0.050), TV: 0.51 (p = 0.158), −0.05 (p = 0.883) | 3.1 (5.6) | NR | ||
| Patrick et al. 2006 [52] | F: (p = 0.069), M: (p = 0.53) | Sedentary behaviours: F I: 4.3 to 3.4 h/d C:4.2 to 4.4 h/d (p = 0.001), M I: 4.2 to 3.2 h/d C:4.2 to 4.3 h/d (p = 0.001) M Active Time I: 4.1 to 4.4 d/wk C: 3.8 to 3.8 d/w (p = 0.01), F Fat intake: RR 1.33 (1.01–1.68) M PA: RR 1.47 (1.19–1.75) | 7.3 (19.3) | No effect | ||
| Peralta et al. 2009 [53] Australia | BMI ∆: −0.2 (−0.8, 0.4) ES = 0.05 (p = 0.50) WC ∆: −1.7 (−4.7, 1.4), ES = 0.15 (p = 0.27) | SSB: −0.5 (−2.5, 1.6), ES = 0.12 (p = 0.65) Fresh fruit: 3.0 (−1.5, 7.6), ES = 0.33 (p = 0.18) Moderate PA: 3.8 (−34.8, 42.2), ES = 0.08 (p = 0.84) SSR wknd: −0.7 (−5.8, 4.4), ES = 0.08 (p = 0.78) SSR wkday: −1.1 (−5.1, 2.8), ES = 0.19 (p = 0.56) | 3 | NR | ||
| Rodearmel et al. 2007 [55] USA | BMI z score ∆: −0.027 (−0.075 to 0.022) (p = 0.282) WC ∆: 0.463 (& 1.704 to 0.778) (p = 0.462) BMI z score I: 67% C: 53% (p < 0.05) I: 47% C: 33% (p < 0.05) | Steps/day: (p < 0.05) | 15.6 | NR | ||
| Single Component Dietary Interventions | ||||||
| Amaro et al. 2006 [32] Italy | I: 0.345 (0.299–0.390) C: 0.405 (0.345–0.465) (p = NR) | V: 21.2 (p = 0.01), I: 3.7 (3.5–4.1), C: 2.8 (2.4–3.3) PA: I: 2.1 95% C.I (1.9–2.3), C: 2.2 (2.0–2.4) | 17.2 | NR | ||
| Mihas et al. 2009 [49] Greece | BMI: I: 23.3 (2.8) C:24.0 (3.1) (p < 0.001) | Energy: I:8112.4 (1412.4), C:8503.3 (1419.3) (p < 0.001) Fat: I: 31.3 (4.4), C:35.4 (4.7) (p < 0.001) Saturated Fat: I: 8.2 (1.7) (p < 0.001), 12.4 (2.4) (p < 0.001) F intake: I: 5.9 (4.3) p = 0.036 | (4.6, 12.4) | NR | ||
| Rabiei et al. 2017 [54] Iran | BMI I: 26.82 (1.42), C: 27.19 (1.55) (p = 0.17), I: 26.7 (1.38), 27.13 (1.56) (p = 0.09) FU | n/A | NR | NR | ||
| Viggiano et al. 2015 [67] Italy | Significant in Middle School at 6 mo (p = 0.007). Significant in high schools at 6 mo (p < 0.001) and at 18 mo (p = 0.015). | (30.7, 66.4) | NR | |||
| Single Component Environmental Interventions | ||||||
| French et al. 2011 [27] USA | BMI z score ∆: 0.0638 (0.10) (p = 0.53) | Significant F&V: 0.4658 (0.23) (p = 0.05) TV time: −14.45 (11.79) (p = 0.23) Fast food: 0.3847 (0.35) (p = 0.27) SSB: −0.0071 (0.16) p = 0.96 Snack/sweet: 0.1879 (0.26) p = 0.48 | 3.3 | NR | ||
| Single Component Physical Activity Interventions | ||||||
| Lindgren et al. 2011 [44] Sweden | NS, ES NR I: 21.9 (14.3–37.2), C: 23.2 (16.1–32) (p = 0.696). | PF I: 38.0 (19–86), C: 42 (22–69) (p = 0.675). | 43.6 | NR | ||
| Lubans et al. 2011 [45], 2016 [48] Australia | BMI ∆: 0.07 (−34, 38) (p = 0.656) BMI z-score ∆: 0.04 (0.07, 0.14) (p = 0.485), WC ∆: 0.3(−0.71, 1.4) (p = 0.549) | Screen Time: −32.2 (−53.6, −10.8) (p = 0.003) SSB = 0.2 (−0.04, 0.7) (p = 0.561) MVPA %: 0.1 (−0.8, 1.0) (p = 0.805) | 10 (18) | NR | ||
| Simons et al. 2014 [58], 2015 [57] Netherlands | BMI-SDS: β = 0.074, 95%CI: 0.008,0.14 Sum of skinfolds: β = 3.22, 95%CI: 0.27,6.17 | Non-active video game time: β = −1.76, 95%CI: −3.20,−0.32 Total Sed ST: β = 0.81,95%CI:0.74,0.88 SSB, OR = 0.65 (0.41;1.03), Snacks OR = −1.12 (−2.75,0.50) | 10 (4.8) | No effect | ||
| Smith et al. 2014 [63,64] Australia | BMI ∆: 0.06 ± 0.12 (p = 0.84) WC ∆: 0.5 ± 0.45 (p = 0.16) | Screen Time: −30 ± 10.08, (p = 0.03) SSB: −0.6 ± 0.26, (p = 0.01) | (18.8, 26.3) | NR | ||
| Weeks et al. 2012 [22] Australia | BMI: I: 20 (3.5), 20.5 (3.3) C: 20 (3.5), 20.4 (3.7) p = 0.895 Weight: I: 53.4 (12.4), 56.6 (12) (p = 0.09), C: 53.2 (11.9), 56.5 (13.1) (p = 0.951) Lean mass: I: 34,699 (7110), 36,993 (7591), C: 31,993 (4221), 32,974 (5148) (p = 0.002) | 18.2 | NR | |||
| Category | Rating with Reasoning |
|---|---|
| Limitations | −2 quality due to limitations |
| Consistency | No subtraction |
| Directness | −1 quality level due to population |
| Precision | −1 due to lack of precision |
| Publication | −1 quality levels, as publication bias cannot be ruled out |
| Overall Quality | Low: effect confidence is limited |
© 2020 by the authors. Licensee MDPI, Basel, Switzerland. This article is an open access article distributed under the terms and conditions of the Creative Commons Attribution (CC BY) license (http://creativecommons.org/licenses/by/4.0/).
Share and Cite
Hayba, N.; Elkheir, S.; Hu, J.; Allman-Farinelli, M. Effectiveness of Lifestyle Interventions for Prevention of Harmful Weight Gain among Adolescents from Ethnic Minorities: A Systematic Review. Int. J. Environ. Res. Public Health 2020, 17, 6059. https://0-doi-org.brum.beds.ac.uk/10.3390/ijerph17176059
Hayba N, Elkheir S, Hu J, Allman-Farinelli M. Effectiveness of Lifestyle Interventions for Prevention of Harmful Weight Gain among Adolescents from Ethnic Minorities: A Systematic Review. International Journal of Environmental Research and Public Health. 2020; 17(17):6059. https://0-doi-org.brum.beds.ac.uk/10.3390/ijerph17176059
Chicago/Turabian StyleHayba, Nematullah, Samiha Elkheir, Jessica Hu, and Margaret Allman-Farinelli. 2020. "Effectiveness of Lifestyle Interventions for Prevention of Harmful Weight Gain among Adolescents from Ethnic Minorities: A Systematic Review" International Journal of Environmental Research and Public Health 17, no. 17: 6059. https://0-doi-org.brum.beds.ac.uk/10.3390/ijerph17176059