Neuroanatomy of Patients with Deficit Schizophrenia: An Exploratory Quantitative Meta-Analysis of Structural Neuroimaging Studies

 ,
, 
Abstract
:1. Introduction
2. Materials and Methods
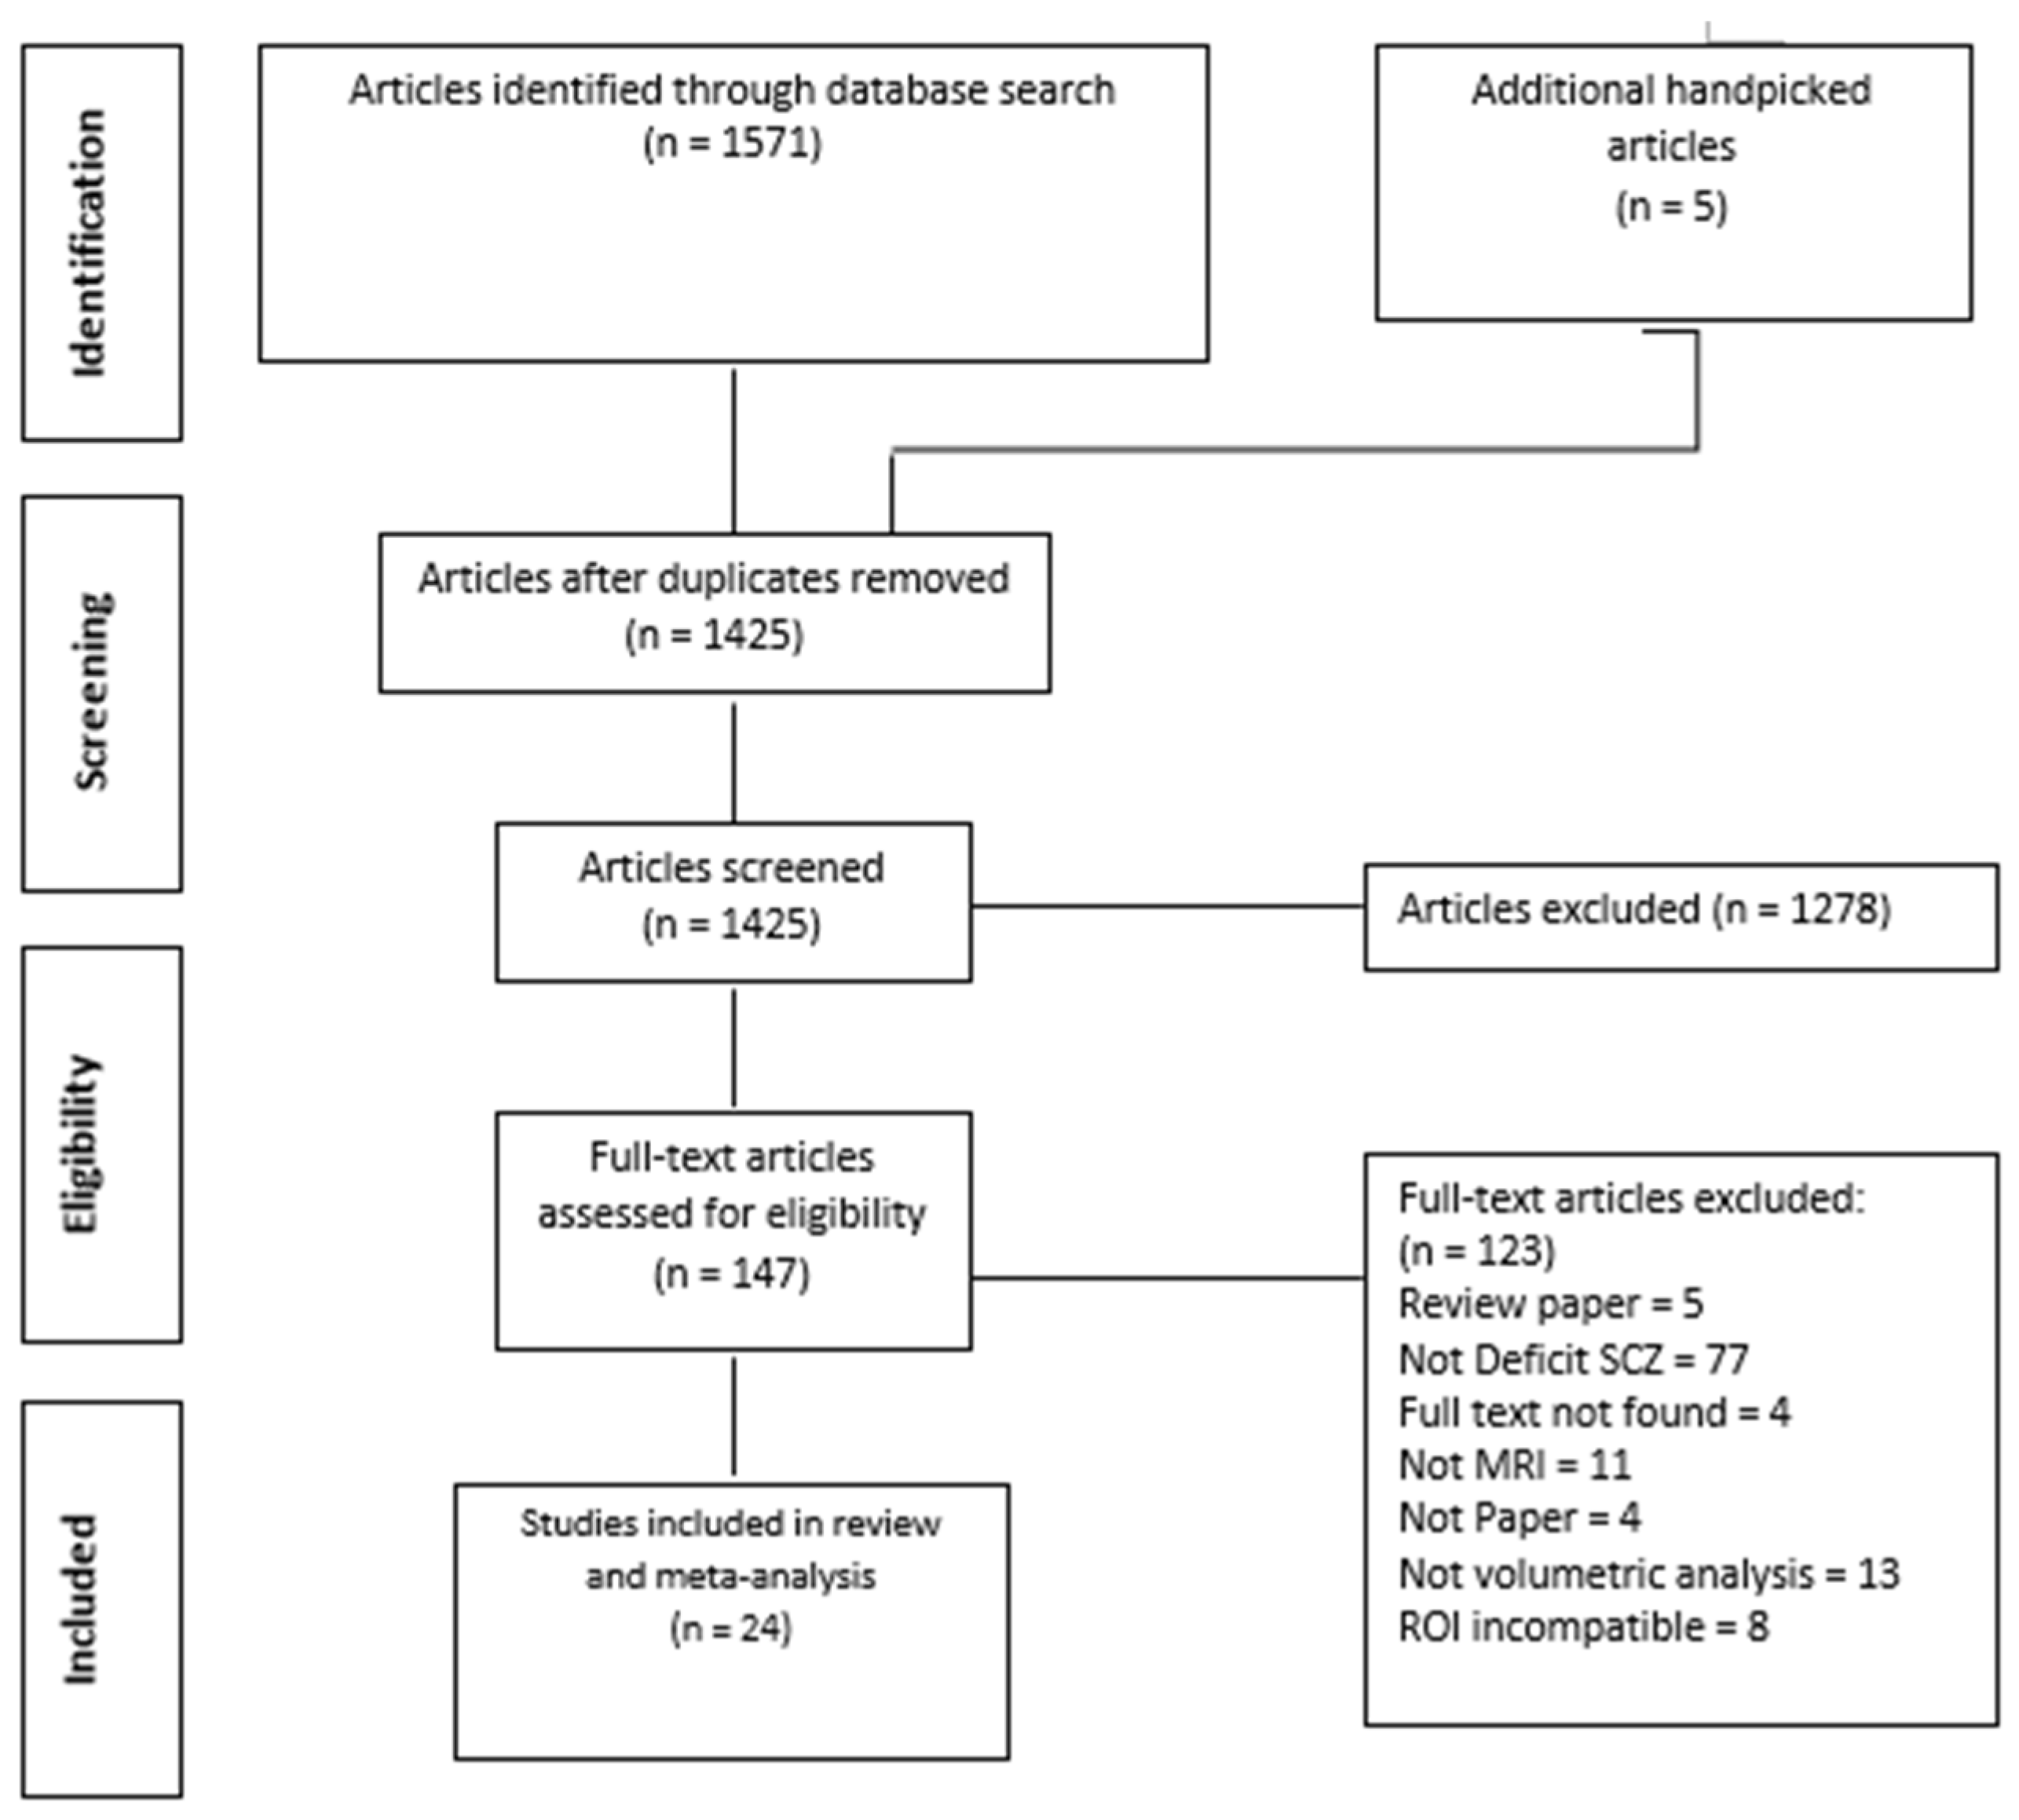
2.1. Search Strategy
2.2. Inclusion and Exclusion Criteria
2.3. Data Extraction and Quality Assessment
2.4. Statistical Analyses
3. Results
3.1. Characteristics of Studies
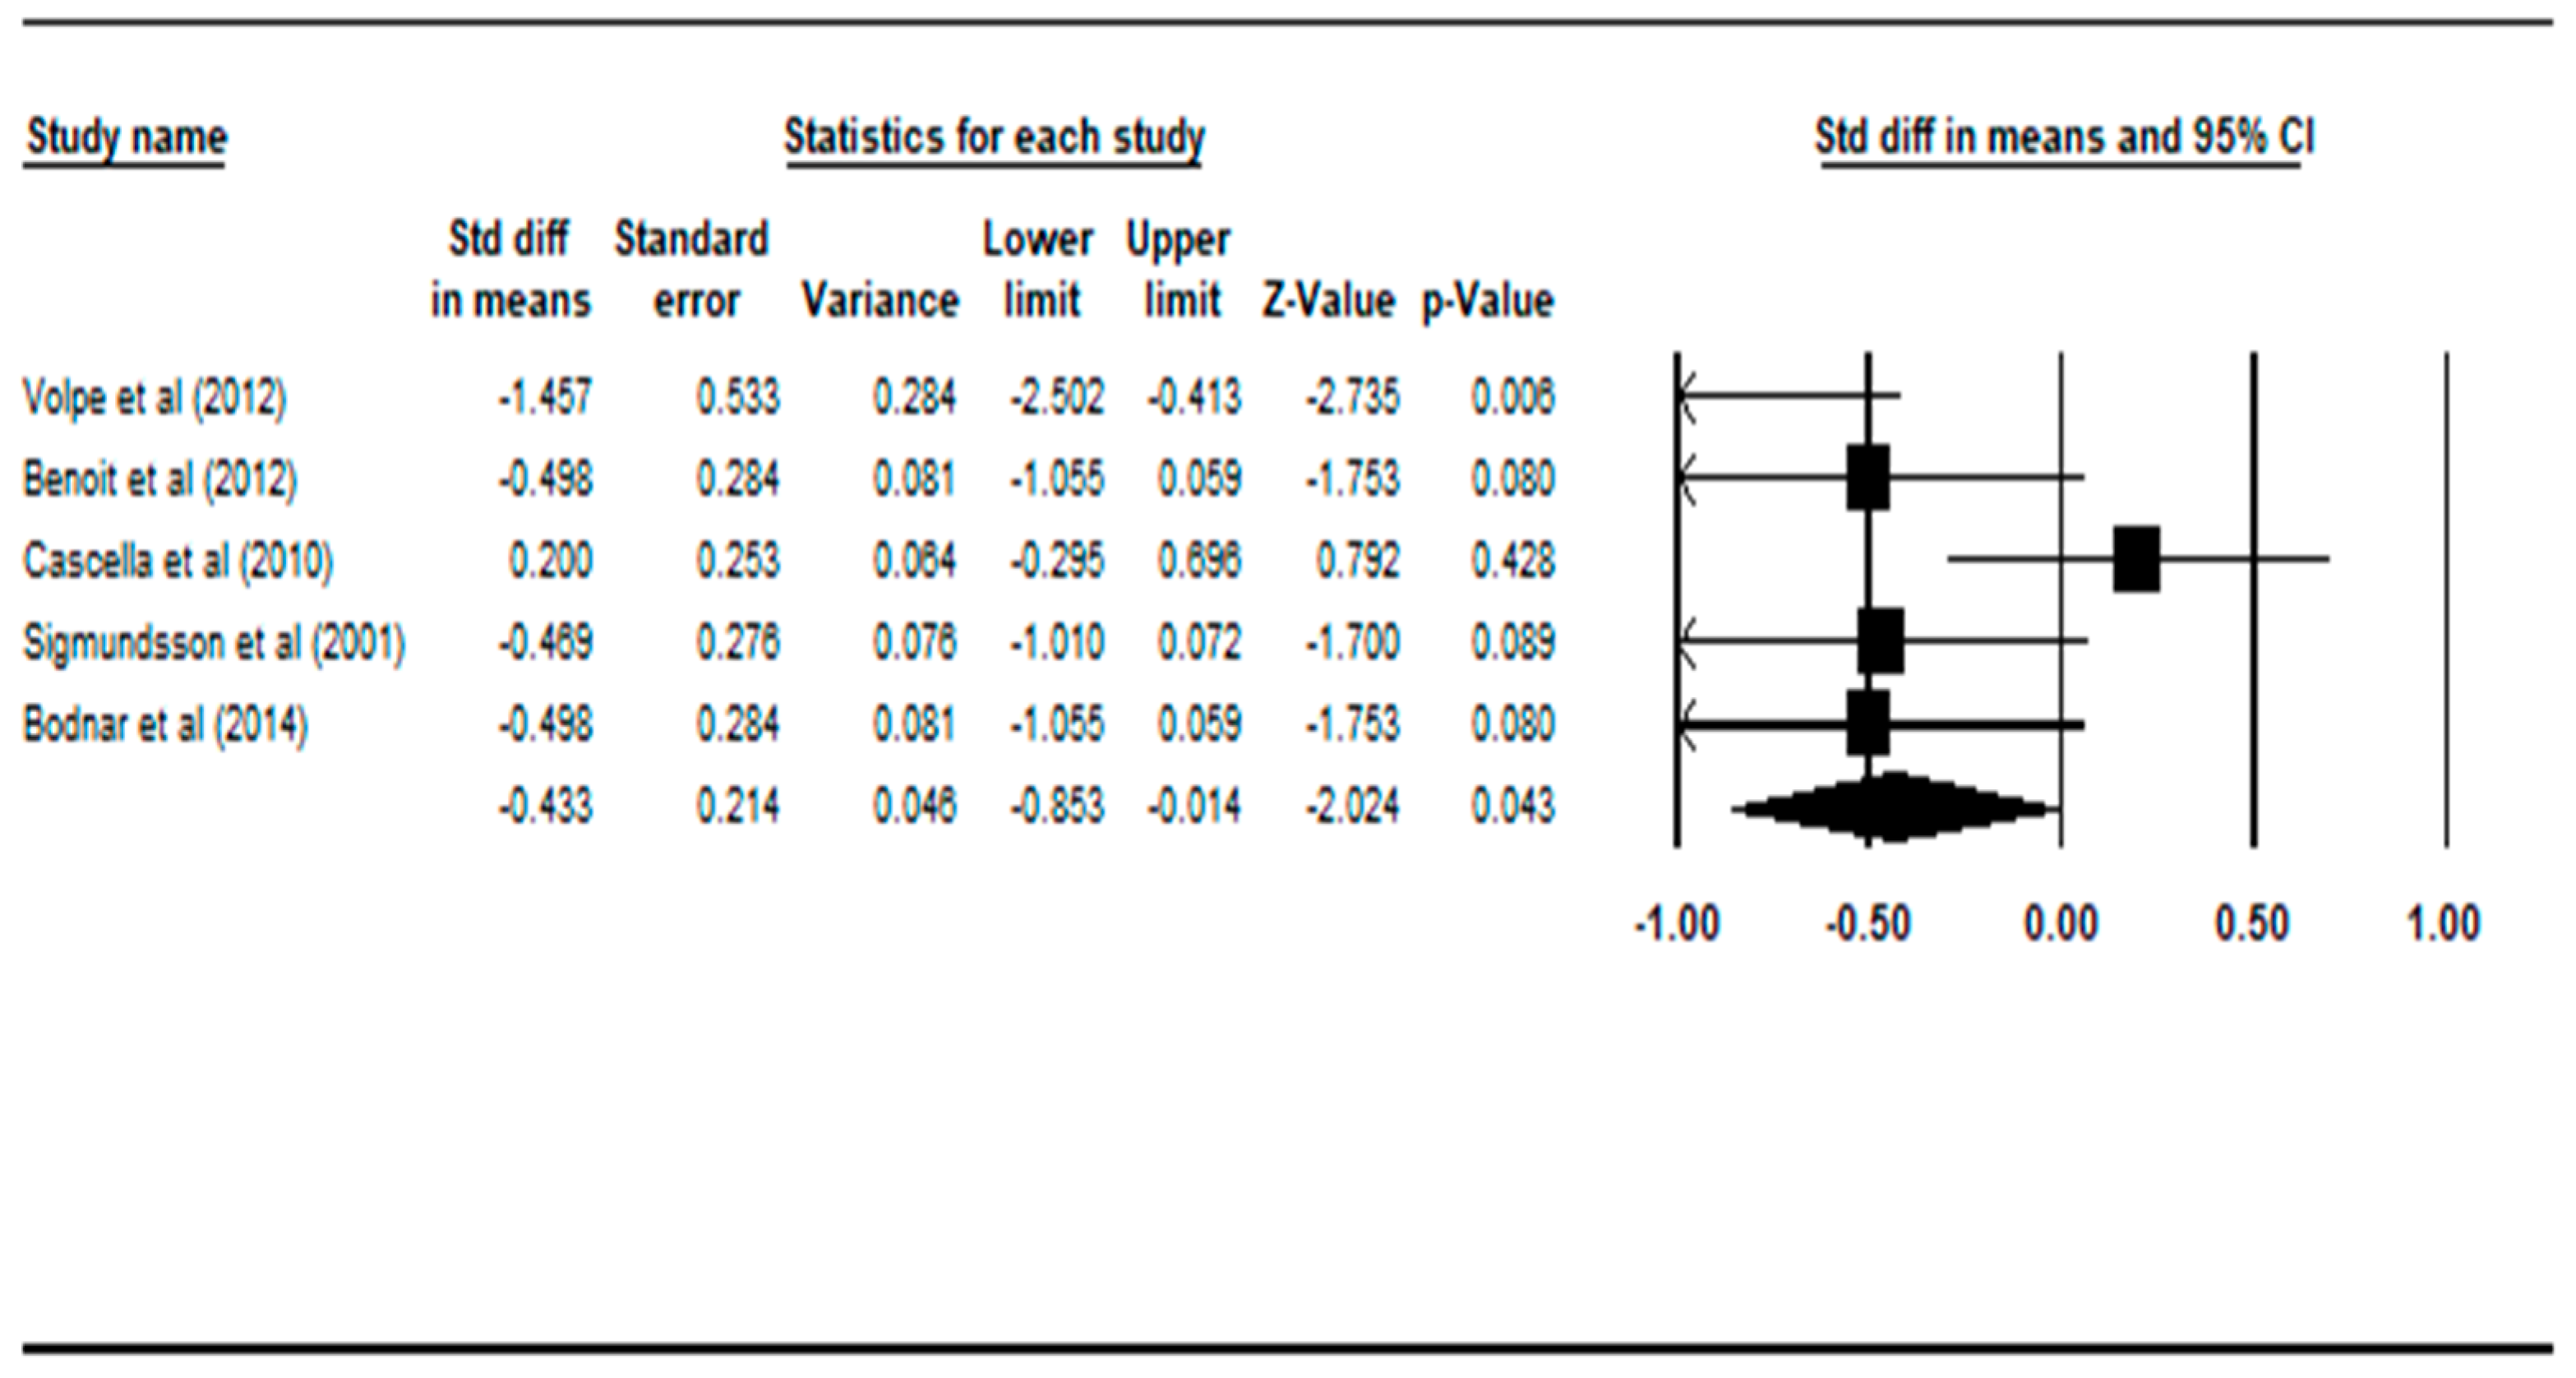
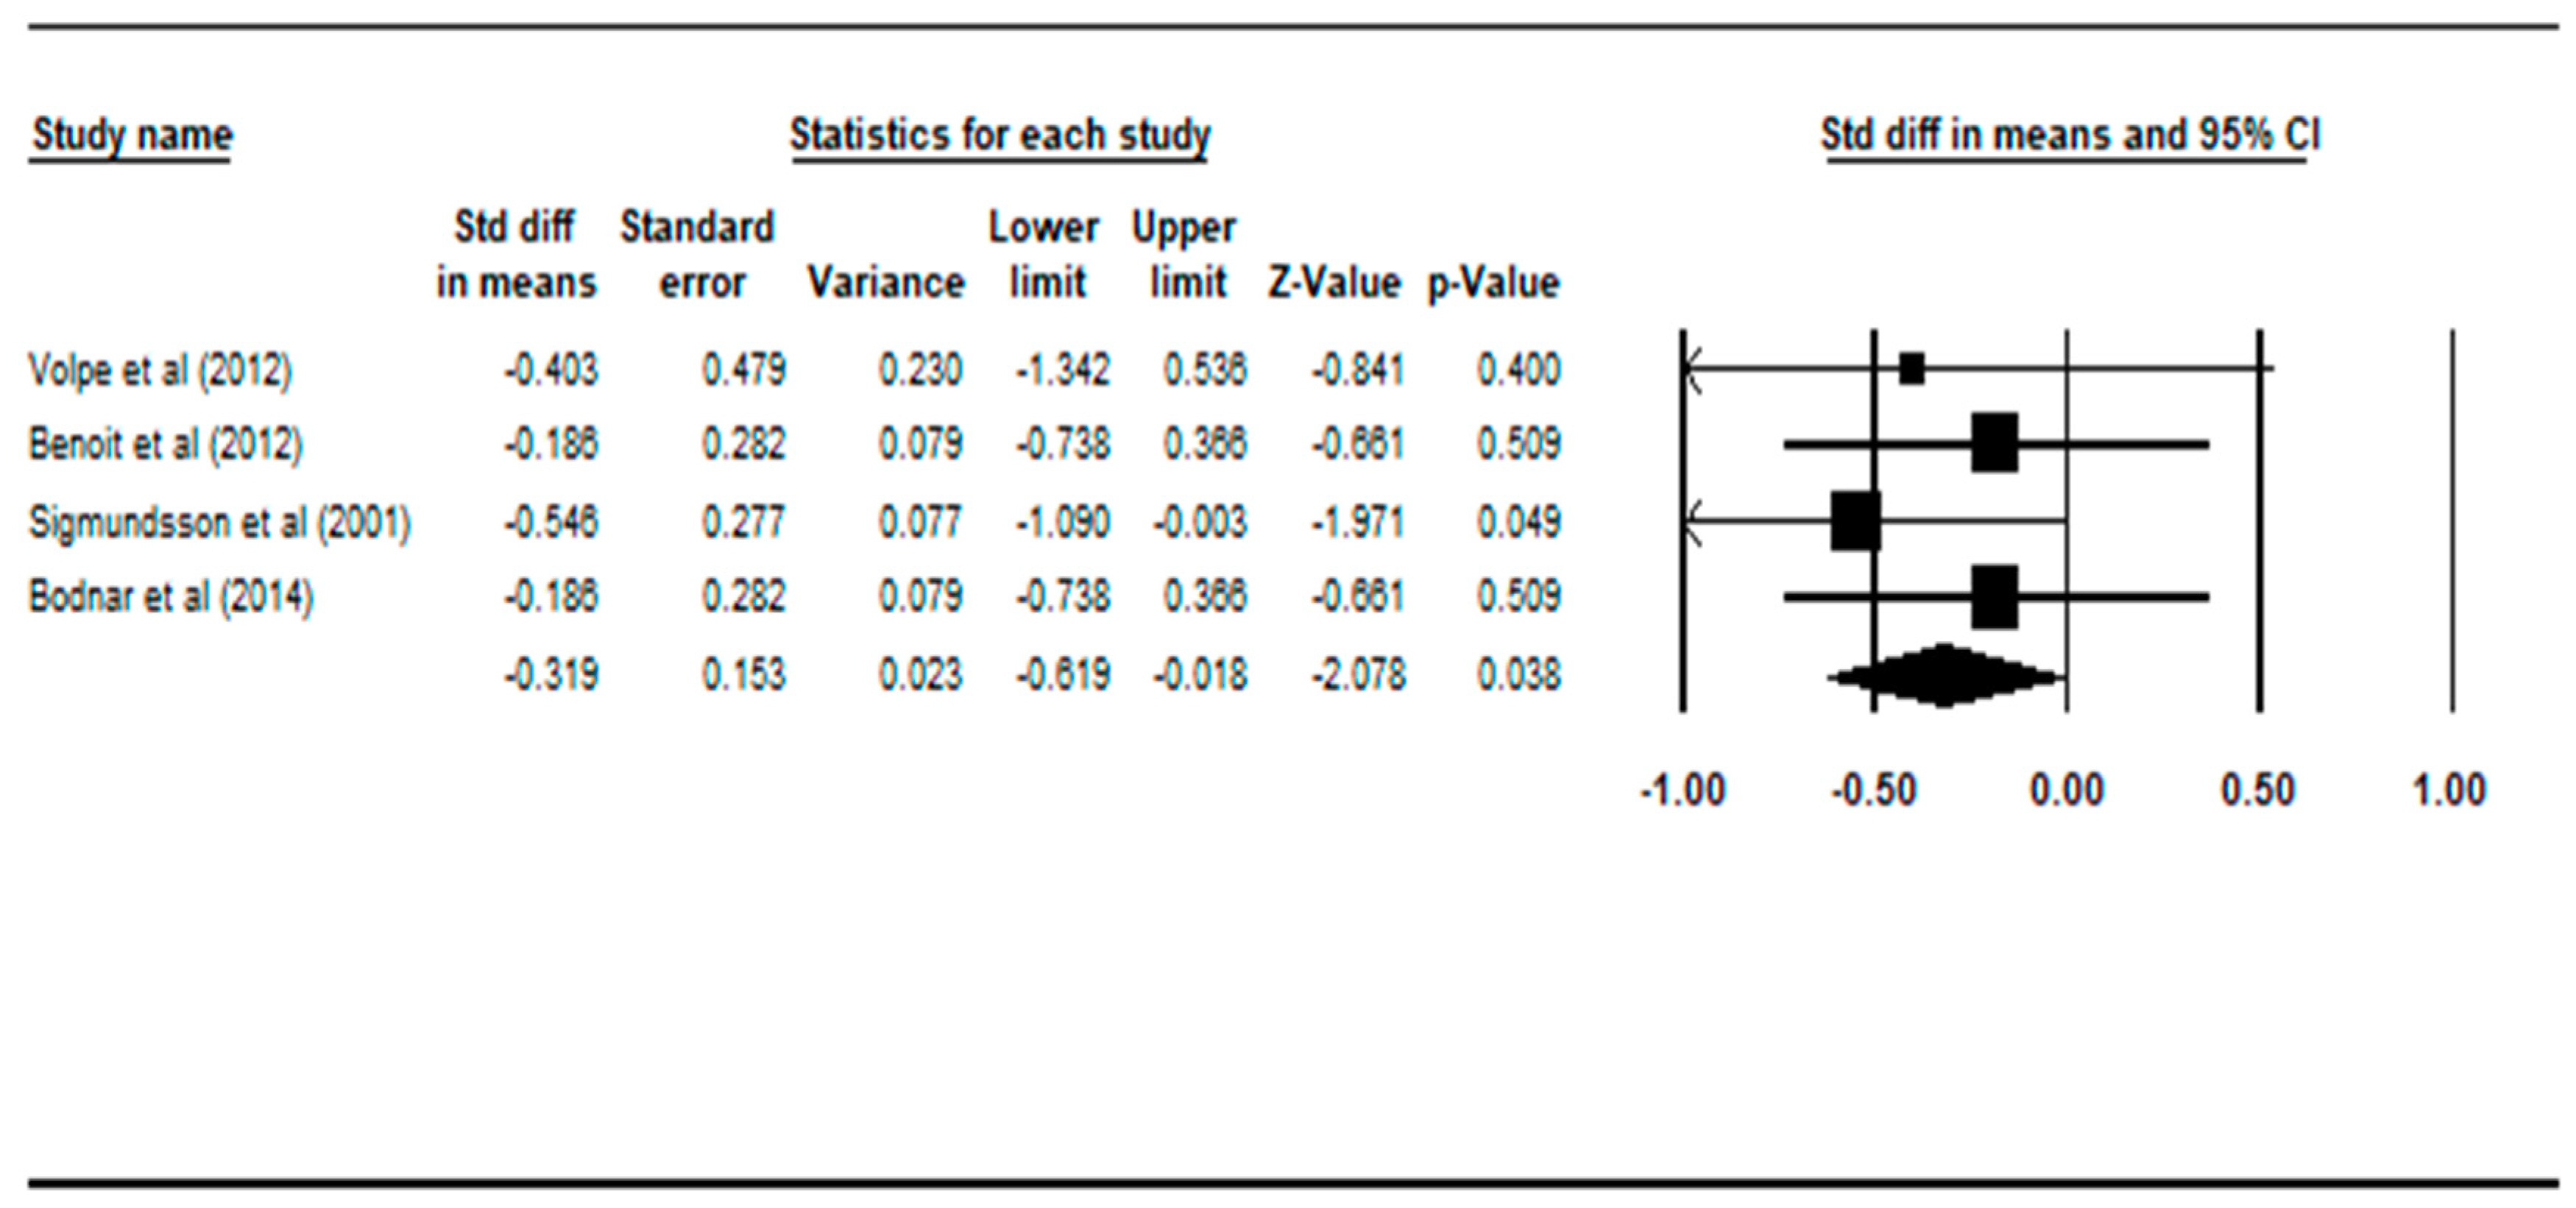
3.2. Comparing Patients with Deficit Schizophrenia to Healthy Controls
3.3. Comparing Patients with Deficit Schizophrenia to Patients with Non-Deficit Schizophrenia
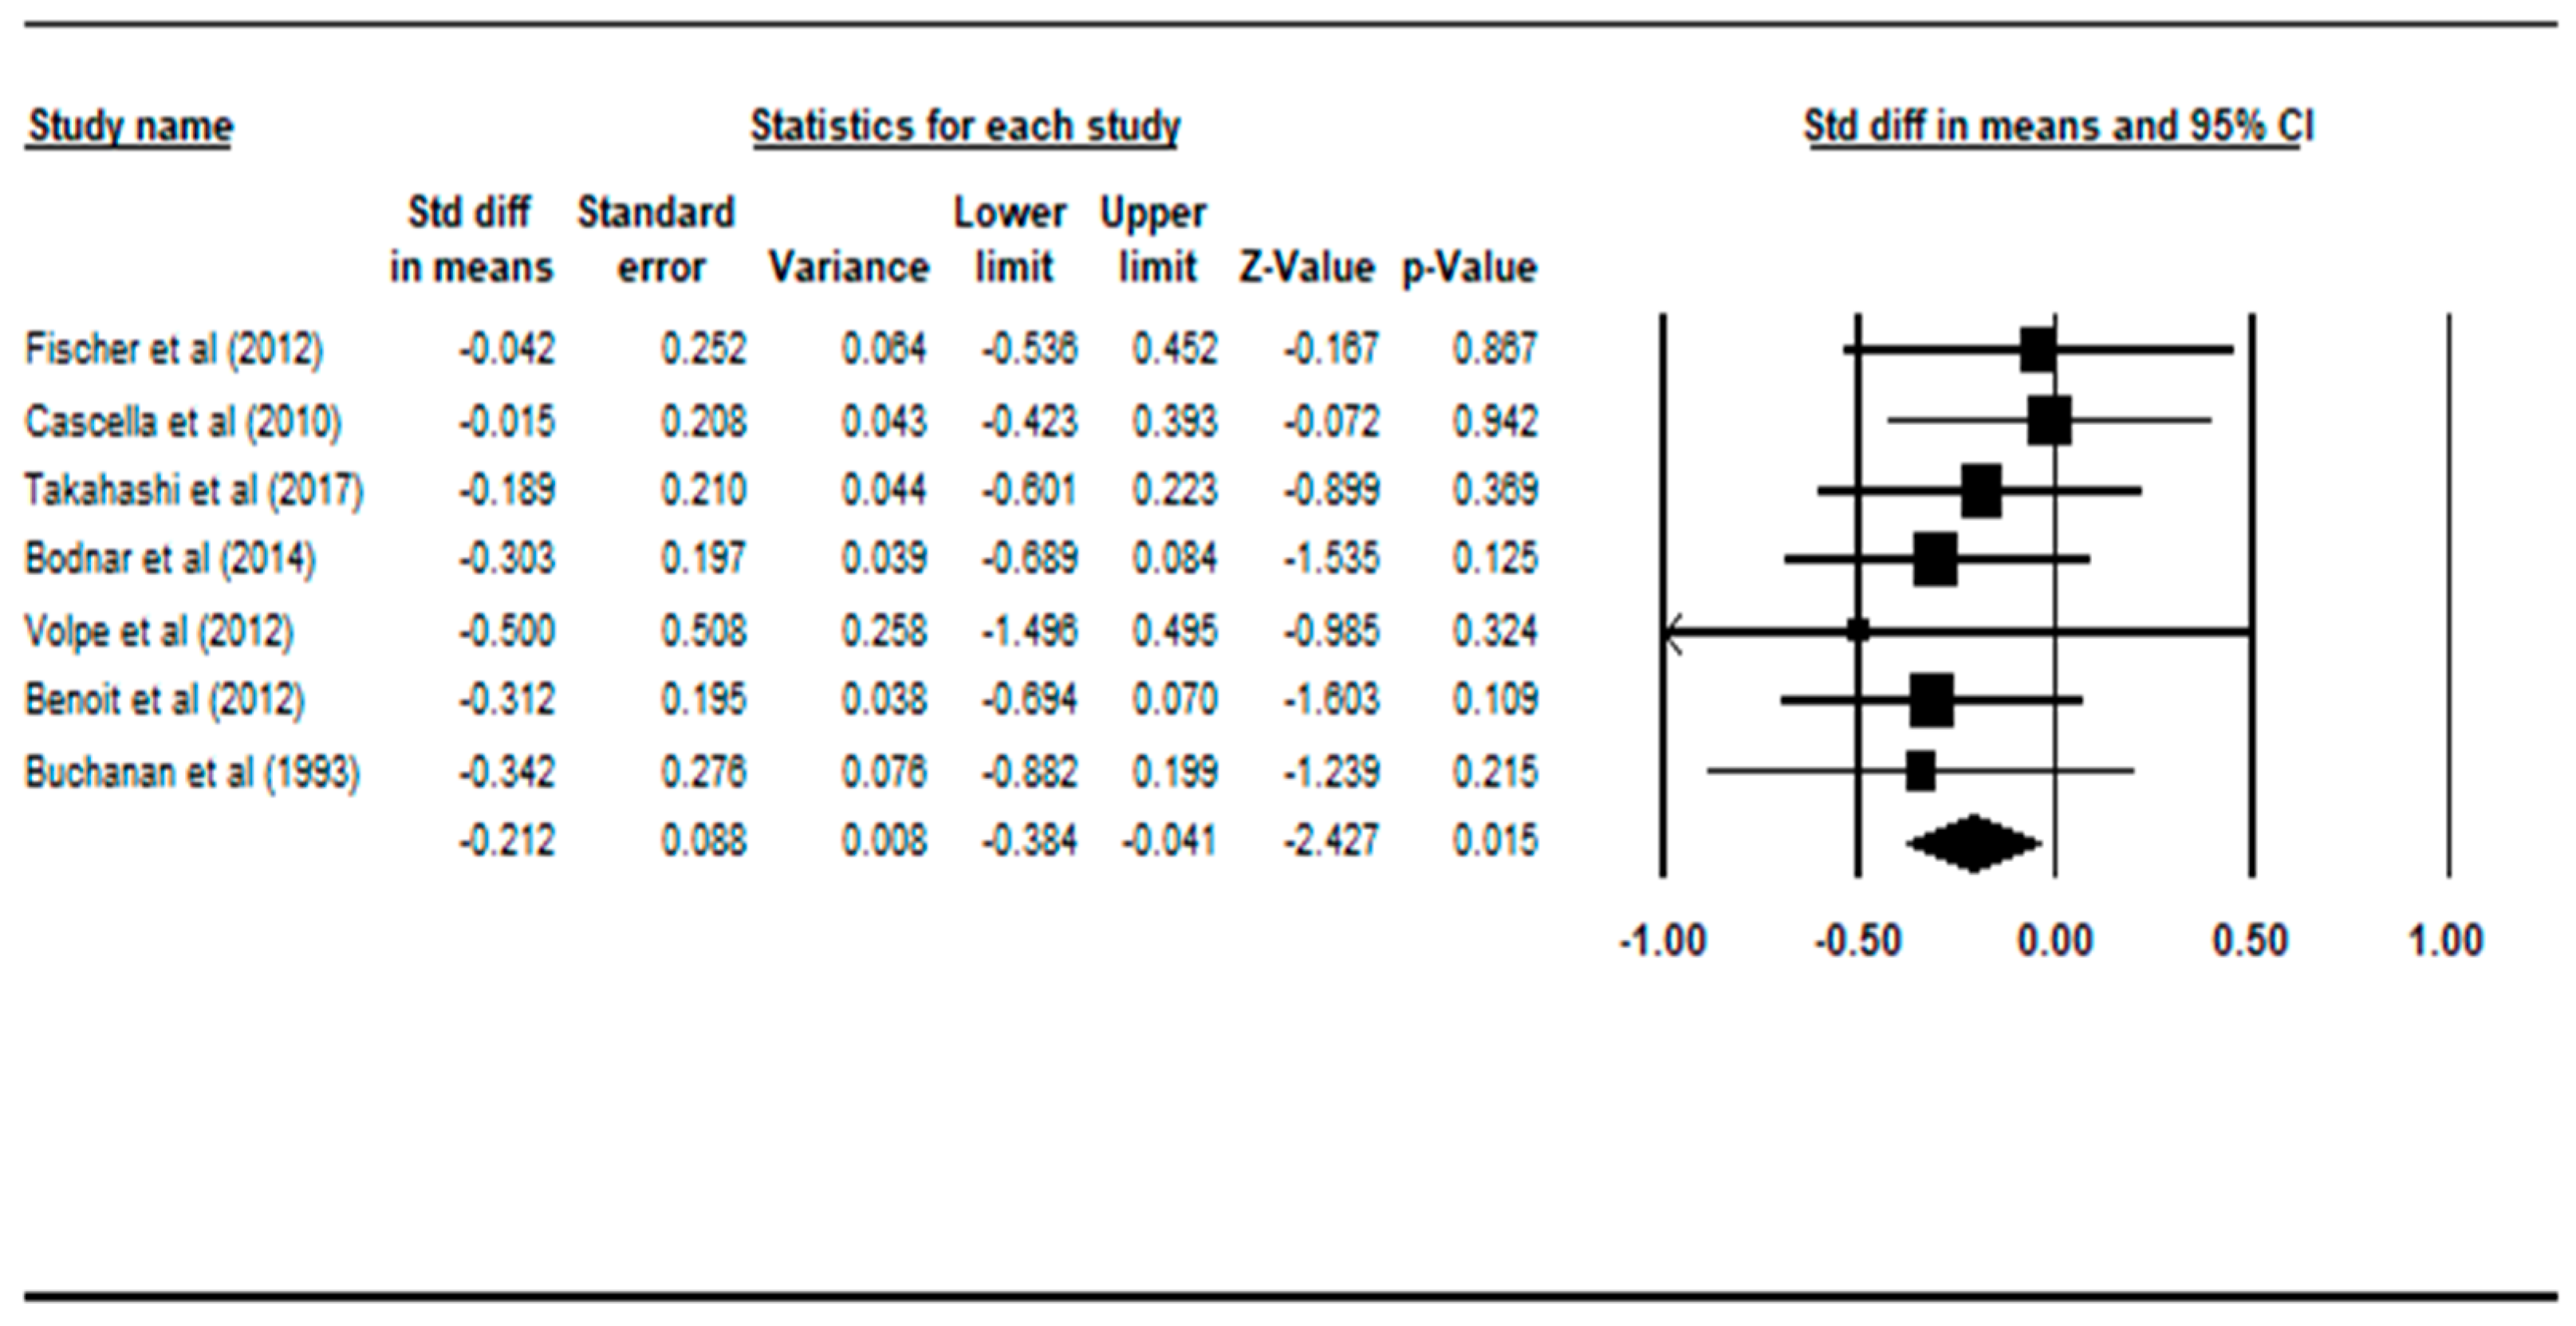
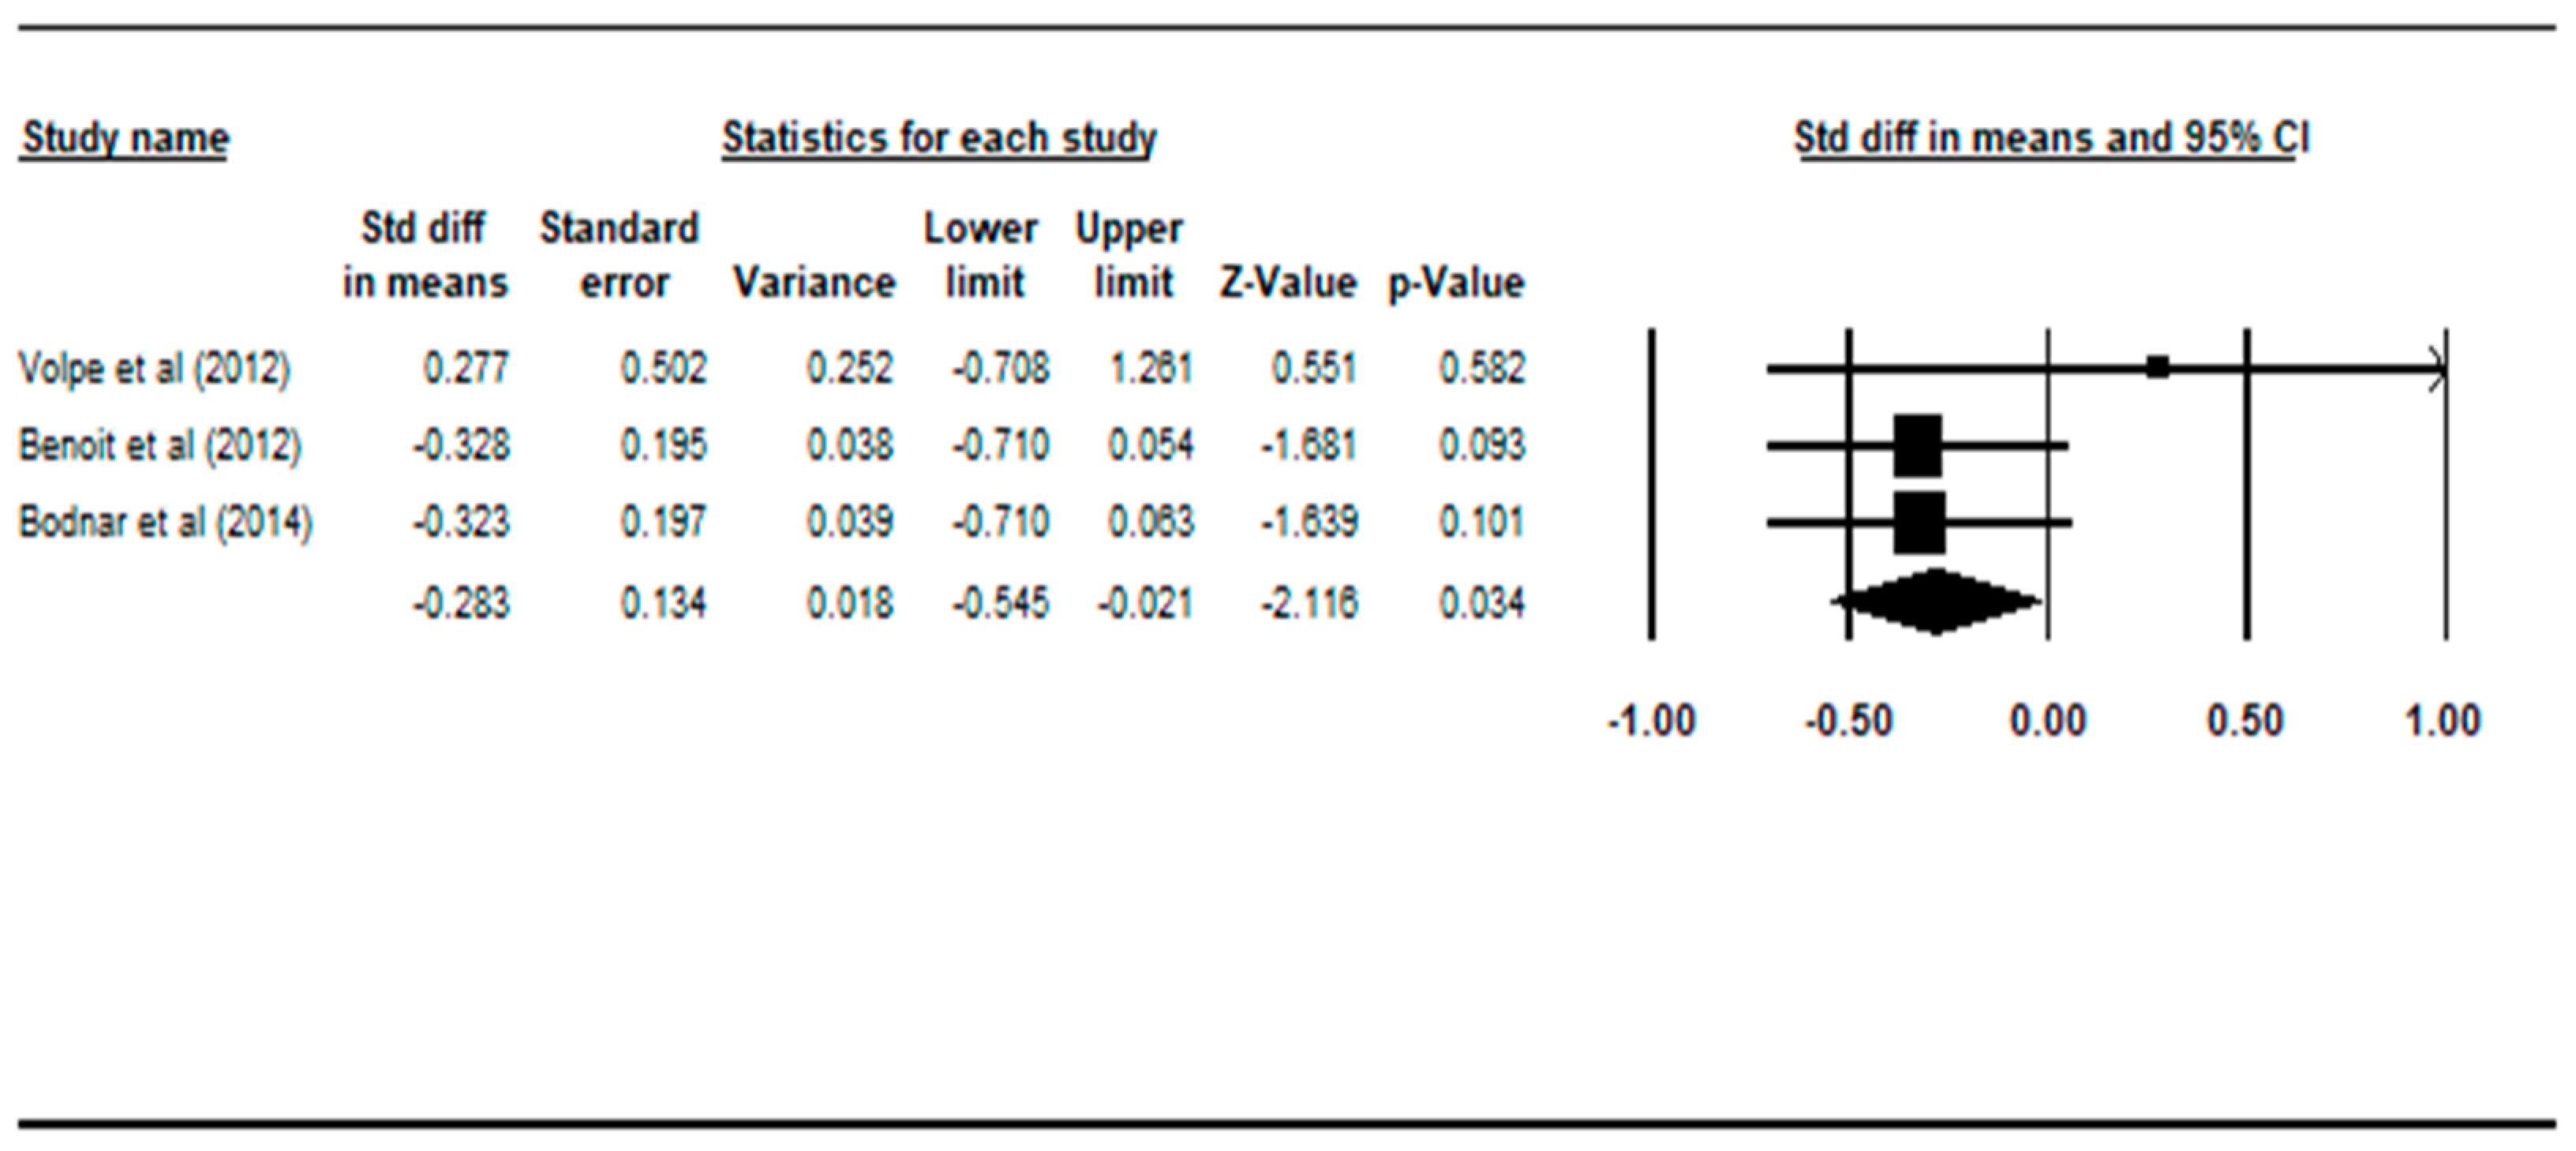
3.4. Comparing Patients with Non-Deficit Schizophrenia to Healthy Controls
4. Discussion
4.1. Deficit Schizophrenia versus Healthy Controls
4.2. Deficit Schizophrenia versus Non-Deficit Schizophrenia
4.3. Non-Deficit Schizophrenia versus Healthy Control
4.4. Strengths and Limitations
5. Conclusions
Author Contributions
Funding
Conflicts of Interest
Appendix A

| First Author | Year | PubMed ID | ||
|---|---|---|---|---|
| Included in Review? (circle response) | Yes | No | ||
| Reason for exclusion: | ||||
| MRI (circle response) | ROI | VBM | DTI | Others: |
| Diagnostic instrument: | ||||
| Deficit Schizophrenia Patient Group | Number M:F Mean age | ROIs included in paper: | ||
| Non-Deficit Schizophrenia Patient Group | Number M:F Mean age | |||
| Healthy Controls | Number M:F Mean age | |||
| Study (Year) | Struct Imaging | Relevant Diagnostic Instrument | DS or PNS | Non-DS or Non-PNS | Controls | Regions of Interest | ||||
|---|---|---|---|---|---|---|---|---|---|---|
| MRI | N (M:F) | Mean/Median Age | N (M:F) | Mean/Median Age | N (M:F) | Mean/Median Age | ||||
| 1 | Volpe (2012) | ROI (grey matter volumes) | Schedule for Deficit Syndrome (SDS) | 10 (9:1) | 35.8 | 8 (7:1) | 34.2 | 8 (7:1) | 33 | Hippocampus |
| Dorsolateral Prefrontal Cortex (DLPFC) | ||||||||||
| GM | ||||||||||
| WM | ||||||||||
| ICV | ||||||||||
| CSF | ||||||||||
| 2 | Özdemir (2012) | ROI | SDS (Turkish version) | 11 (7:4) | 32.4 | 18 (9:9) | 40.8 | 17 (9:8) | 33.82 | Left DLPFC, |
| Right Superior Temporal Gyrus (STG), | ||||||||||
| Left STG, | ||||||||||
| Right anterior Prefrontal Cortex (PFC), | ||||||||||
| Left DLPFC, | ||||||||||
| Culmen, | ||||||||||
| Right Frontal Eye Field (FEF), | ||||||||||
| Right temporopolar cortex, | ||||||||||
| Left Middle Temporal Gyrus (MTG), | ||||||||||
| Right inferior PFC, | ||||||||||
| Left posterior cingulate, | ||||||||||
| Left anterior PFC, | ||||||||||
| Left parahippocampal gyrus, | ||||||||||
| Left angular gyrus | ||||||||||
| GM | ||||||||||
| WM | ||||||||||
| CSF | ||||||||||
| TBV | ||||||||||
| 3 | Benoit (2012) | VBM | Persistent Negative Symptoms (PNS) classification | 16 (13:3) | 24.2 | 48 (33:15) | 23.6 | 60 (40:20) | 24.8 | Frontal cortex, |
| Temporal lobe, | ||||||||||
| Cingulate cortex, | ||||||||||
| Caudate, | ||||||||||
| Putamen, | ||||||||||
| Globus pallidus, | ||||||||||
| Amygdala–Hippocampus, | ||||||||||
| Hippocampus, | ||||||||||
| Ventricles | ||||||||||
| GM | ||||||||||
| WM | ||||||||||
| CSF | ||||||||||
| 4 | Kitis (2012) | DTI | SDS | 11 (7:4) | 32.36 | 18 (9:9) | 40.77 | 17 (9:8) | 33.82 | Fractional anisotropy in uncinate fasciculus, left and right. |
| 5 | Fischer (2012) | ROI | SDS, SANS, DSM-IV | 20 (17:3) | 40.1 | 36 (31:5) | 38.4 | 28 (23:5) | 36 | DPFLC Circuit Regions |
| - Middle frontal gyrus grey matter | ||||||||||
| - supramarginal gyrus grey matter | ||||||||||
| - thalamus | ||||||||||
| - caudate | ||||||||||
| Non-DPFLC Circuit Regions | ||||||||||
| - superior frontal gyrus grey matter | ||||||||||
| - inferior frontal gyrus grey matter | ||||||||||
| - orbital frontal gyrus grey matter | ||||||||||
| - superior temporal gyrus grey matter | ||||||||||
| - amygdala–hippocampal complex | ||||||||||
| - middle temporal gyrus grey matter | ||||||||||
| Total Cranial Vol. | ||||||||||
| Total Brain Vol. (TBV) | ||||||||||
| Total Ventricular Vol. | ||||||||||
| Total CSF Vol. | ||||||||||
| 6 | Cascella (2010) | VBM | SDS, DSM-IV, SANS | 19 (16:3) | 35.1 | 31 (21:10) | 44.4 | 90 (43:47) | 46.3 | VBM analyses of grey matter volumes |
| Frontal | ||||||||||
| Temporal | ||||||||||
| Sub-lobar | ||||||||||
| Limbic | ||||||||||
| Occipital | ||||||||||
| Cerebellum | ||||||||||
| GM | ||||||||||
| TBV | ||||||||||
| 7 | Rowland (2009) | DTI (white matter alterations) | SDS, DSM-IV, SANS | 10 (8:2) | 43 | 10 (8:2) | 40 | 11 (8:3) | 37 | Middle Frontal and Inferior Parietal White Matter Volume and Fractional Anisotropy (FA) |
| 8 | Galderisi (2008) | ROI | SDS, DSM-IV | 34 (25:9) | 35.8 | 32 (26:6) | 34.2 | 31 (21:10) | 34.4 | Right, Left lateral ventricle, |
| Right, Left DLPFC, | ||||||||||
| Right, Left Hippocampus, | ||||||||||
| Right, Left Cingulate cortex, | ||||||||||
| Right, Left Temporal Lobe, | ||||||||||
| Right, Left Putamen, | ||||||||||
| Right, Left Pallidum, | ||||||||||
| Right, Left Caudate | ||||||||||
| 9 | Quarantelli (2002) | Stereotaxy-based regional brain volumetry applied to segmented MRI. | SDS, SANS | 14 (13:1) | 20−51 | 14 (13:1) | 19−54 | 25 (19:6) | 18−50 | Cerebellum |
| Frontal | ||||||||||
| Occipital | ||||||||||
| Parietal | ||||||||||
| Temporal | ||||||||||
| Lateral ventricles | ||||||||||
| 10 | Sigmundsson (2001) | ROI | DSM-IV, PANSS, SDS. | 27 (26:1) | 34.9 | - | - | 27 (25:2) | 32.2 | Whole brain |
| GM | ||||||||||
| WM | ||||||||||
| CSF | ||||||||||
| Grey matter “deficit” region: | ||||||||||
| - Perisylvian region | ||||||||||
| - Medial frontal lobe/anterior cingulated | ||||||||||
| - Parahippocampal gyrus | ||||||||||
| 11 | Sanfilipo (2000) | MRI | DSM-III, SANS | n = 13 (High negative symptom group) | 29 | 35.8 | 24 ROIs for NDS vs. HC only. | |||
| Superior Medial Prefrontal Grey | ||||||||||
| Superior Central Prefrontal Grey | ||||||||||
| Superior Lateral Prefrontal Grey | ||||||||||
| Inferior Medial Prefrontal Grey | ||||||||||
| Inferior Central Prefrontal Grey | ||||||||||
| Inferior Lateral Prefrontal Grey | ||||||||||
| Hemispheric Prefrontal Grey | ||||||||||
| Total Prefrontal Grey | ||||||||||
| Superior Medial Prefrontal White | ||||||||||
| Superior Central Prefrontal White | ||||||||||
| Superior Lateral Prefrontal White | ||||||||||
| Inferior Medial Prefrontal White | ||||||||||
| Inferior Central Prefrontal White | ||||||||||
| Inferior Lateral Prefrontal White | ||||||||||
| Hemispheric Prefrontal White | ||||||||||
| Total Prefrontal White | ||||||||||
| Hippocampus | ||||||||||
| Parahippocampus | ||||||||||
| Superior Temporal Gyrus | ||||||||||
| Hemispheric Whole Temporal GM | ||||||||||
| Total Whole Temporal GM | ||||||||||
| Hemispheric Whole Temporal WM | ||||||||||
| Total Whole Temporal WM | ||||||||||
| 12 | Turetsky (1995) | MRI | SANS, Strauss–Carpenter Outcome Scale | 21 (18:3) | 22.8 | 49 (26:23) | 23.2 | 77 (48:29) | 28 | Regional Volumetric Measurements: |
| Left Temporal | ||||||||||
| Right Temporal | ||||||||||
| Left Frontal | ||||||||||
| Right Frontal | ||||||||||
| 13 | Takayanagi (2018) | ROI | PDS | 37 (21:16) | 27.2 | 36 (12:24) | 26.6 | 50 (25:25) | 25.8 | Local gyrification index of: |
| Right, Left dorsal medial prefrontal cortex, | ||||||||||
| Right, Left ventromedial prefrontal cortex, | ||||||||||
| Right, Left anterior cingulate gyrus, | ||||||||||
| Right, Left superior frontal cortex, | ||||||||||
| Right, Left medial orbitofrontal gyrus, | ||||||||||
| Right, Left lateral orbitofrontal gyrus, | ||||||||||
| Right, Left rostral anterior cingulate gyrus, | ||||||||||
| Left postcentral gyrus, | ||||||||||
| Left lingual gyrus, | ||||||||||
| Right posterior cingulate gyrus, | ||||||||||
| Right inferior parietal lobule | ||||||||||
| Right lateral occipital cortex | ||||||||||
| 14 | Xie (2017) | ROI | SDS | 33 (33:0) | 49 | 41 (41:0) | 45.1 | 41 (41:0) | 45.8 | Left superior temporal gyrus, |
| Right superior temporal gyrus, | ||||||||||
| Left middle temporal gyrus, | ||||||||||
| Right middle temporal gyrus, | ||||||||||
| Left inferior frontal gyrus triangular part, | ||||||||||
| Right inferior frontal gyrus triangular part, | ||||||||||
| Left Heschl gyrus, | ||||||||||
| Left supramarginal gyrus, | ||||||||||
| Left angular gyrus | ||||||||||
| Left superior temporal gyrus temporal pole, | ||||||||||
| Right inferior frontal gyrus orbital part, | ||||||||||
| Left Insula | ||||||||||
| 15 | Makowski (2017) | ROI | SANS | 21 (15:6) | 23.2 | 44 (31:13) | 24.6 | 44 (25:19) | 23.8 | Left Amygdala, |
| Right Amygdala, | ||||||||||
| Left Hippocampus, | ||||||||||
| Right Hippocampus, | ||||||||||
| 16 | Takahashi (2017) | ROI | PDS | 38 (22:16) | 27.1 | 37 (12:25) | 27.1 | 59 (28:31) | 26.1 | Left OFC (Orbitofrontal cortex), |
| Right OFC, | ||||||||||
| Left IOS (Intermediate orbital sulcus), | ||||||||||
| Right IOS, | ||||||||||
| Left POS (Posterior orbital sulcus), | ||||||||||
| Right POS, | ||||||||||
| CSP (Cavum septum pellucidi) volume, | ||||||||||
| Olfactory sulcus depth, | ||||||||||
| Intracranial volume | ||||||||||
| Left superior temporal gyrus, | ||||||||||
| Right superior temporal gyrus, | ||||||||||
| Left middle temporal gyrus, | ||||||||||
| Right middle temporal gyrus, | ||||||||||
| Left inferior frontal gyrus triangular part, | ||||||||||
| Right inferior frontal gyrus triangular part, | ||||||||||
| Left Heschl gyrus, | ||||||||||
| Left supramarginal gyrus, | ||||||||||
| Left angular gyrus | ||||||||||
| Left superior temporal gyrus temporal pole, | ||||||||||
| Right inferior frontal gyrus orbital part, | ||||||||||
| Left Insula | ||||||||||
| 17 | De Rossi (2016) | ROI | SDS | 22 (17:5) | 39.2 | 22 (17:5) | 38.3 | 22 (17:5) | 38.3 | Left Accumbens, |
| Left Thalamus, | ||||||||||
| Left Caudate, | ||||||||||
| Left Putamen, | ||||||||||
| Left Pallidum, | ||||||||||
| Left Amygdala, | ||||||||||
| Right Accumbens, | ||||||||||
| Right Thalamus, | ||||||||||
| Right Caudate, | ||||||||||
| Right Putamen, | ||||||||||
| Right Pallidum, | ||||||||||
| Right Amygdala, | ||||||||||
| Intracranial volume | ||||||||||
| Left superior temporal gyrus, | ||||||||||
| Right superior temporal gyrus, | ||||||||||
| Left middle temporal gyrus, | ||||||||||
| Right middle temporal gyrus, | ||||||||||
| Left inferior frontal gyrus triangular part, | ||||||||||
| Right inferior frontal gyrus triangular part, | ||||||||||
| Left Heschl gyrus, | ||||||||||
| Left supramarginal gyrus, | ||||||||||
| Left angular gyrus | ||||||||||
| Left superior temporal gyrus temporal pole, | ||||||||||
| Right inferior frontal gyrus orbital part, | ||||||||||
| Left Insula | ||||||||||
| 18 | Lei (2015) | VBM/DTI | SDS | 33 (21:11) | 22.3 | 42 (25:17) | 23.4 | 41 (24:17) | 3.5 | White matter: |
| Precentral gyrus, | ||||||||||
| Cerebellum posterior lobe, | ||||||||||
| Extra-nuclear, | ||||||||||
| Insula, | ||||||||||
| total white matter volume, | ||||||||||
| whole brain volume | ||||||||||
| Left superior temporal gyrus, | ||||||||||
| Right superior temporal gyrus, | ||||||||||
| Left middle temporal gyrus, | ||||||||||
| Right middle temporal gyrus, | ||||||||||
| Left inferior frontal gyrus triangular part, | ||||||||||
| Right inferior frontal gyrus triangular part, | ||||||||||
| Left Heschl gyrus, | ||||||||||
| Left supramarginal gyrus, | ||||||||||
| Left angular gyrus | ||||||||||
| Left superior temporal gyrus temporal pole, | ||||||||||
| Right inferior frontal gyrus orbital part, | ||||||||||
| Left Insula | ||||||||||
| 19 | Lei (2015) | ROI | SDS | 44 (26:18) | 22.9 | 44 (26:18) | 23.2 | 44 (26:18) | 22.6 | Grey matter volume: |
| Cerebellar culmen, | ||||||||||
| Insula, | ||||||||||
| total grey matter volume, | ||||||||||
| Whole brain volume | ||||||||||
| Left superior temporal gyrus, | ||||||||||
| Right superior temporal gyrus, | ||||||||||
| Left middle temporal gyrus, | ||||||||||
| Right middle temporal gyrus, | ||||||||||
| Left inferior frontal gyrus triangular part, | ||||||||||
| Right inferior frontal gyrus triangular part, | ||||||||||
| Left Heschl gyrus, | ||||||||||
| Left supramarginal gyrus, | ||||||||||
| Left angular gyrus | ||||||||||
| Left superior temporal gyrus temporal pole, | ||||||||||
| Right inferior frontal gyrus orbital part, | ||||||||||
| Left Insula | ||||||||||
| 20 | Bodnar (2014) | ROI | SANS | 16 (13:3) | 24.2 | 46 (32:14) | 23.7 | 60 (40:20) | 24.8 | Grey matter, |
| White matter, | ||||||||||
| CSF, | ||||||||||
| Total intracranial | ||||||||||
| Right Medial frontal gyrus, | ||||||||||
| Right Orbital frontal gyrus, | ||||||||||
| Right Anterior cingulate, | ||||||||||
| Right Parahippocampal gyrus, | ||||||||||
| Right Inferior temporal gyrus, | ||||||||||
| Right Anterior/middle cingulate, | ||||||||||
| Right, Left Middle temporal gyrus, | ||||||||||
| Right, Left Superior temporal gyrus, | ||||||||||
| Right Posterior cingulate, | ||||||||||
| R,L Fusiform gyrus, | ||||||||||
| Right Middle occipital gyrus, | ||||||||||
| Left Inferior frontal gyrus, | ||||||||||
| Left Middle frontal gyrus, | ||||||||||
| Left Subgenual cingulate, | ||||||||||
| Left Cuneus, | ||||||||||
| Left Lingual gyrus | ||||||||||
| 21 | Voineskos (2013) | DTI | PANSS | 18 (14:4) | 49 | 59 (38:21) | 43 | 79 (48:31) | 43 | White matter tract |
| Left, Right inferior longitudinal fasciculus, | ||||||||||
| Left, Right arcuate fasciculus, | ||||||||||
| Left, Right uncinate fasciculus, | ||||||||||
| Left, Right inferior occipitofrontal fasciculus, | ||||||||||
| Left, Right cingulum bundle, | ||||||||||
| Genu corpus callosum, | ||||||||||
| Splenium corpus callosum | ||||||||||
| Cortical region: | ||||||||||
| Orbitofrontal cortex, | ||||||||||
| middle temporal gyrus, | ||||||||||
| superior temporal gyrus, temporal pole, DLPFC, | ||||||||||
| Parietal operculum, | ||||||||||
| parahippocampal gyrus, | ||||||||||
| Insula | ||||||||||
| 22 | Takayanagi (2013) | ROI | SDS | 18 (15:3) | 35.9 | 30 (20:10) | 44.3 | 82 (40:42) | 43.7 | Left, Right anterior cingulate grey matter volume, |
| Left, Right anterior cingulate cortical thickness, | ||||||||||
| Left, Right anterior cingulate surface area | ||||||||||
| 23 | Koutsouleris (2008) | VBM | PANSS | 59 (50:9) | 32.8 | NR | NR | 177 (123:54) | 31.5 | Perisylvian and Intrasylvian, |
| Temporal, | ||||||||||
| Frontal, | ||||||||||
| Limbic, | ||||||||||
| Thalamus and Basal ganglia, | ||||||||||
| GM, | ||||||||||
| WM, | ||||||||||
| CSF, | ||||||||||
| Total intracranial volume, | ||||||||||
| 24 | Buchanan (1993) | ROI | SDS | 17 (12:5) | 35.5 | 24 (14:10) | 35.6 | 30 (20:10) | 34 | ROIs included in paper: |
| Left, Right prefrontal total volume, | ||||||||||
| Left, Right prefrontal grey matter volume, | ||||||||||
| Left, Right prefrontal white matter volume, | ||||||||||
| Left, Right caudate total volume, | ||||||||||
| Left, Right amygdala/hippocampus total volume, | ||||||||||
| Total cranial volume | ||||||||||
| Brain Structure | Study | Brain Structure Description (Quotation from Paper) | No. of DS Pts | No. of NDS Pts | No. of Controls | Units Used | Total Mean Vol. (DS) | Total Vol. SD (DS) | Total Mean Vol. (NDS) | Total Vol. SD (NDS) | Total Mean Vol. (cn) | Total Vol. SD (cn) | |
|---|---|---|---|---|---|---|---|---|---|---|---|---|---|
| 1. TBV | TBV | Fischer (2012) | Did not specify | 20 | 36 | 28 | mL | 1299.2 | 43.9 | 1331.1 | 33.6 | 1339.2 | 34 |
| TBV | Cascella (2010) | Did not specify | 19 | 31 | 90 | mL | 1209 | 149 | 1155 | 118 | 1157 | 137 | |
| “Whole Brain” | Sigmundsson (2001) | Did not specify | 27 | 0 | 27 | mL | 1298 | 122 | 1358 | 136 | |||
| ICV | Takahashi (2017) | Did not specify | 38 | 37 | 59 | mL | 1472.9 | 153.2 | 1459 | 150.2 | 1487.2 | 148.7 | |
| TIV | Bodnar (2014) | Did not specify | 16 | 46 | 60 | mL | 1430 | 127 | 1437 | 121 | 1479 | 151 | |
| ICV | Volpe (2012) | Did not specify | 10 | 8 | 8 | cc | 1302.6 | 126.59 | 1316.34 | 125.65 | 1374.75 | 107.1 | |
| TIV | Benoit (2012) | Did not specify | 16 | 48 | 60 | mL | 1430 | 127 | 1436 | 119 | 1479 | 151 | |
| TCV | Buchanan (1993) | Did not specify | 17 | 24 | 30 | cc | 1229 | 153 | 1188 | 153 | 1234 | 118 | |
| 2. Total Grey Vol. | GM | Volpe (2012) | Did not specify | 10 | 8 | 8 | mL | 655.15 | 52.78 | 641.48 | 74.18 | 727.76 | 45.73 |
| Grey matter (mL) | Benoit (2012) | Did not specify | 16 | 48 | 60 | mL | 624 | 56 | 642 | 59 | 658 | 71 | |
| Grey matter (mL) | Cascella (2010) | Did not specify | 19 | 31 | 90 | mL | 706 | 89 | 679 | 76 | 688 | 90 | |
| Grey matter (mL) | Sigmundsson (2001) | Did not specify | 27 | 0 | 27 | mL | 509 | 55 | 538 | 68 | |||
| Grey matter (mL) | Bodnar (2014) | Did not specify | 16 | 46 | 60 | mL | 624 | 56 | 643 | 60 | 658 | 71 | |
| 3. Total White Matter | WM. | Volpe (2012) | Did not specify | 10 | 8 | 8 | mL | 489.31 | 45.31 | 525.97 | 44.83 | 510.9 | 62.63 |
| WM. | Benoit (2012) | Did not specify | 16 | 48 | 60 | mL | 605 | 65 | 596 | 62 | 618 | 71 | |
| WM. | Sigmundsson (2001) | Did not specify | 27 | 0 | 27 | mL | 586 | 67 | 624 | 72 | |||
| WM. | Bodnar (2014) | Did not specify | 16 | 46 | 60 | mL | 605 | 65 | 596 | 64 | 618 | 71 | |
| 4. CSF | CSF | Volpe (2012) | Did not specify | 10 | 8 | 8 | mL | 158.14 | 73.5 | 148.89 | 47.85 | 136.09 | 43.89 |
| CSF | Benoit (2012) | Did not specify | 16 | 48 | 60 | mL | 201 | 27 | 198 | 27 | 203 | 35 | |
| Total CSF vol | Fischer (2012) | Did not specify | 20 | 36 | 28 | mL | 114.6 | 10.4 | 110.1 | 7.9 | 110.6 | 8 | |
| CSF | Sigmundsson (2001) | Did not specify | 27 | 0 | 27 | mL | 161 | 34 | 150 | 27 | |||
| CSF | Bodnar (2014) | Did not specify | 16 | 46 | 60 | mL | 201 | 27 | 197 | 27 | 203 | 35 |
References
- Earnst, K.; Kring, A. Construct validity of negative symptoms: An empirical and conceptual review. Clin. Psychol. Rev. 1997, 17, 167–189. [Google Scholar] [CrossRef]
- Carpenter, W.T., Jr.; Heinrichs, D.W.; Wagman, A.M. Deficit and nondeficit forms of schizophrenia: The concept. Am. J. Psychiatry 1988, 145, 578–583. [Google Scholar] [PubMed]
- Kirkpatrick, B.; Mucci, A.; Galderisi, S. Primary, Enduring Negative Symptoms: An Update on Research. Schizophr. Bull. 2017, 43, 730–736. [Google Scholar] [CrossRef] [PubMed]
- Tek, C.; Kirkpatrick, B.; Buchanan, R.W. A five-year follow-up study of deficit and non-deficit schizophrenia. Schizoph. Res. 2001, 49, 253–260. [Google Scholar] [CrossRef]
- Kirkpatrick, B.; Buchanan, R.W.; Ross, D.E.; Carpenter, W.T. A separate disease within the syndrome of schizophrenia. Arch. Gen. Psychiatry 2001, 58, 165–171. [Google Scholar] [CrossRef] [PubMed]
- Blanchard, J.J.; Horan, W.P.; Collins, L.M. Examining the latent structure of negative symptoms: Is there a distinct subtype of negative symptom schizophrenia? Schizophr. Res. 2005, 77, 151–165. [Google Scholar] [CrossRef] [PubMed]
- Ahmed, A.O.; Strauss, G.P.; Buchanan, R.W.; Kirkpatrick, B.; Carpenter, W.T. Are Negative Symptoms Dimensional or Categorical? Detection and Validation of Deficit Schizophrenia with Taxometric and Latent Variable Mixture Models. Schizophr. Bull. 2014, 41, 879–891. [Google Scholar] [CrossRef] [Green Version]
- Kirkpatrick, B.; Buchanan, R.W.; McKenny, P.D.; Alphs, L.D.; Carpenter, W.T. The schedule for the deficit syndrome: An instrument for research in schizophrenia. Psychiatry Res. 1989, 30, 119–123. [Google Scholar] [CrossRef]
- Kirkpatrick, B.; Fenton, W.S.; Carpenter, W.T.; Marder, S.R. The NIMH-MATRICS Consensus Statement on Negative Symptoms. Schizophr. Bull. 2006, 32, 214–219. [Google Scholar] [CrossRef] [Green Version]
- Buchanan, R.W. Persistent Negative Symptoms in Schizophrenia: An Overview. Schizophr. Bull. 2007, 33, 1013–1022. [Google Scholar] [CrossRef] [Green Version]
- Ince, E.; Üçok, A. Relationship between Persistent Negative Symptoms and Findings of Neurocognition and Neuroimaging in Schizophrenia. Clin. EEG Neurosci. 2017, 49, 27–35. [Google Scholar] [CrossRef]
- Kay, S.R.; Fiszbein, A.; Opler, L.A. The Positive and Negative Syndrome Scale (PANSS) for Schizophrenia. Schizophr. Bull. 1987, 13, 261–276. [Google Scholar] [CrossRef]
- Andreasen, N.C. The Scale for the Assessment of Negative Symptoms (SANS): Conceptual and Theoretical Foundations. Br. J. Psychiatry 1989, 155, 49–52. [Google Scholar] [CrossRef]
- Kirkpatrick, B.; Strauss, G.P.; Nguyen, L.; Fischer, B.A.; Daniel, D.G.; Cienfuegos, A.; Marder, S.R. The Brief Negative Symptom Scale: Psychometric Properties. Schizophr. Bull. 2010, 37, 300–305. [Google Scholar] [CrossRef] [PubMed]
- Galderisi, S.; Merlotti, E.; Mucci, A. Neurological background of negative symptoms. Eur. Arch. Psychiatry Clin. Neurosci. 2015, 265, 543–558. [Google Scholar] [CrossRef] [PubMed]
- Hovington, C.L.; Lepage, M. Neurocognition and neuroimaging of persistent negative symptoms of schizophrenia. Expert Rev. Neurother. 2012, 12, 53–69. [Google Scholar] [CrossRef]
- Li, Y.; Li, W.-X.; Xie, D.-J.; Wang, Y.; Cheung, E.F.; Chan, R.C.K. Grey matter reduction in the caudate nucleus in patients with persistent negative symptoms: An ALE meta-analysis. Schizophr. Res. 2018, 192, 9–15. [Google Scholar] [CrossRef]
- Sutton, A.J. Methods for Meta-Analysis in Medical Research; John Wiley & Sons: New York, NY, USA, 2000. [Google Scholar]
- Higgins, J.P.T.; Thompson, S.G.; Deeks, J.J.; Altman, D.G. Measuring inconsistency in meta-analyses. BMJ 2003, 327, 557–560. [Google Scholar] [CrossRef] [Green Version]
- Takahashi, T.; Takayanagi, Y.; Nishikawa, Y.; Nakamura, M.; Komori, Y.; Furuichi, A.; Kido, M.; Sasabayashi, D.; Noguchi, K.; Suzuki, M. Brain neurodevelopmental markers related to the deficit subtype of schizophrenia. Psychiatry Res. Neuroimaging 2017, 266, 10–18. [Google Scholar] [CrossRef]
- Bodnar, M.; Hovington, C.L.; Buchy, L.; Malla, A.K.; Joober, R.; Lepage, M. Cortical Thinning in Temporo-Parietal Junction (TPJ) in Non-Affective First-Episode of Psychosis Patients with Persistent Negative Symptoms. PLoS ONE 2014, 9, e101372. [Google Scholar] [CrossRef] [Green Version]
- Volpe, U.; Mucci, A.; Quarantelli, M.; Galderisi, S.; Maj, M. Dorsolateral prefrontal cortex volume in patients with deficit or nondeficit schizophrenia. Prog. Neuro-Psychopharmacol. Boil. Psychiatry 2012, 37, 264–269. [Google Scholar] [CrossRef] [PubMed]
- Benoit, A.; Bodnar, M.; Malla, A.; Joober, R.; Lepage, M. The Structural Neural Substrates of Persistent Negative Symptoms in First-Episode of Non-Affective Psychosis: A Voxel-Based Morphometry Study. Front. Psychol. 2012, 3, 42. [Google Scholar] [CrossRef] [PubMed] [Green Version]
- Fischer, B.A.; Keller, W.R.; Arango, C.; Pearlson, G.D.; McMahon, R.P.; Meyer, W.A.; Francis, A.; Kirkpatrick, B.; Carpenter, W.T.; Buchanan, R.W. Cortical structural abnormalities in deficit versus nondeficit schizophrenia. Schizophr. Res. 2012, 136, 51–54. [Google Scholar] [CrossRef] [PubMed] [Green Version]
- Cascella, N.G.; Fieldstone, S.C.; Rao, V.; Pearlson, G.D.; Sawa, A.; Schretlen, D.J. Gray-matter abnormalities in deficit schizophrenia. Schizophr. Res. 2010, 120, 63–70. [Google Scholar] [CrossRef] [PubMed]
- Sigmundsson, T.; Suckling, J.; Maier, M.; Williams, S.C.R.; Bullmore, E.T.; Greenwood, K.; Fukuda, R.; Ron, M.A.; Toone, B.K. Structural Abnormalities in Frontal, Temporal, and Limbic Regions and Interconnecting White Matter Tracts in Schizophrenic Patients With Prominent Negative Symptoms. Am. J. Psychiatry 2001, 158, 234–243. [Google Scholar] [CrossRef] [Green Version]
- Dunton, W.R. The American Journal of Psychiatry. Am. J. Psychiatry 1944, 100, 45–60. [Google Scholar] [CrossRef]
- Takayanagi, Y.; Sasabayashi, D.; Takahashi, T.; Komori, Y.; Furuichi, A.; Kido, M.; Nishikawa, Y.; Nakamura, M.; Noguchi, K.; Suzuki, M. Altered brain gyrification in deficit and non-deficit schizophrenia. Psychol. Med. 2018, 49, 573–580. [Google Scholar] [CrossRef]
- Xie, T.; Zhang, X.; Tang, X.; Zhang, H.; Yu, M.; Gong, G.; Wang, X.; Evans, A.; Zhang, Z.; He, Y. Mapping Convergent and Divergent Cortical Thinning Patterns in Patients with Deficit and Nondeficit Schizophrenia. Schizophr. Bull. 2017, 45, 211–221. [Google Scholar] [CrossRef]
- Makowski, C.; Bodnar, M.; Shenker, J.J.; Malla, A.K.; Joober, R.; Chakravarty, M.M.; Lepage, M. Linking persistent negative symptoms to amygdala–hippocampus structure in first-episode psychosis. Transl. Psychiatry 2017, 7, e1195. [Google Scholar] [CrossRef] [Green Version]
- De Rossi, P.; Dacquino, C.; Piras, F.; Caltagirone, C.; Spalletta, G. Left nucleus accumbens atrophy in deficit schizophrenia: A preliminary study. Psychiatry Res. Neuroimaging 2016, 254, 48–55. [Google Scholar] [CrossRef]
- Lei, W.; Li, N.; Deng, W.; Li, M.; Huang, C.; Ma, X.; Wang, Q.; Guo, W.; Li, Y.; Jiang, L.; et al. White matter alterations in first episode treatment-naïve patients with deficit schizophrenia: A combined VBM and DTI study. Sci. Rep. 2015, 5, 12994. [Google Scholar] [CrossRef]
- Lei, W.; Deng, W.; Li, M.; He, Z.; Han, Y.; Huang, C.; Ma, X.; Wang, Q.; Guo, W.; Li, Y.; et al. Gray matter volume alterations in first-episode drug-naïve patients with deficit and nondeficit schizophrenia. Psychiatry Res. Neuroimaging 2015, 234, 219–226. [Google Scholar] [CrossRef] [PubMed] [Green Version]
- Voineskos, A.; Foussias, G.; Lerch, J.P.; Felsky, D.; Remington, G.; Rajji, T.K.; Lobaugh, N.; Pollock, B.G.; Mulsant, B.H. Neuroimaging Evidence for the Deficit Subtype of Schizophrenia. JAMA Psychiatry 2013, 70, 472–480. [Google Scholar] [CrossRef] [PubMed] [Green Version]
- Takayanagi, M.; Wentz, J.; Takayanagi, Y.; Schretlen, D.J.; Ceyhan, E.L.; Wang, L.; Suzuki, M.; Sawa, A.; Barta, P.E.; Ratnanather, J.T.; et al. Reduced anterior cingulate gray matter volume and thickness in subjects with deficit schizophrenia. Schizophr. Res. 2013, 150, 484–490. [Google Scholar] [CrossRef] [Green Version]
- Özdemir, H.I.; Eker, M.Ç.; Zengin, B.; Yılmaz, D.A.; Haznedaroğlu, D.İ.; Çınar, C.; Kitiş, Ö.; Akay, A.; Gönül, A.S. Gray matter changes in patients with deficit schizophrenia and non-deficit schizophrenia. Turk. J. Psychiatry 2012, 23, 237–246. [Google Scholar]
- Kitis, O.; Ozalay, O.; Zengin, E.B.; Haznedaroglu, D.; Eker, M.; Yalvac, D.; Oguz, K.; Coburn, K.; Gonul, A.S. Reduced left uncinate fasciculus fractional anisotropy in deficit schizophrenia but not in non-deficit schizophrenia. Psychiatry Clin. Neurosci. 2012, 66, 34–43. [Google Scholar] [CrossRef]
- Rowland, L.M.; Spieker, E.A.; Francis, A.; Barker, P.B.; Carpenter, W.T.; Buchanan, R.W. White Matter Alterations in Deficit Schizophrenia. Neuropsychopharmacology 2008, 34, 1514–1522. [Google Scholar] [CrossRef]
- Koutsouleris, N.; Gaser, C.; Jäger, M.; Bottlender, R.; Frodl, T.; Holzinger, S.; Schmitt, G.J.; Zetzsche, T.; Burgermeister, B.; Scheuerecker, J.; et al. Structural correlates of psychopathological symptom dimensions in schizophrenia: A voxel-based morphometric study. NeuroImage 2008, 39, 1600–1612. [Google Scholar] [CrossRef]
- Galderisi, S.; Quarantelli, M.; Volpe, U.; Mucci, A.; Cassano, G.B.; Invernizzi, G.; Rossi, R.; Vita, A.; Pini, S.; Cassano, P.; et al. Patterns of Structural MRI Abnormalities in Deficit and Nondeficit Schizophrenia. Schizophr. Bull. 2007, 34, 393–401. [Google Scholar] [CrossRef]
- Quarantelli, M.; Larobina, M.; Volpe, U.; Amatib, G.; Tedeschi, E.; Ciarmiello, A.; Brunetti, A.; Galderisi, S.; Alfano, B. Stereotaxy-Based Regional Brain Volumetry Applied to Segmented MRI: Validation and Results in Deficit and Nondeficit Schizophrenia. NeuroImage 2002, 17, 373–384. [Google Scholar] [CrossRef]
- Sanfilipo, M.; LaFargue, T.; Rusinek, H.; Arena, L.; Loneragan, C.; Lautin, A.; Feiner, D.; Rotrosen, J.; Wolkin, A. Volumetric Measure of the Frontal and Temporal Lobe Regions in Schizophrenia. Arch. Gen. Psychiatry 2000, 57, 471–480. [Google Scholar] [CrossRef] [PubMed]
- Turetsky, B.; Cowell, P.E.; Gur, R.C.; Grossman, R.I.; Shtasel, D.L. Frontal and temporal lobe brain volumes in schizophrenia. Relationship to symptoms and clinical subtype. Arch. Gen. Psychiatry 1995, 52, 1061–1070. [Google Scholar] [CrossRef] [PubMed]
- Shenton, M.E.; Whitford, T.J.; Kubicki, M. Structural neuroimaging in schizophrenia from methods to insights to treatments. Dialog Clin. Neurosci. 2010, 12, 317–332. [Google Scholar]
- Baaré, W.F.C.; Van Oel, C.J.; Pol, H.H.; Schnack, H.G.; Durston, S.; Sitskoorn, M.M.; Kahn, R.S. Volumes of brain structures in twins discordant for schizophrenia. Arch. Gen. Psychiatry 2001, 58, 33–40. [Google Scholar] [CrossRef]
- Laird, A.R.; McMillan, K.M.; Lancaster, J.L.; Kochunov, P.; Turkeltaub, P.E.; Pardo, J.V.; Fox, P.T. A comparison of label-based review and ALE meta-analysis in the Stroop task. Hum. Brain Mapp. 2005, 25, 6–21. [Google Scholar] [CrossRef]
- Laird, A.R.; Fox, P.M.; Price, C.J.; Glahn, D.C.; Uecker, A.M.; Lancaster, J.L.; Turkeltaub, P.E.; Kochunov, P.; Fox, P.T. ALE meta-analysis: Controlling the false discovery rate and performing statistical contrasts. Hum. Brain Mapp. 2005, 25, 155–164. [Google Scholar] [CrossRef]
- Steen, R.; Mull, C.; McClure, R.; Hamer, R.M.; Lieberman, J.A. Brain volume in first-episode schizophrenia. Br. J. Psychiatry 2006, 188, 510–518. [Google Scholar] [CrossRef] [Green Version]
- MacFall, J.R.; Payne, M.E.; Krishnan, K.R.R. MR scanner geometry changes: Phantom measurements compared to intracranial contents calculations. Proc. Int. Soc. Mag. Reson. Med. 2004, 11, 2182. [Google Scholar]
- Wang, D.; Doddrell, D.M. MR image-based measurement of rates of change in volumes of brain structures. Part I: Method and validation. Magn. Reson. Imaging 2002, 20, 27–40. [Google Scholar] [CrossRef]
- Haller, J.W.; Banerjee, A.; Christensen, G.E.; Gado, M.; Joshi, S.; Miller, M.I.; Sheline, Y.; Vannier, M.W.; Csernansky, J.G. Three-dimensional hippocampal MR morphometry with high-dimensional transformation of a neuroanatomic atlas. Radiology 1997, 202, 504–510. [Google Scholar] [CrossRef]


| Study (Year) | Sample Size | Patient Age Mean (Years) | Male (DS) % | Diagnostic Criteria | Imaging Modality | ||
|---|---|---|---|---|---|---|---|
| DS Group n | NDS Group n | Control Group n | |||||
| Takayanagi et al. (2018) | 37 | 36 | 50 | 25.8 | 50 | PDS | MRI (ROI) |
| Xie et al. (2017) | 33 | 41 | 41 | 49.03 | 100 | SDS | MRI (ROI) |
| Makowski et al. (2017) | 21 (early PNS) | 44 | 44 | 23.2 | 71.4 | SANS | MRI (ROI and MAGeT) |
| Takahashi et al. (2017) | 38 | 37 | 59 | 27.1 | 57.9 | PDS | MRI (ROI) |
| De Rossi et al. (2016) | 22 | 22 | 22 | 39.2 | 77.3 | SDS | MRI (VBM) |
| Lei et al. (2015) | 33 | 42 | 41 | 22.33 | 66.6 | SDS | MRI (VBM and DTI) |
| Lei et al. (2015) | 44 | 44 | 44 | 23.16 | 59.1 | SDS | MRI (VBM) |
| Bodnar et al. (2014) | 16 (PNS) | 46 | 60 | 24.2 | 81.3 | SANS | MRI (VBM) |
| Voineskos et al. (2013) | 18 | 59 | 79 | 49 | 77.7 | PANSS | MRI (DTI) |
| Takayanagi et al. (2013) | 18 | 30 | 82 | 35.9 | 66.6 | SDS | MRI (DTI) |
| Volpe et al. (2012) | 10 | 8 | 8 | 35.8 | 90.0 | SDS | MRI (ROI) |
| Özdemir et al. (2012) | 11 | 18 | 17 | 32.36 | 63.6 | SDS | MRI (ROI) |
| Benoit et al. (2012) | 16 | 48 | 60 | 24.2 | 81.3 | PNS | MRI (VBM) |
| Kitis et al. (2012) | 11 | 18 | 17 | 32.36 | 63.6 | SDS | MRI (DTI) |
| Fischer et al. (2012) | 20 | 36 | 28 | 40.1 | 85.0 | SDS | MRI (ROI) |
| Cascella et al. (2010) | 19 | 31 | 90 | 35.1 | 84.2 | SDS | MRI (VBM) |
| Rowland et al. (2009) | 10 | 10 | 11 | 43 | 84.2 | SDS | MRI (DTI) |
| Koutsouleris et al. (2008) | 59 | 106 | 177 | 32.8 | 84.7 | PANSS | MRI (VBM) |
| Galderisi et al. (2008) | 34 | 32 | 31 | 35.8 | 73.5 | SDS | MRI (ROI) |
| Quarantelli et al. (2002) | 14 | 14 | 25 | NR | 92.9 | SDS | MRI (ROI) |
| Sigmundsson et al. (2001) | 27 | 0 | 27 | 34.9 | 96.3 | PANSS | MRI (ROI) |
| Sanfilippo et al. (2000) | 13 | 40 | 29 | NR | NR | SANS | MRI (ROI) |
| Turetsky et al. (1995) | 21 | 49 | 77 | NR | 85.7 | SANS SCOS | MRI (ROI) |
| Buchanan et al. (1993) | 17 | 24 | 30 | 35.5 | NR | SDS | MRI (ROI) |
| Total | 562 | 835 | 1149 | ||||
| Mean | 23.4 | 36.3 | 47.9 | 33.4 | 77.0 | ||
| DS Patients vs. Controls | Heterogeneity | ||||||
|---|---|---|---|---|---|---|---|
| Region | No of Studies | No. of DS/HC | Effect Size (95% CI) | Effect Size p Value | Q | I2 (%) | p Value |
| TBV | 8 | 163/362 | −0.161 (−0.362 to 0.040) | 0.117 | 7.56 | 7.4 | 0.373 |
| GM | 5 | 88/215 | −0.433 (−0.853 to −0.014) | 0.043 | 9.78 | 59.1 | 0.044 |
| WM | 4 | 69/155 | −0.319 (−0.619 to −0.018) | 0.038 | 1.15 | 0.0 | 0.765 |
| CSF | 5 | 89/183 | 0.107 (−0.158 to 0.373) | 0.428 | 1.81 | 0.0 | 0.771 |
| DS Patients vs. NDS Patients | Heterogeneity | ||||||
|---|---|---|---|---|---|---|---|
| Region | No of Studies | No. of DS/NDS | Effect Size (95% CI) | Effect Size p Value | Q | I2 (%) | p Value |
| TBV | 7 | 136/230 | 0.066 (−0.152 to 0.283) | 0.554 | 2.94 | 0.0 | 0.816 |
| GM | 4 | 61/133 | −0.061 (−0.409 to 0.287) | 0.732 | 3.67 | 18.3 | 0.299 |
| WM | 3 | 42/102 | −0.046 (−0.533 to 0.440) | 0.852 | 3.19 | 37.4 | 0.203 |
| CSF | 4 | 62/138 | 0.121 (−0.185 to 0.426) | 0.439 | 0.021 | 0.0 | 0.999 |
| NDS Patients vs. Controls | Heterogeneity | ||||||
|---|---|---|---|---|---|---|---|
| Region | No of Studies | No. of NDS/HC | Effect Size (95% CI) | Effect Size p Value | Q | I2 (%) | p Value |
| TBV | 7 | 230/332 | −0.212 (−0.384 to 0.041) | 0.015 | 2.38 | 0.0 | 0.882 |
| GM | 4 | 133/218 | −0.272 (−0.566 to 0.022) | 0.070 | 4.76 | 36.9 | 0.191 |
| WM | 3 | 102/128 | −0.283 (−0.545 to −0.021) | 0.034 | 1.34 | 0.0 | 0.513 |
| CSF | 4 | 138/156 | −0.113 (−0.344 to 0.118) | 0.337 | 0.97 | 0.0 | 0.808 |
© 2020 by the authors. Licensee MDPI, Basel, Switzerland. This article is an open access article distributed under the terms and conditions of the Creative Commons Attribution (CC BY) license (http://creativecommons.org/licenses/by/4.0/).
Share and Cite
Chee, T.T.; Chua, L.; Morrin, H.; Lim, M.F.; Fam, J.; Ho, R. Neuroanatomy of Patients with Deficit Schizophrenia: An Exploratory Quantitative Meta-Analysis of Structural Neuroimaging Studies. Int. J. Environ. Res. Public Health 2020, 17, 6227. https://0-doi-org.brum.beds.ac.uk/10.3390/ijerph17176227
Chee TT, Chua L, Morrin H, Lim MF, Fam J, Ho R. Neuroanatomy of Patients with Deficit Schizophrenia: An Exploratory Quantitative Meta-Analysis of Structural Neuroimaging Studies. International Journal of Environmental Research and Public Health. 2020; 17(17):6227. https://0-doi-org.brum.beds.ac.uk/10.3390/ijerph17176227
Chicago/Turabian StyleChee, Tji Tjian, Louis Chua, Hamilton Morrin, Mao Fong Lim, Johnson Fam, and Roger Ho. 2020. "Neuroanatomy of Patients with Deficit Schizophrenia: An Exploratory Quantitative Meta-Analysis of Structural Neuroimaging Studies" International Journal of Environmental Research and Public Health 17, no. 17: 6227. https://0-doi-org.brum.beds.ac.uk/10.3390/ijerph17176227