Can Haematological and Hormonal Biomarkers Predict Fitness Parameters in Youth Soccer Players? A Pilot Study

 , , ,
, , ,  , , ,
, , ,  and
and
Abstract
:1. Introduction
2. Materials and Methods
2.1. Participants
2.2. Experimental Design
2.3. Anthropometric Evaluation
2.4. Biochemical Collection and Evaluation
2.5. Countermovement Jump (CMJ)
2.6. Ten Meter Sprint
2.7. Aerobic Evaluation
2.8. RSA Test
2.9. Statistical Analyses
3. Results
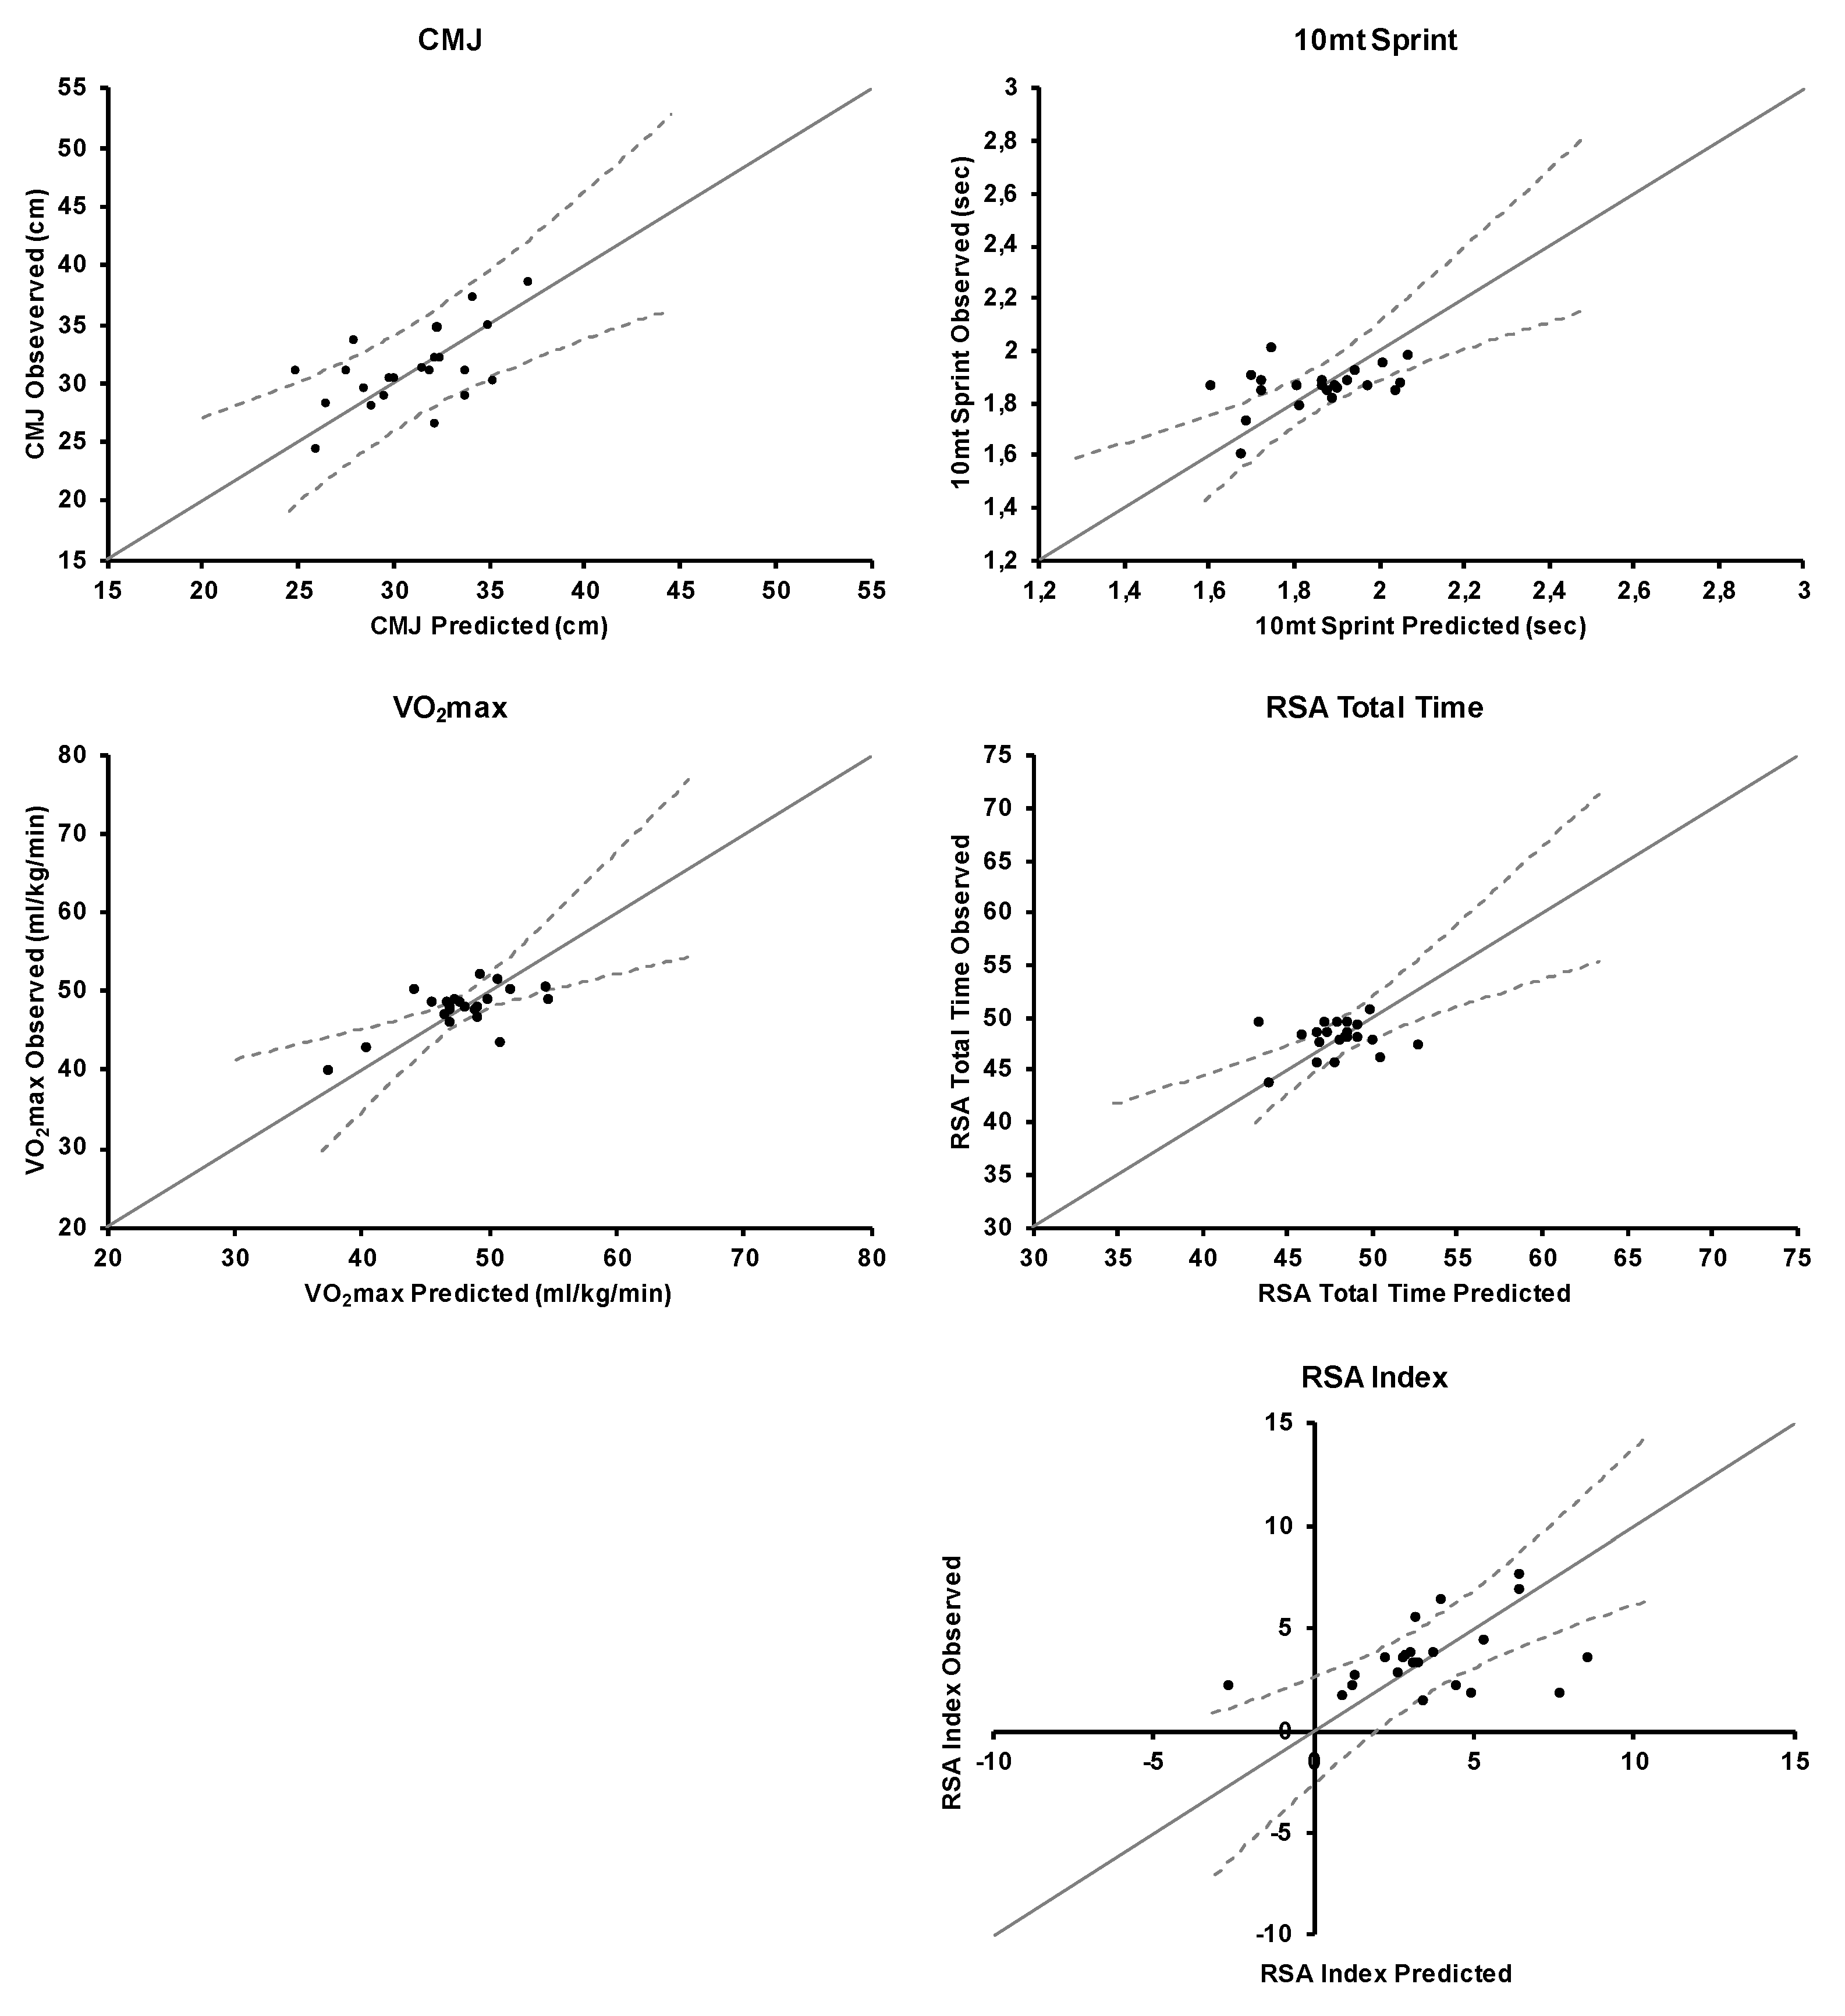
3.1. CMJ
3.2. 10 m Sprint
3.3. VO2max
3.4. RSA Total Time
3.5. RSA Index
4. Discussion
5. Conclusions
Author Contributions
Funding
Acknowledgments
Conflicts of Interest
References
- Manna, I.; Khanna, G.L.; Chandra Dhara, P. Effect of training on physiological and biochemical variables of soccer players of different age groups. Asian J. Sports Med. 2010, 1, 5–22. [Google Scholar] [CrossRef] [Green Version]
- Maria, T.S.; de Arruda, M.; Portella, D.; Vargas, R.V.; Gomez Campos, R.; Martinez Salazar, C. Hematological parameters of elite soccer players during the competitive period. J. Exerc. Physiol. Online 2013, 16, 68–76. [Google Scholar]
- Pedersen, B.K.; Febbraio, M.A. Point: Interleukin-6 does have a beneficial role in insulin sensitivity and glucose homeostasis. J. Appl. Physiol. 2007, 102, 814–816. [Google Scholar] [CrossRef] [PubMed]
- Vasconcelos, E.d.S.; Salla, R.F. Role of interleukin-6 and interleukin-15 in exercise. MOJ Immunol. 2018, 6, 1–3. [Google Scholar] [CrossRef]
- Djaoui, L.; Haddad, M.; Chamari, K.; Dellal, A. Monitoring training load and fatigue in soccer players with physiological markers. Physiol. Behav. 2017, 181, 86–94. [Google Scholar] [CrossRef] [PubMed]
- Malone, S.; Mendes, B.; Hughes, B.; Roe, M.; Devenney, S.; Collins, K.; Owen, A. Decrements in Neuromuscular Performance and Increases in Creatine Kinase Impact Training Outputs in Elite Soccer Players. J. Strength Cond. Res. 2018, 32, 1342–1351. [Google Scholar] [CrossRef]
- Pascoal, E.H.F.; Borges, J.H.; Franciscon, C.A.; Andrade, L.; Pagoto Spigolon, L.M.; Borin, J.P. Pre-Season Training Affects Negatively the Immunological Parameters and Creatine Kinase but Not Power Performance in Young Soccer Players. Arch. Sports Med. 2018, 2. [Google Scholar] [CrossRef]
- Kadi, F. Cellular and molecular mechanisms responsible for the action of testosterone on human skeletal muscle. A basis for illegal performance enhancement. Br. J. Pharm. 2008, 154, 522–528. [Google Scholar] [CrossRef] [Green Version]
- Spiering, B.A.; Kraemer, W.J.; Anderson, J.M.; Armstrong, L.E.; Nindl, B.C.; Volek, J.S.; Judelson, D.A.; Joseph, M.; Vingren, J.L.; Hatfield, D.L.; et al. Effects of elevated circulating hormones on resistance exercise-induced Akt signaling. Med. Sci. Sports Exerc. 2008, 40, 1039–1048. [Google Scholar] [CrossRef]
- Mujika, I.; Chatard, J.C.; Padilla, S.; Guezennec, C.Y.; Geyssant, A. Hormonal responses to training and its tapering off in competitive swimmers: Relationships with performance. Eur. J. Appl. Physiol. Occup. Physiol. 1996, 74, 361–366. [Google Scholar] [CrossRef]
- Roli, L.; De Vincentis, S.; Rocchi, M.B.L.; Trenti, T.; De Santis, M.C.; Savino, G. Testosterone, cortisol, hGH, and IGF-1 levels in an Italian female elite volleyball team. Health Sci. Rep. 2018, 1, e32. [Google Scholar] [CrossRef] [PubMed]
- Perroni, F.; Fittipaldi, S.; Falcioni, L.; Ghizzoni, L.; Borrione, P.; Vetrano, M.; Del Vescovo, R.; Migliaccio, S.; Guidetti, L.; Baldari, C. Effect of pre-season training phase on anthropometric, hormonal and fitness parameters in young soccer players. PLoS ONE 2019, 14, e0225471. [Google Scholar] [CrossRef] [PubMed]
- Andrzejewski, M.; Podgorski, T.; Krysciak, J.; Chmura, P.; Konefal, M.; Chmura, J.; Marynowicz, J.; Adrian, J.; Pluta, B. Anabolic-catabolic hormonal responses in youth soccer players during a half-season. Res. Sports Med. 2020, 1–14. [Google Scholar] [CrossRef] [PubMed]
- Romagnoli, M.; Sanchis-Gomar, F.; Alis, R.; Risso-Ballester, J.; Bosio, A.; Graziani, R.L.; Rampinini, E. Changes in muscle damage, inflammation, and fatigue-related parameters in young elite soccer players after a match. J. Sports Med. Phys. Fit. 2016, 56, 1198–1205. [Google Scholar]
- Suzuki, K. Chronic Inflammation as an Immunological Abnormality and Effectiveness of Exercise. Biomolecules 2019, 9, 223. [Google Scholar] [CrossRef] [PubMed] [Green Version]
- Araujo, N.C.; Neto, A.M.M.; Fujimori, M.; Bortolini, M.S.; Justino, A.B.; Honorio-Franca, A.C.; Luzia Franca, E. Immune and Hormonal Response to High-intensity Exercise During Orienteering. Int. J. Sports Med. 2019, 40, 768–773. [Google Scholar] [CrossRef] [PubMed]
- Fischer, C.P. Interleukin-6 in acute exercise and training: What is the biological relevance? Exerc. Immunol. Rev. 2006, 12, 6–33. [Google Scholar] [PubMed]
- Nielsen, H.G.; Oktedalen, O.; Opstad, P.K.; Lyberg, T. Plasma Cytokine Profiles in Long-Term Strenuous Exercise. J. Sports Med. 2016, 2016, 7186137. [Google Scholar] [CrossRef] [Green Version]
- Scheffer, D.D.L.; Latini, A. Exercise-induced immune system response: Anti-inflammatory status on peripheral and central organs. Biochim. Biophys. Acta Mol. Basis Dis. 2020, 1866, 165823. [Google Scholar] [CrossRef]
- Heisterberg, M.F.; Fahrenkrug, J.; Krustrup, P.; Storskov, A.; Kjaer, M.; Andersen, J.L. Extensive monitoring through multiple blood samples in professional soccer players. J. Strength Cond. Res. 2013, 27, 1260–1271. [Google Scholar] [CrossRef]
- Silva, J.R.; Rumpf, M.C.; Hertzog, M.; Castagna, C.; Farooq, A.; Girard, O.; Hader, K. Acute and Residual Soccer Match-Related Fatigue: A Systematic Review and Meta-analysis. Sports Med. 2018, 48, 539–583. [Google Scholar] [CrossRef] [PubMed]
- Palacios, G.; Pedrero-Chamizo, R.; Palacios, N.; Maroto-Sanchez, B.; Aznar, S.; Gonzalez-Gross, M.; Group, E.S. Biomarkers of physical activity and exercise. Nutr. Hosp. 2015, 31 (Suppl. S3), 237–244. [Google Scholar] [CrossRef] [Green Version]
- Stiles, V.H.; James, I.T.; Dixon, S.J.; Guisasola, I.N. Natural turf surfaces: The case for continued research. Sports Med. 2009, 39, 65–84. [Google Scholar] [CrossRef] [PubMed]
- Bosco, C.; Luhtanen, P.; Komi, P.V. A simple method for measurement of mechanical power in jumping. Eur. J. Appl. Physiol. Occup. Physiol. 1983, 50, 273–282. [Google Scholar] [CrossRef] [PubMed]
- Cronin, J.B.; Templeton, R.L. Timing light height affects sprint times. J. Strength Cond. Res. 2008, 22, 318–320. [Google Scholar] [CrossRef] [PubMed]
- Delaney, J.A.; Cummins, C.J.; Thornton, H.R.; Duthie, G.M. Importance, Reliability, and Usefulness of Acceleration Measures in Team Sports. J. Strength Cond. Res. 2018, 32, 3485–3493. [Google Scholar] [CrossRef] [PubMed] [Green Version]
- Bangsbo, J.; Iaia, F.M.; Krustrup, P. The Yo-Yo intermittent recovery test: A useful tool for evaluation of physical performance in intermittent sports. Sports Med. 2008, 38, 37–51. [Google Scholar] [CrossRef] [PubMed]
- Krustrup, P.; Mohr, M.; Amstrup, T.; Rysgaard, T.; Johansen, J.; Steensberg, A.; Pedersen, P.K.; Bangsbo, J. The yo-yo intermittent recovery test: Physiological response, reliability, and validity. Med. Sci. Sports Exerc. 2003, 35, 697–705. [Google Scholar] [CrossRef]
- Buchheit, M.; Mendez-Villanueva, A.; Delhomel, G.; Brughelli, M.; Ahmaidi, S. Improving repeated sprint ability in young elite soccer players: Repeated shuttle sprints vs. explosive strength training. J. Strength Cond. Res. 2010, 24, 2715–2722. [Google Scholar] [CrossRef]
- Carling, C.; Le Gall, F.; Dupont, G. Analysis of repeated high-intensity running performance in professional soccer. J. Sports Sci. 2012, 30, 325–336. [Google Scholar] [CrossRef]
- Chaouachi, A.; Manzi, V.; Chaalali, A.; Wong del, P.; Chamari, K.; Castagna, C. Determinants analysis of change-of-direction ability in elite soccer players. J. Strength Cond. Res. 2012, 26, 2667–2676. [Google Scholar] [CrossRef] [PubMed]
- Di Salvo, V.; Gregson, W.; Atkinson, G.; Tordoff, P.; Drust, B. Analysis of high intensity activity in Premier League soccer. Int. J. Sports Med. 2009, 30, 205–212. [Google Scholar] [CrossRef] [PubMed]
- Bangsbo, J.; Norregaard, L.; Thorso, F. Activity profile of competition soccer. Can. J. Sport Sci. 1991, 16, 110–116. [Google Scholar] [PubMed]
- Petrigna, L.; Karsten, B.; Marcolin, G.; Paoli, A.; D’Antona, G.; Palma, A.; Bianco, A. A Review of Countermovement and Squat Jump Testing Methods in the Context of Public Health Examination in Adolescence: Reliability and Feasibility of Current Testing Procedures. Front. Physiol. 2019, 10, 1384. [Google Scholar] [CrossRef] [Green Version]
- Bagger, M.; Petersen, P.H.; Pedersen, P.K. Biological variation in variables associated with exercise training. Int. J. Sports Med. 2003, 24, 433–440. [Google Scholar] [CrossRef]
- Castagna, C.; Abt, G.; Manzi, V.; Annino, G.; Padua, E.; D’Ottavio, S. Effect of recovery mode on repeated sprint ability in young basketball players. J. Strength Cond. Res. 2008, 22, 923–929. [Google Scholar] [CrossRef]
- Fitzsimmons, M.; Dawson, B.; Ward, D.; Wilkinson, A.W.; Dawson-Hughes, B.; Ware, D.; Fitzsimons, M.A. Cycling and running tests of repeated sprint ability. Aust. J. Sci. Med. Sport 1993, 25, 82–87. [Google Scholar]
- Spencer, M.; Bishop, D.; Dawson, B.; Goodman, C. Physiological and metabolic responses of repeated-sprint activities: Specific to field-based team sports. Sports Med. 2005, 35, 1025–1044. [Google Scholar] [CrossRef]
- Burgess, D.; Naughton, G.; Hopkins, W. Draft-camp predictors of subsequent career success in the Australian Football League. J. Sci. Med. Sport 2012, 15, 561–567. [Google Scholar] [CrossRef]
- Haycraft, J.A.Z.; Kovalchik, S.; Pyne, D.B.; Robertson, S. Physical characteristics of players within the Australian Football League participation pathways: A systematic review. Sports Med. Open 2017, 3, 46. [Google Scholar] [CrossRef] [Green Version]
- Robertson, S.; Woods, C.; Gastin, P. Predicting higher selection in elite junior Australian Rules football: The influence of physical performance and anthropometric attributes. J. Sci. Med. Sport 2015, 18, 601–606. [Google Scholar] [CrossRef] [PubMed]
- Woods, C.T.; Banyard, H.G.; McKeown, I.; Fransen, J.; Robertson, S. Discriminating Talent Identified Junior Australian Footballers Using a Fundamental Gross Athletic Movement Assessment. J. Sports Sci. Med. 2016, 15, 548–553. [Google Scholar] [PubMed]
- Woods, C.T.; Veale, J.P.; Collier, N.; Robertson, S. The use of player physical and technical skill match activity profiles to predict position in the Australian Football League draft. J. Sports Sci. 2017, 35, 325–330. [Google Scholar] [CrossRef] [PubMed] [Green Version]
- Kraemer, W.J.; French, D.N.; Paxton, N.J.; Hakkinen, K.; Volek, J.S.; Sebastianelli, W.J.; Putukian, M.; Newton, R.U.; Rubin, M.R.; Gomez, A.L.; et al. Changes in exercise performance and hormonal concentrations over a big ten soccer season in starters and nonstarters. J. Strength Cond. Res. 2004, 18, 121–128. [Google Scholar] [CrossRef]
- Lee, E.C.; Fragala, M.S.; Kavouras, S.A.; Queen, R.M.; Pryor, J.L.; Casa, D.J. Biomarkers in Sports and Exercise: Tracking Health, Performance, and Recovery in Athletes. J. Strength Cond. Res. 2017, 31, 2920–2937. [Google Scholar] [CrossRef] [Green Version]
- Meyer, T.; Meister, S. Routine blood parameters in elite soccer players. Int. J. Sports Med. 2011, 32, 875–881. [Google Scholar] [CrossRef]
- Silva, J.R.; Rebelo, A.; Marques, F.; Pereira, L.; Seabra, A.; Ascensao, A.; Magalhaes, J. Biochemical impact of soccer: An analysis of hormonal, muscle damage, and redox markers during the season. Appl. Physiol. Nutr. Metab. 2014, 39, 432–438. [Google Scholar] [CrossRef] [Green Version]
- Walker, A.J.; McFadden, B.A.; Sanders, D.J.; Rabideau, M.M.; Hofacker, M.L.; Arent, S.M. Biomarker Response to a Competitive Season in Division I Female Soccer Players. J. Strength Cond. Res. 2019, 33, 2622–2628. [Google Scholar] [CrossRef]
- Wu, P.P.; Sterkenburg, N.; Everett, K.; Chapman, D.W.; White, N.; Mengersen, K. Predicting fatigue using countermovement jump force-time signatures: PCA can distinguish neuromuscular versus metabolic fatigue. PLoS ONE 2019, 14, e0219295. [Google Scholar] [CrossRef] [Green Version]
- Banfi, G.; Colombini, A.; Lombardi, G.; Lubkowska, A. Metabolic markers in sports medicine. Adv. Clin. Chem. 2012, 56, 1–54. [Google Scholar] [CrossRef]
- Montero, D.; Lundby, C. Regulation of Red Blood Cell Volume with Exercise Training. Compr. Physiol. 2018, 9, 149–164. [Google Scholar] [CrossRef] [PubMed]
- Smith, L.L. Cytokine hypothesis of overtraining: A physiological adaptation to excessive stress? Med. Sci. Sports Exerc. 2000, 32, 317–331. [Google Scholar] [CrossRef] [PubMed]
- Gullich, A. Selection, de-selection and progression in German football talent promotion. Eur. J. Sport Sci. 2014, 14, 530–537. [Google Scholar] [CrossRef]
- Hoare, D.G.; Warr, C.R. Talent identification and women’s soccer: An Australian experience. J. Sports Sci. 2000, 18, 751–758. [Google Scholar] [CrossRef] [PubMed]
- Reeves, M.J.; Roberts, S.J.; McRobert, A.P.; Littlewood, M. Factors affecting the identification of talented junior-elite footballers: A case study. Soccer Soc. 2018, 19, 1106–1121. [Google Scholar] [CrossRef]
- Suppiah, H.T.; Low, C.Y.; Chia, M. Detecting and developing youth athlete potential: Different strokes for different folks are warranted. Br. J. Sports Med. 2015, 49, 878–882. [Google Scholar] [CrossRef]
- Unnithan, V.; White, J.; Georgiou, A.; Iga, J.; Drust, B. Talent identification in youth soccer. J. Sports Sci. 2012, 30, 1719–1726. [Google Scholar] [CrossRef]
- Johansson, A.; Fahlén, J. Simply the best, better than all the rest? Validity issues in selections in elite sport. Int. J. Sports Sci. Coach. 2017, 12, 470–480. [Google Scholar] [CrossRef]
- Carling, C.; Gregson, W.; McCall, A.; Moreira, A.; Wong del, P.; Bradley, P.S. Match running performance during fixture congestion in elite soccer: Research issues and future directions. Sports Med. 2015, 45, 605–613. [Google Scholar] [CrossRef] [Green Version]
- Hagglund, M.; Walden, M.; Magnusson, H.; Kristenson, K.; Bengtsson, H.; Ekstrand, J. Injuries affect team performance negatively in professional football: An 11-year follow-up of the UEFA Champions League injury study. Br. J. Sports Med. 2013, 47, 738–742. [Google Scholar] [CrossRef] [Green Version]
- Ekstrand, J. Keeping your top players on the pitch: The key to football medicine at a professional level. Br. J. Sports Med. 2013, 47, 723–724. [Google Scholar] [CrossRef] [Green Version]
- Arliani, G.G.; Astur, D.C.; Yamada, R.K.; Yamada, A.F.; Miyashita, G.K.; Mandelbaum, B.; Cohen, M. Early osteoarthritis and reduced quality of life after retirement in former professional soccer players. Clinics 2014, 69, 589–594. [Google Scholar] [CrossRef]

| Variables | Mean ± SD | (Min–Max) | CV% | |
|---|---|---|---|---|
| Dependent variables | CMJ (cm) | 30.98 ± 3.27 | (24.30–38.40) | 10.5% |
| 10 m sprint (s) | 1.86 ± 0.08 | (1.60–2.00) | 4.5% | |
| VO2max (mL/kg/min) | 47.94 ± 2.83 | (40.10–52.19) | 5.9% | |
| RSA Total time (s) | 48.06 ± 1.58 | (43.70–50.70) | 3.3% | |
| RSA Index | 3.61 ± 1.71 | (1.50–7.70) | 47.5% | |
| Independent variables | Age (months) | 161 ± 3 | (155–165) | 2.0% |
| BMI (kg/m2) | 19.37 ± 2.16) | (16.15–23.63 | 11.1% | |
| IL-6 (pg/mL) | 11.09 ± 5.40 | (1.00–24.00) | 48.7% | |
| IL-10 (pg/mL) | 15.76 ± 6.91 | (0–31.00) | 43.8% | |
| IL-17A (MFI) | 6.88 ± 5.18 | (1.00–28.00) | 75.2% | |
| TNF-a (pg/mL) | 51.59 ± 65.30 | (4.00–219.00) | 126% | |
| Erythrocytes (106/mL) | 5.38 ± 0.53 | (4.72–6.91) | 9.8% | |
| Leucocytes (103/mL) | 6.15 ± 1.30 | (3.54–9.26) | 21.1% | |
| Thrombocytes (103/mL) | 235 ± 50.6 | (134–378) | 21.5% | |
| Haemoglobin (g/dL) | 14.66 ± 0.78 | (12.90–16.20) | 5.3% | |
| Haematocrit (%) | 43.58 ± 2.04 | (39.80–49.30) | 4.7% | |
| C-reactive protein (mg/dL) | 0.03 ± 0.02 | (0.01–0.08) | 72.8% | |
| Lactate Dehydrogenase (U/L) | 273 ± 50.7 | (186–422) | 21.5% | |
| Creatine kinase (mg/dL) | 350 ± 258 | (99–1081) | 73.6% | |
| Cortisol (ng/mL) | 2.40 ± 1.56 | (0.84–7.64) | 64.9% | |
| Testosterone (ng/mL) | 0.06 ± 0.04 | (0.01–0.20) | 71.0% | |
| T/C Ratio (ng/mL) | 0.03 ± 0.02 | (0–0.9) | 64.5% | |
| Dependent Variable | Independent Variables | Standardised 𝛽 | Standard Error | t Value | p > |t| |
|---|---|---|---|---|---|
| CMJ | Age | −0.832 | 0.265 | −3.146 | 0.006 |
| IL-6 | 0.906 | 0.399 | 2.271 | 0.037 | |
| IL17 | −0.677 | 0.269 | −2.519 | 0.023 | |
| IL-10 | 0.649 | 0.333 | 1.949 | 0.069 | |
| Cortisol | 0.687 | 0.288 | 2.384 | 0.030 | |
| 10 m sprint | Age | 0.523 | 0.216 | 2.419 | 0.027 |
| TNF-α | −1.271 | 0.399 | −3.187 | 0.005 | |
| Haematocrit | −1.379 | 0.606 | −2.277 | 0.036 | |
| IL-10 | 0.591 | 0.272 | 2.171 | 0.044 | |
| VO2max | IL-6 | 0.505 | 0.186 | 2.714 | 0.019 |
| IL-10 | −0.393 | 0.155 | −2.534 | 0.026 | |
| Erythrocyte | 0.512 | 0.249 | 2.056 | 0.062 | |
| Haematocrit | 1.084 | 0.346 | 3.135 | 0.009 | |
| Thrombocyte | 0.859 | 0.216 | 3.971 | 0.002 | |
| PCR | 0.629 | 0.126 | 4.987 | <0.001 | |
| Leucocyte | −0.526 | 0.169 | −3.104 | 0.009 | |
| Cortisol | −0.536 | 0.134 | −3.993 | 0.002 | |
| Testosterone | 0.629 | 0.141 | 4.460 | 0.001 | |
| RSA Total Time | IL-6 | 1.030 | 0.365 | 2.823 | 0.012 |
| TNF-α | −0.798 | 0.447 | −1.786 | 0.092 | |
| Haematocrit | −1.236 | 0.678 | −1.822 | 0.086 | |
| Testosterone | 0.524 | 0.276 | 1.895 | 0.075 | |
| RSA Index | Age | −0.652 | 0.222 | −2.941 | 0.010 |
| Erythrocyte | −0.817 | 0.448 | −1.822 | 0.087 | |
| Thrombocyte | −1.301 | 0.389 | −3.343 | 0.004 | |
| PCR | −0.626 | 0.227 | −2.761 | 0.014 | |
| T/C ratio | −0.932 | 0.342 | −2.721 | 0.015 |
© 2020 by the authors. Licensee MDPI, Basel, Switzerland. This article is an open access article distributed under the terms and conditions of the Creative Commons Attribution (CC BY) license (http://creativecommons.org/licenses/by/4.0/).
Share and Cite
Perroni, F.; Migliaccio, S.; Borrione, P.; Vetrano, M.; Amatori, S.; Sisti, D.; Rocchi, M.B.L.; Salerno, G.; Vescovo, R.D.; Cavarretta, E.; et al. Can Haematological and Hormonal Biomarkers Predict Fitness Parameters in Youth Soccer Players? A Pilot Study. Int. J. Environ. Res. Public Health 2020, 17, 6294. https://0-doi-org.brum.beds.ac.uk/10.3390/ijerph17176294
Perroni F, Migliaccio S, Borrione P, Vetrano M, Amatori S, Sisti D, Rocchi MBL, Salerno G, Vescovo RD, Cavarretta E, et al. Can Haematological and Hormonal Biomarkers Predict Fitness Parameters in Youth Soccer Players? A Pilot Study. International Journal of Environmental Research and Public Health. 2020; 17(17):6294. https://0-doi-org.brum.beds.ac.uk/10.3390/ijerph17176294
Chicago/Turabian StylePerroni, Fabrizio, Silvia Migliaccio, Paolo Borrione, Mario Vetrano, Stefano Amatori, Davide Sisti, Marco B. L. Rocchi, Gerardo Salerno, Riccardo Del Vescovo, Elena Cavarretta, and et al. 2020. "Can Haematological and Hormonal Biomarkers Predict Fitness Parameters in Youth Soccer Players? A Pilot Study" International Journal of Environmental Research and Public Health 17, no. 17: 6294. https://0-doi-org.brum.beds.ac.uk/10.3390/ijerph17176294