Statistical Analysis of Safety Performance of Displaced Left-Turn Intersections: Case Studies in San Marcos, Texas


Abstract
:1. Introduction
2. Literature Review
3. Methodology
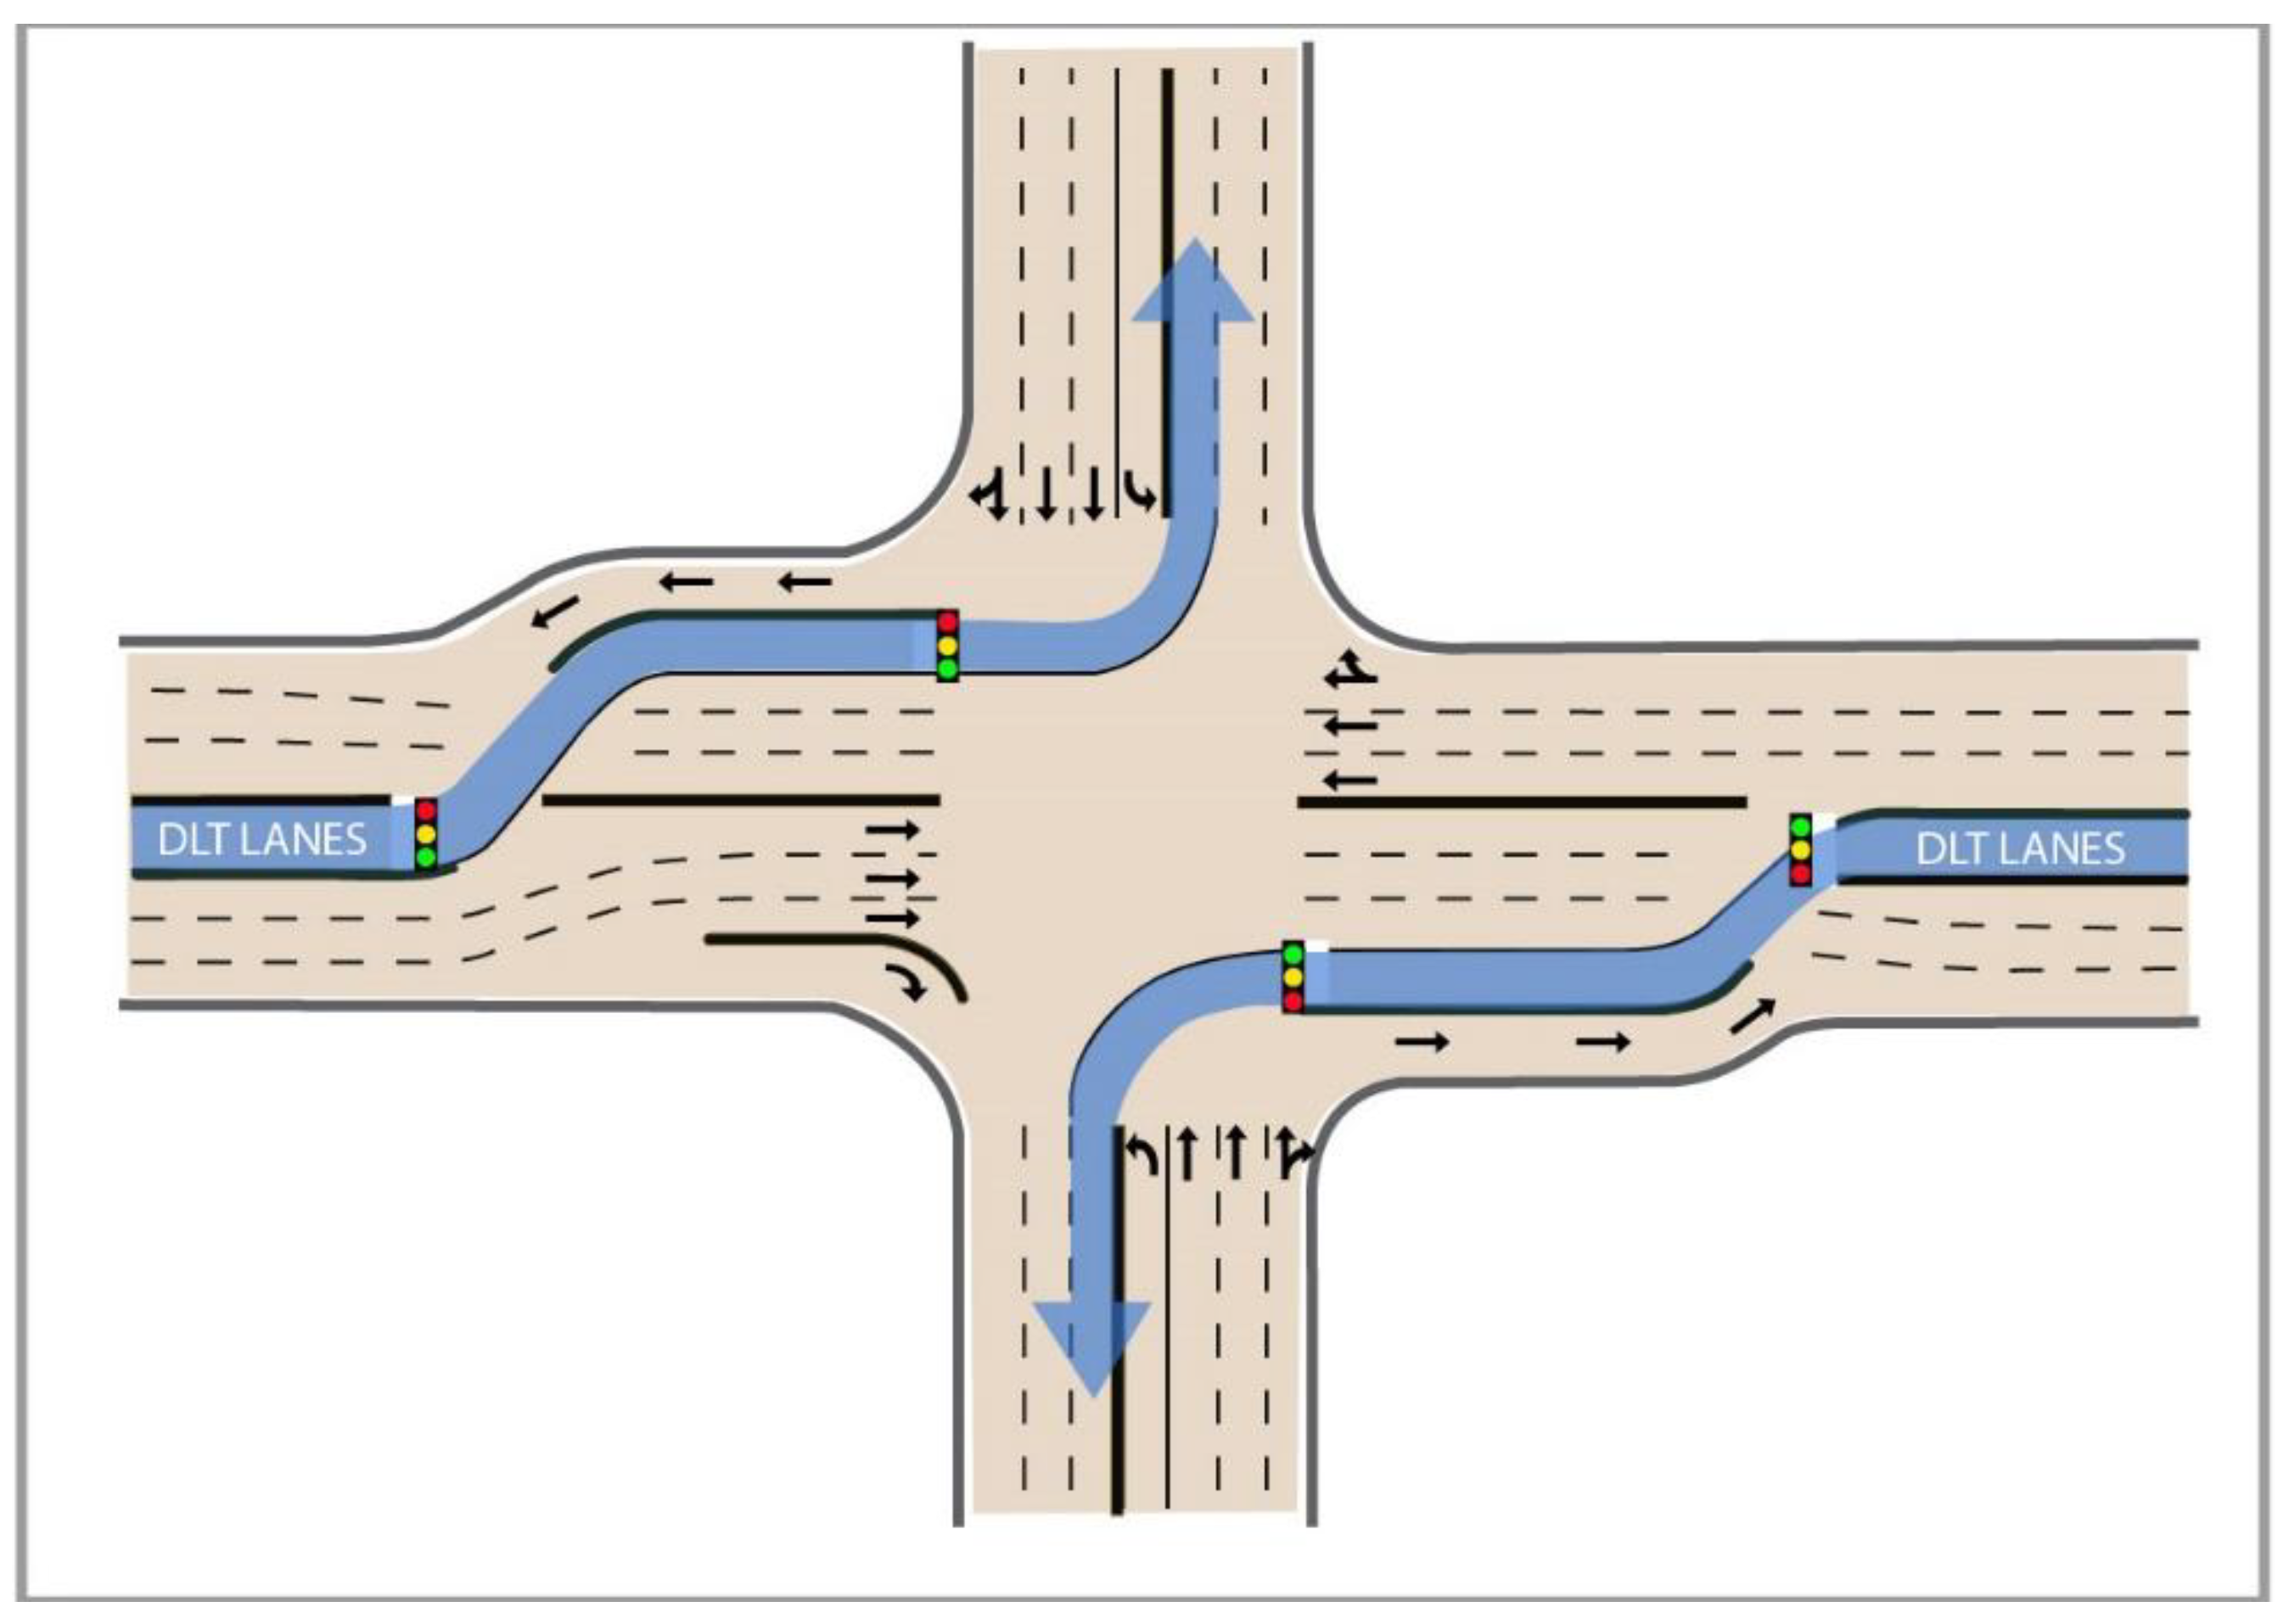
3.1. Study Sites
- (1)
- The DLT intersections are in Texas. For all the crashes that occurred in Texas, the research team had full access to not only the crash data, but also the detailed police crash reports for conducting collision diagram-based analysis.
- (2)
- The DLT intersections need to be implemented for more than 3 years. In this way, enough crash data before and after the implementation of the DLT design can be available for conducting a statistical analysis.
- (3)
- These two DLT intersections represent the two different types of DLT design: single-leg DLT (Loop 82 at IH 35) and two-leg DLT (SH 80 at IH 35).
3.2. Safety Analysis Methods
3.2.1. Statistical Analysis
3.2.2. Collision Diagram-Based Analysis
4. Results
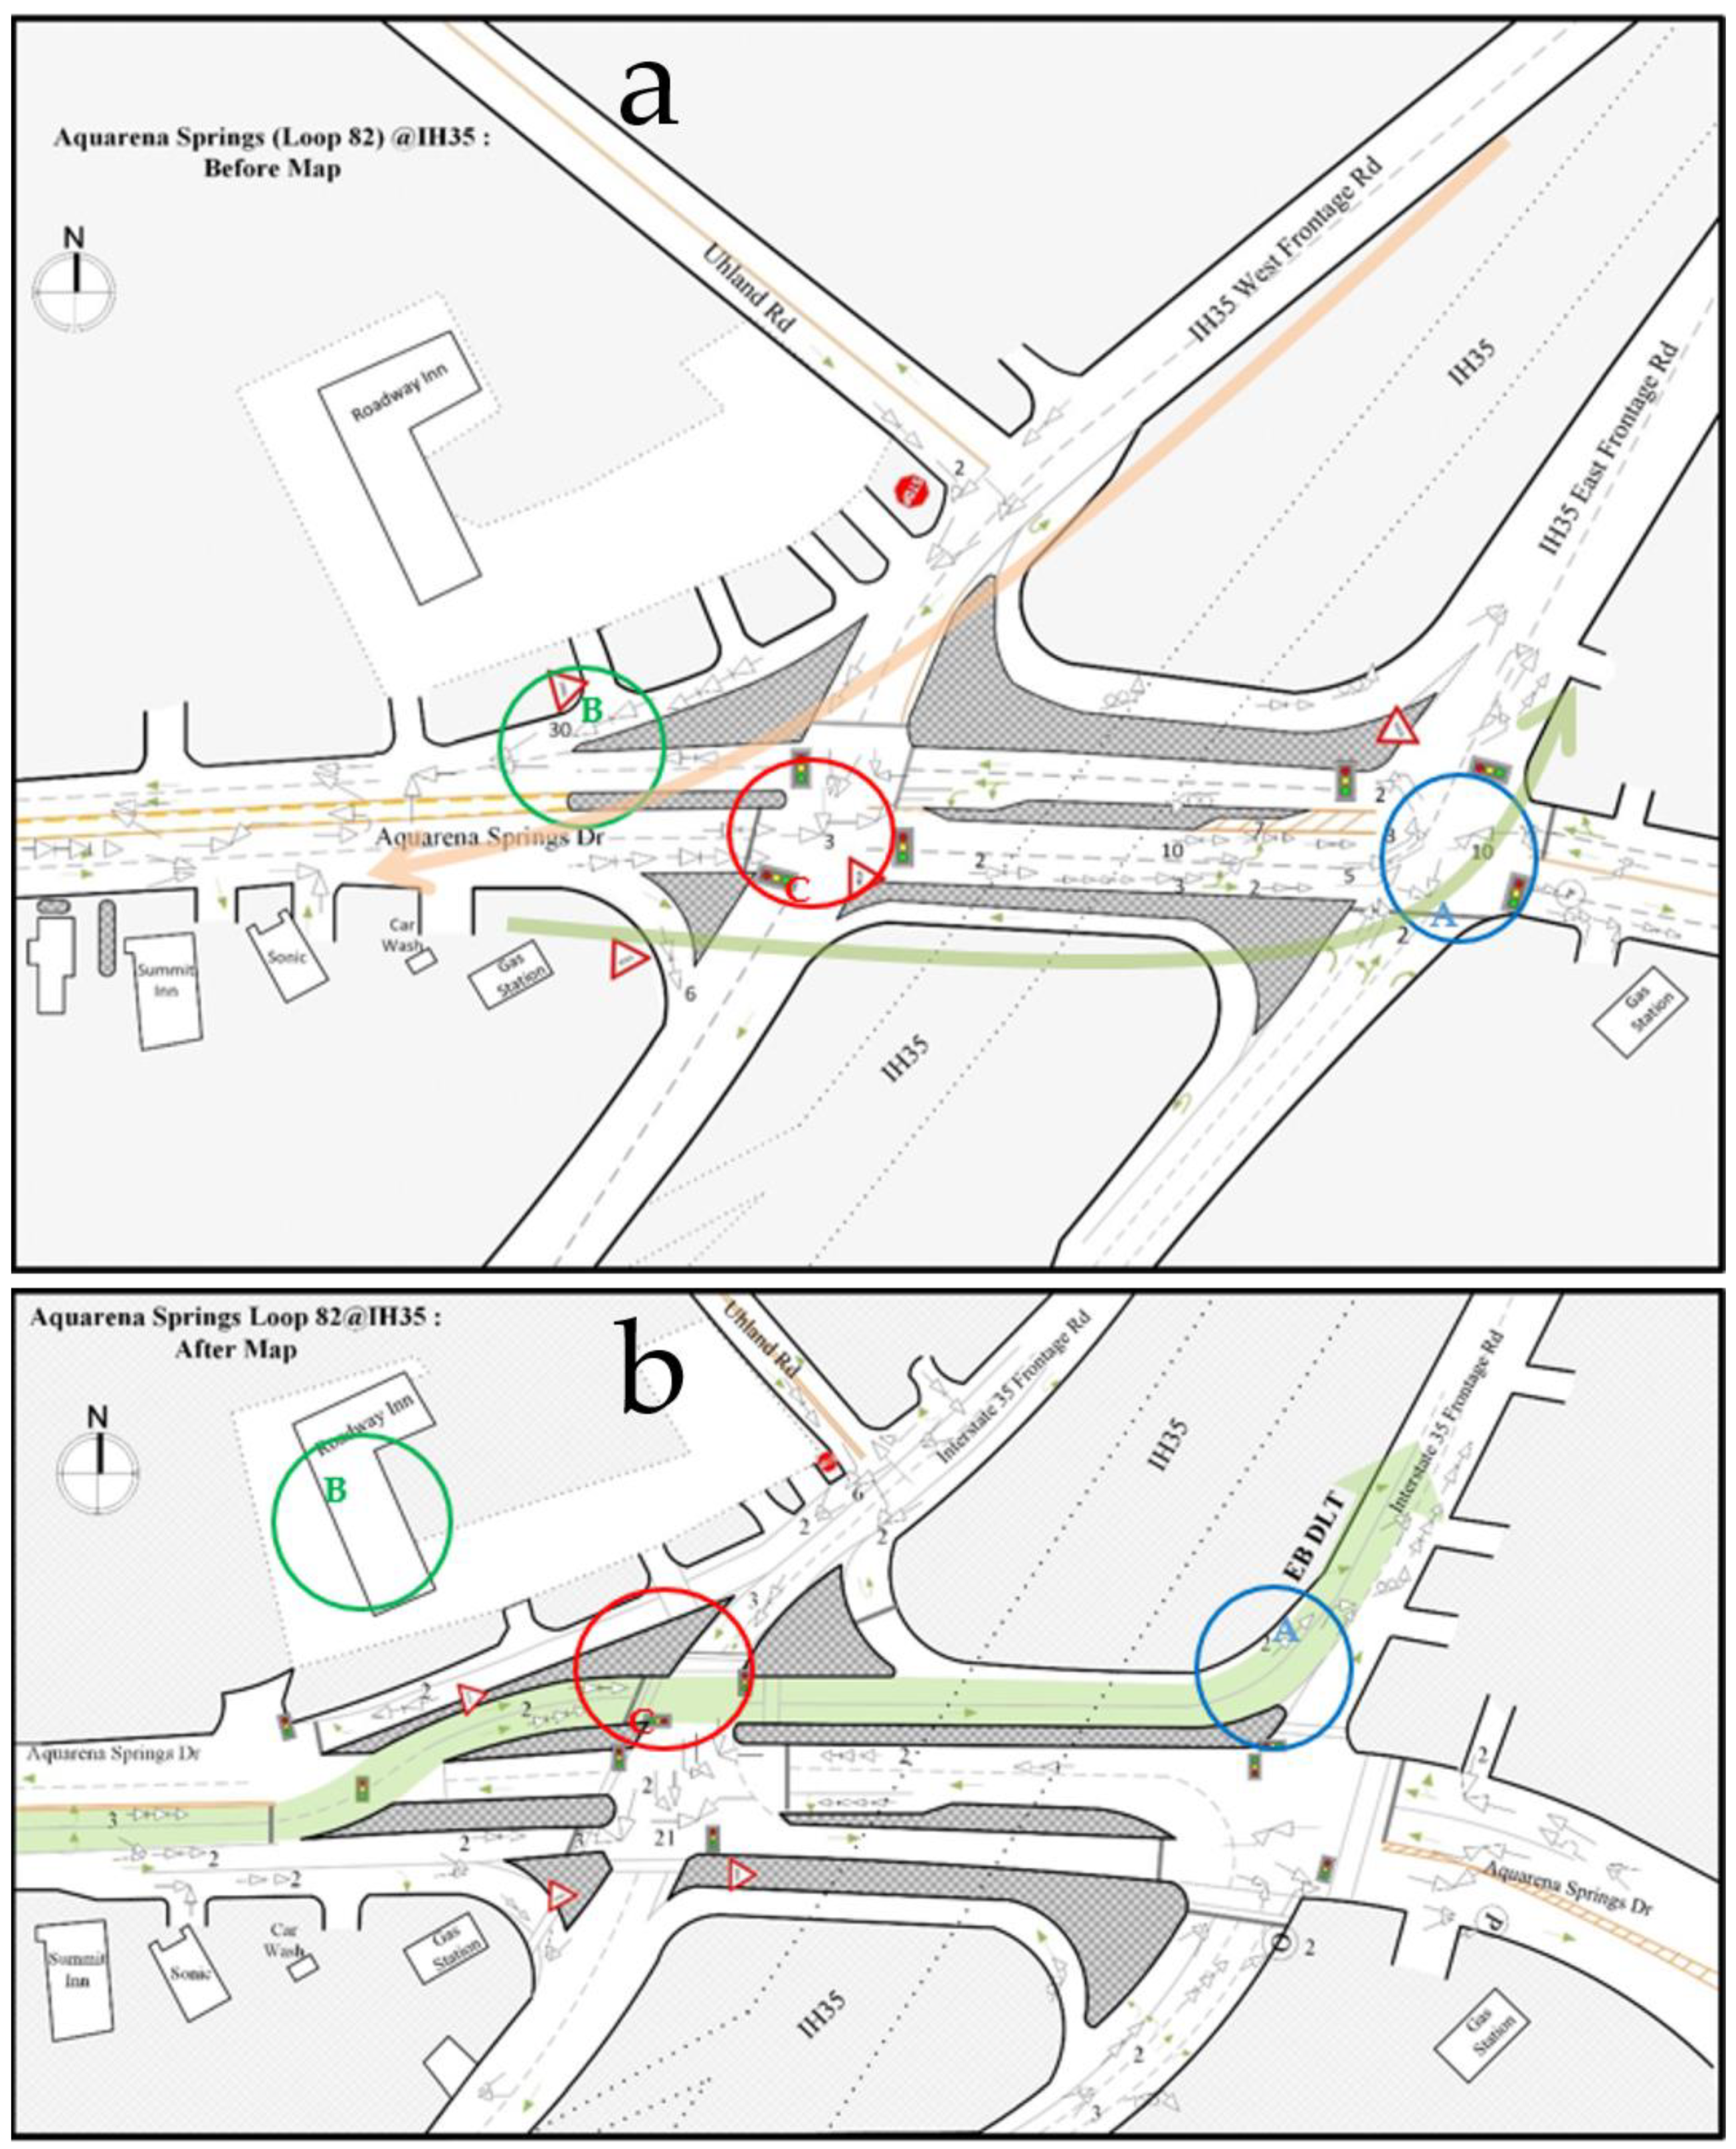
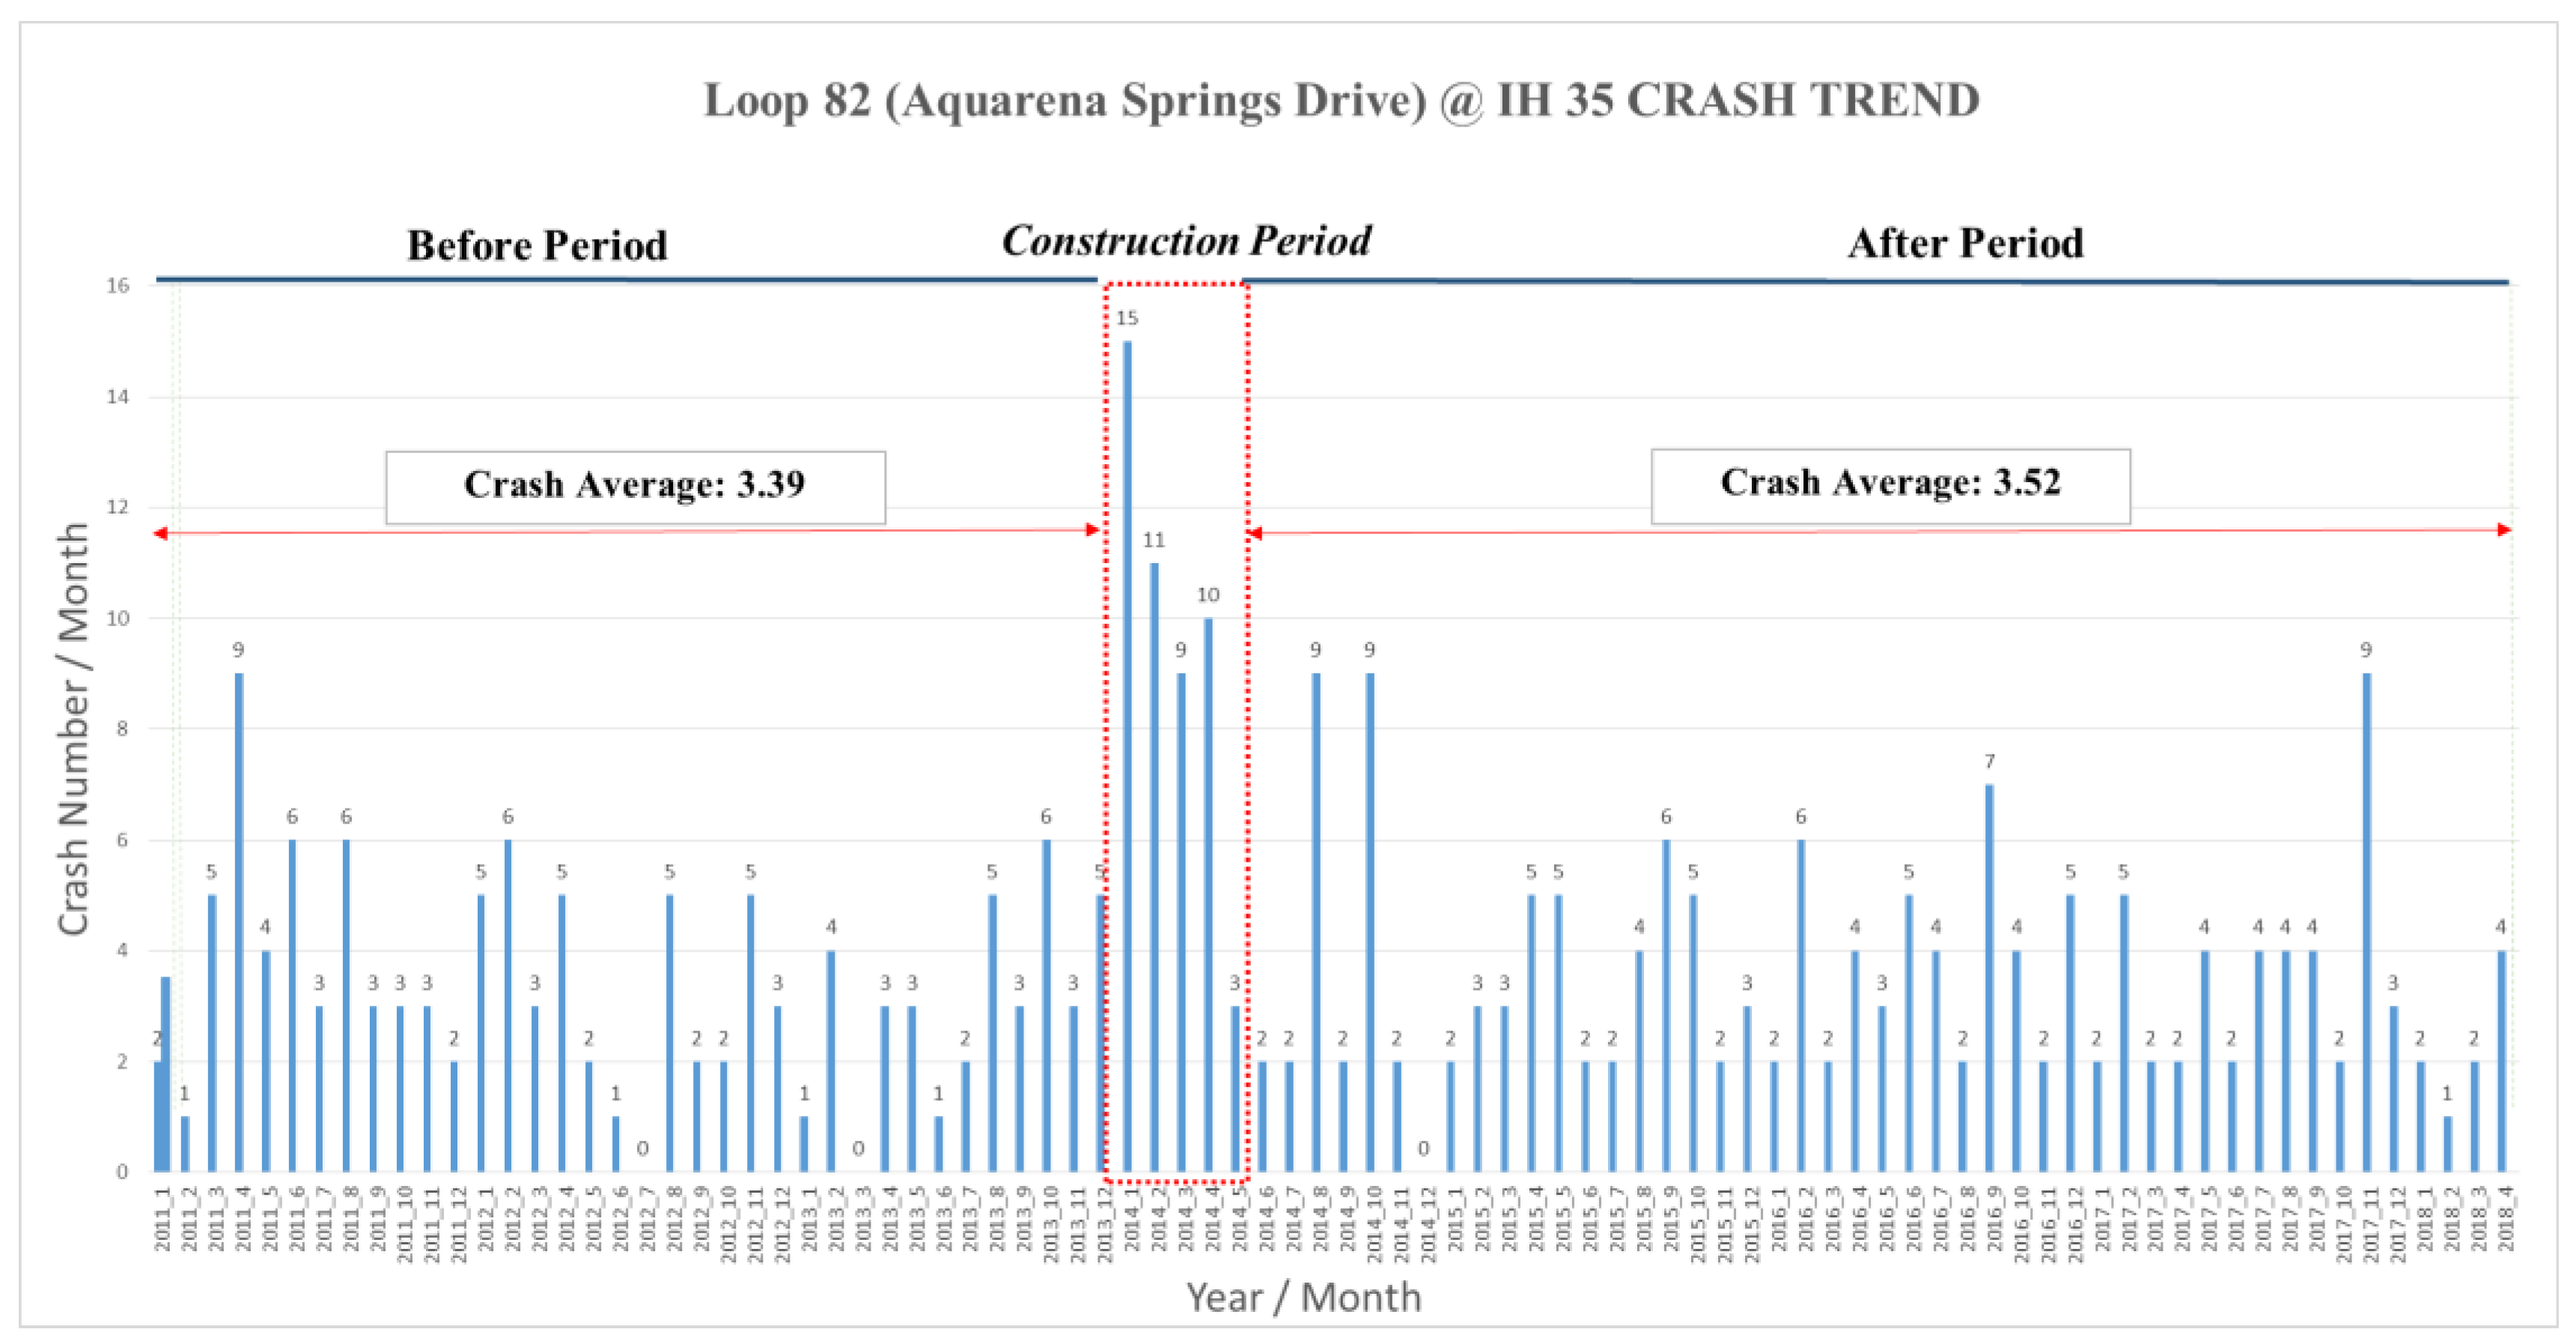
4.1. Intersection 1, Loop 82 (Aquarena Springs Drive) at IH 35
4.1.1. Statistical Analysis
Direct Comparison between the before and after Crash Frequencies
EB Method-Based before-and-after Comparison
4.1.2. Collision Diagram-Based Analysis
Safety Problems before the Implementation of DLT
- Traffic flow entering IH 35: Many vehicles move eastbound on Aquarena Springs Drive, make left turns at location A (blue circle), and then merge onto the IH 35 east frontage road. Due to the heavy left-turn traffic at location A, many crashes related to left turns occurred at this location, e.g., there were 10 left-turn angle crashes from January 2011 to December 2013. By conducting further analysis based on police crash reports, the following three major factors were identified that contributed to the high left-turn crash frequency before implementing DLT:
- (1)
- Disregarding the left-turn signage,
- (2)
- Drivers making left turns failed to yield the right of way, and
- (3)
- Drivers making dual left turns failed to keep their vehicles in a single lane.
- Traffic flow exiting IH 35: Many vehicles exit from the southbound lanes of IH 35, merge onto the west frontage road of IH 35, and then make right turns at location B (green circle) to merge into the traffic on Aquarena Springs Drive. Before the implementation of DLT, this right-turn merge point was controlled by a “yield” sign. Due to the high volume of vehicles making right turns and the high volume of traffic on Aquarena Springs Drive, it is difficult for the right turn drivers to find a sufficient gap to make a safe merge, so a long queue of vehicles forms in the right turn lane, which is the reason for the high frequency of rear-end crashes at this location (30 crashes in 36 months).
Safety Problems after the Implementation of DLT
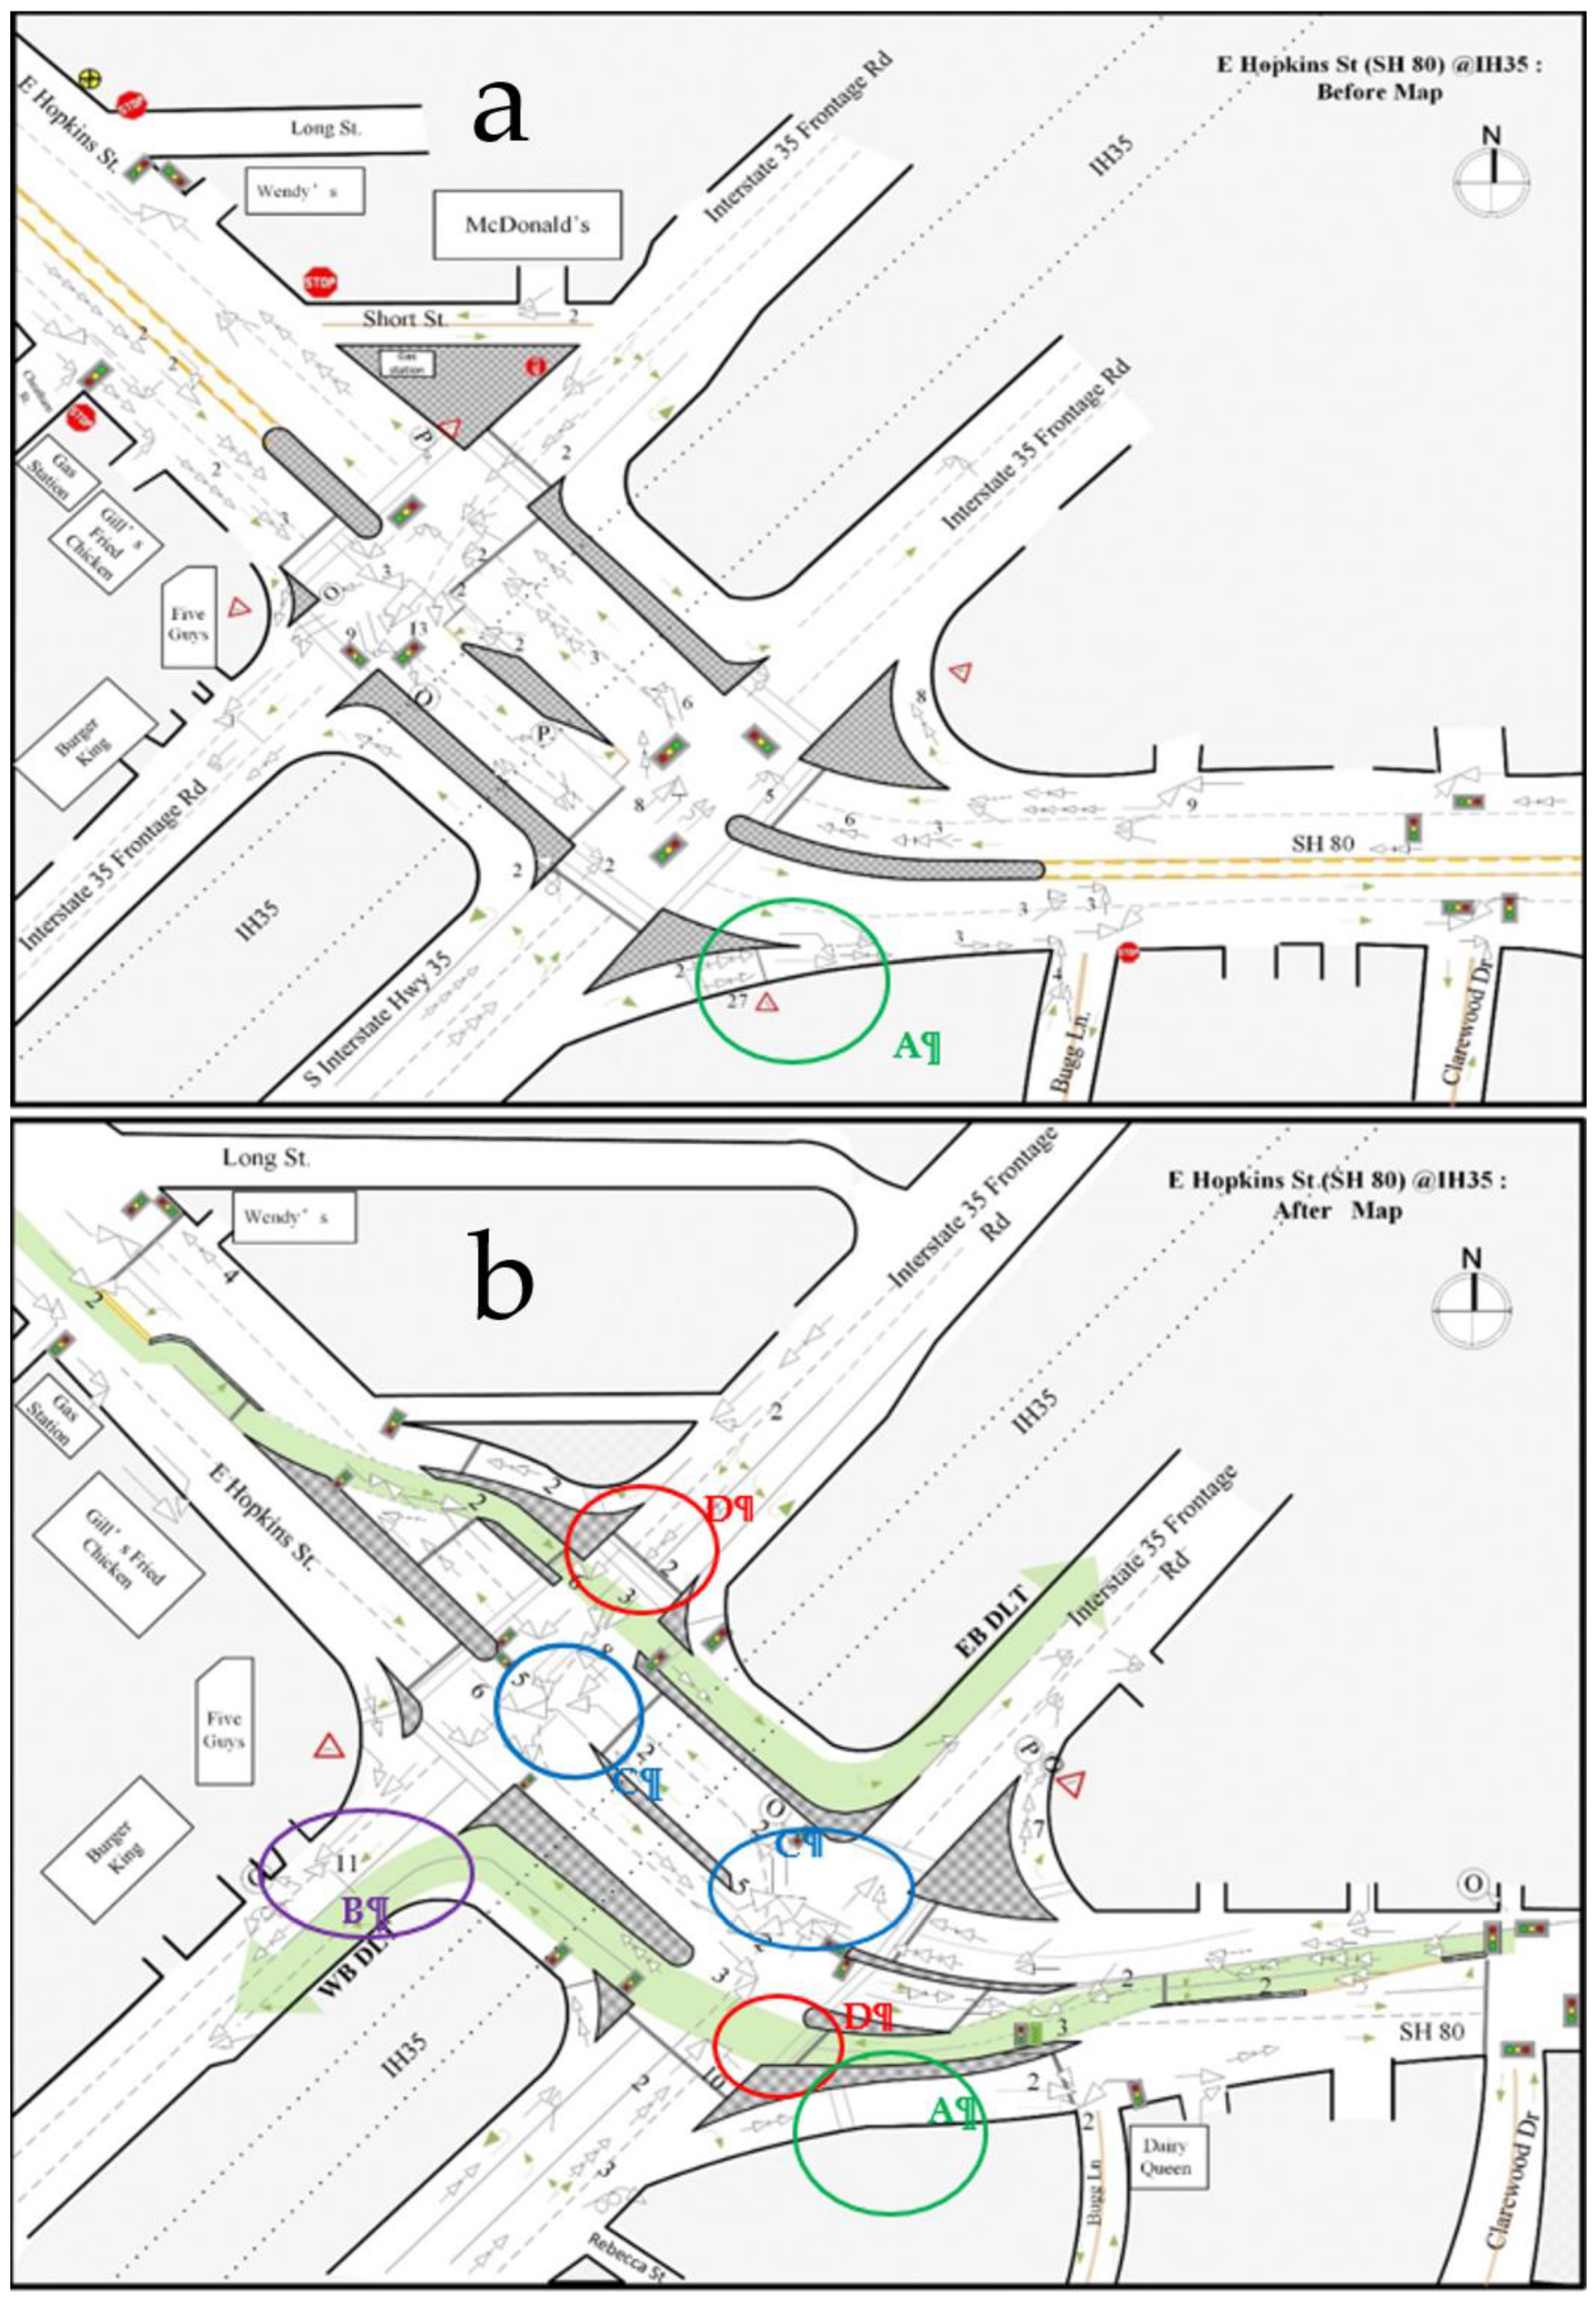
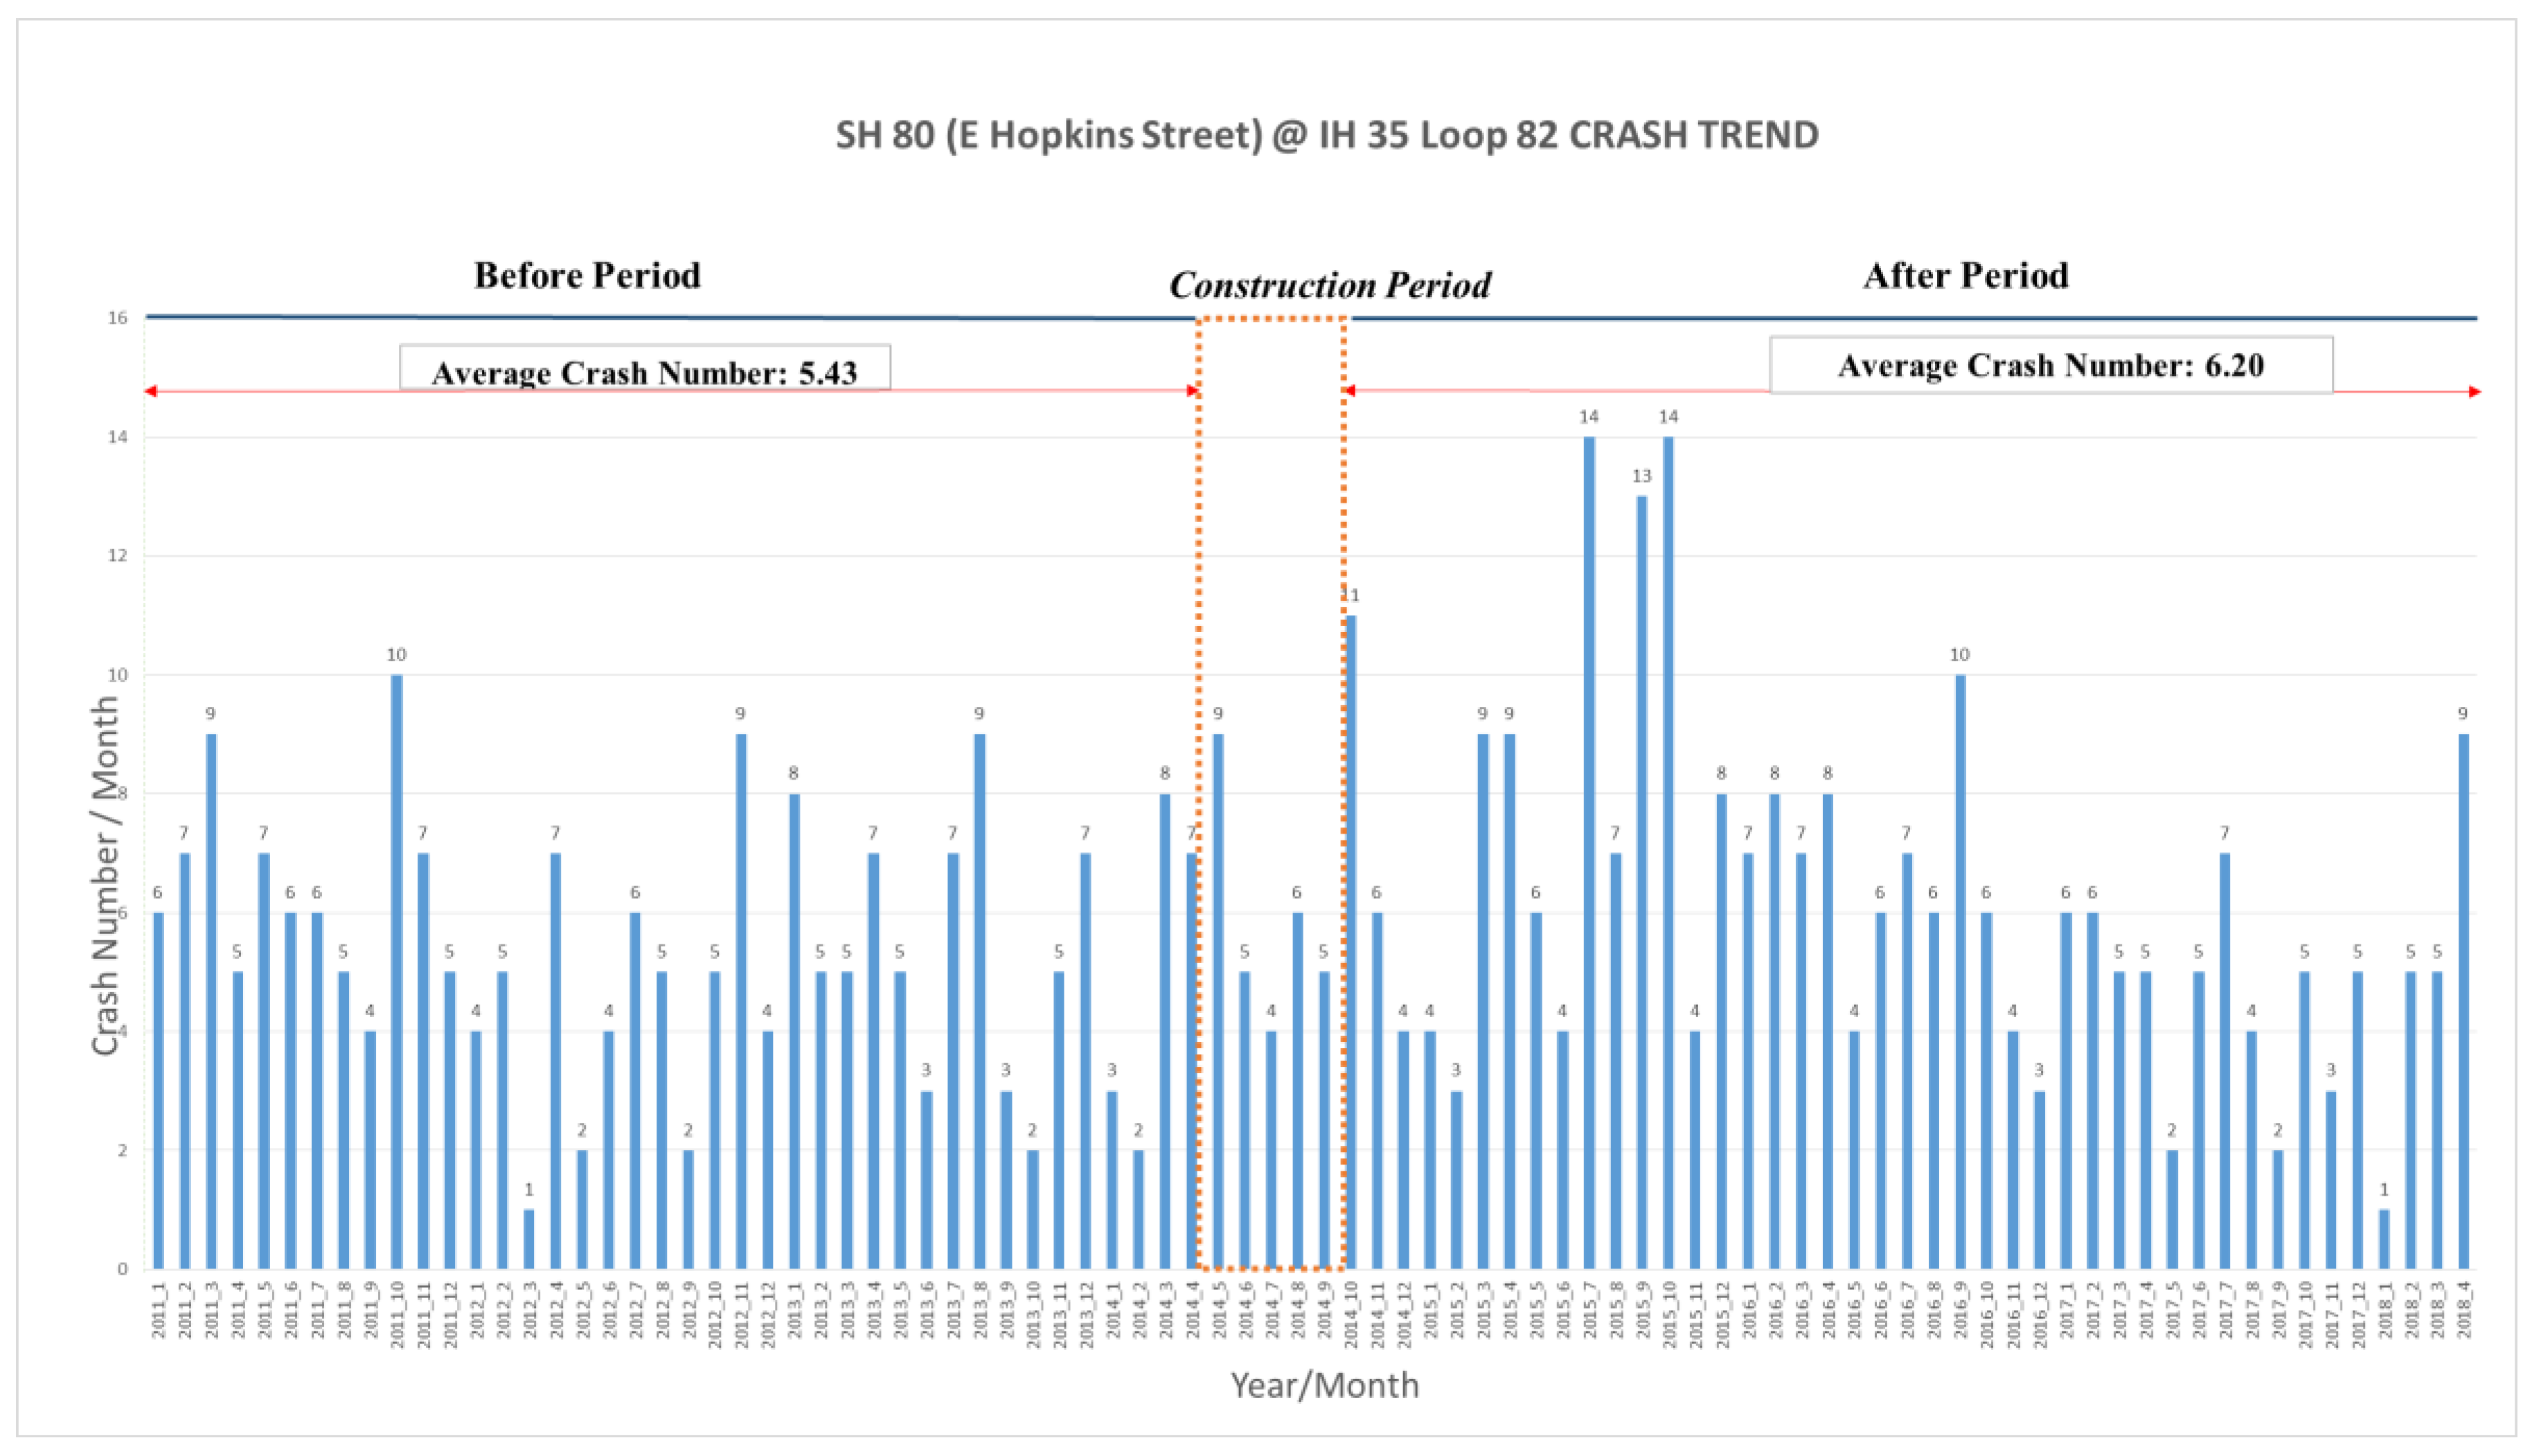
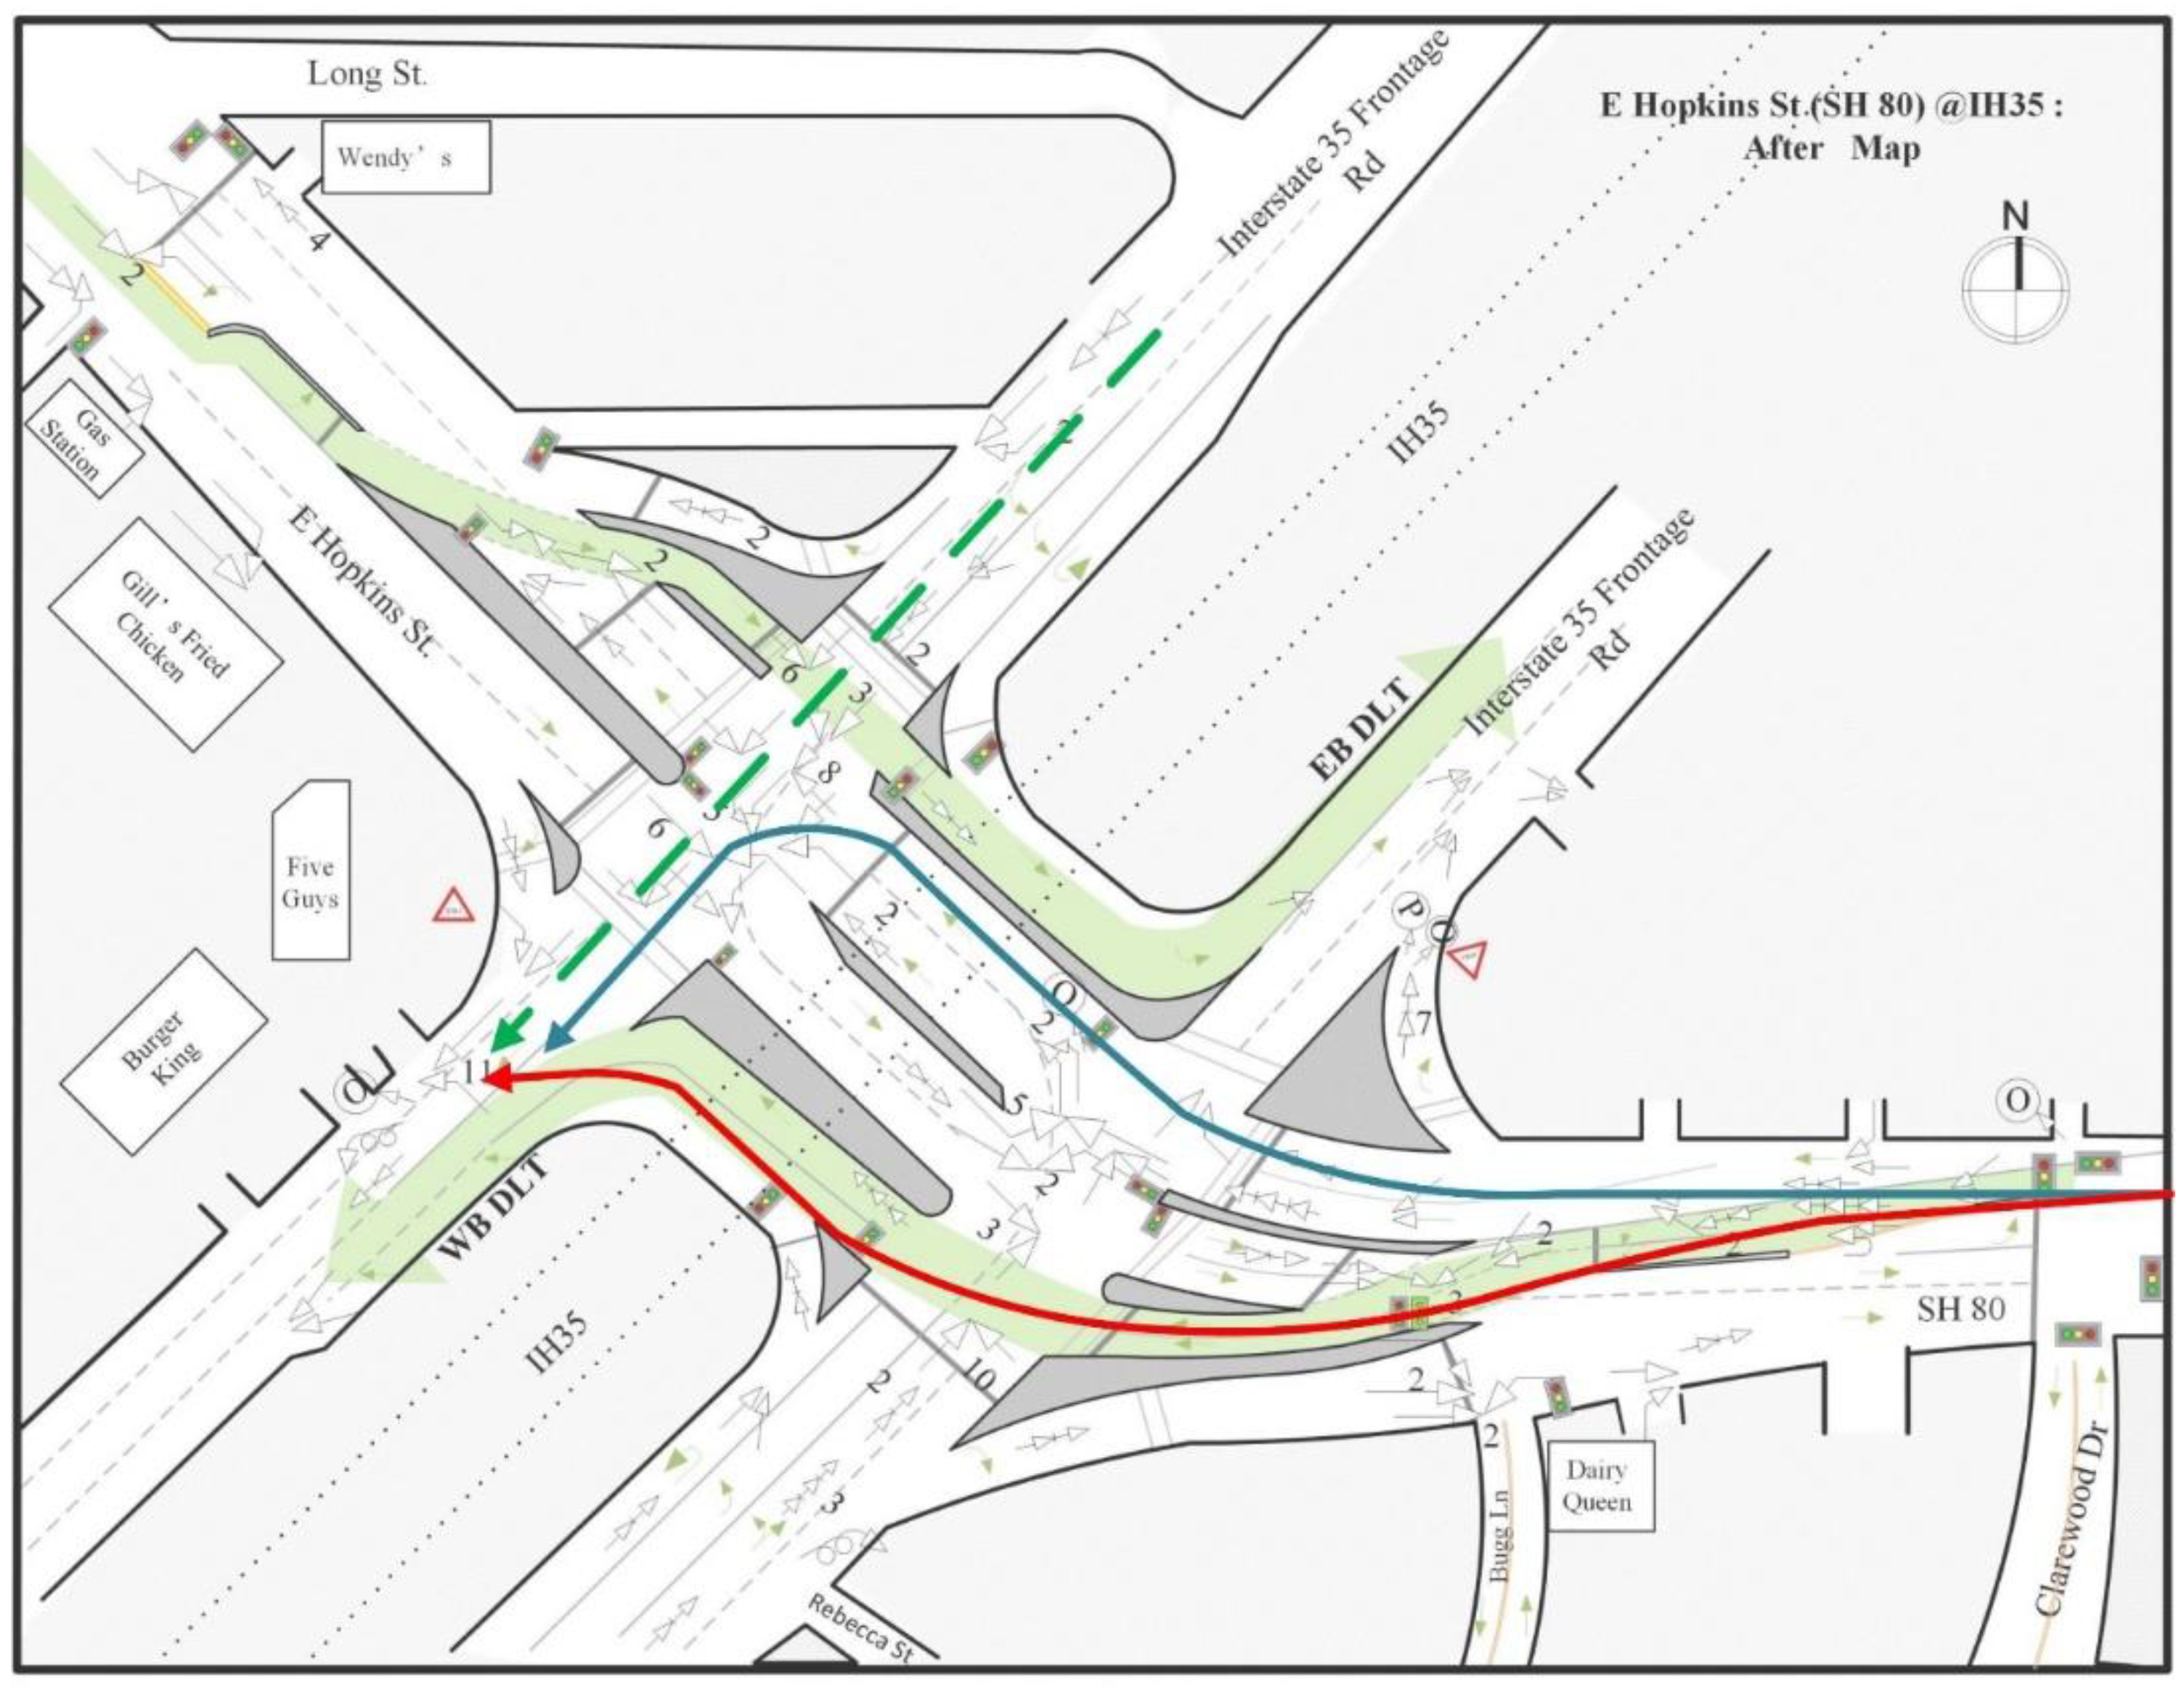
4.2. Intersection 2, SH 80 (Hopkins Street) at IH 35
4.2.1. Statistical Analysis
Direct Comparison between the before and after Crash Frequencies
EB Method-Based before-and-after Comparison
4.2.2. Collision Diagram-Based Analysis
Safety Problems before the Implementation of DLT
Safety Problems after the Implementation of DLT
5. Conclusions and Recommendations
- (1)
- The implementation of DLT did not increase the overall crash frequencies at the studied intersections. It brought safety benefits at some locations for certain movements; meanwhile, it also caused safety problems at other locations for some other movements.
- (2)
- In general, DLT has good performance in reducing left-turn-related collisions at the main intersections.
- (3)
- DLT will also help right-turn vehicles merge safely and efficiently onto the intersection legs with DLT lanes, thereby reducing the rear-end crashes at the right-turn merge points.
- (4)
- Many illegal left-turn crashes occurred at late night and during the first year after the implementation of DLT. Therefore, improving the lighting conditions of intersections and installing more visible traffic signs (such as signs with flash beacons) are strongly recommended. In addition, more law enforcement and driver education are needed, especially during the first year after the implementation of DLT.
- (5)
- Left-turn vehicles are moved to the far-left side lane and, after making left turns from the DLT lanes, more lane changes are needed for them to access destinations on the right side of the roadway because of the design of DLT. The factors undoubtedly will increase the likelihood of collisions between the DLT vehicles and the through vehicles. Therefore, for DLT intersections where attractions are located (such as shopping plazas, gas stations, and hospitals), more access management is needed. For example, it is recommended that the entrance to the attractions be moved away from the area where the DLT exits are closely located to provide longer distances for DLT vehicles to make lane changes to access the attractions.
- (6)
- At DLT intersections, it is important to coordinate the signal timing between the left-turn crossover intersections and the main intersection to reduce the likelihood that DLT vehicles will have to stop at the main intersection. In addition, advanced signal warning systems could be used to assist drivers in obeying the traffic signals.
Author Contributions
Funding
Conflicts of Interest
References
- Goldblatt, R.; Mier, F.; Friedman, J. Continuous Flow Intersections. ITE J. 1994, 64, 35–42. [Google Scholar]
- Berkowitz, C.; Bragdon, C.; Mier, F. Continuous flow intersection: A public private partnership. In Proceedings of the Vehicle Navigation and Information Systems Conference, Orlando, FL, USA, 14–18 October 1996. [Google Scholar]
- Reid, J.D.; Hummer, J.E. Travel Time Comparisons between Seven Unconventional Arterial Intersection Designs. Transp. Res. Rec. J. Transp. Res. Board 2001, 1751, 56–66. [Google Scholar] [CrossRef]
- Bared, J. Displaced Left-Turn Intersection; FHWA-HRT-09-055; US Department of Transportation: Washington, DC, USA, October 2009.
- Fontaine, M.D. Operational Comparison of a Continuous Flow Intersection to Conventional Alternatives. In Proceedings of the ITE 2009 Annual Meeting and Exhibit, San Antonio, TX, USA, 9–12 August 2009. [Google Scholar]
- Hughes, W.; Jagannathan, R.; Sengupta, D.; Hummer, J. Alternative Intersections/Interchanges: Informational Report (AIIR); Report No: FHWA-HRT-09-060; Federal Highway Administration: Washington, DC, USA, 2010.
- Pitaksringkarn, J.P. Measures of Effectiveness for Continuous Flow Intersection: A Maryland Intersection Case Study. In Proceedings of the ITE 2005 Annual Meeting and Exhibit Compendium of Technical Papers, Melbourne, Australia, 7–10 August 2005. [Google Scholar]
- Cheong, S.; Rahwanji., S.; Chang, G.L. Comparison of Three Unconventional Arterial Intersection Designs: Continuous flow Intersection, Parallel Flow Intersection, and Upstream Signalized Crossover. In Proceedings of the 11th International IEEE Conference on Intelligent Transportation System, Beijing, China, 28 September 2015. [Google Scholar]
- Kim, M.; Chang, G.L.; Rahwanji, S. Unconventional arterial intersection design initiatives. In Proceedings of the 2007 IEEE Conference on Intelligent Transportation Systems, Seattle, WA, USA, 28 September 2015. [Google Scholar]
- El Esawey, M.; Sayed, T. Comparison of two unconventional intersection schemes: Crossover displaced Left-Turn and upstream signalized crossover intersections. Transp. Res. Rec. J. Transp. Res. Board 2007, 2023, 10–19. [Google Scholar] [CrossRef]
- Jagannathan, R.; Bared, J.G. Design and operational performance of crossover displaced Left-Turn intersections. Transp. Res. Rec. J. Transp. Res. Board 2004, 1881, 1–10. [Google Scholar] [CrossRef]
- Dhatrak, A. Performance Analysis of Parallel Flow Intersection and Displaced Left-Turn Intersection Designs. Master’s Thesis, University of Missouri, St. Louis, MO, USA, 2010. [Google Scholar]
- Olarte, C. Operational and Environmental Comparisons between Left-Turn Bypass, Diverging Flow and Displaced Left-Turn Intersection Designs. Master’s Thesis, Florida Atlantic University, Boca Raton, FL, USA, 2011. [Google Scholar]
- Steyn, H.; Bugg, Z.; Ray, B.; Daleiden, A.; Jenior, P.; Knudsen, J. Displaced Left Turn Informational Guide; Federal Highway Administration: Washington, DC, USA, 2014; pp. 1–140.
- Continuous Flow Intersection (CFI) Report. State of Louisiana Department of Transportation and Development (La DOTD), 2007. Available online: http://wwwsp.dotd.la.gov/Inside_LaDOTD/Divisions/Engineering/Traffic_Engineering/Publications%20%20Reports/CFI%20Report%20(10-07-2007).pdf (accessed on 3 September 2020).
- Park, S.; Rakha, H. Continuous flow intersections: A safety and environmental perspective. In Proceedings of the 13th International IEEE Conference on Intelligent Transportation Systems (ITSC 2010), Madeira Island, Portugal, 19–22 September 2015. [Google Scholar]
- Zlatkovic, M. Development of Performance Matrices for Evaluating Innovative Intersections and Interchanges; University of Utah: Salt Lake, UT, USA, 2015; pp. 1–75. [Google Scholar]
- Abdelrahman, A.; Abdel-Aty, M.; Lee, J.; Yue, L.; Ali Al-Omari, M. Evaluation of displaced left-turn intersections. Transp. Eng. 2020, 1, 100006. [Google Scholar] [CrossRef]
- Kolody, K.; Perez-Bravo, D.; Zhao, J.; Neuman, T.R. Highway Safety Manual, 1st ed.; American Association of State Highway and Transportation Officials: Washington, DC, USA, 2014; pp. 1–54. [Google Scholar]
- Wang, H.; Qin, X.; Noyce, D. Development of a Safety Performance Function for Signalized Diamond Interchange Ramp Terminals; Tenth International Conference of Chinese Transportation Professionals (ICCTP): Madison, WI, USA, 2010; pp. 1034–1046. [Google Scholar]


| Type | Symbol | Definition |
|---|---|---|
| Angle |  | One through vehicle collides with another through vehicle in the crossing direction, or two vehicles collide while traveling in the same direction during lane change. |
| Dual left-turn angle |  | An accident involving two vehicles traveling in the same direction making a left turn while either driver fails to maintain her or his own lane and collides with the other vehicle. |
| Left-turn angle |  | An accident involving two opposing vehicles when one of them is turning left. |
| Rear-end |  | The front of one vehicle collides with the rear of another vehicle while both vehicles are traveling in the same direction. |
| Right-turn angle |  | One right-turning vehicle collides with another vehicle on the cross street. |
| Head-on |  | One vehicle hits another opposing vehicle’s front end. |
| U-turn |  | Crash occurs when one vehicle is performing a 180-degree turn to reverse the direction of travel and hits other vehicles. |
| Out of control |  | The vehicle starts to spin or twirl because of mechanical problems or driver-related effects, e.g., intoxication. |
| Sideswipe |  | One vehicle impacts another vehicle traveling in the same direction by “swiping” along the surface in the direction of travel. |
| Object |  | One vehicle hits a roadside object, e.g., the curb. |
| Pedestrian |  | An accident in which a vehicle and a pedestrian collide. |
| * | b ** | *** | **** | |||||
|---|---|---|---|---|---|---|---|---|
| 3.39 | 12,807 | 29,761 | 17,787 | 11,214 | 580,612,545 | 0.9386 | 3.53 | 3.52 |
| 15,759 | 25,962 | 20,077 | 9783 | 605,548,449 |
| * | b ** | *** | **** | |||||
|---|---|---|---|---|---|---|---|---|
| 5.43 | 17,787 | 21,330 | 39,430 | 29,714 | 1,551,019,730 | 0.9386 | 7.11 | 6.20 |
| 20,095 | 23,784 | 43,499 | 36,539 | 2,067,349,441 |
© 2020 by the authors. Licensee MDPI, Basel, Switzerland. This article is an open access article distributed under the terms and conditions of the Creative Commons Attribution (CC BY) license (http://creativecommons.org/licenses/by/4.0/).
Share and Cite
Qu, W.; Sun, Q.; Zhao, Q.; Tao, T.; Qi, Y. Statistical Analysis of Safety Performance of Displaced Left-Turn Intersections: Case Studies in San Marcos, Texas. Int. J. Environ. Res. Public Health 2020, 17, 6446. https://0-doi-org.brum.beds.ac.uk/10.3390/ijerph17186446
Qu W, Sun Q, Zhao Q, Tao T, Qi Y. Statistical Analysis of Safety Performance of Displaced Left-Turn Intersections: Case Studies in San Marcos, Texas. International Journal of Environmental Research and Public Health. 2020; 17(18):6446. https://0-doi-org.brum.beds.ac.uk/10.3390/ijerph17186446
Chicago/Turabian StyleQu, Wenrui, Qiao Sun, Qun Zhao, Tao Tao, and Yi Qi. 2020. "Statistical Analysis of Safety Performance of Displaced Left-Turn Intersections: Case Studies in San Marcos, Texas" International Journal of Environmental Research and Public Health 17, no. 18: 6446. https://0-doi-org.brum.beds.ac.uk/10.3390/ijerph17186446