Blood Lead Concentrations and Mortality in Korean Adults: the Korea National Health and Nutrition Examination Survey with Mortality Follow-Up

 ,
,  , and
, and
Abstract
:
1. Introduction
2. Materials and Methods
2.1. Data
2.2. Statistical Analysis
3. Results
4. Discussion
5. Conclusions
Author Contributions
Funding
Acknowledgments
Conflicts of Interest
References
- Wani, A.L.; Ara, A.; Usmani, J.A. Lead toxicity: A review. Interdiscip Toxicol 2015, 8, 55–64. [Google Scholar] [CrossRef] [PubMed] [Green Version]
- Aoki, Y.; Brody, D.J.; Flegal, K.M.; Fakhouri, T.H.; Axelrad, D.A.; Parker, J.D. Blood Lead and Other Metal Biomarkers as Risk Factors for Cardiovascular Disease Mortality. Med. (Baltim.) 2016, 95, e2223. [Google Scholar] [CrossRef]
- Cheung, M.R. Blood lead concentration correlates with all cause, all cancer and lung cancer mortality in adults: A population based study. Asian Pac. J. Cancer Prev. 2013, 14, 3105–3108. [Google Scholar] [CrossRef] [Green Version]
- Jemal, A.; Graubard, B.I.; Devesa, S.S.; Flegal, K.M. The association of blood lead level and cancer mortality among whites in the United States. Environ. Health Perspect. 2002, 110, 325–329. [Google Scholar] [CrossRef] [PubMed] [Green Version]
- Lanphear, B.P.; Rauch, S.; Auinger, P.; Allen, R.W.; Hornung, R.W. Low-level lead exposure and mortality in US adults: A population-based cohort study. Lancet Public Health 2018, 3, e177–e184. [Google Scholar] [CrossRef]
- Lustberg, M.; Silbergeld, E. Blood lead levels and mortality. Arch. Intern. Med. 2002, 162, 2443–2449. [Google Scholar] [CrossRef] [PubMed] [Green Version]
- Menke, A.; Muntner, P.; Batuman, V.; Silbergeld, E.K.; Guallar, E. Blood lead below 0.48 micromol/L (10 microg/dL) and mortality among US adults. Circulation 2006, 114, 1388–1394. [Google Scholar] [CrossRef] [PubMed] [Green Version]
- Schober, S.E.; Mirel, L.B.; Graubard, B.I.; Brody, D.J.; Flegal, K.M. Blood lead levels and death from all causes, cardiovascular disease, and cancer: Results from the NHANES III mortality study. Environ. Health Perspect. 2006, 114, 1538–1541. [Google Scholar] [CrossRef]
- CDC. CDC Response to Advisory Committee on Childhood Lead Poisoning Prevention Recommendations in “Low Level Lead Exposure Harms Children: A Renewed Call of Primary Prevention”; Centers for Disease Control and Prevention: Atlanta, GA, USA, 2012. Available online: https://www.cdc.gov/nceh/lead/acclpp/cdc_response_lead_exposure_recs.pdf (accessed on 10 January 2020).
- CDC. Adult Blood Lead Epidemiology and Surveillance (ABLES) Program. Available online: https://www.cdc.gov/niosh/topics/ables/description.html (accessed on 10 January 2020).
- CDC. National Notifiable Diseases Surveillance System: Lead, elevated blood levels. 2016 case definition. Available online: https://wwwn.cdc.gov/nndss/conditions/lead-elevated-blood-levels/case-definition/2016/ (accessed on 10 January 2020).
- Oh, S.E.; Kim, G.B.; Hwang, S.H.; Ha, M.; Lee, K.M. Longitudinal trends of blood lead levels before and after leaded gasoline regulation in Korea. Environ. Health Toxicol. 2017, 32, e2017019. [Google Scholar] [CrossRef] [Green Version]
- CDC. Fourth National Report on Human Exposure to Environmental Chemicals. Department of Health and Human Services. Updated Tables; U.S. Department of Health and Human Services, Centers for Disease Control and Prevention: Atlanta, GA, USA, 2018. Available online: https://www.cdc.gov/exposurereport/pdf/FourthReport_UpdatedTables_Volume1_Mar2018.pdf (accessed on 10 January 2020).
- Lee, B.K.; Ahn, J.; Kim, N.S.; Lee, C.B.; Park, J.; Kim, Y. Association of Blood Pressure with Exposure to Lead and Cadmium: Analysis of Data from the 2008–2013 Korean National Health and Nutrition Examination Survey. Biol Trace Elem. Res. 2016, 174, 40–51. [Google Scholar] [CrossRef]
- Lee, K.R.; Ko, K.D.; Hwang, I.C.; Suh, H.S.; Kim, K.K. Association between blood lead levels and blood pressures in a non-smoking healthy Korean population. Postgrad Med. J. 2017, 93, 513–518. [Google Scholar] [CrossRef] [PubMed]
- Moon, S.S. Association of lead, mercury and cadmium with diabetes in the Korean population: The Korea National Health and Nutrition Examination Survey (KNHANES) 2009-2010. Diabet Med. 2013, 30, e143–e148. [Google Scholar] [CrossRef] [PubMed]
- Moon, S.S. Additive effect of heavy metals on metabolic syndrome in the Korean population: The Korea National Health and Nutrition Examination Survey (KNHANES) 2009-2010. Endocrine 2014, 46, 263–271. [Google Scholar] [CrossRef] [PubMed]
- Rhee, S.Y.; Hwang, Y.C.; Woo, J.T.; Sinn, D.H.; Chin, S.O.; Chon, S.; Kim, Y.S. Blood lead is significantly associated with metabolic syndrome in Korean adults: An analysis based on the Korea National Health and Nutrition Examination Survey (KNHANES), 2008. Cardiovasc. Diabetol. 2013, 12, 9. [Google Scholar] [CrossRef] [PubMed] [Green Version]
- Shin, J.; Kim, J.; Kim, Y. The association of heavy metals in blood, fish consumption frequency, and risk of cardiovascular diseases among Korean adults: The Korean National Health and Nutrition Examination Survey (2008-2010). Korean J. Nutr. 2012, 45, 347–361. [Google Scholar] [CrossRef] [Green Version]
- Kim, M.G.; Ryoo, J.H.; Chang, S.J.; Kim, C.B.; Park, J.K.; Koh, S.B.; Ahn, Y.S. Blood Lead Levels and Cause-Specific Mortality of Inorganic Lead-Exposed Workers in South Korea. PLoS ONE 2015, 10, e0140360. [Google Scholar] [CrossRef]
- Lee, H.S.; Cho, Y.H.; Park, S.O.; Kye, S.H.; Kim, B.H.; Hahm, T.S.; Kim, M.H.; Lee, J.O.; Kim, C.I. Dietary exposure of the Korean population to arsenic, cadmium, lead and mercury. J. Food Compos. Anal. 2006, 19, S31–S37. [Google Scholar] [CrossRef]
- Kweon, S.; Kim, Y.; Jang, M.J.; Kim, Y.; Kim, K.; Choi, S.; Chun, C.; Khang, Y.H.; Oh, K. Data resource profile: The Korea National Health and Nutrition Examination Survey (KNHANES). Int. J. Epidemiol. 2014, 43, 69–77. [Google Scholar] [CrossRef] [Green Version]
- Khalil, N.; Wilson, J.W.; Talbott, E.O.; Morrow, L.A.; Hochberg, M.C.; Hillier, T.A.; Muldoon, S.B.; Cummings, S.R.; Cauley, J.A. Association of blood lead concentrations with mortality in older women: A prospective cohort study. Environ. Health 2009, 8, 15. [Google Scholar] [CrossRef] [Green Version]
- Shi, Z.; Zhen, S.; Orsini, N.; Zhou, Y.; Zhou, Y.; Liu, J.; Taylor, A.W. Association between dietary lead intake and 10-year mortality among Chinese adults. Environ. Sci. Pollut. Res. Int. 2017, 24, 12273–12280. [Google Scholar] [CrossRef]
- Agency for Toxic Substances and Disease Registry (ATSDR). Toxicological Profile for Lead. U.S. Department of Health and Human Service; Public Health Service: Atlanta, GA, USA, 2020.
- Hertz-Picciotto, I.; Croft, J. Review of the relation between blood lead and blood pressure. Epidemiol Rev. 1993, 15, 352–373. [Google Scholar] [CrossRef] [PubMed]
- Pocock, S.J.; Shaper, A.G.; Ashby, D.; Delves, T.; Whitehead, T.P. Blood lead concentration, blood pressure, and renal function. Br. Med. J. (Clin. Res. Ed.) 1984, 289, 872–874. [Google Scholar] [CrossRef] [PubMed] [Green Version]
- Schwartz, J. The relationship between blood lead and blood pressure in the NHANES II survey. Environ. Health Perspect 1988, 78, 15–22. [Google Scholar] [CrossRef] [PubMed]
- Flora, G.; Gupta, D.; Tiwari, A. Toxicity of lead: A review with recent updates. Interdiscip. Toxicol. 2012, 5, 47–58. [Google Scholar] [CrossRef] [PubMed]
- Gonick, H.C.; Ding, Y.; Bondy, S.C.; Ni, Z.; Vaziri, N.D. Lead-induced hypertension: Interplay of nitric oxide and reactive oxygen species. Hypertension 1997, 30, 1487–1492. [Google Scholar] [CrossRef] [Green Version]
- Lustberg, M.E.; Schwartz, B.S.; Lee, B.K.; Todd, A.C.; Silbergeld, E.K. The G(894)-T(894) polymorphism in the gene for endothelial nitric oxide synthase and blood pressure in lead-exposed workers from Korea. J. Occup Environ. Med. 2004, 46, 584–590. [Google Scholar] [CrossRef] [Green Version]
- Ni, Z.; Hou, S.; Barton, C.H.; Vaziri, N.D. Lead exposure raises superoxide and hydrogen peroxide in human endothelial and vascular smooth muscle cells. Kidney Int. 2004, 66, 2329–2336. [Google Scholar] [CrossRef] [Green Version]
- Dursun, N.; Arifoglu, C.; Suer, C.; Keskinol, L. Blood pressure relationship to nitric oxide, lipid peroxidation, renal function, and renal blood flow in rats exposed to low lead levels. Biol. Trace Elem. Res. 2005, 104, 141–149. [Google Scholar] [CrossRef]
- Vaziri, N.D. Pathogenesis of lead-induced hypertension: Role of oxidative stress. J. Hypertens. Suppl. 2002, 20, S15–S20. [Google Scholar]
- Harari, F.; Sallsten, G.; Christensson, A.; Petkovic, M.; Hedblad, B.; Forsgard, N.; Melander, O.; Nilsson, P.M.; Borne, Y.; Engstrom, G.; et al. Blood Lead Levels and Decreased Kidney Function in a Population-Based Cohort. Am. J. Kidney Dis. 2018, 72, 381–389. [Google Scholar] [CrossRef] [Green Version]
- Lentini, P.; Zanoli, L.; de Cal, M.; Granata, A.; Dell’Aquila, R. Lead and Heavy Metals and the Kidney. In Critical Care Nephrol, 3rd ed.; Elsevier: Philadelphia, PA, USA, 2019; pp. 1324–1330. [Google Scholar] [CrossRef]
- Vaziri, N.D. Mechanisms of lead-induced hypertension and cardiovascular disease. Am. J. Physiol Heart Circ. Physiol 2008, 295, H454–H465. [Google Scholar] [CrossRef] [Green Version]
- Dobrakowski, M.; Pawlas, N.; Kasperczyk, A.; Kozlowska, A.; Olewinska, E.; Machon-Grecka, A.; Kasperczyk, S. Oxidative DNA damage and oxidative stress in lead-exposed workers. Hum. Exp. Toxicol 2017, 36, 744–754. [Google Scholar] [CrossRef] [PubMed]
- Zawia, N.H.; Crumpton, T.; Brydie, M.; Reddy, G.R.; Razmiafshari, M. Disruption of the zinc finger domain: A common target that underlies many of the effects of lead. Neurotoxicology 2000, 21, 1069–1080. [Google Scholar] [PubMed]
- Garcia-Leston, J.; Mendez, J.; Pasaro, E.; Laffon, B. Genotoxic effects of lead: An updated review. Environ. Int. 2010, 36, 623–636. [Google Scholar] [CrossRef] [PubMed]
- Hartwig, A. Role of DNA repair inhibition in lead- and cadmium-induced genotoxicity: A review. Environ. Health Perspect 1994, 102 (Suppl. 3), 45–50. [Google Scholar] [CrossRef]
- Rajah, T.; Ahuja, Y.R. In vivo genotoxic effects of smoking and occupational lead exposure in printing press workers. Toxicol. Lett. 1995, 76, 71–75. [Google Scholar] [CrossRef]
- Rabinowitz, M.B.; Wetherill, G.W.; Kopple, J.D. Kinetic analysis of lead metabolism in healthy humans. J. Clin. Investig. 1976, 58, 260–270. [Google Scholar] [CrossRef] [Green Version]
- Glenn, B.S.; Stewart, W.F.; Links, J.M.; Todd, A.C.; Schwartz, B.S. The longitudinal association of lead with blood pressure. Epidemiology 2003, 14, 30–36. [Google Scholar] [CrossRef]
- Lee, B.K.; Lee, G.S.; Stewart, W.F.; Ahn, K.D.; Simon, D.; Kelsey, K.T.; Todd, A.C.; Schwartz, B.S. Associations of blood pressure and hypertension with lead dose measures and polymorphisms in the vitamin D receptor and delta-aminolevulinic acid dehydratase genes. Environ. Health Perspect 2001, 109, 383–389. [Google Scholar] [CrossRef]
- Cheng, Y.; Schwartz, J.; Sparrow, D.; Aro, A.; Weiss, S.T.; Hu, H. Bone lead and blood lead levels in relation to baseline blood pressure and the prospective development of hypertension: The Normative Aging Study. Am. J. Epidemiol. 2001, 153, 164–171. [Google Scholar] [CrossRef] [Green Version]
- Elmarsafawy, S.F.; Jain, N.B.; Schwartz, J.; Sparrow, D.; Nie, H.; Hu, H. Dietary calcium as a potential modifier of the relationship of lead burden to blood pressure. Epidemiology 2006, 17, 531–537. [Google Scholar] [CrossRef] [PubMed]


| Characteristics | Total | Blood Lead Level (μg/dL, Tertiles) | ||
|---|---|---|---|---|
| <1.91 | 1.91–2.71 | >2.71 | ||
| Non-accidental death | ||||
| No | 7103 (97.2) | 2357 (98.5) | 2397 (97.4) | 2349 (95.7) |
| Yes | 205 (2.8) | 37 (1.6) | 63 (2.6) | 105 (4.3) |
| Cancer death | ||||
| No | 7221 (98.8) | 2381 (99.5) | 2427 (98.7) | 2413 (98.3) |
| Yes | 87 (1.2) | 13 (0.5) | 33 (1.3) | 41 (1.7) |
| Sex | ||||
| Male | 3380 (46.3) | 537 (22.4) | 1146 (46.6) | 1697 (69.2) |
| Female | 3928 (53.8) | 1857 (77.6) | 1314 (53.4) | 757 (30.9) |
| Age (years) | ||||
| 30–44 | 2890 (39.6) | 1293 (54.0) | 952 (38.7) | 645 (26.3) |
| 45–64 | 3408 (46.6) | 815 (34.0) | 1187 (48.3) | 1406 (57.3) |
| ≥65 | 1010 (13.8) | 286 (12.0) | 321 (13.1) | 403 (16.4) |
| Household income | ||||
| Low | 1189 (16.3) | 309 (12.9) | 397 (16.1) | 483 (19.7) |
| Lower-middle | 1931 (26.4) | 616 (25.7) | 636 (25.9) | 679 (27.7) |
| Upper-middle | 2079 (28.5) | 748 (31.2) | 677 (27.5) | 654 (26.7) |
| High | 2109 (28.9) | 721 (30.1) | 750 (30.5) | 638 (26.0) |
| Education | ||||
| ≤Elementary | 1619 (22.2) | 426 (17.8) | 520 (21.1) | 673 (27.4) |
| Middle school | 926 (12.7) | 200 (8.4) | 312 (12.7) | 414 (16.9) |
| High school | 2522 (34.5) | 833 (34.8) | 867 (35.2) | 822 (33.5) |
| ≥College | 2241 (30.7) | 935 (39.1) | 761 (30.9) | 545 (22.2) |
| Occupation | ||||
| Non-manual | 1542 (21.1) | 558 (23.3) | 552 (22.4) | 432 (17.6) |
| Manual | 3240 (44.3) | 811 (33.9) | 1081 (43.9) | 1348 (54.9) |
| Unemployed | 2526 (34.6) | 1025 (42.8) | 827 (33.6) | 674 (27.5) |
| Smoking status | ||||
| Never | 4328 (59.2) | 1899 (79.3) | 1468 (59.7) | 961 (39.2) |
| Former | 1350 (18.5) | 242 (10.1) | 457 (18.6) | 651 (26.5) |
| Current | 1630 (22.3) | 253 (10.6) | 535 (21.8) | 842 (34.3) |
| Drinking frequency | ||||
| None | 1872 (25.6) | 770 (32.2) | 634 (25.8) | 468 (19.1) |
| ≤Once in a month | 2136 (29.2) | 929 (38.8) | 720 (29.3) | 487 (19.9) |
| >Once in a month | 3300 (45.2) | 695 (29.0) | 1106 (45.0) | 1499 (61.1) |
| Body mass index (kg/m2) | ||||
| ≤18.5 | 216 (3.0) | 101 (4.2) | 63 (2.6) | 52 (2.1) |
| 18.6–22.9 | 2835 (38.8) | 1067 (44.6) | 912 (37.1) | 856 (34.9) |
| 23–24.9 | 1840 (25.2) | 526 (22.0) | 633 (25.7) | 681 (27.8) |
| ≥25 | 2417 (33.1) | 700 (29.2) | 852 (34.6) | 865 (35.3) |
| Physical activity | ||||
| <Once in a week | 3487 (47.7) | 1252 (52.3) | 1128 (45.9) | 1107 (45.1) |
| ≥Once in a week | 3821 (52.3) | 1142 (47.7) | 1332 (54.2) | 1347 (54.9) |
| High-lead-containing food intake 1 | ||||
| 1st quartile | 1825 (25.0) | 729 (30.5) | 616 (25.0) | 480 (19.6) |
| 2nd quartile | 1827 (25.0) | 624 (26.1) | 621 (25.2) | 582 (23.7) |
| 3rd quartile | 1827 (25.0) | 562 (23.5) | 623 (25.3) | 642 (26.2) |
| 4th quartile | 1829 (25.0) | 479 (20.0) | 600 (24.4) | 750 (30.6) |
| Total | 7308 (100.0) | 2394 (32.8) | 2460 (33.7) | 2454 (33.6) |
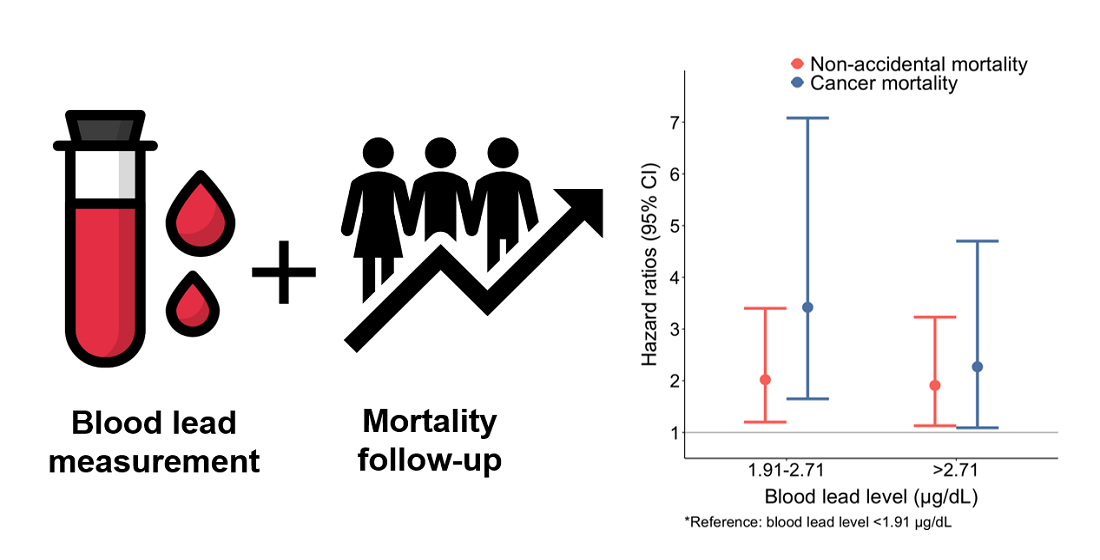
| Cause of Death/Tertile of Blood Lead | Model 1 | Model 2 | Model 3 |
|---|---|---|---|
| Hazard Ratio (HR) (95% CI) | HR (95% CI) | HR (95% CI) | |
| Non-accidental | |||
| 1st tertile | reference | reference | reference |
| 2nd tertile | 2.09 (1.25, 3.49) | 2.01 (1.20, 3.37) | 2.02 (1.20, 3.40) |
| 3rd tertile | 2.09 (1.27, 3.44) | 1.93 (1.14, 3.25) | 1.91 (1.13, 3.23) |
| Cancer | |||
| 1st tertile | reference | reference | reference |
| 2nd tertile | 3.19 (1.47, 6.91) | 3.46 (1.65, 7.26) | 3.42 (1.65, 7.08) |
| 3rd tertile | 2.41 (1.17, 4.96) | 2.26 (1.09, 4.69) | 2.27 (1.09, 4.70) |
© 2020 by the authors. Licensee MDPI, Basel, Switzerland. This article is an open access article distributed under the terms and conditions of the Creative Commons Attribution (CC BY) license (http://creativecommons.org/licenses/by/4.0/).
Share and Cite
Byun, G.; Kim, S.; Kim, S.-Y.; Park, D.; Shin, M.-J.; Oh, H.; Lee, J.-T. Blood Lead Concentrations and Mortality in Korean Adults: the Korea National Health and Nutrition Examination Survey with Mortality Follow-Up. Int. J. Environ. Res. Public Health 2020, 17, 6898. https://0-doi-org.brum.beds.ac.uk/10.3390/ijerph17186898
Byun G, Kim S, Kim S-Y, Park D, Shin M-J, Oh H, Lee J-T. Blood Lead Concentrations and Mortality in Korean Adults: the Korea National Health and Nutrition Examination Survey with Mortality Follow-Up. International Journal of Environmental Research and Public Health. 2020; 17(18):6898. https://0-doi-org.brum.beds.ac.uk/10.3390/ijerph17186898
Chicago/Turabian StyleByun, Garam, Sera Kim, Soo-Yeon Kim, Dahyun Park, Min-Jeong Shin, Hannah Oh, and Jong-Tae Lee. 2020. "Blood Lead Concentrations and Mortality in Korean Adults: the Korea National Health and Nutrition Examination Survey with Mortality Follow-Up" International Journal of Environmental Research and Public Health 17, no. 18: 6898. https://0-doi-org.brum.beds.ac.uk/10.3390/ijerph17186898