Article

Thermal Sensation in Older People with and without Dementia Living in Residential Care: New Assessment Approaches to Thermal Comfort Using Infrared Thermography

1
College of Health, Wellbeing and Life Sciences, Sheffield Hallam University, Sheffield S10 2BP, UK
2
School of Health and Related Research (SCHARR), University of Sheffield, Sheffield S10 2TN, UK
3
Electronic and Electrical Engineering Department, University of Sheffield, Sheffield S10 2TN, UK
4
Sheffield Teaching Hospitals, National Institute for Health Research (NIHR), Biomedical Research Centre, Sheffield S10 2JF, UK
*
Author to whom correspondence should be addressed.
Int. J. Environ. Res. Public Health 2020, 17(18), 6932; https://0-doi-org.brum.beds.ac.uk/10.3390/ijerph17186932
Submission received: 14 August 2020 / Revised: 16 September 2020 / Accepted: 18 September 2020 / Published: 22 September 2020
(This article belongs to the Special Issue Health Care for Older Adults)

Abstract

:
The temperature of the indoor environment is important for health and wellbeing, especially at the extremes of age. The study aim was to understand the relationship between self-reported thermal sensation and extremity skin temperature in care home residents with and without dementia. The Abbreviated Mental Test (AMT) was used to discriminate residents to two categories, those with, and those without, dementia. After residents settled and further explanation of the study given (approximately 15 min), measurements included: tympanic membrane temperature, thermal sensation rating and infrared thermal mapping of non-dominant hand and forearm. Sixty-nine afebrile adults (60–101 years of age) were studied in groups of two to five, in mean ambient temperatures of 21.4–26.6 °C (median 23.6 °C). Significant differences were observed between groups; thermal sensation rating (p = 0.02), tympanic temperature (p = 0.01), fingertip skin temperature (p = 0.01) and temperature gradients; fingertip-wrist p = 0.001 and fingertip-distal forearm, p = 0.001. Residents with dementia were in significantly lower air temperatures (p = 0.001). Although equal numbers of residents per group rated the environment as ‘neutral’ (comfortable), resident ratings for ‘cool/cold’ were more frequent amongst those with dementia compared with no dementia. In parallel, extremity (hand) thermograms revealed visual temperature demarcation, variously across fingertip, wrist, and forearm commensurate with peripheral vasoconstriction. Infrared thermography provided a quantitative and qualitative method to measure and observe hand skin temperature across multiple regions of interest alongside thermal sensation self-report. As an imaging modality, infrared thermography has potential as an additional assessment technology with clinical utility to identify vulnerable residents who may be unable to communicate verbally, or reliably, their satisfaction with indoor environmental conditions.

1. Introduction

To experience a thermally comfortable indoor environment, an older person living in residential care relies almost entirely upon decisions made by others. This is typically the care home staff who will regulate the temperature of the communal spaces and bedrooms. For those residents with dementia, simple interventions to adjust the physical stimuli of light, noise and temperature can improve a person’s quality of life [1] experience [2] and behaviour [3]. Thermal comfort, therefore, becomes an important aspect of wellbeing and quality of life, which may require a different set of indoor thermal adjustments (including clothing) than required for active younger people.
A fundamental starting point is to understand the definition of thermal comfort; a condition of mind which expresses satisfaction with the immediate environment [4]. As a subjective experience, it may well differ amongst groups of people sharing the same environment at the same time.
The international standard, EN ISO 7730 [5] covering the evaluation of moderate thermal environments (developed in parallel with the revised American Society of Heating, Refrigerating and Air-Conditioning Engineers (ASHRAE, standard 55) specifies methods for measurement and evaluation of thermal environments. Thermal sensation is predominately related to heat balance and is influenced by physical activity, clothing and the indoor environmental factors of air temperature, mean radiant temperature, humidity and air velocity [5]. By seeking to provide a comfortable thermal environment for the majority, building and architectural sciences have led the way in finding solutions to achieve thermal comfort for the built environment. A subjective seven-point thermal sensation scale [4] developed originally from the work of Bedford [6] is completed by each individual. It is a scale widely used in thermal surveys and field trials [7] and forms the basis to calculate the average thermal sensation vote of large groups of individuals exposed to the same environment, along with an index of those dissatisfied i.e., people who vote feeling too hot, warm, cool or cold.
Whilst international standards are available, their use has largely been focused on determining thermal comfort of the workforce in offices and factories. Much less is known about thermal comfort in the old and very old living in residential care [8,9,10]. The need for new perspectives on thermal sensation and thermal comfort in older age is now appreciated [3,11,12,13] particularly given that the changes that occur in the nervous system associated with ageing leads to a decrease (‘blunting’) of thermal sensitivity and thermal perception [14] especially in response to cold stimuli [15] which is most pronounced at the extremities and follows a distal-proximal pattern [16]. Furthermore, due to a diminished cutaneous vasoconstrictor response to body cooling [17], older people may lose both their perception of the environment and their ability to conserve heat at the extremities. They may therefore (a) not perceive themselves as cold and (b) have a reduced physiological efficiency to conserve heat and are therefore at an increased risk of ‘symptomless cooling’ [14,18] putting the older person at greater risk of chilling or worse still, hypothermia [16].
As evidence emerges [11] that the existing analytical models for determination and interpretation of thermal comfort are not appropriate in older age, opportunities open up to investigate multidimensional approaches to thermal comfort, specifically of relevance to older people.
The aims of this study therefore, were to (i) identify the range of thermal sensation self-reports amongst groups of care-home residents, with and without dementia, sharing the same indoor environmental conditions (ii) use objective, long-wave infrared (LWIR) thermography to map extremity skin temperature and (iii) determine the correspondence between thermal sensation self-report and the extremity thermal map.

2. Materials and Methods

2.1. Study Design

Prospective observational feasibility investigation.
Inclusion Criteria: residents living in residential care aged 60 years or over.
Exclusion criteria: residents unable to communicate or lacking capacity to respond to simple questions.

2.2. Sample Size

As a feasibility study, the target population is 70 participants. Assuming attrition, the revised target is 60 participants. With this number, there will be 90% power, at significance level 0.05, to detect one value or unit (°C) change in temperature with 1.4 SD difference between the two groups.

2.3. Participants

Adults living in residential care homes within the South Yorkshire and Derbyshire counties of the UK were recruited over 12 months.

2.4. Screening and Recruitment Pathway

Older adults were invited to give their written informed consent to participate in the study after first reading the participant information sheet. Screening for capacity was undertaken by research nurses of the clinical research network (CRN) for the Yorkshire-Humber and Derbyshire National Health Service (NHS regions). The manager of each residence was first contacted and information was provided verbally and via leaflets for the care home staff to retain. If the manager was interested in the objectives of the study, a researcher returned to the care home to discuss the specific details of the study. The care home manager identified those residents considered to have capacity to give their own informed consent as a study participant using a ‘Noticeable Problems Checklist’. For those residents with a medical diagnosis of dementia, or those considered by the care staff to have fluctuating capacity, the relative (or independent clinician) was provided with study information, by letter, and asked to consider willingness to give their signed consent on behalf of the resident. Once consent had been obtained, a mutually convenient date for recruitment was made to obtain signed consent from the resident or appropriate authority.

2.5. Recruitment

On the day of study, and with consent obtained, a further screening for capacity was undertaken using the Abbreviated Mental Test (AMT) [19], a 10-point scale used as a guide to screening for dementia in those without a formal dementia diagnosis. A score below 8 indicates a level of cognitive impairment warranting ‘assignment’ to the dementia category (D). Residents with AMT score of ≥8 were assigned to a ‘no dementia’ category (ND).

2.6. Data Collection

2.6.1. Demographic Data

Demographic data was collected to include, age, gender, ethnicity, years in residence, ‘handedness’.

2.6.2. Frailty Assessment

The level of clinical frailty was assessed on a seven-point, clinical frailty scale (version 2007–2009 Dalhousie University, Halifax, NS, Canada) [20].

2.6.3. Body Temperature Measurement

Body temperature was measured at the tympanum (Ttymp) using a Thermoscan device (Model LF 40, Braun, Lausanne, Switzerland) before thermography commenced.

2.6.4. Past Medical History (PMH) and Current Medications

For each older resident, a brief medical history was obtained along with co-morbid condition/s and medication history, including polypharmacy. Past medical history (PMH) and medication type may influence: (a) the individuals’ thermal ‘perception’ and (b) heat distribution at the extremities; the former influencing feelings of thermal comfort and the latter, the appearance of the heat signature (i.e., the appearance of the thermal map).
PMH with potential to affect thermal comfort perception includes thyroid dysfunction, impaired neurological perception (e.g., learning difficulties, stroke, dementia, including Alzheimer’s disease, peripheral neuropathy). A PMH likely to affect heat distribution at the extremities (and thus the thermal map) is linked to vascular compromise. Pre-existing conditions were documented and include all forms of diabetes, hypertension, vasculitis, peripheral vascular disease, heart failure and Raynaud’s disease. Current medication/s and dose was also documented with drugs having potential thermoregulatory effects assigned to the following categories: (a) vasoconstrictor effects, (b) vasodilator effects, (c) neurological effects, (d) diuretic effects.

2.6.5. Indoor Environment

Residents were studied in groups of two or more sitting in their usual daytime communal room. Responses were sought under ‘real world’ conditions of the care home. The study was scheduled to commence at least one hour after breakfast. This gave sufficient time to complete imaging before lunch was served. Recommendations for measurement of ambient conditions (EN ISO 7730) [5] were made for air temperature, (Ta °C), relative humidity (RH%) and air velocity (m·s−1) measured using a Kestrel environmental monitor (Kestrel 3000, Kestrel Instruments, Boothwyn, PA, USA).

2.6.6. Clothing

An approximation of clothing fabric insulation for each garment worn by the resident was made using available reference values [21]. Insulation of clothing is expressed as a ‘Clo’ unit. Clothing ‘ensembles’ were estimated from a weighted valuation:
0.676∑ Icl,i + 0.117
where ∑Icl refers to the sum of individual clothing items worn. A pragmatic approach to clothing category produced three groups: 0–0.50 Clo, 0.51–1.00 Clo, >1.0 Clo for light, medium and heavy clothing ensembles respectively. A Clo score of 0 corresponds to a person, nude. A Clo score of 1.0, the value of clothing insulation needed to maintain a person in comfort, sitting at 21 °C with air movement, 0.1 m·s−1, relative humidity (RH) ≤ 50%, the example used being a person wearing a business suit [21].

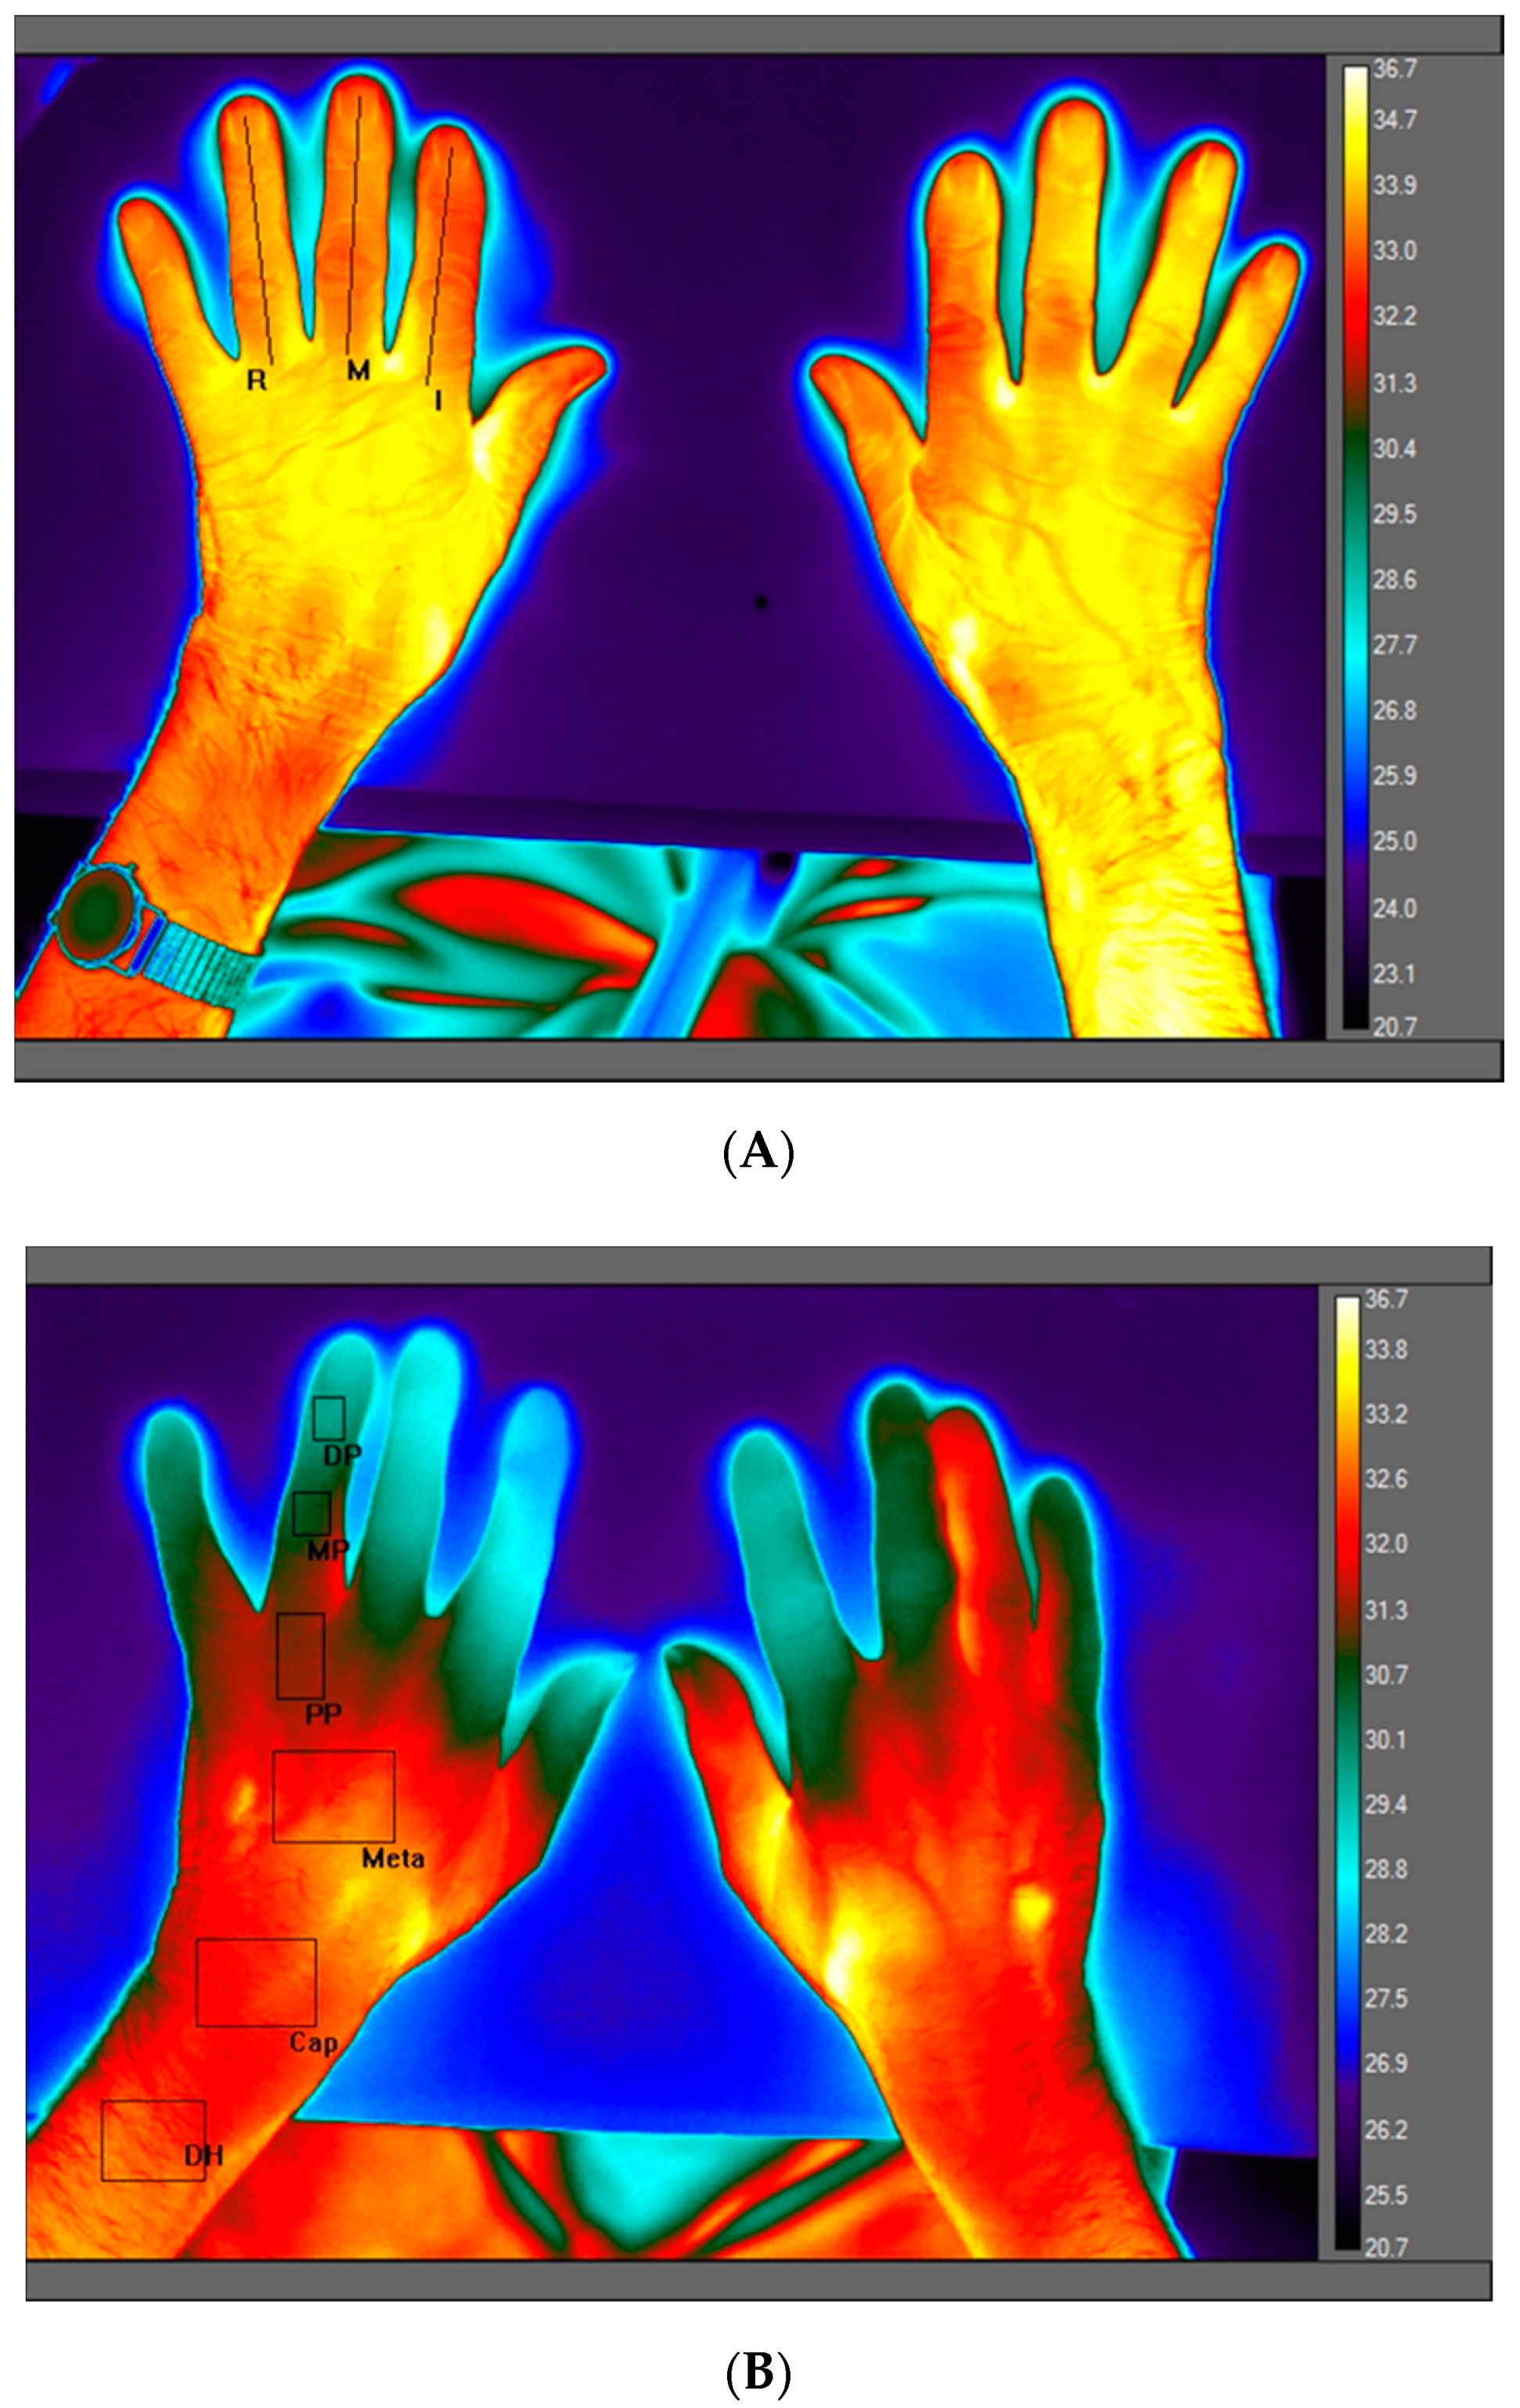
2.6.7. Imaging-Long Wave Infrared (LWIR) Thermography

Infrared thermography was undertaken using an uncooled microbolometer detector, (model A-600 series, FLIR, Täby, Sweden) with image resolution 640 × 320 pixels, mounted on a tripod (Vanguard, Alta Pro 264AT, Dorset, UK) and connected to a laptop computer. The LWIR detector system was positioned such that the seated participants were comfortable. In the sitting position, acral region (both hands) were positioned, first with the dorsum followed by palmar surface upwards resting upon a paper ‘hand template’ (Figure 1) overlying an insulated tile.
This provided visual orientation to the participants for the placement of fingers and hands in a consistent position and to obtain a clear field of view (FOV). After checking detector focus and distance, a maximum of three images were obtained. Colour thermal maps were obtained using a proprietary FLIR software (FLIR Systems AB, Täby, Sweden) and colour palette (see Figure 2).
In this paper, data were reported of the dorsum of the hand as this was the most comfortable position for older participants. The colour palette, with temperature key, shows darkest colours (indigo/blue) representing the lowest skin temperature and bright colour (white/yellow) highest temperatures (Figure 2).

2.6.8. LWIR Region of Interest (ROI) and Image Processing

Emissivity was set to 0.98 for all images; temperature span 16 °C; range 20.7–36.7 °C. A ‘first-pass’ review of thermal maps for temperature variability across ring (R), middle (M) and index (I) finger was made. Thermograms showed that fingers typically appeared ‘non-uniform’ in temperature distribution. Thus, for each participant, a vertical ‘line’ ROI was constructed (Figure 2A) for each of R, M and I fingers. The finger with the greatest skin temperature value S.D (an indication of temperature variability) was used in subsequent analyses. For the selected finger, a series of six vertical ‘box’ ROIs (Figure 2B) were constructed (manually) traversing the centre of each finger of the non-dominant hand and using pre-defined dimensions; fingertip (distal phalange, TDP), wrist (capitate bones, TCap) and forearm (distal humerus/ulnar TDH). Thee ROI dimensions were used throughout the post-processing of LWIR images; TDP, (280 pixels) TCap, (2436 pixels) and TDH, (1900 pixels). On occasions, the anatomical ROI did not conform well to the finger (e.g., the hand was too slim for the size of the ROI or the hands were ‘gnarled’ by arthritis, preventing the ‘flat’ placement of the hands, so the ROI dimension was adjusted slightly to ‘fit’ ROI to finger anatomy. Mean temperature difference (°C) across the extremities were calculated as: TDP − TCap (∆T1) and TDP − TDH (∆T2). The mean temperature difference between TDP and tympanic temperature is given as ∆T3.

2.6.9. Calibration

Calibration of the FLIR thermal camera was undertaken against a black-body source (P80P, Ametek-Land, Dronfield, UK) to determine temperature accuracy and thermal camera performance across a 20 °C environmental temperature range (20–40 °C).

2.6.10. Warmth Sensation Rating

After adjusting to the study environment, each participant was asked to rate their thermal sensation using the 7-point thermal sensation scale with options ranging from −3 (cold), −2 (cool), −1 (slightly cool), 0 (neutral), +1 (slightly warm), +2 (warm), +3 (hot) [4]. The McIntyre scale [22] for thermal preference (thermal vote, TV) was used to obtain a response to the question “I would like to be”: options include (a) cooler (b) no change (c) warmer.

2.6.11. Statistical Analyses

All computations have been carries out with SPSS version 24 (IBM, Armonk, NY, USA). The associated factors analysed in participants over 60 years are presented as numbers, percentage, mean (standard deviation, SD), with p-value. Chi-Square tests were used for categorical data. Anova tests were performed for comparison of mean values of independent variables amongst the two participant groups: ND and D. ANOVA was used to determine whether there were any statistically significant differences between the means of two independent groups (Table 1).

2.7. Ethics Approval, Screening and Recruitment

All subjects gave their informed consent for inclusion before they participated in the study. The study was conducted in accordance with the Declaration of Helsinki, and the protocol was approved by the East Midlands (Derby, UK) research ethics committee and Health Research Authority (HRA) (16/EM/0483).

3. Results

3.1. Characteristics of Older Adults Living in Residential Care

Seventy-three residents gave their consent to the study. Data was analysed from 69 people aged 60–101 (mean 84) years; 47 were female. Participants were recruited from 15 English residences. All were white British, Irish or European. Sixty residents had mild, moderate, or severe frailty. Nine residents only, were ‘well’ or ‘managing well’ on the frailty score. There was a significant difference concerning frailty with more residents in the dementia (D) group being severely frail (p = 0.028) (Table 1).
AMT ranged from 0–10 (median 8). Thirty-four residents were assigned to ‘dementia’ category, (D) and 35 residents, (ND) (Table 1). Residents were studied in groups of two to five at each imaging session (median three residents per session) in still air (<0.1 m·sec−1) Ta 21.4–26.6 °C (mean 23.6 °C) RH 32–78% (mean 51%). Under these indoor ambient conditions, a variety of clothing ensembles were worn (Clo range 0.26–1.54, mean 0.61 Clo) corresponding to light (n = 20) medium (n = 47) heavy (n = 2) clothing ensembles respectively.

3.2. Thermal Sensation (TS) Self-Rating

Of the 68 of 69 participants who provided a TS self-report, the majority rated the environment ‘comfortable’ (TS score 0, n = 43, 63%). For the remainder, responses raged from +2 (n = 3), +1 (n = 7), −1 (n = 13), −2 (n = 1) corresponding to ‘warm’, ‘slightly warm’, ‘slightly cool’, ‘cool’ respectively with a range of different TS ratings between residents across individual care homes (Table 2). None of the residents rated −3 (cold) or +3 (hot). Overall, 92% of residents rated TS −1 to +1. Most residents (n = 55, 80%) on providing a TV did not wish to change the temperature of the environment whereas eight (11%) would have preferred a warmer temperature and six (9%) a lower air temperature.

3.3. Thermal Sensation Ratings and Clothing Insulation

When sharing the same room (and thus same Ta), differences in TS rating and TV were reported. A significant difference in TS rating was noted between residents (D vs. ND) (p = 0.02, Table 1). Residents (D) more frequently expressed feeling ‘slightly cool’ or ‘cool’ (n = 11) compared with ND residents (n = 3; Table 1). By contrast, residents without dementia more frequently expressed feelings of being ‘slightly warm’ or ‘warm’ (n = 9) compared to those with dementia (n = 2). Throughout the months during which the study was conducted, clothing worn by the majority of residents (Table 1) provided light to medium insulation; differences in clothing insulation tending towards medium to heavy Clo units for residents with dementia (borderline significance, p = 0.05).

3.4. Core (Tympanic) Temperature

Residents were afebrile, Ttymp 35.5–37.5 °C (mean 36.7 °C). A statistical but not clinically significant difference was observed between ND vs. D groups (p = 0.01, Table 1). Differences (TDP − Ttymp) were consistently negative for all older adults; ∆T3 range −12.5 °C to −2.3 °C.

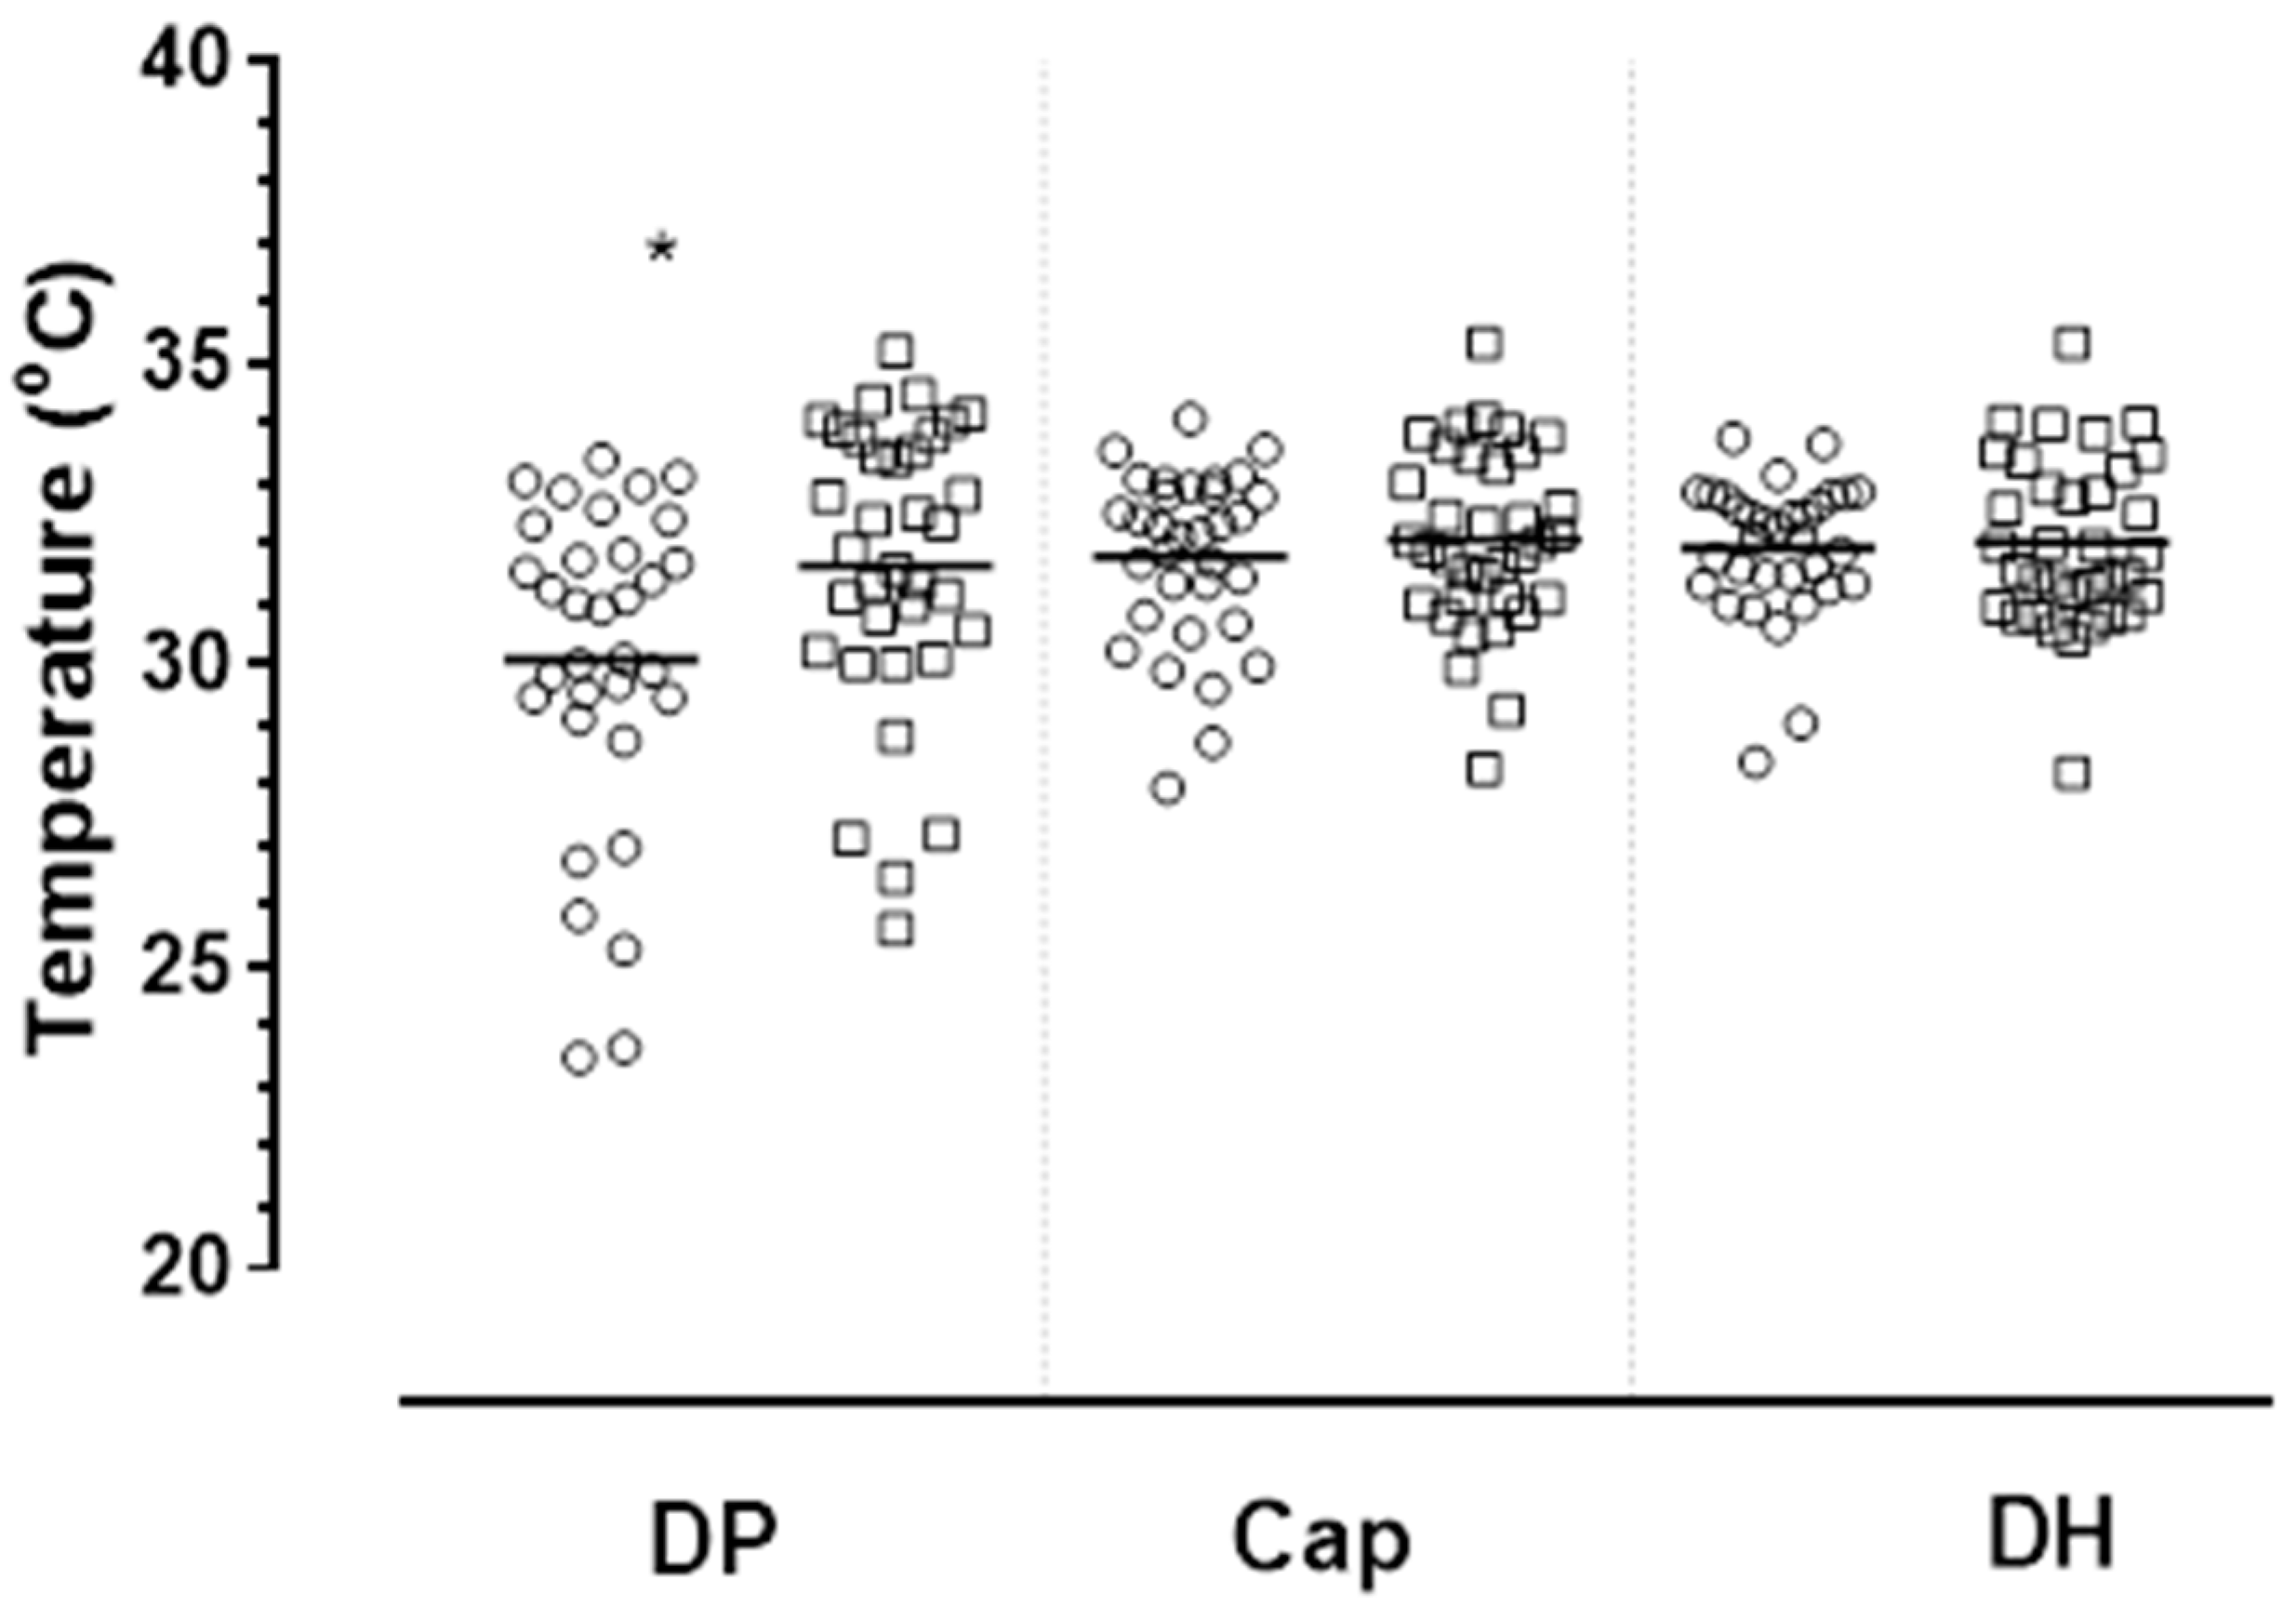
3.5. Skin Extremity Temperature

Right hand was dominant in 63 of 69 residents (91%). Thermal mapping and data analysis of ‘non-dominant’ finger/hand ROIs were therefore performed predominately for left hand. Individual extremity skin temperature values for TDP, TCap, TDH for all residents are lowest for TDP. Mean vales for TDP, TCap, TDH were 30.9 °C (2.6 °C), 31.9 °C (1.5 °C), 31.9 °C (1.3 °C) respectively. Mean TDP was significantly lower (p = 0.01) for residents with dementia compared to ND (Table 1; Figure 3).

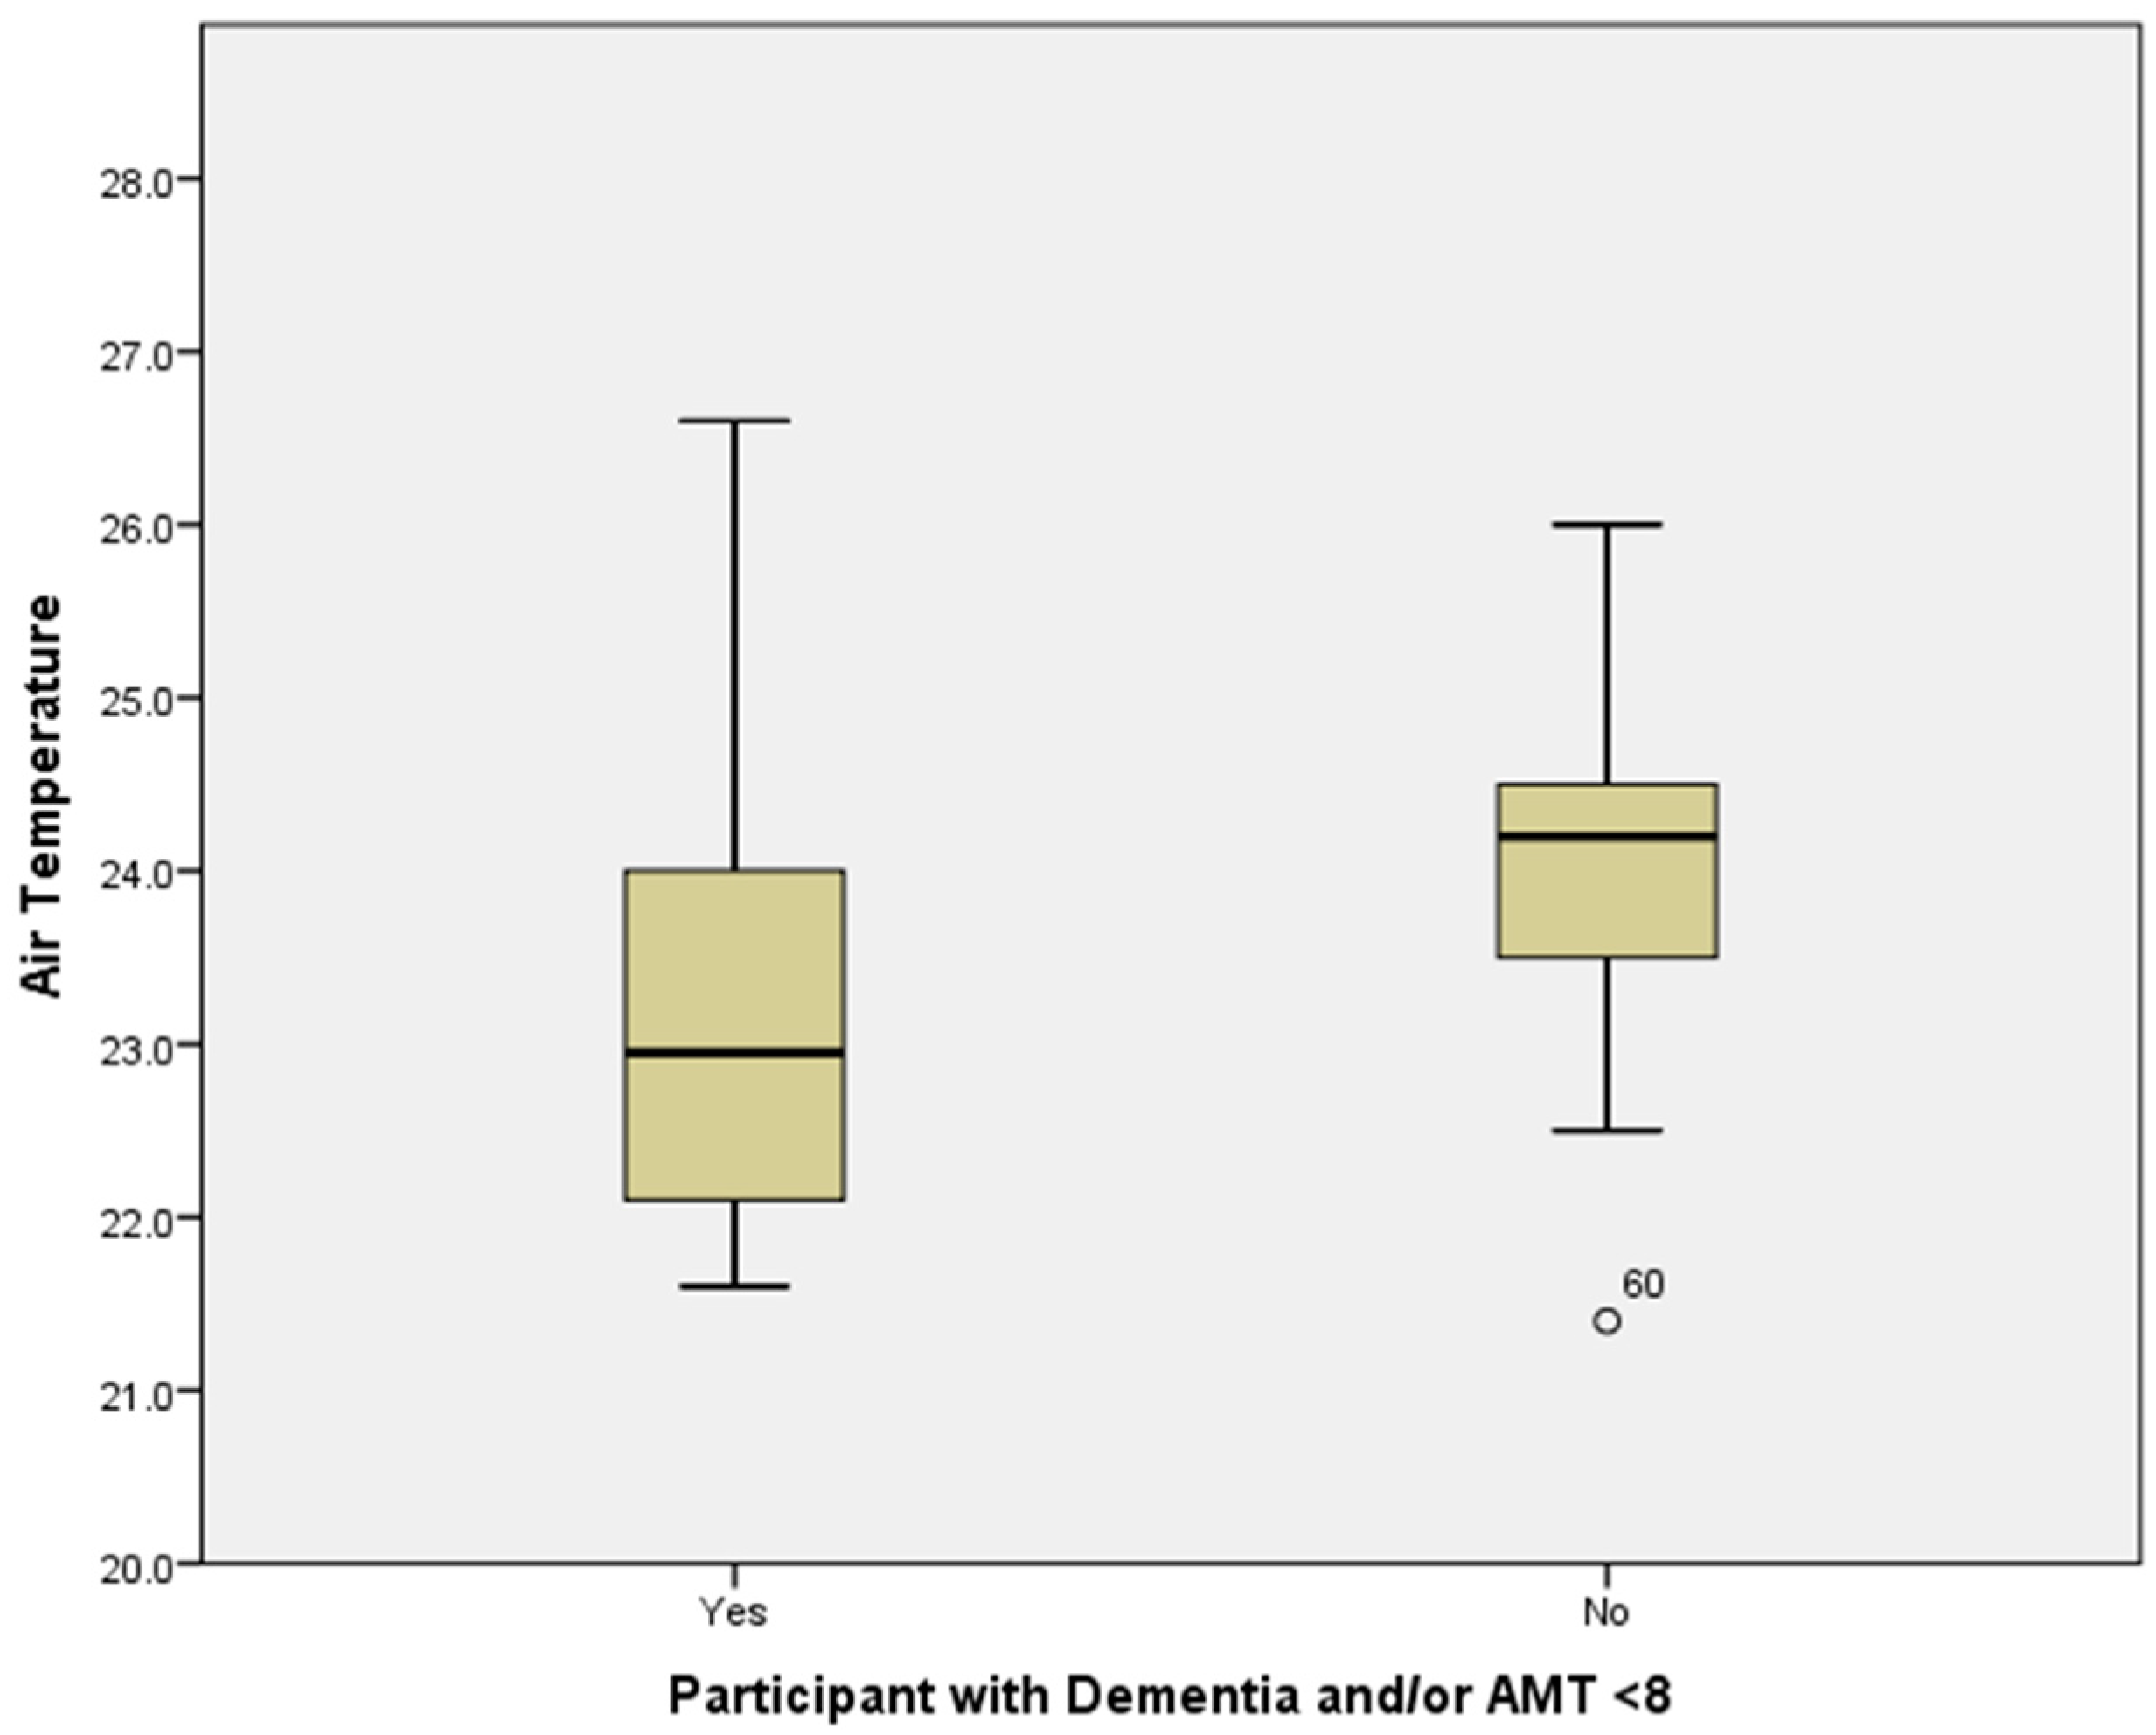
3.6. Comparisons Between Groups

D vs. ND: Air, extremity skin and tympanic temperature: Ta of the communal rooms where residents were sitting was, on average, 1.0 °C lower (p = 0.001) in D compared to the ND group (Table 1; Figure 4).
A wide range of ROI temperature differences were recorded at each ROI (Figure 5) and from these values the temperature gradient, delta T (∆T) calculated for ∆T1 (TDP − TCap) and ∆T2 (TDP − TDH) with respect to TS rating. Figure 6 shows the mean temperature (°C) at each of the three ROIs with respect to each residents’ reported TS rating.
For ∆T1, mean difference, 0.43 °C (0.24) (ND) vs. −1.7 °C (0.29 °C) (D) p = 0.001. For ∆T2, mean difference, 0.39 °C (0.26 °C) (ND) vs. −1.8 °C (−0.34 °C) (D) p = 0.001 (Table 1) The range of temperature differences, ∆T1 for residents with dementia ranged from −6.4 °C to −1.5 °C and for residents without dementia, −3.7 °C to 2.3 °C. The range of temperature differences, ∆T2, −7.7 °C to 0.6 °C and −4.1 °C to 2.3 °C for D vs. ND respectively. A significant difference (mean 0.2 °C) for tympanic temperature (p = 0.01) was observed between groups ND and D.

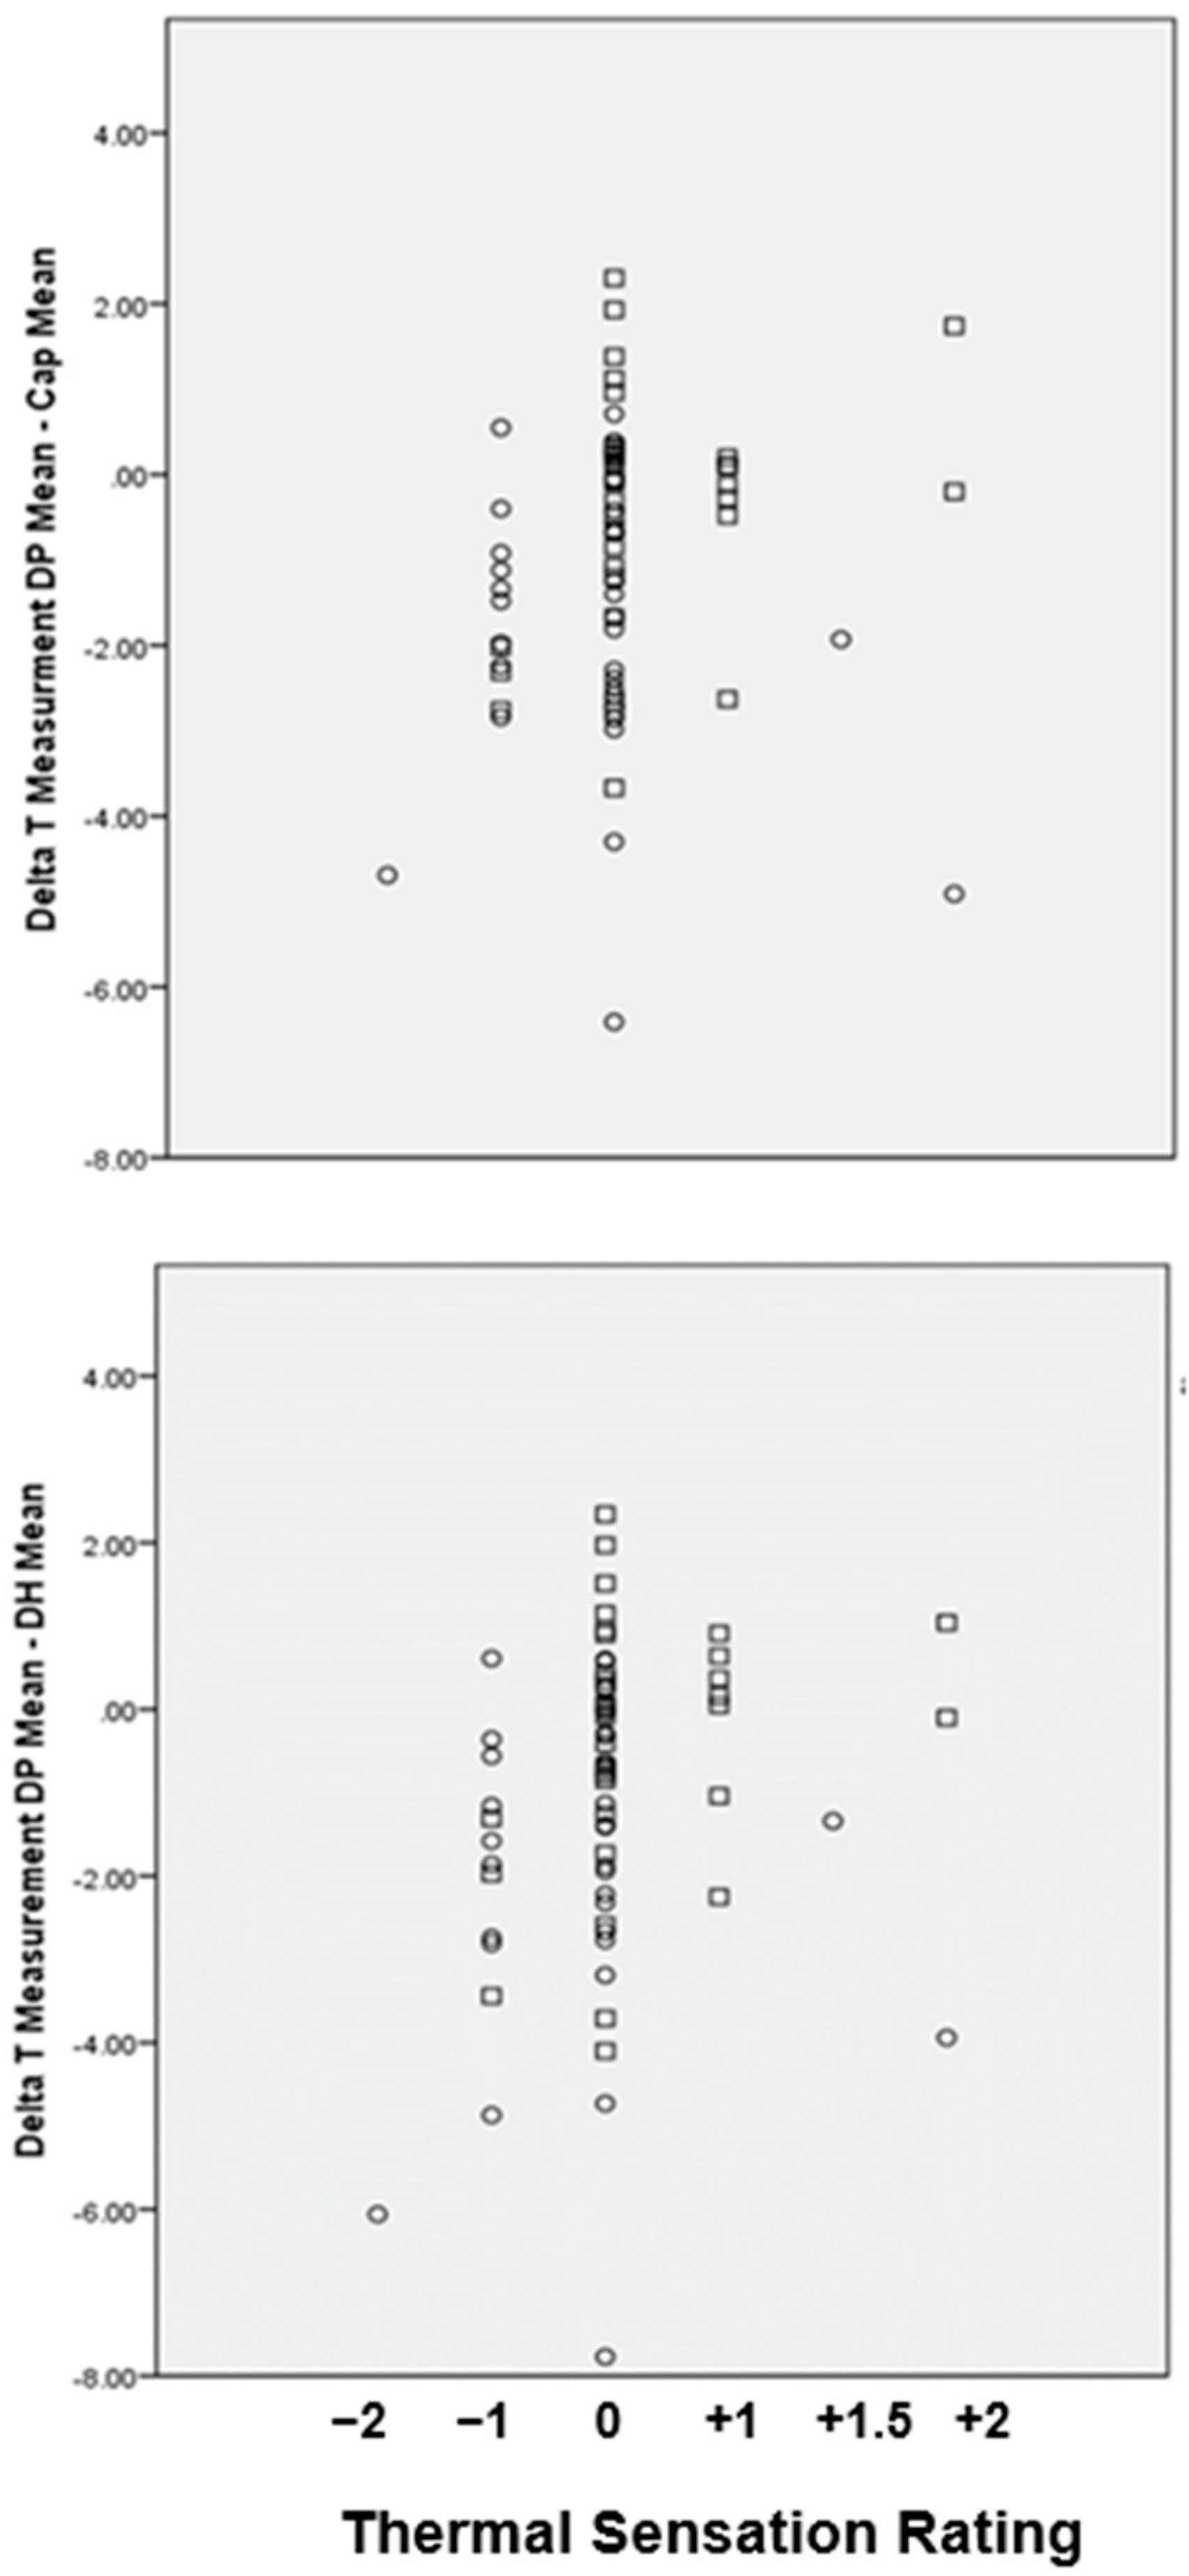
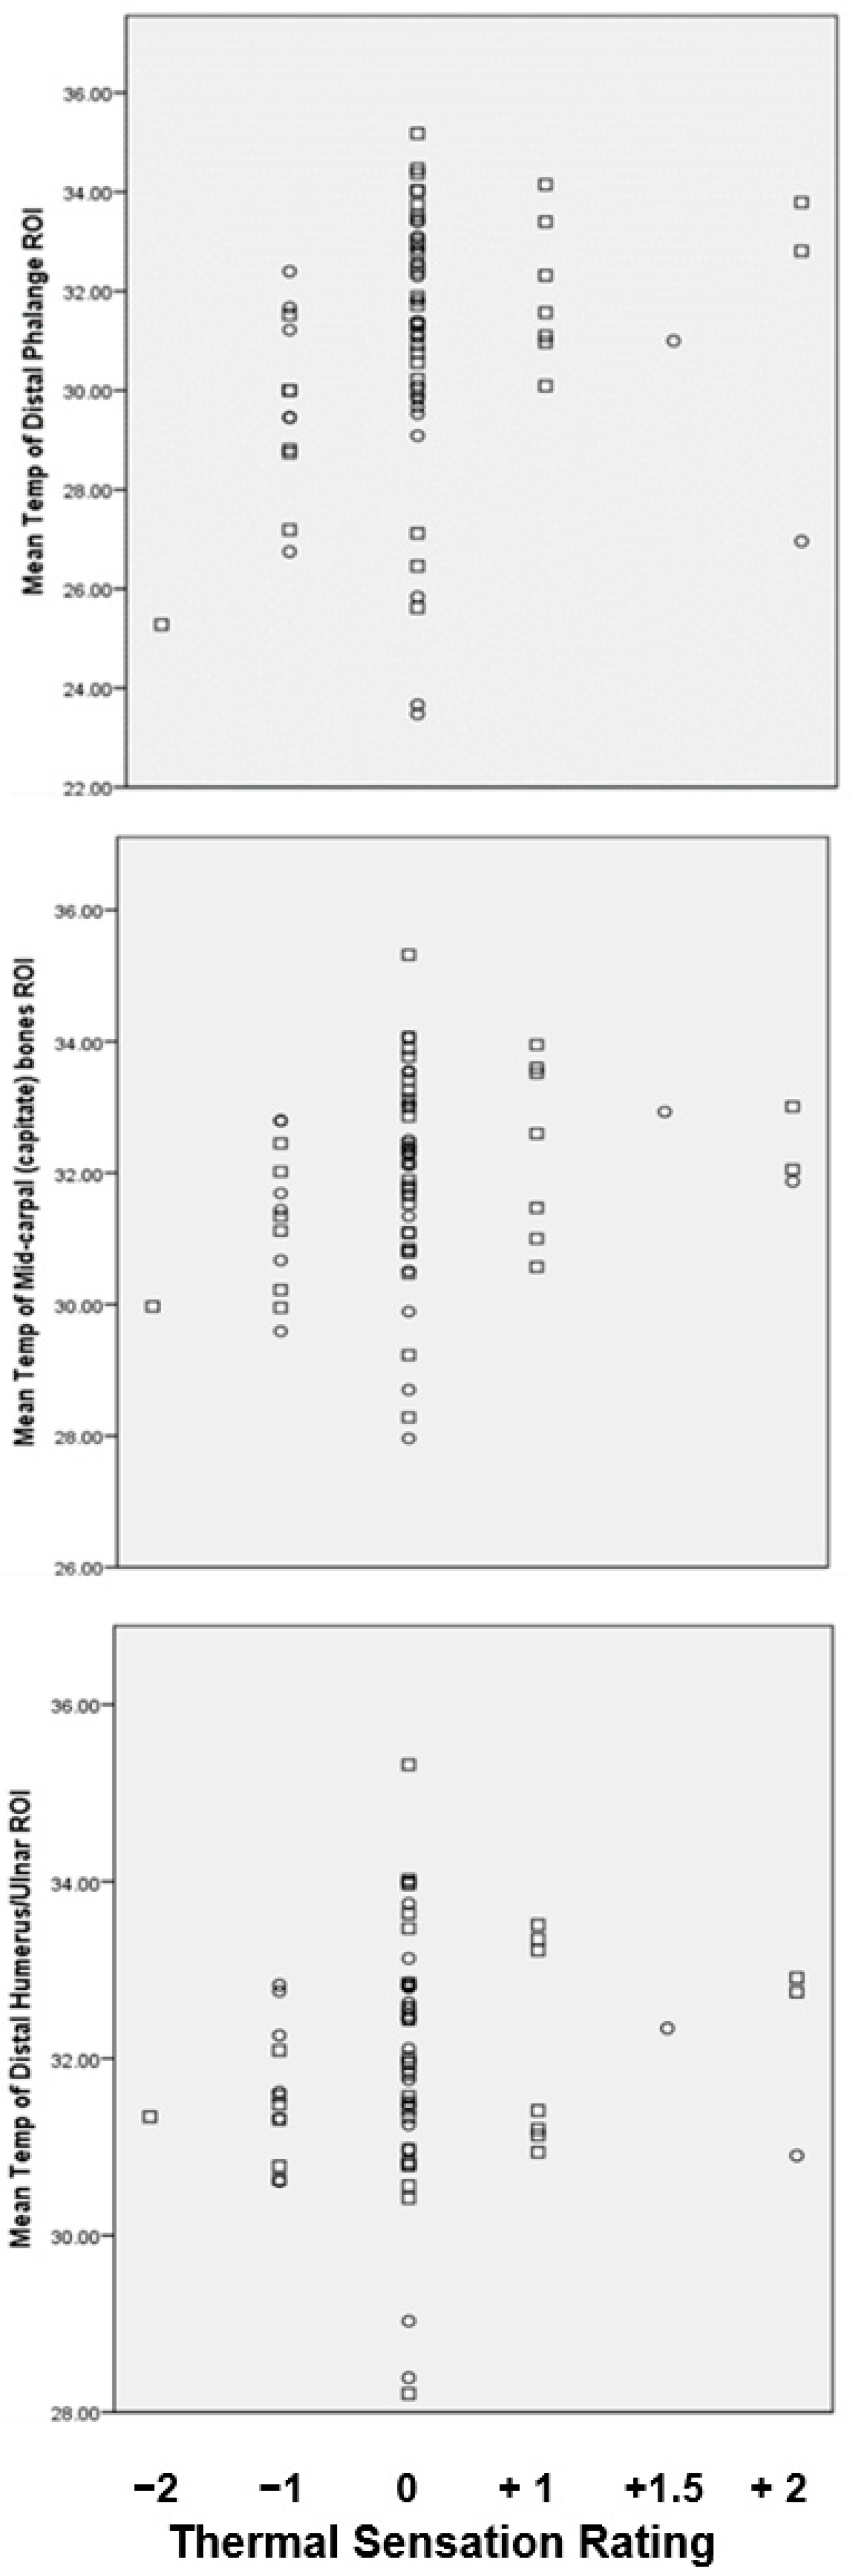
3.7. Extremity Temperature Values and Thermal Sensation Rating

On further exploration of thermal sensation for TDP, residents who were dissatisfied with the environment provided ratings of −2 and −1 (slightly cool, cool, respectively), 11 were residents with dementia (D) and 4 did not have dementia (ND). Eleven residents (9 ND, 2 D) were also dissatisfied with the environment perceiving it as slightly warm (+1, +1.5) or warm (+2).

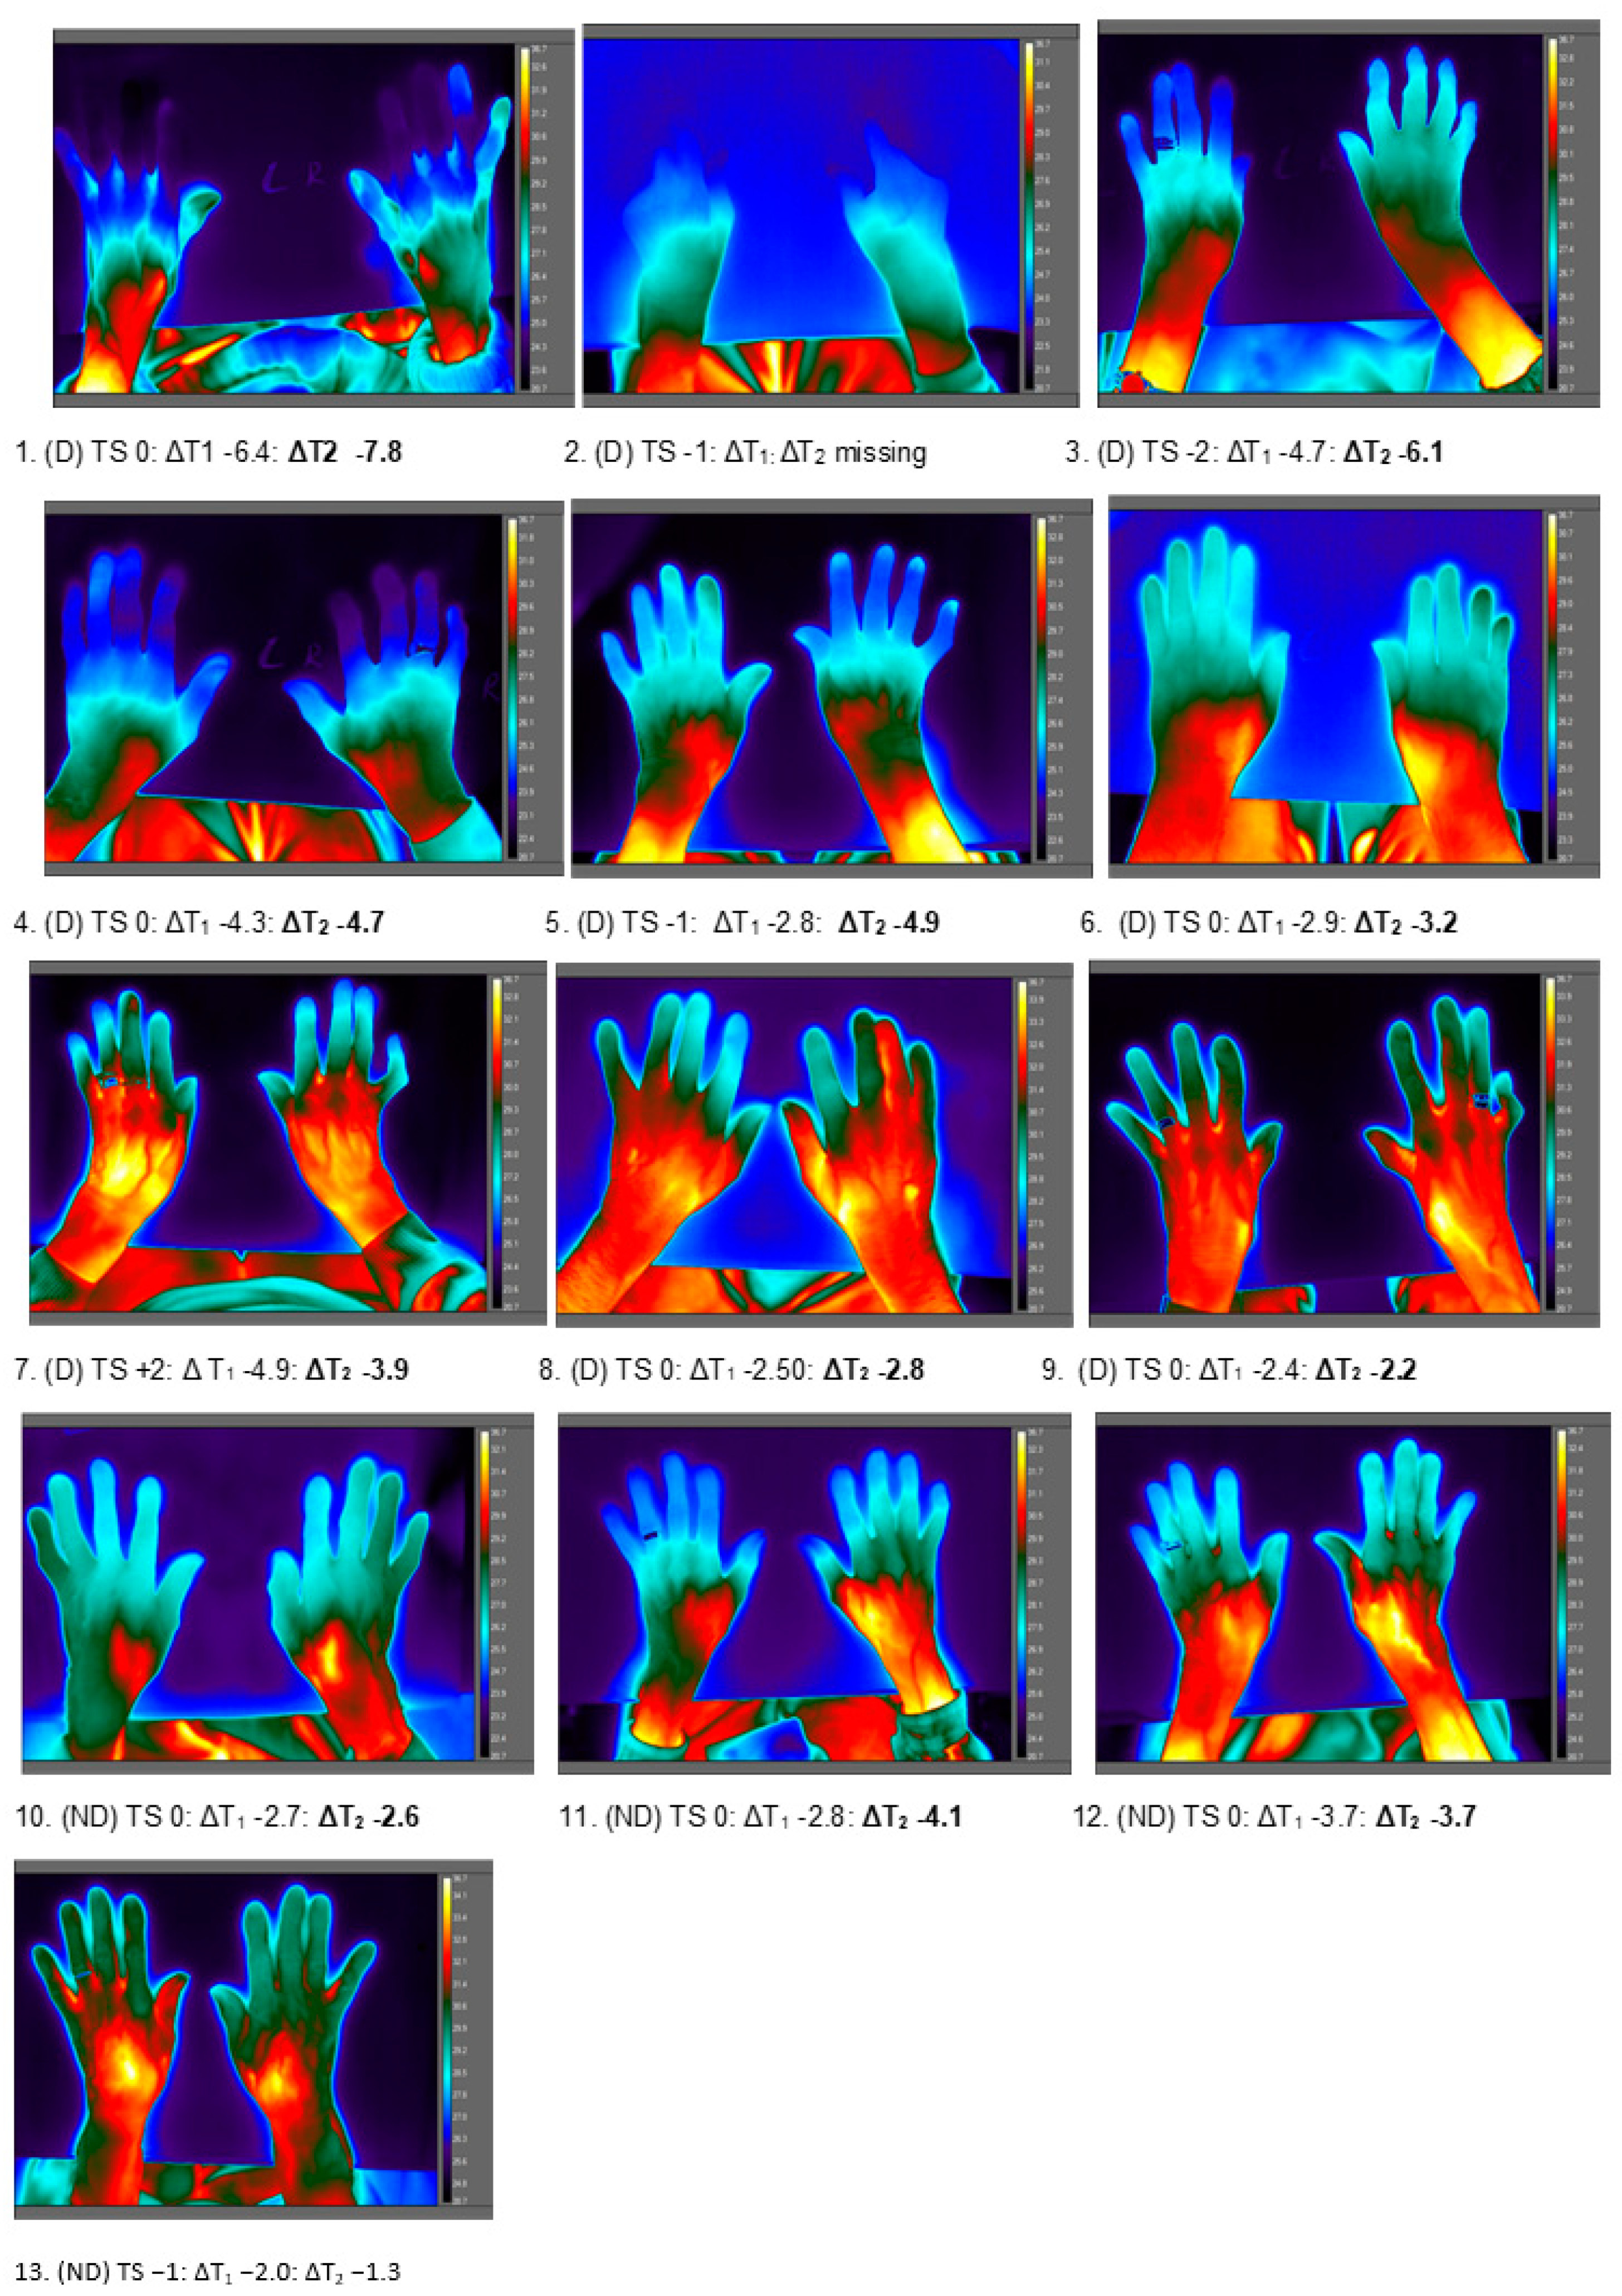
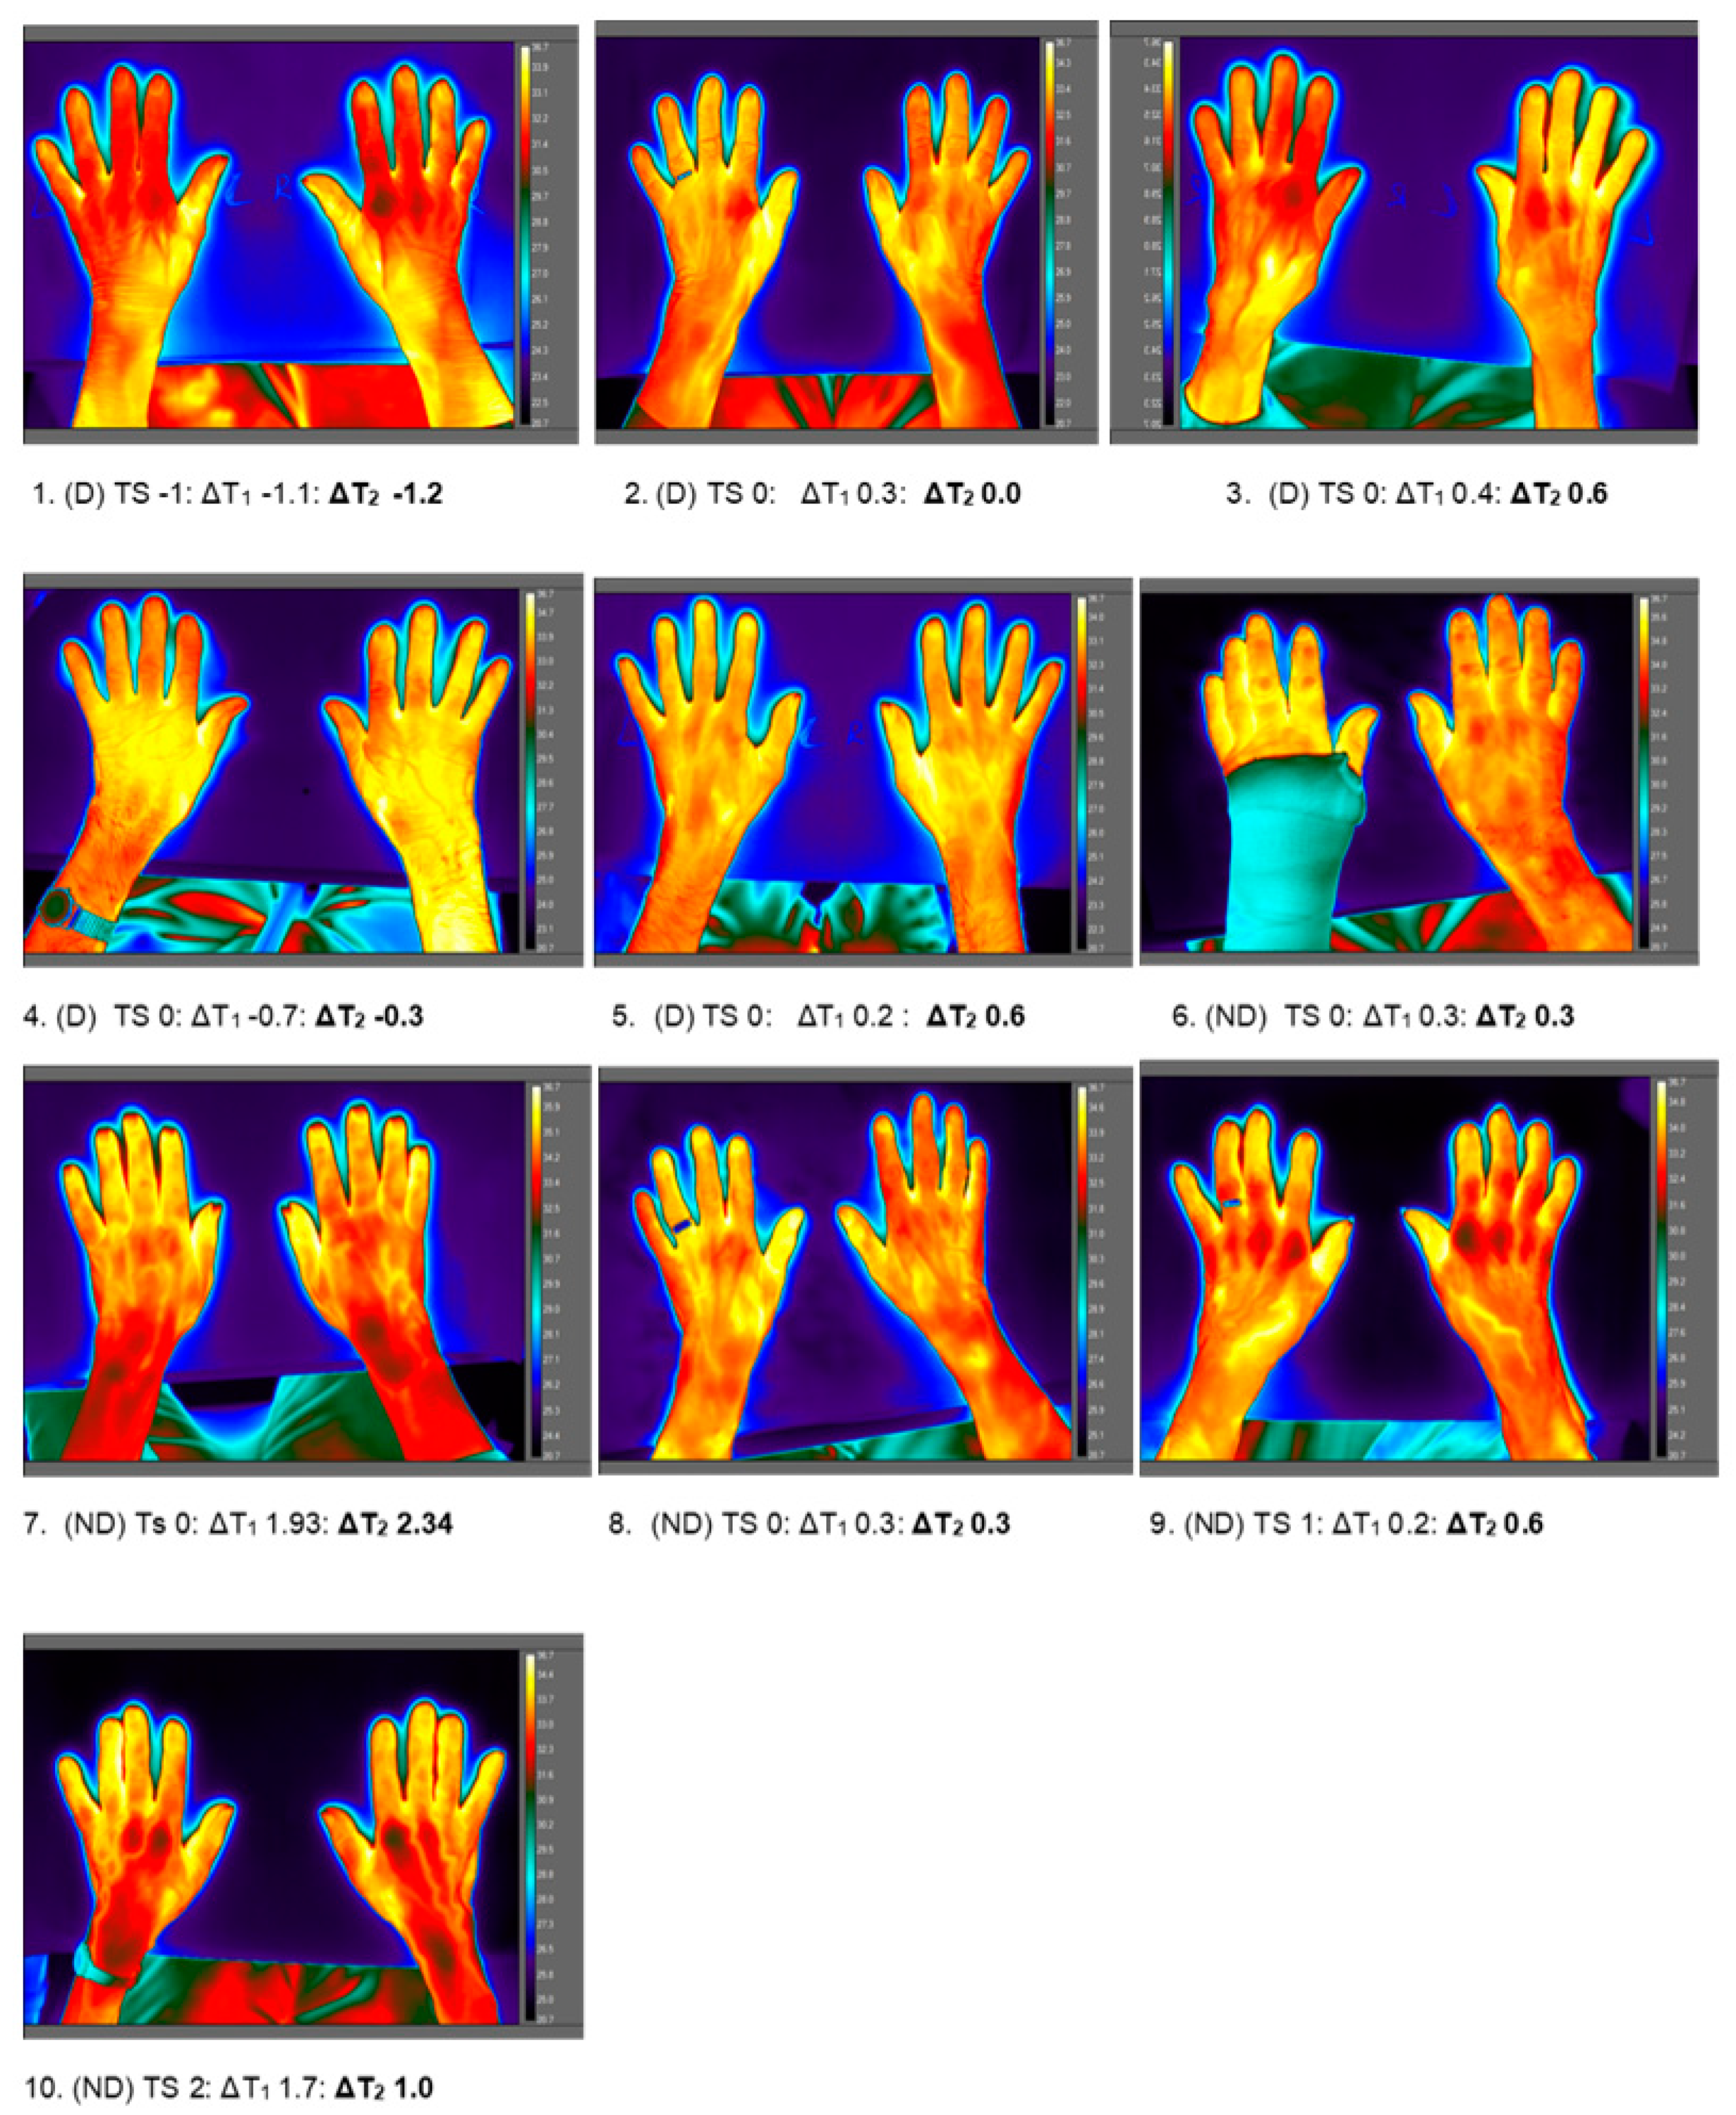
3.8. Thermal Mapping of Extremities: Correspondence Between the Thermal Map and Thermal Sensation Report

Qualitative review of hand thermograms, showed the visual appearance of skin temperature for ∆T1 and ∆T2 of all residents in the environment of their cluster groups:
(A) ‘Cold hands’: LWIR thermogram appearance was not consistent with thermal sensation report. Thirteen residents (9 in D category) showed the visible appearance of ‘cold hands’ mean TDP < 30 °C (range 23.5–29.9 °C; median 26.5 °C) in air temperatures ranging from 21.4 °C to 25.6 °C (median 23.5 °C) (Figure 7). Thermal sensation ratings were variable ranging from −2 (cool n = 1), −1 (slightly cool, n = 3), 0 (comfortable/neutral, n = 8) to +2 (warm n = 1). For cold hands, the temperature difference for ∆T1 ranged from −6.4 °C to −2.0 °C (median −2.8 °C) and for ∆T2 −7.8 °C to −1.3 °C (median −3.8 °C). A clear demarcation in temperature across the hands was observed such that areas were ‘invisible’ against ambient temperature on the thermal map. ‘Thermal amputation’ was evident visually for the digits in 4 residents with (D) where ∆T1 was −6.4 °C, −4.7 °C, −4.3 °C (n = 1 data missing).
(B) ‘Warm hands’: By contrast (Figure 8) the brightest colour appearance visually on thermograms corresponded with highest hand temperatures in 10 residents (5 D; 5 ND) (mean TDP 31.7–35.2 °C; median 33.7 °C) across air temperature of 21.9 °C to 25.3 °C (median 22.9 °C) i.e., similar air temperature to those with cold hands. Individual thermal sensation ratings for this group were: −1 (slightly cool, n = 1); 0 (comfortable/neutral, n = 7), 1 (slightly warm, n = 1) and 2 (warm, n = 1). Temperature difference across the hands for ∆T1 ranged from −1.1 °C to +1.9 °C (median 0.3 °C). Similarly, for ∆T2, mean temperature differences between ROIs was small: range −1.2 °C to +2.34 °C (median 0.45 °C).

3.9. Medical History and Medications with Potential Influence on Perception of Temperature and Thermal Appearance

None of the residents had a past medical history of Raynaud’s disease. There was however, a significant difference in the number of current medications between the residents with and without dementia (p = 0.001). However, with respect to medication with known vasoconstrictor or vasodilator effects which might be expected to have an effect on the distribution of blood flow (and temperature) at the extremities, there was no significant difference between the groups, neither were there significant difference in the medications given with known effects on neurological function known to impact on perception of thermal comfort. No other significant difference in medication type was noted for the remaining classes of prescribed drugs.

4. Discussion

The majority of care home residents in this study were in the older-old age group; 27% aged 90 years or more and with approximately half of the group with cognitive deficits. Studies of thermal comfort are typically performed under controlled conditions of a climate chamber e.g., [13,23]. Whilst Soebarto et al. [24] did undertake studies (of young and old people) in a climate chamber in both young and older people, the authors comment that this is not practical for the very old and frail. Undertaking the current study under the ‘real-world’ conditions of the care home provides a true representation of an individual’s day to day indoor environment and associated thermoregulatory responses. In seeking to understand the responses of older people to their environment, we recognise that identifying those with cognitive deficits (vascular cognitive impairment, Alzheimer’s prodrome) often falls short of an exact medical diagnosis [25]. This makes disease classification for research [26] to two binary groups (‘dementia’ vs. ‘no dementia’) rather more ‘nuanced’ because age-related cognitive decline follows a continuum across the boundary between normal cognition to the severely demented [26]. It was therefore not possible to assign residents accurately to two groups based on diagnostic differentiation using neuropathology or amyloid biomarkers [27] so the AMT score was used as a pragmatic alternative in the absence of a confirmed diagnosis.
Conducted across 15 English residential care homes, the overarching finding was that older people exposed to the same environmental conditions sense thermal comfort quite differently from one another and this carriers an important message for their carers, alerting them to the potential that residents will experience both satisfaction and dissatisfaction under the same indoor conditions.
Thermal comfort is just one aspect of the environment that exerts an effect on older people [11,28] especially those with dementia [29]. It is clear from the work of Walker et al. [10] that during cold weather, carers and managers are concerned about keeping residents warm and comfortable but see this as challenging due to the diversity of co-morbid conditions, frailty, and different levels of activity of people who live together. The same concerns hold for keeping residents cool in hot weather [3]. However, in the absence of any established method or consensus on how best to provide thermal comfort for the majority, it is likely that those residents in thermal discomfort (whether too cold or too hot) will be overlooked, especially if they are unable to communicate effectively.
Many researchers [30,31,32,33] have explored skin temperature (the physiological interface with the environment) as a predictor of thermal comfort. For example Wu et al. [34] investigated upper skin extremity temperature (finger, wrist, hand, forearm) and the conditions required for indoor thermal comfort in an office environment using the same 7-point thermal sensation scale as for the current study. In mean air temperature of 26.8 °C, 60% of adults rated thermal sensation 0 (‘neutral’) and 90%, rated TS from −1 to +1 (slightly cool, neutral, slightly warm). Similar results were observed in the older aged residents in this study, 63% and 92% rating TS 0 (neutral) and −1 to +1 respectively, albeit in mean air temperature 2 °C lower than the office-based adults. As for upper extremity temperatures in the older residents, mean finger-tip (30.9 °C), wrist (31.9 °C) and forearm (31.9 °C) temperatures were 2 °C lower than reported by Wu et al. [34] where corresponding regions (fingertip, wrist, forearm temperatures) were 33.4 °C 33.7 °C and 33.7 °C respectively. Of interest therefore is that whilst older adults had lower mean skin temperatures and were in lower indoor temperatures, a comparable percentage of residents were satisfied with the environment and rated their TS as 0 (neutral/comfortable). The possibility that the older person’s thermal perception of the environment is ‘blunted’ is consistent with the biological consequences of ageing on thermogenesis and decline in thermosensitivity [35]. This blunting of thermal sensation can occur similarly as in other types of sensory perception loss with age [36]; hearing, vision, taste and smell being additional examples. We have observed features of thermal blunting in the older residents, particularly those with dementia where we observed residents with low extremity (digit) temperatures corresponding to ‘cold hands’ reporting thermal sensation as neutral (or comfortable) even with obvious visual ‘thermal amputation’ on the thermal map and even where environmental temperature was within the thermoneutral range [37,38].
In the thermoneutral zone, skin blood flow in the hands is tonically active and vasomotor tone of skin capillaries operates as the primary ‘controller’ of deep body temperature. Hands (and feet) represent ‘radiator’ organs [39] losing heat to the environment as well as retaining and conserving body heat. Skin temperature therefore varies with changes in vasomotor tone. Capillaries of non-glabrous skin, along with arterio-venous anastomoses (AVAs) of glabrous (hairless) skin of hands and feet are continuously adjusting (cycling) blood flow to extremity skin to balance heat loss with heat retention [38,40]. These physiological measures, independent of an individual’s TS perception may provide a more robust indicator of temperature derangement than achieved through thermal comfort scales, especially under conditions where there is a risk of ‘symptomless cooling’ [14,18]. If it is possible to measure and/or ‘see’ the consequences of marked vasoconstriction (or vasodilation) at the extremities this may provide a more reliable indicator of thermal risk; ‘cooling without noticing’. We have shown previously [8], as have others [41], that the feeling of being chilled tends to start in the hands or feet. Harazin et al. [42] report finger skin temperature (at a ‘cut-off’ temperature below 29 °C) in adults (with vibrotactile perception disorders consequent on peripheral neuropathy) as a characteristic of ‘cold hands’ even in air temperature above 21 °C.
In addition, Pathak et al. [23] have shown that skin temperature gradients are significantly related to resting metabolic rate such that air temperature of 25 °C may serve as an objective measure for the conditions to maintain homeothermy. Looking further at both extremity skin temperature, Wu et al. [34] report finger temperature above 30 °C (and finger-forearm temperature gradients close to 0 °C) to represent a significant threshold for an overall sensation of thermal comfort. Furthermore, at mean air temperature of 26.8 °C, Wu et al. [34] report temperature gradients between fingertip to wrist and fingertip to forearm ranging from −3.5 to 0.3 °C and −4.0 °C to −0.3 °C respectively; the negative temperature gradient serving as an indicator of a ‘cool’ TS response.
In the current study, older adults showed peripheral vasoconstriction as evidenced by the temperature gradients across the extremities; more intense in those with D than ND for both fingertip to wrist (∆T1) and fingertip to distal forearm (∆T2). At mean air temperature of 23 °C (Group D) and 24 °C (group ND) this air temperature is within the thermoneutral (comfort) zone (23–27 °C) for light to moderately clothed adults [23] yet older residents show evidence of extremes of thermoregulation as evidenced by both marked peripheral vasoconstriction and vasodilation in hand ROIs observable on the thermal maps.
Being able to take temperature measurements using conventional thermometry and across multiple areas of the skin surface in the setting of care homes presents a significant challenge in routine care. However, with infrared thermography, a quick visual assessment of the physiological response to the environment can be made by imaging of the extremities. Heat maps reflect the net effect of changes in vasomotor tone on skin temperature. As far as it is possible to tell, this is the first report of an independent imaging technology to map ‘what we see’ on LWIR thermography with ‘what people say’ about their thermal comfort. In other words, can we ‘see’ signs of thermal discomfort using thermal imaging and is there a potential benefit in doing so? Although other techniques; laser Doppler imaging [43], laser speckle imaging [44] or venous occlusion plethysmography [45] are available, they are rather less practical for the conditions of the care home whereas LWIR thermography offers an ‘at a glance’ imaging solution about thermal conditions of the ‘radiator’ organs, the most obvious exposed skin site being the hands. What we see on thermal imaging is the distribution of heat at the extremities which, at least for digit skin temperature (where metabolically active tissue is minimal) is entirely due to blood flow.
On qualitative review of thermal maps, the appearance of ‘cold’ and ‘warm’ hands emerged based on colour coding across a temperature span of 16 °C. For residents with ‘cold hands’, fingertip temperature (TDP) was, in all cases <30 °C with fingertips consistently colder than wrist and forearm and with a wide (negative) skin temperature gradients for ΔT1 and ΔT2 irrespective of TS rating. These results support the work of both Pathak and Wu [23,34] (albeit studying younger, healthy adults) that fingertip temperature below a cut-off, together with wide (negative) temperature gradient (fingertip-wrist and fingertip-forearm) occur across the thermoneutral range. As we have observed, on review of the hand thermograms, this powerful vasoconstrictor response, which can decrease skin blood essentially to zero [46], is not always accompanied by a sensation equivalent to thermal discomfort.
Whilst commonly used models for thermal comfort are based on Fanger’s work [47], such models were developed from studies in young, healthy adults in the workplace. That these models are inappropriate for older people is now recognized because changes in the structure of the nervous system as people age means that thermal sensitivity and perception decreases [14]. In the older group of residents, we have seen how varied the thermal comfort responses of older people are, even under the same environmental temperature. Shahzad et al. [48] have shown that neutral thermal sensation does not guarantee thermal comfort; 36% of participants in their study did not want to feel ‘neutral’ as their comfort condition, preferring a non-neutral thermal sensation. This finding supports the work of de Dear [49] in differentiating thermal ‘pleasure’ from thermal ‘neutrality’; some people finding a cool environment more ‘pleasing’ than a neutral position which, apart from personal preference may also be influenced by cultural and social factors. For example, Florez-Duquet et al. [50] showed that older subjects generally did not report, or complain, of cold even during an entire cold exposure test whereas young adults did. Taylor et al. [15] showed that older people require a more intense stimulus, starting at the extremities before they ‘feel’ cold. Consequently, older people are being exposed to intense thermoregulatory challenges that will go unnoticed under the ‘normal’ indoor temperatures of the care home.
As the focus for long-term care has shifted from processes of care (safety, medical concerns) towards improving outcomes for residents [1] opportunities arise to meet this new challenge; to improve quality of life through considerations of the care home environment [51].
Whilst the majority of residents (both groups), expressed satisfaction with the environment by rating 0 on the thermal sensation scale, many did not; rating the environment too cool or even too warm. The first impression therefore, would be that residents were not in their comfort zone even in warm conditions but is this truly a measure of true satisfaction with the environment? Further evidence of the validity of the thermal sensation report can be explored by investigating concomitant changes in physiological factors, notably the degree of peripheral skin vasomotor tone.
Finally, of importance, in the context of determining the health and thermal comfort of older people in residential care, is not only in the ability to spot the vulnerable person at risk of chilling (or overheating) but in finding a practical solution to the variability in thermal sensation responses to the indoor environment in this older population, many of whom are immobile. Personal thermal comfort approaches could include ‘smart’ garments and local climate ‘bubbles’. Our next step will be in tackling the best approaches to determine a range of approaches that are practical and feasible within the care home. What is clear, due to the COVID-19 pandemic, is that assessing residents by touch will now be excluded for any thermal comfort assessment for the near future.

5. Conclusions

What we have observed by undertaking this feasibility study, perhaps more useful to those involved in the care of older people than relying on a persons reported thermal sensation rating, is in being able to ‘see’ the physiological responses to the environment in which they live. It is recognised that in older age, cultural factors as well as decline in neurosensory function can have an impact on sensory perception such that these senses may be blunted. This further confounds the value of thermal comfort rating scales in older people. The quick, relatively inexpensive, technique of thermal imaging, allows an immediate assessment of ‘live’ efferent thermoregulatory activity without the need for absolute measurements per se, so providing a new aspect of multi-dimensional thermal assessment. Thus, from the physiological ‘first responders’ of thermoregulation: skin extremity temperature (and concomitant extremity skin perfusion), the technique of infrared thermography could, in the future, provide technology-driven approaches to thermal assessment. Thermographic mapping of extremities as a prodromal thermal signature of incipient chilling (or overheating) could offer a better biomarker of thermal satisfaction and temperature safety within the environment than an older person’s own temperature sensibility. The future for this challenging field of health care will be in designing solutions to promote personalised thermal comfort involving interdisciplinary collaborations across medical, engineering, design and the built environment.

Author Contributions

Conceptualization, C.C.; data curation, J.E., C.C. and K.K.; formal analysis, C.C. and K.K.; funding acquisition, Principal Investigator C.C.; investigation, C.C., J.E., S.F.-D., J.R.W. and A.A.; methodology, C.C., K.K. and A.A.; project administration, J.E.; visualization, C.C., S.H.; writing—original draft, C.C.; review & editing, K.K., S.H., S.F.-D., J.R.W. and A.A. All authors have read and agreed to the published version of the manuscript.

Funding

This study was funded with a grant from the Dunhill Medical Trust (R507/0716).

Acknowledgments

We would also like to express our sincere thanks to the Trustees of the Dunhill Medical Trust for funding the study. Their support has been invaluable to the delivery of this work. We also thank The Dowager Countess Eleanor Peel Trust for the purchase of an infrared thermal imaging detector. We also thank the managers and care staff of the many residences we visited. They generously gave of their time to assist and support the study. We acknowledge the support of the Clinical Research Networks, who provided assistance in screening participants, especially the significant contribution of Graham Spencer, Derbyshire CRN. Our thanks also go to our colleagues Lee Pearse and Andrew Pearse of Heeley City Farm, Sheffield for their support, advice and experience of dementia care in the community. Finally, our thanks go to the residents who participated in the study, without whom this study would not have been possible.

Conflicts of Interest

The funding body had no role in the design of the study, collection or analysis. The datasets generated and or analysed during the current study are not publicly available due to issue of intellectual property. Data can be available from the corresponding author on reasonable request.

Abbreviations

AMTAbbreviated Mental Test
ASHRAEAmerican Society of Heating, Refrigerating and Air-Conditioning Engineers
CITCold induced thermogenesis
Cloclothing insulation unit
CRNclinical research network
Icloverall insulation of assembly in Clo units (Clo)
FOVfield of view
LWIRlong wave infrared thermography
PMHpast medical history
RHrelative humidity
ROIregion of interest
SDstandard deviation
Taair temperature
Trrectal temperature
TDPdistal phalange skin temperature
TCAPcapitate bones skin temperature
TDHdistal humerus/ulnar skin temperature
Ttymptympanic membrane temperature
TVthermal vote
Δdelta
ΔTtemperature difference
UKUnited Kingdom of Great Britain and Northern Ireland
TCthermal comfort
TSthermal sensation

References

  1. Garre-Olmo, J.; Lopez-Pousa, S.; Turon-Estrada, A.; Juvinya, D.; Ballester, D.; Vilalta-Franch, J. Environmental determinants of quality of life in nursing home residents with severe dementia. J. Am. Geriatr. Soc. 2012, 60, 1230–1236. [Google Scholar] [CrossRef] [PubMed]
  2. Bills, R.; Soebarto, V.; Williamson, T. Thermal experiences of older people during hot conditions in Adelaide. In Fifty Years Later: Revisiting the Role of Architectural Science in Design and Practice: 50th International Conference of the Architectural Science Association, Adelaide, Australia, 6–9 December 2016; School of Architecture and Built Environment, The University of Adelaide: Adelaide, Australia, 2016; pp. 657–664. [Google Scholar]
  3. Van Hoof, J.H.B.; Hansen, A.; Kazak, J.K.; Soebarto, V. The living environment and thermal behaviours of older south Australians. Int. J. Environ. Public Health Res. 2019, 16, 935. [Google Scholar] [CrossRef] [PubMed] [Green Version]
  4. ASHRAE: Standard 55-2013. Thermal Environmental Conditions for Human Occupancy; The American Society of Heating, Refrigerating and Air-Conditioning Engineers: Atlanta, GA, USA, 2013. [Google Scholar]
  5. International Standards Organisation (ISO). Ergonomics of the Thermal Environment–Analytical Determination and Interpretation of Thermal Comfort Using Calculation of the PMV And PPD Indices and Local Thermal Comfort Criteria; ISO 7730; ISO Standardization: Geneva, Switzerland, 2015. [Google Scholar]
  6. Bedford, T. The Warmth Factor in Comfort at Work. In A Physiological Study of Heating and Ventilation; H.M.S.O.: London, UK, 1936. [Google Scholar]
  7. Parsons, K.C. Human response to thermal environments Principles and methods. In Evaluation of Human Work; Wilson, J.R., Corlett, E.N., Eds.; Taylor and Francis: London, UK, 1990. [Google Scholar]
  8. Childs, C.; Gwilt, A.; Sherriff, G.; Homer, C. Old and Cold: Challenges in the Design of Personalised Thermal Comfort at Home. In Proceedings of the 3rd European Conference on Design4Health, Sheffield, UK, 13–16 July 2015; ISBN 978-1-84387-385-3. [Google Scholar]
  9. Cleary, M.; Raeburn, T.; West, S.; Childs, C. The environmental temperature of the residential care home: Role in thermal comfort and mental health. Contemp. Nurse 2019, 55, 38–46. [Google Scholar] [CrossRef] [PubMed]
  10. Walker, G.; Brown, S.; Neven, L. Thermal comfort in care homes: Vulnerability, responsibility and ‘thermal care’. Build. Res. Inf. 2016, 44, 135–146. [Google Scholar] [CrossRef] [Green Version]
  11. Van Hoof, J.; Schellen, L.; Soebarto, V.; Wong, J.K.W.; Kazak, J.K. Ten questions concerning thermal comfort and ageing. Build. Environ. 2017, 120, 123–133. [Google Scholar] [CrossRef]
  12. Iommi, M.; Barbera, E. Thermal Comfort for older adults. An experimental study on the thermal requirements for older adults. In Proceedings of the CISBAT Conference, Lausanne, Switzerland, 9–11 September 2015; pp. 357–362. [Google Scholar]
  13. Schellen, L.; van Marken Lichtenbelt, W.; Loomans, M.G.L.C.; Frijns, A.; Toftum, J.; deWit, M. Thermal comfort physiological responses and performance of elderly during exposure to a moderate temperature drift. In Proceedings of the 9th International Conference and Exhibition on Healthy Buildings 2009 (HB09), Syracuse, NY, USA, 13–17 September 2009. [Google Scholar]
  14. Szekely, M.; Garai, J. Thermoregulation and age. In Handbook of Clinical Neurology; Thermoregulation: From basic Neuroscience to Clinical Neurology Part 1; Romanovsky, A., Ed.; Elsevier B.V.: Amsterdam, The Netherlands, 2018; Volume 156, pp. 715–725. [Google Scholar]
  15. Taylor, N.A.S.; Allsopp, N.K.; Parkes, D.G. Preferred Room Temperature of Young vs. Aged Males: The Influence of Thermal Sensation, Thermal Comfort, and Affect. J. Gerontol. Ser. A 1995, 50, M216–M221. [Google Scholar] [CrossRef]
  16. Blatteis, C.M. Age-dependent changes in temperature regulation—A mini review. Gerontology 2012, 58, 289–295. [Google Scholar] [CrossRef]
  17. Holowatz, L.A.; Thompson-Torgerson, C.; Kenney, W.L. Aging and the control of human skin blood flow. Front. Biosci. 2010, 15, 718–739. [Google Scholar] [CrossRef] [Green Version]
  18. Lloyd, E.L. Hypothermia and Cold Stress; Croom Helm: London, UK, 1986. [Google Scholar]
  19. Hodkinson, H.M. Evaluation of a mental test score for assessment of mental impairment in the elderly. Age Ageing 1972, 1, 233–238. [Google Scholar] [CrossRef]
  20. Rockwood, K.; Song, X.; MacKnight, C.; Bergman, H.; Hogan, D.B.; McDowell, I.; Mitnitski, A. A global clinical measure of fitness and frailty in elderly people. CMAJ 2005, 173, 489–495. [Google Scholar] [CrossRef] [Green Version]
  21. Parsons, K. The thermal properties of clothing. In Human Thermal Environments; CRC Press: London, UK, 2014. [Google Scholar]
  22. McIntyre, D.A. Thermal sensation. A comparison of rating scales and cross modality matching. Int. J. Biometeorol. 1976, 20, 295. [Google Scholar] [CrossRef] [PubMed]
  23. Pathak, K.; Calton, E.K.; Soares, M.J.; Zhao, Y.; James, A.P.; Keane, K.; Newsholme, P. Forearm to fingertip skin temperature gradients in the thermoneutral zone were significantly related to resting metabolic rate: Potential implications for nutrition research. Eur. J. Clin. Nutr. 2017, 71, 1074–1079. [Google Scholar] [CrossRef] [PubMed]
  24. Soebarto, V.; Zhang, H.; Schiavon, S. A thermal comfort environmental chamber study of older and younger people. Build. Environ. 2019, 155, 1–14. [Google Scholar] [CrossRef] [Green Version]
  25. Stephan, B.C.; Matthews, F.E.; Khaw, K.T.; Dufouil, C.; Brayne, C. Beyond mild cognitive impairment: Vascular cognitive impairment, no dementia (VCIND). Alzheimer’s Res. Ther. 2009, 1, 1–9. [Google Scholar] [CrossRef] [Green Version]
  26. Vos, S.J.; Verhey, F.; Frölich, L.; Kornhuber, J.; Wiltfang, J.; Maier, W.; Peters, O.; Rüther, E.; Nobili, F.; Morbelli, S.; et al. Prevalence and prognosis of Alzheimer’s disease at the mild cognitive impairment stage. Brain 2015, 138, 1327–1338. [Google Scholar] [CrossRef] [Green Version]
  27. Blennow, K.; Zetterberg, H. Biomarkers for Alzheimer’s disease: Current status and prospects for the future. J. Intern. Med. 2018, 284, 643–663. [Google Scholar] [CrossRef] [Green Version]
  28. Tartarini, F.; Cooper, P.; Fleming, R.; Batterham, M. Indoor air temperature and agitation of nursing home residents with dementia. Am. J. Alzheimer’s Dis. Dement. 2017, 32, 272–281. [Google Scholar] [CrossRef] [Green Version]
  29. Day, K.; Carreon, D.; Stump, C. The Therapeutic Design of Environments for People with Dementia: A Review of the Empirical Research. Gerontology 2000, 40, 397–416. [Google Scholar]
  30. Wang, Z.; He, Y.; Hou, J.; Jiang, L. Human skin temperature and thermal responses in asymmetrical cold radiation environments. Build. Environ. 2013, 67, 217–223. [Google Scholar] [CrossRef]
  31. Liu, W.; Lian, Z.; Deng, Q. Use of mean skin temperature in evaluation of individual thermal comfort for a person in a sleeping posture under steady thermal environment. Indoor Built Environ. 2014, 24, 489–499. [Google Scholar] [CrossRef]
  32. Sakoi, T.; Tsuzuki, K.; Kato, S.; Ooka, R.; Song, D.; Zhu, S. Thermal comfort, skin temperature distribution, and sensible heat loss distribution in the sitting posture in various asymmetric radiant fields. Build. Environ. 2007, 42, 3984–3999. [Google Scholar] [CrossRef]
  33. Wang, D.; Zhang, H.; Arens, E.; Huizenga, C. Observations of upper-extremity skin temperature corresponding overall-body thermal sensations and comfort. Build. Environ. 2007, 42, 3933–3943. [Google Scholar] [CrossRef] [Green Version]
  34. Wu, Z.; Li, N.; Cui, H.; Peng, J.; Chen, H.; Liu, P. Using Upper Extremity Skin Temperatures to Assess Thermal Comfort in Office Buildings in Changsha, China. Int. J. Environ. Res. Public Health 2017, 14, 1092. [Google Scholar]
  35. Horvath, S.; Radcliffe, C.E.; Hutt, B.K.; Spurr, G.B. Metabolic response of old people to a cold environment. J. Appl. Physiol. 1955, 8, 45–148. [Google Scholar] [CrossRef] [PubMed]
  36. Cavazzana, A.; Röhrborn, A.; Garthus-Niegel, S.; Larsson, M.; Hummel, T.; Croy, I. Sensory-specific impairment among older people. An investigation using both sensory thresholds and subjective measures across the five senses. PLoS ONE 2018, 13, e0202969. [Google Scholar] [CrossRef] [Green Version]
  37. Savage, M.V.; Brengelmann, G.L. Control of skin blood flow in the neutral zone of human body temperature regulation. J. Appl. Physiol. (1985) 1996, 80, 1249–1257. [Google Scholar] [CrossRef]
  38. Walløe, L. Arterio-venous anastomoses in the human skin and their role in temperature control. Temperature 2016, 3, 92–103. [Google Scholar] [CrossRef] [Green Version]
  39. Romanovsky, A.A. The thermoregulation system and how it works. Handb. Clin. Neurol. 2018, 156, 3–43. [Google Scholar]
  40. Wilson, T.E.; Zhang, R.; Levine, B.D.; Crandall, C.D. Dynamic autoregulation of cutaneous circulation: Differential control in glabrous versus nonglabrous skin. Heart Circ. Physiol. 2005, 289, H385–H391. [Google Scholar] [CrossRef] [Green Version]
  41. Cheung, S.S. Responses of the hands and feet to cold exposure. Temperature 2005, 2, 105–120. [Google Scholar] [CrossRef]
  42. Harazin, B.; Harazin-Lechowska, A.; Kalamarz, J. Effect of individual finger skin temperature on vibrotactile perception threshold. Int. J. Occup. Med. Environ. Health 2013, 26, 930–939. [Google Scholar] [CrossRef] [PubMed]
  43. Murray, A.K.; Herrick, A.L.; King, T.A. Laser Doppler imaging: A developing technique for application in the rheumatic diseases. Rheumatology 2004, 43, 1210–1218. [Google Scholar] [CrossRef] [PubMed] [Green Version]
  44. Wilkinson, J.D.; Leggett, S.A.; Marjanovic, E.J.; Moore, T.L.; Allen, J.; Anderson, M.E.; Britton, J.; Buch, M.H.; Del Galdo, F.; Denton, C.P.; et al. A Multicenter Study of the Validity and Reliability of Responses to Hand Cold Challenge as Measured by Laser Speckle Contrast Imaging and Thermography: Outcome Measures for Systemic Sclerosis-Related Raynaud’s Phenomenon. Arthritis Rheumatol. 2018, 70, 903–911. [Google Scholar] [CrossRef] [PubMed]
  45. Mathiassen, O.N.; Buus, N.H.; Olsen, H.W.; Larsen, M.L.; Mulvany, M.J.; Christensen, K.L. Forearm plethysmography in the assessment of vascular tone and resistance vasculature design: New methodological insights. Acta Physiol. 2006, 188, 91–101. [Google Scholar] [CrossRef]
  46. Charkoudian, N. Skin blood flow in adult human thermoregulation: How it works, when it does not, and why. Mayo Clin. Proc. 2003, 78, 603–612. [Google Scholar] [CrossRef] [Green Version]
  47. Fanger, P.O. Assessment of man’s thermal comfort in practice. Br. J. Ind. Med. 1973, 30, 313–324. [Google Scholar] [CrossRef] [Green Version]
  48. Shahzad, S.; Brennan, J.; Theodossopoulos, D.; Calautit, J.K.; Hughes, B. Does a neutral thermal sensation determine thermal comfort? Build. Serv. Eng. Res. Technol. 2018, 39, 183–195. [Google Scholar] [CrossRef]
  49. De Dear, R. Revisiting an old hypothesis of human thermal perception: Alliesthesia. Build. Res. Inf. 2011, 39, 108–117. [Google Scholar] [CrossRef]
  50. Florez-Duquet, M.; McDonald, R.B. Cold-induced thermogenesis and biological aging. Physiol. Rev. 1998, 78, 339–358. [Google Scholar] [CrossRef]
  51. White-Chu, E.F.; Graves, W.J.; Godfrey, S.M.; Bonner, A.; Sloane, P. Beyond the medical model: The culture change revolution in long-term care. J. Am. Med Dir. Assoc. 2009, 10, 370–378. [Google Scholar] [CrossRef]
Figure 1. Long wave infrared imaging detector mounted on a tripod. The figure shows the participant during imaging with hands positioned upon a paper ‘hand template’ overlying an insulated tile. The portable table was used throughout the study to ensure consistency of the imaging set-up.
Ijerph 17 06932 g001
Figure 2. (A): Thermal map of left and right hand positioned upon an insulated tile. The region of interest (ROI, non-dominant hand) displayed as a vertical line constructed centrally for ring (R), middle (M) and index (I) fingers. Selection of the finger with greatest variability was used to construct six ‘box’ ROIs from which mean ROI values were obtained (B) and with data from the selected finger used in subsequent analyses. (B) shows anatomical ROI positions for temperature (°C) of distal phalange (TDP), middle phalange (TTmp), proximal phalange (TPP), metacarpal (TMeta), capitate bones (TCap) and distal humerus (TDH).
Ijerph 17 06932 g002
Figure 3. Mean skin temperature at each of three ROI regions represented by finger-tip (distal phalange, TDP), capitate bones (TCap) and forearm at distal humerus/ulner (TDH) of residents with dementia/AMT < 8 (D) (open circles, O) and residents without a confirmed diagnosis of dementia/AMT ≥ 8 (ND) (open square □). * Significant difference between mean temperature for TDP of residents D vs. ND group (p = 0.01). Horizonal bars represent mean values.
Ijerph 17 06932 g003
Figure 4. Distribution of air temperature (°C) within care homes by group: dementia or an AMT < 8 (yes/no) showing median, lower and upper quartiles, and lower and upper extremes of air temperature. Outlier: participant studied at lowest Ta, 21.4 °C.
Ijerph 17 06932 g004
Figure 5. Upper panel: extremity temperature difference between fingertip to wrist ∆T1 (mean TDP- mean TCap) and lower panel: fingertip to forearm, ∆T2 (mean TDP − TDH) by group and TS ratings; dementia (O); no dementia (ND).
Ijerph 17 06932 g005
Figure 6. Mean extremity temperature values at three ROIs; distal phalange TDP (upper panel); capitate bones, TCap (middle); distal humerus, TDH (lower) by group and TS rating. dementia (O), no□ dementia (□) for each reported thermal sensation rating.
Ijerph 17 06932 g006
Figure 7. Thermal maps of hand and forearm of 13 residents with the visual appearance of ‘cold’ hands. Figure shows the study group; dementia (D) or no dementia (ND), thermal sensation (TS) rating and the individual temperature difference (°C) for ∆T1 and for ∆T2.
Ijerph 17 06932 g007
Figure 8. Thermal maps of hand and forearm of 10 residents with the visual appearance of ‘warm’ hands. Figure shows the study group; dementia (D) or no dementia (ND), thermal sensation (TS) rating and temperature difference (°C) for ∆T1 and for ∆T2.
Ijerph 17 06932 g008
Table 1. Characteristic of care home residents, clothing ensemble, ambient conditions and core and skin temperature values (°C) with temperature difference (ΔT). Table shows descriptive analysis that focused on associations between key variables.
Categorical FactorDementia Diagnosis/AMT < 8
Group D n = (%)
AMT 8–10
Group ND n = (%)
p Value
Male10 (45.5)12 (54.5)0.43
Female24 (51.5)23 (48.9)
Age: years
60–702 (33.3)4 (66.7)0.25
71–809 (69.2)4 (30.8)
81–9016 (51.6)15 (48.4)
Over 907 (36.8)12 (63.2)
Ethnicity
White British33 (50)33 (50)0.22
White European02 (100)
White1 (100)0
Frailty Score
Well01(100)0.028
Managing Well6 (75)2 (25)
Vulnerable1 (10)9 (90)
Mildly Frail1 (50)1 (50)
Moderately Frail9 (40.9)13 (59.1)
Severely Frail17 (65.4)9 (34.6)
Dominant Hand
Right 31 (49.2)32 (50.8)0.4
Left3 (60)2 (40)
Ambidextrous01 (100)
Finger with greatest SD
Left ring11 (68.8)5 (31.2)0.34
Left middle5 (38.5)8 (61.5)
Left index14 (43.8)18 (56.2)
Right ring1 (100 0
Right middle01 (100)
Right index2 (40)3 (60)
Clothing ensemble (Clo unit)
Light6 (30)14 (70)
Medium26 (55.3)21 (44.7)0.05
Heavy2 (100)0
Thermal sensation rating
−21 (100)00.02
−110 (76.9)3 (23.1)
021 (48.8)22 (51.2)
107 (100)
1.51 (100)0
21 (33.3)2 (66.7)
Thermal Vote
Cooler1 (16)5 (84)0.09
No change27 (49.1)28 (50.9)
Warmer6 (75)2 (25)
Temperaturen = (%)Mean (SD)n = (%)Mean (SD)
Air temperature (°C)34 (49.3)23.1 (0.2)35 (50.7)24.1 (0.17)0.001
Relative Humidity (%RH)34 (49.3)49 (1.1)35 (50.7)52.1 (1.6)0.2
ROI: mean DP (°C)33 (48.5)30.0 (0.46)35 (51.5)31.6 (0.4)0.01
ROI: mean Cap (°C)33 (48.5)31.7 (0.25)35 (51.5)32.0 (0.25)0.4
ROI: mean DH (°C)33 (48.5)31.9 (0.19)35 (51.5)32.0 (0.24)0.1
ΔT1 (mean DP- mean CAP) °C33 (48.5)−1.7 (0.29)35 (51.5)−0.43 (0.24)0.001
ΔT2 (mean DP-mean DH) °C33 (48.5) −1.8 (0.34)35 (51.5)−0.39 (0.26)0.001
Tympanic temperature (°C)34 (50)36.6 (0.07)34 (50)36.8 (0.6)0.01
ROI—region of interest; DP—distal phalange; CAP—capitate bones; DH—distal humerus.
Table 2. Individual thermal sensation ratings reported by residents sharing the same environmental conditions at each imaging session in groups of two to five. Study undertaken over a period of 12 calendar months at 15 residential care sites. Residents with dementia who participated in the imaging sessions are identified by highlighted and emboldened text. Four residential care sites (6,9,11,12) were visited twice.
Site IDMonth/Day of StudyMean Ta (°C)Mean RH %Thermal Sensation Rating
Resident 1Resident 2Resident 3Resident 4Resident 5
17 June24.3600missing0
213 July24.047000−1
312 July24.3560111
428 July22.55400
56 September24.660000
628 September25.8520110
66 October23.6380−100
712 October23.15720
820 October24.2600100
97 November22.053−1−1
98 December24.03210
1011 April22.05501.5
1117 April24.548−100
1124 April21.84400−1
1211 May25.337−10
1316 May22.6450000
1418 May 24.246000
1221 May22.750−100−1−1
1112 June22.053−100
1514 June 23.6540−2−102
1119 June22.1540−10
619 June24.05802
RH—relative humidity, emboldened text within highlighted cells indicates the residents with a confirmed diagnosis of dementia or Abbreviated Mental Test (AMT) < 8.

