Municipal Residence Level of Long-Term PM10 Exposure Associated with Obesity among Young Adults in Seoul, Korea


Abstract
:1. Introduction
2. Materials and Methods
2.1. Study Subjects and Variables
2.2. Statistical Analysis
2.3. Ethics
3. Results
3.1. Descriptive Statistics among Study Subjects
3.2. Associations between Obesity and Individual Factors
3.3. Associations between Obesity and Municipal Long-Term PM10 Level
4. Discussion
4.1. Principal Findings
4.2. Associations between Obesity and Individual Factors
4.3. Associations between Obesity and Environmental Factors
4.4. Study Limitations
5. Conclusions
Supplementary Materials
Author Contributions
Funding
Conflicts of Interest
References
- WHO. World Health Organization Fact Sheet for Obesity and Overweight. 2020. Available online: https://www.who.int/news-room/fact-sheets/detail/obesity-and-overweight (accessed on 25 July 2020).
- Claudino, A.M.; Pike, K.M.; Hay, P.; Keeley, J.W.; Evans, S.C.; Rebello, T.J.; Bryant-Waugh, R.; Dai, Y.; Zhao, M.; Matsumoto, C.; et al. The classification of feeding and eating disorders in the ICD-11: Results of a field study comparing proposed ICD-11 guidelines with existing ICD-10 guidelines. BMC Med. 2019, 17, 93. [Google Scholar] [CrossRef] [PubMed]
- Covington, M. Why Is Obesity a Disease? 2017. Available online: https://obesitymedicine.org/why-is-obesity-a-disease/ (accessed on 27 July 2020).
- Qin, X.D.; Qian, Z.; Vaughn, M.G.; Trevathan, E.; Emo, B.; Paul, G.; Ren, W.H.; Hao, Y.T.; Dong, G.H. Gender-specific differences of interaction between obesity and air pollution on stroke and cardiovascular diseases in Chinese adults from a high pollution range area: A large population based cross sectional study. Sci. Total Environ. 2015, 529, 243–248. [Google Scholar] [CrossRef]
- Jeong, S.M.; Park, J.H.; Kim, H.J.; Kwon, H.; Hwang, S.E. Effects of abdominal obesity on the association between air pollution and kidney function. Int. J. Obes. 2020, 44, 1568–1576. [Google Scholar] [CrossRef] [PubMed]
- Weichenthal, S.; Hoppin, J.A.; Reeves, F. Obesity and the cardiovascular health effects of fine particulate air pollution. Obesity 2014, 22, 1580–1589. [Google Scholar] [CrossRef] [PubMed] [Green Version]
- McConnell, R.; Gilliland, F.; Goran, M.; Allayee, H.; Hricko, A.; Mittelman, S. Does near-roadway air pollution contribute to childhood obesity? Pediatr. Obes. 2016, 11, 1–3. [Google Scholar] [CrossRef] [Green Version]
- Xing, X.; Hu, L.; Guo, Y.; Bloom, M.S.; Li, S.; Chen, G.; Yim, S.H.; Gurram, N.; Yang, M.; Xiao, X.; et al. Interactions between ambient air pollution and obesity on lung function in children: The Seven Northeastern Chinese Cities (SNEC) Study. Sci. Total Environ. 2020, 699, 134397. [Google Scholar] [CrossRef]
- Hwang, S.E.; Kwon, H.; Jeong, S.M.; Kim, H.J.; Park, J.H. Ambient air pollution exposure and obesity-related traits in Korean adults. Diabetes Metab Syndr. Obes. 2019, 12, 1365–1377. [Google Scholar] [CrossRef] [Green Version]
- Chen, Z.; Newgard, C.B.; Kim, J.S.; IIkayeva, O.; Alderete, T.L.; Thomas, D.C.; Berhane, K.; Breton, C.; Chatzi, L.; Bastain, T.M. Near-roadway air pollution exposure and altered fatty acid oxidation among adolescents and young adults—The interplay with obesity. Environ. Int. 2019, 130, 104935. [Google Scholar] [CrossRef]
- Liu, X.; Tu, R.; Qiao, D.; Niu, M.; Li, R.; Mao, Z.; Huo, W.; Chen, G.; Xiang, H.; Guo, Y.; et al. Association between long-term exposure to ambient air pollution and obesity in a Chinese rural population: The Henan Rural Cohort Study. Environ. Pollut. 2020, 260, 114077. [Google Scholar] [CrossRef]
- Martin, A.R.; Nieto, J.M.; Ruiz, J.P.; Jiménez, L.E. Overweight and obesity: The role of education, employment and income in Spanish adults. Appetite 2008, 51, 266–272. [Google Scholar] [CrossRef]
- Ogden, C.L.; Fakhouri, T.H.; Carroll, M.D.; Hales, C.M.; Fryar, C.D.; Li, X.; Freedman, D.S. Prevalence of Obesity Among Adults, by Household Income and Education–United States, 2011–2014. MMWR Morb. Mortal. Wkly. Rep. 2017, 66, 1369–1373. [Google Scholar] [CrossRef]
- Babey, S.H.; Hastert, T.A.; Wolstein, J.; Diamant, A.L. Income disparities in obesity trends among California adolescents. Am. J. Public Health 2010, 100, 2149–2155. [Google Scholar] [CrossRef] [PubMed]
- Monteiro, C.A.; Conde, W.L.; Popkin, B.M. Income-specific trends in obesity in Brazil: 1975–2003. Am. J. Public Health 2007, 97, 1808–1812. [Google Scholar] [CrossRef] [PubMed]
- Kim, T.J.; Knesebeck, O.V. Income and obesity: What is the direction of the relationship? A systematic review and meta-analysis. BMJ Open 2018, 8, e019862. [Google Scholar] [PubMed]
- Lindsay, A.C.; Greaney, M.L.; Wallington, S.F.; Wright, J.A.; Hunt, A.T. Depressive Symptoms and Length of U.S. Residency Are Associated with Obesity among Low-Income Latina Mothers: A Cross-Sectional Analysis. Int. J. Environ. Res. Public Health 2017, 14, 869. [Google Scholar] [CrossRef] [Green Version]
- Chen, Y.; Rennie, D.C.; Karunanayake, C.P.; Janzen, B.; Hagel, L.; Pickett, W.; Dyck, R.; Lawson, J.; Dosman, J.A.; Pahwa, P.; et al. Income adequacy and education associated with the prevalence of obesity in rural Saskatchewan, Canada. BMC Public Health 2015, 15, 700. [Google Scholar] [CrossRef] [Green Version]
- An, R.; Ji, M.; Yan, H.; Guan, C. Impact of ambient air pollution on obesity: A systematic review. Int. J. Obes. 2018, 42, 1112–1126. [Google Scholar] [CrossRef]
- Fioravanti, S.; Cesaroni, G.; Badaloni, C.; Michelozzi, P.; Forastiere, F.; Porta, D. Traffic-related air pollution and childhood obesity in an Italian birth cohort. Environ. Res. 2018, 160, 479–486. [Google Scholar] [CrossRef]
- Vrijheid, M.; Fossati, S.; Maitre, L.; Márquez, S.; Roumeliotaki, T.; Agier, L.; Andrusaityte, S.; Cadiou, S.; Casas, M.; de Castro, M.; et al. Early-Life Environmental Exposures and Childhood Obesity: An Exposome-Wide Approach. Environ. Health Perspect. 2020, 128, 067009. [Google Scholar] [CrossRef]
- McConnell, R.; Shen, E.; Gilliland, F.D.; Jerrett, M.; Wolch, J.; Chang, C.C.; Lurmann, F.; Berhane, K. A longitudinal cohort study of body mass index and childhood exposure to secondhand tobacco smoke and air pollution: The Southern California Children’s Health Study. Environ. Health Perspect. 2015, 123, 360–366. [Google Scholar] [CrossRef] [Green Version]
- World Health Organization. Obesity: Preventing and Managing the Global Epidemic. 2000. World Health Organization. Available online: https://www.who.int/nutrition/publications/obesity/WHO_TRS_894/en/ (accessed on 25 July 2020).
- Deurenberg, P.; Deurenberg-Yap, M.; Guricci, S. Asians are different from Caucasians and from each other in their body mass index/body fat per cent relationship. Obes. Rev. 2002, 3, 141–146. [Google Scholar] [CrossRef] [PubMed] [Green Version]
- World Health Organization, Regional Office for the Western Pacific. The Asia-Pacific Perspective: Redefining Obesity and its Treatment; Health Communications Australia: Sydney, Australia, 2000. [Google Scholar]
- Seo, M.H.; Lee, W.Y.; Kim, S.S.; Kang, J.H.; Kang, J.H.; Kim, K.K.; Kim, B.Y.; Kim, Y.H.; Kim, W.J.; Kim, E.M.; et al. 2018 Korean Society for the Study of Obesity Guideline for the Management of Obesity in Korea. J. Obes. Metab. Syndr. 2019, 28, 40–45. [Google Scholar] [CrossRef] [PubMed]
- Miller, K.A.; Siscovick, D.S.; Sheppard, L.; Shepherd, K.; Sullivan, J.H.; Anderson, G.L.; Kaufman, J.D. Long-term exposure to air pollution and incidence of cardiovascular events in women. N. Engl. J. Med. 2007, 356, 447–458. [Google Scholar] [CrossRef] [PubMed]
- Anic, G.M.; Titus-Ernstoff, L.; Newcomb, P.A.; Trentham-Dietz, A.; Egan, K.M. Sleep duration and obesity in a population-based study. Sleep Med. 2010, 11, 447–451. [Google Scholar] [CrossRef] [Green Version]
- Hasler, G.; Buysse, D.J.; Klaghofer, R.; Gamma, A.; Ajdacic, V.; Eich, D.; Rössler, W.; Angst, J. The association between short sleep duration and obesity in young adults: A 13-year prospective study. Sleep 2004, 27, 661–666. [Google Scholar] [CrossRef]
- Zimlichman, E.; Kochba, I.; Mimouni, F.B.; Shochat, T.; Grotto, I.; Kreiss, Y.; Mandel, D. Smoking habits and obesity in young adults. Addiction 2005, 100, 1021–1025. [Google Scholar] [CrossRef]
- Dare, S.; Mackay, D.F.; Pell, J.P. Relationship between Smoking and Obesity: A Cross-Sectional Study of 499,504 Middle-Aged Adults in the UK General Population. PLoS ONE 2015, 10, e0123579. [Google Scholar] [CrossRef]
- Puett, R.C.; Hart, J.E.; Yanosky, J.D.; Paciorek, C.; Schwartz, J.; Suh, H.; Speizer, F.E.; Laden, F. Chronic fine and coarse particulate exposure, mortality, and coronary heart disease in the Nurses’ Health Study. Environ. Health Perspect. 2009, 117, 1697–1701. [Google Scholar] [CrossRef] [Green Version]
- Weichenthal, S.; Villeneuve, P.J.; Burnett, R.T.; van Donkelaar, A.; Martin, R.V.; Jones, R.R.; DellaValle, C.T.; Sandler, D.P.; Ward, M.H.; Hoppin, J.A.; et al. Long-term exposure to fine particulate matter: Association with nonaccidental and cardiovascular mortality in the agricultural health study cohort. Environ. Health Perspect. 2014, 122, 609–615. [Google Scholar] [CrossRef] [Green Version]
- Jerrett, M.; McConnell, R.; Wolch, J.; Chang, R.; Lam, C.; Dunton, G.; Gilliland, F.; Lurmann, F.; Islam, T.; Berhane, K. Traffic-related air pollution and obesity formation in children: A longitudinal, multilevel analysis. Environ. Health 2014, 13, 49. [Google Scholar] [CrossRef] [Green Version]
- de Bont, J.; Casas, M.; Barrera-Gómez, J.; Cirach, M.; Rivas, I.; Valvi, D.; Álvarez, M.; Dadvand, P.; Sunyer, J.; Vrijheid, M. Ambient air pollution and overweight and obesity in school-aged children in Barcelona, Spain. Environ. Int. 2019, 125, 58–64. [Google Scholar] [PubMed]
- Dahlgren, G.; Margaret, W. Policies and Strategies to Promote Social Equity in Health. Background Document to WHO-Strategy Paper for Europe; Institute for Futures Studies: Stockholm, Sweden, 1991. [Google Scholar]
- Jang, S.; Oh, J.; Kim, S. The Main Factors of Residential Mobility and Household characteristics in Metropolitan Area—Focused on Seoul and Gyeong-in Area. J. Archit. Inst. Korea Plan. Des. 2020, 36, 125–135. [Google Scholar]
- Lee, J.-S.; Won, J.A. Investigation into the Attributes and Causes of Residential Mobility in the Seoul Metropolitan Region: Household Mobility between 2001 and 2010. J. Korea Plan. Assoc. 2017, 52, 27–45. [Google Scholar]
- Maitre, L.; De Bont, J.; Casas, M.; Robinson, O.; Aasvang, G.M.; Agier, L.; Andrušaitytė, S.; Ballester, F.; Basagaña, X.; Borràs, E. Human Early Life Exposome (HELIX) study: A European population-based exposome cohort. BMJ Open 2018, 8, e021311. [Google Scholar]
- Bellinger, D.C.; Matthews-Bellinger, J.A.; Kordas, K. A developmental perspective on early-life exposure to neurotoxicants. Environ. Int. 2016, 94, 103–112. [Google Scholar]
- Wei, Y.; Zhang, J.; Li, Z.; Gow, A.; Chung, K.F.; Hu, M.; Sun, Z.; Zeng, L.; Zhu, T.; Jia, G.; et al. Chronic exposure to air pollution particles increases the risk of obesity and metabolic syndrome: Findings from a natural experiment in Beijing. FASEB J. 2016, 30, 2115–2122. [Google Scholar]
- Alemayehu, Y.A.; Asfaw, S.L.; Terfie, T.A. Exposure to urban particulate matter and its association with human health risks. Environ. Sci. Pollut. Res. Int. 2020, 27, 27491–27506. [Google Scholar]
- Villeneuve, P.J.; Jerrett, M.; Su, J.G.; Weichenthal, S.; Sandler, D.P. Association of residential greenness with obesity and physical activity in a US cohort of women. Environ. Res. 2018, 160, 372–384. [Google Scholar]
- Huang, W.Z.; Yang, B.Y.; Yu, H.Y.; Bloom, M.S.; Markevych, I.; Heinrich, J.; Knibbs, L.D.; Leskinen, A.; Dharmage, S.C.; Jalaludin, B.; et al. Association between community greenness and obesity in urban-dwelling Chinese adults. Sci. Total Environ. 2020, 702, 135040. [Google Scholar]
- King, A.C.; Sallis, J.F.; Frank, L.D.; Saelens, B.E.; Cain, K.; Conway, T.L.; Chapman, J.E.; Ahn, D.K.; Kerr, J. Aging in neighborhoods differing in walkability and income: Associations with physical activity and obesity in older adults. Soc. Sci. Med. 2011, 73, 1525–1533. [Google Scholar]
- James, P.; Kioumourtzoglou, M.A.; Hart, J.E.; Banay, R.F.; Kloog, I.; Laden, F. Interrelationships Between Walkability, Air Pollution, Greenness, and Body Mass Index. Epidemiology 2017, 28, 780–788. [Google Scholar] [CrossRef]
- Towne, S.D., Jr.; Lopez, M.L.; Li, Y.; Smith, M.L.; Warren, J.L.; Evans, A.E.; Ory, M.G. Examining the Role of Income Inequality and Neighborhood Walkability on Obesity and Physical Activity among Low-Income Hispanic Adults. J. Immigr. Minor Health 2018, 20, 854–864. [Google Scholar] [CrossRef]
- Hu, J.; Fan, H.; Li, Y.; Li, H.; Tang, M.; Wen, J.; Huang, C.; Wang, C.; Gao, Y.; Kan, H.; et al. Fine particulate matter constituents and heart rate variability: A panel study in Shanghai, China. Sci. Total Environ. 2020, 747, 141199. [Google Scholar] [CrossRef]
- Harbo Poulsen, A.; Hvidtfeldt, U.A.; Sørensen, M.; Puett, R.; Ketzel, M.; Brandt, J.; Christensen, J.H.; Geels, C.; Raaschou-Nielsen, O. Components of particulate matter air-pollution and brain tumors. Environ. Int. 2020, 144, 106046. [Google Scholar] [CrossRef]
- Lavigne, A.; Freni-Sterrantino, A.; Fecht, D.; Liverani, S.; Blangiardo, M.; de Hoogh, K.; Molitor, J.; Hansell, A.L. A spatial joint analysis of metal constituents of ambient particulate matter and mortality in England. Environ. Epidemiol. 2020, 4, e098. [Google Scholar] [CrossRef]
- Yin, B.; Chan, C.K.; Liu, S.; Hong, H.; Wong, S.H.; Lee, L.K.; Ho, L.W.; Zhang, L.; Leung, K.C.; Choi, P.C.; et al. Intrapulmonary Cellular-Level Distribution of Inhaled Nanoparticles with Defined Functional Groups and Its Correlations with Protein Corona and Inflammatory Response. ACS Nano 2019, 13, 14048–14069. [Google Scholar] [CrossRef]


| Variable | Category | Proportion/ Prevalence, n (%) | ||
|---|---|---|---|---|
| Overall | Obese 1 | Chi-Squared (p-Value) | ||
| Total | 3655 (100.0) | 845 (23.1) | ||
| Sex | Men | 1680 (46.0) | 620 (36.9) | 184.64 (<0.0001) |
| Women | 1975 (54.0) | 225 (11.4) | ||
| Age group | 19–24 | 1933 (52.9) | 416 (21.5) | 0.20 (0.6547) |
| 25–29 | 1722 (47.1) | 429 (24.9) | ||
| Education | Master’s course | 192 (5.3) | 43 (22.4) | 761.44 (<0.0001) |
| University | 2929 (80.1) | 655 (22.4) | ||
| High school or less | 532 (14.6) | 147 (27.6) | ||
| Missing | 2 (0.1) | 0 (0.0) | ||
| Labor market participation | Active | 2199 (60.2) | 505 (23.0) | 32.22 (<0.0001) |
| Inactive | 1455 (39.8) | 340 (23.4) | ||
| Unknown | 1 (0.0) | 0 (0.0) | ||
| Average sleep hours (hours per day) | 6- | 540 (14.8) | 141 (26.1) | 150.82 (<0.0001) |
| 6–7 | 1140 (31.2) | 272 (23.9) | ||
| 7+ | 1975 (54.0) | 432 (21.9) | ||
| Moderate or vigorous physical activity rate | Yes | 927 (25.4) | 257 (27.7) | 129.02 (<0.0001) |
| No | 2723 (74.5) | 587 (21.6) | ||
| Smoking | Never | 2802 (76.7) | 547 (19.5) | 421.50 (<0.0001) |
| Former | 188 (5.1) | 68 (36.2) | ||
| Current | 665 (18.2) | 230 (34.6) | ||
| Drinking | Never | 237 (6.5) | 44 (18.6) | 1254.58 (<0.0001) |
| Former | 158 (4.3) | 34 (21.5) | ||
| Current | 3260 (89.2) | 767 (23.5) | ||
| Residence period (years) in a current community (RP) | RP < 5 | 1120 (30.6) | 237 (21.2) | 252.67 (<0.0001) |
| 5 ≤ RP < 10 | 377 (10.3) | 87 (23.1) | ||
| 10 ≤ RP < 15 | 402 (11.0) | 97 (24.1) | ||
| 15 ≤ RP < 20 | 434 (11.9) | 106 (24.4) | ||
| 20 ≤ RP | 1322 (36.2) | 318 (24.1) | ||
| Variable | Category | Odds Ratio (95% Confidence Interval) 1 |
|---|---|---|
| Sex | Men | 1.00 |
| Women | 0.493 (0.450–0.541) | |
| Age | 19–24 | 1.00 |
| 25–29 | 1.076 (0.987–1.172) | |
| Education level | Master’s course | 1.00 |
| University | 0.937 (0.806–1.090) | |
| High school or less | 1.073 (0.899–1.281) | |
| Labor market participation | Active | 1.00 |
| Inactive | 0.998 (0.914–1.089) | |
| Average sleep hours (hours per day) | 6- | 1.00 |
| 6–7 | 0.948 (0.837–1.073) | |
| 7+ | 0.880 (0.787–0.983) | |
| Moderate or vigorous physical activity rate | Yes | 1.00 |
| No | 0.960 (0.880–1.047) | |
| Smoking | Never | 1.00 |
| Former | 1.245 (0.997–1.555) | |
| Current | 0.926 (0.793–1.081) | |
| Drinking | Never | 1.00 |
| Former | 1.187 (0.888–1.588) | |
| Current | 1.000 (0.825–1.211) | |
| Residence period in a current community (RP) | RP < 5 | 1.00 |
| 5 ≤ RP < 10 | 1.096 (0.850–1.414) | |
| 10 ≤ RP < 15 | 0.961 (0.769–1.201) | |
| 15 ≤ RP < 20 | 1.127 (0.902–1.408) | |
| 20 ≤ RP | 0.982 (0.848–1.136) |
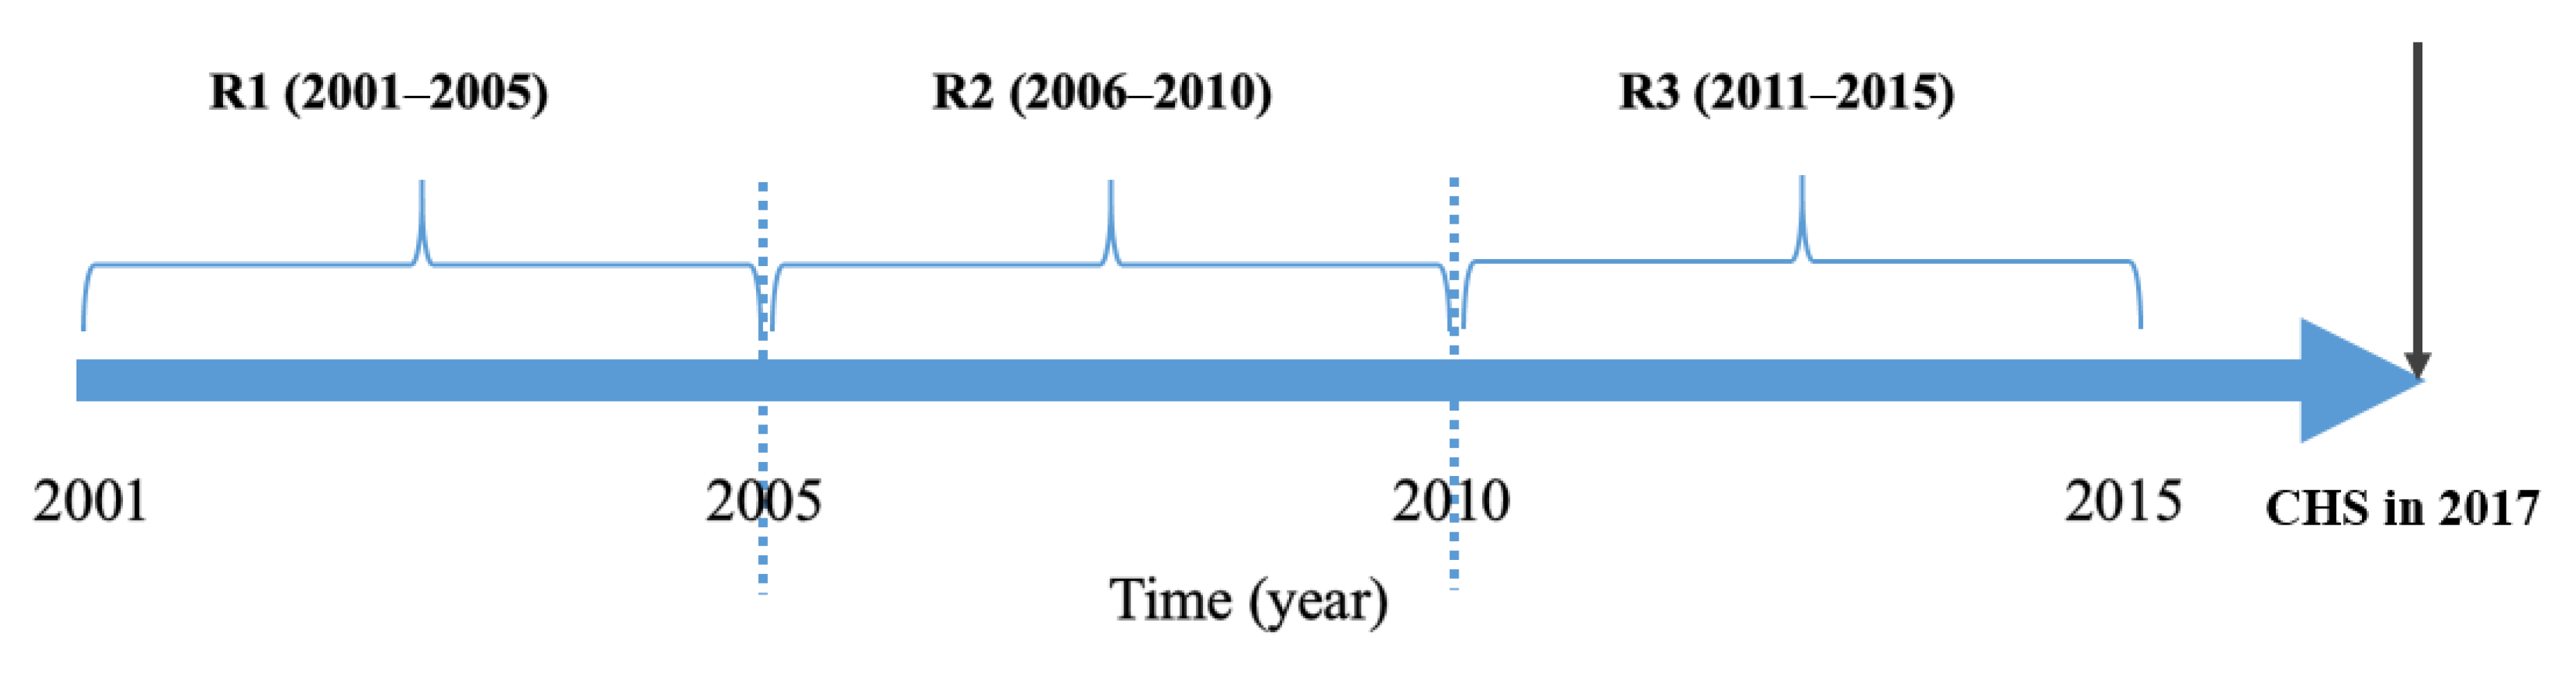
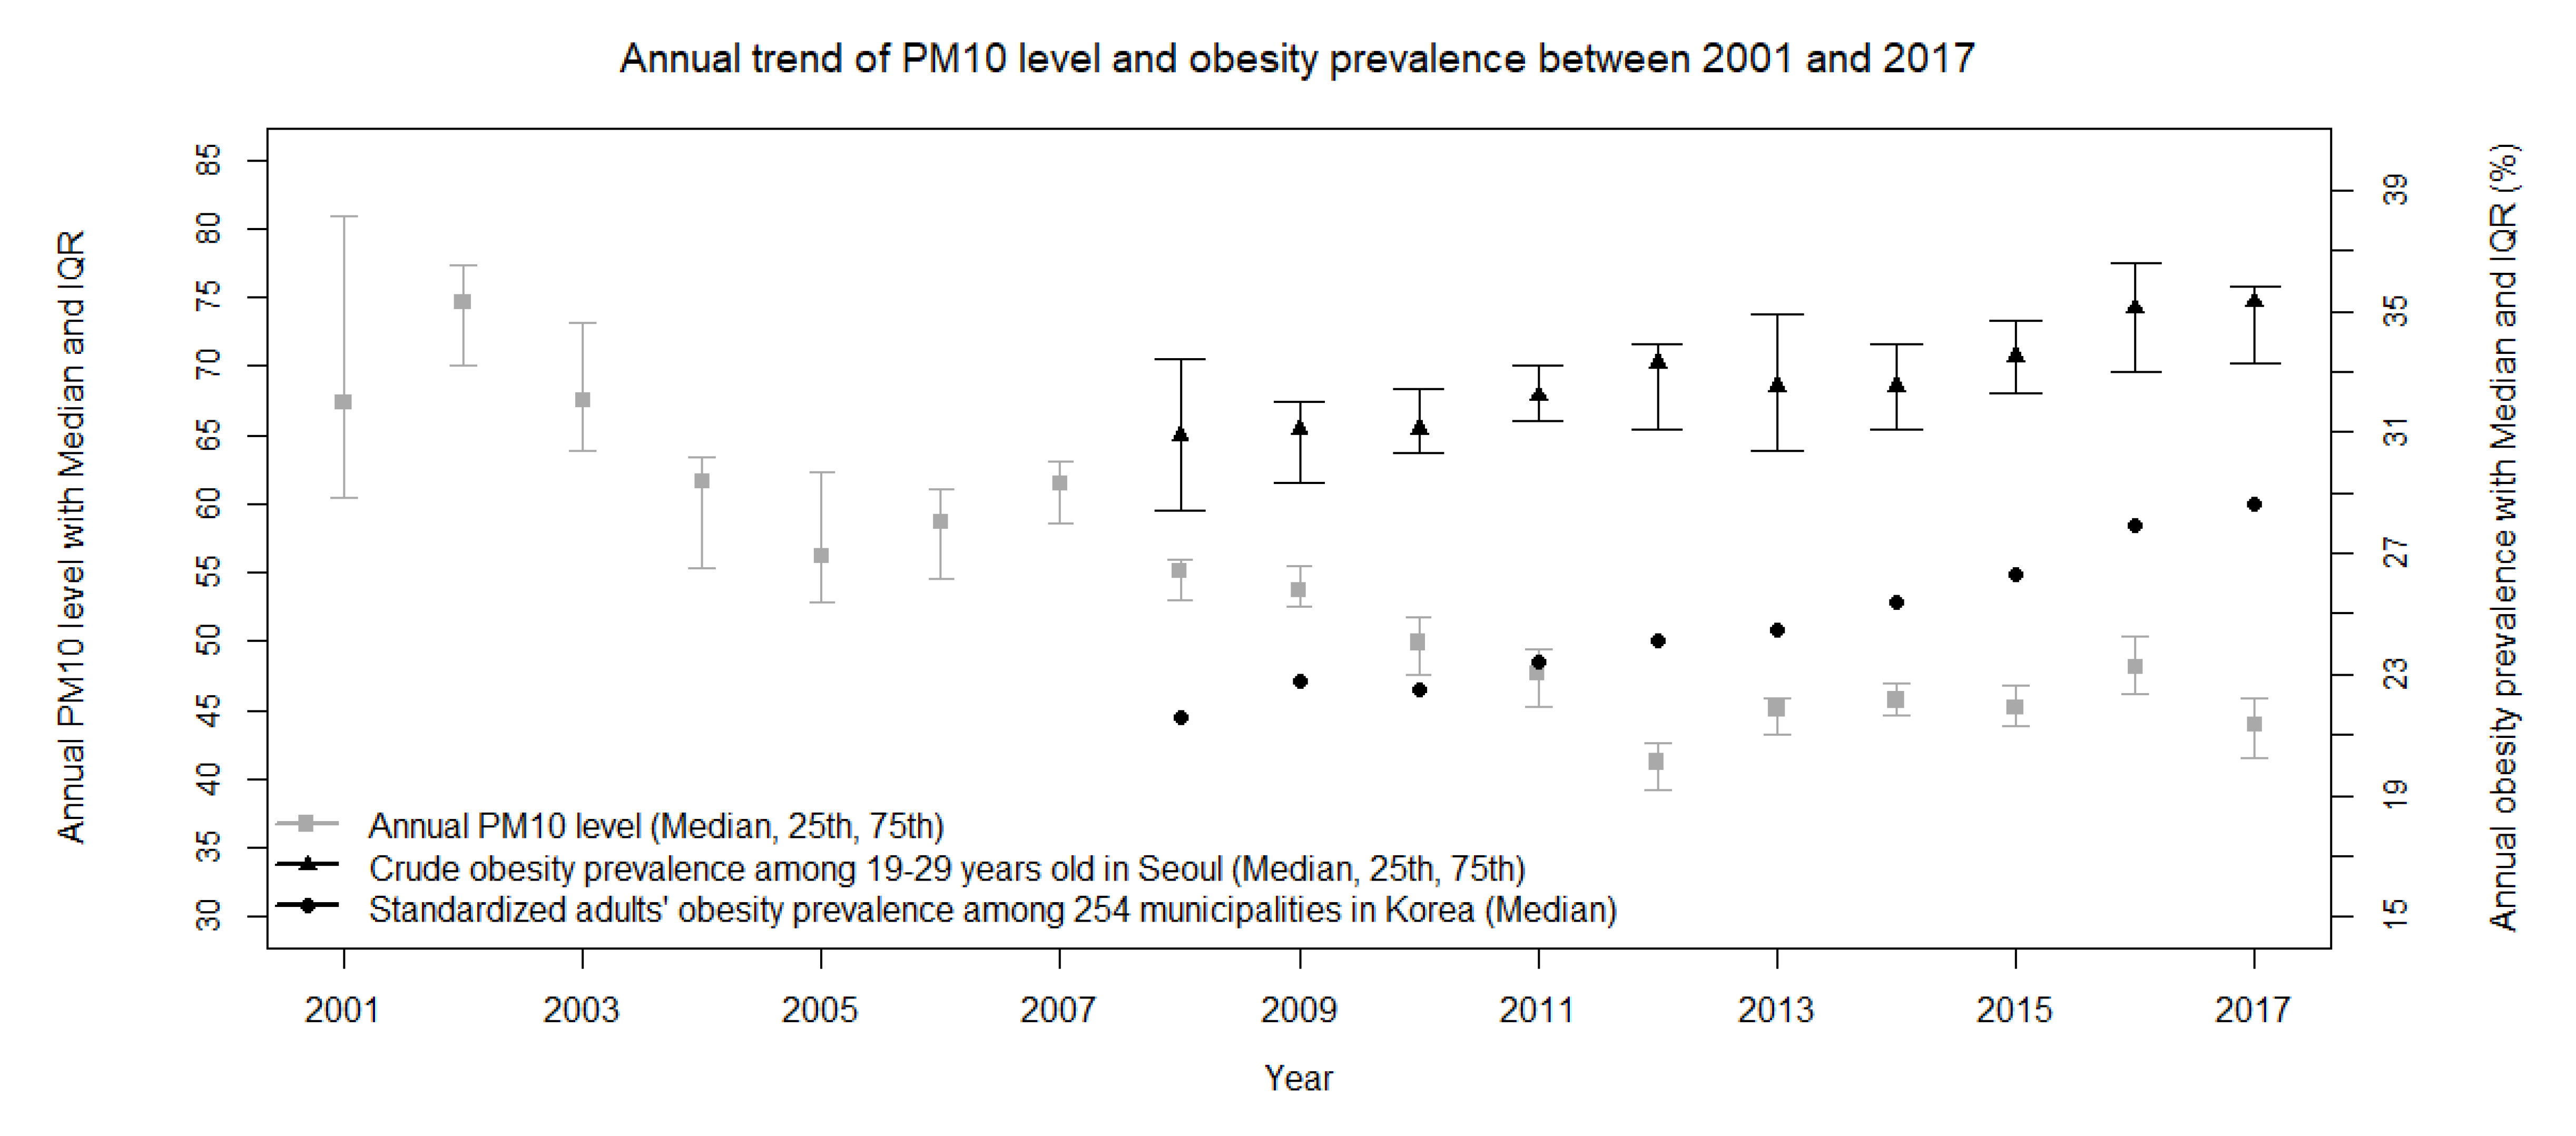
| Period of PM10 Level 1 | Study Population | PM10 Level Median Cutoff | Study Population Residence Period (Year) | Odds Ratio (95% Confidence Interval) 2 | |||
|---|---|---|---|---|---|---|---|
| Overall, n | Obese, n (%) | Age 19–29 | Aged 19–24 | Aged 25–29 | |||
| 5 years (2001–2005) | 2158 | 521 (24.1) | 68.7 | 10 years≤ | 1.071 (0.969–1.185) | 0.986 (0.881–1.104) | 1.208 (1.054–1.383) |
| 1756 | 424 (24.2) | 15 years≤ | 1.120 (1.006–1.247) | 1.059 (0.932–1.204) | 1.213 (1.062–1.385) | ||
| 1322 | 318 (24.1) | 20 years≤ | 1.158 (1.034–1.297) | 1.229 (1.081–1.397) | 1.112 (0.971–1.273) | ||
| 5 years (2006–2010) | 2158 | 521 (24.1) | 56.6 | 10 years≤ | 0.894 (0.808–0.991) | 0.945 (0.841–1.061) | 0.825 (0.723–0.943) |
| 1756 | 424 (24.2) | 15 years≤ | 0.934 (0.838–1.041) | 1.040 (0.908–1.191) | 0.826 (0.728–0.937) | ||
| 1322 | 318 (24.1) | 20 years≤ | 0.889 (0.792–0.997) | 0.954 (0.829–1.097) | 0.825 (0.725–0.939) | ||
| 5 years (2011–2015) | 2158 | 521 (24.1) | 46.2 | 10 years≤ | 1.037 (0.937–1.147) | 0.988 (0.882–1.108) | 1.096 (0.960–1.251) |
| 1756 | 424 (24.2) | 15 years≤ | 1.031 (0.925–1.149) | 0.959 (0.842–1.093) | 1.123 (0.986–1.279) | ||
| 1322 | 318 (24.1) | 20 years≤ | 1.019 (0.909–1.142) | 0.970 (0.848–1.109) | 1.067 (0.933–1.219) | ||
© 2020 by the authors. Licensee MDPI, Basel, Switzerland. This article is an open access article distributed under the terms and conditions of the Creative Commons Attribution (CC BY) license (http://creativecommons.org/licenses/by/4.0/).
Share and Cite
Kim, J.; Yoon, K. Municipal Residence Level of Long-Term PM10 Exposure Associated with Obesity among Young Adults in Seoul, Korea. Int. J. Environ. Res. Public Health 2020, 17, 6981. https://0-doi-org.brum.beds.ac.uk/10.3390/ijerph17196981
Kim J, Yoon K. Municipal Residence Level of Long-Term PM10 Exposure Associated with Obesity among Young Adults in Seoul, Korea. International Journal of Environmental Research and Public Health. 2020; 17(19):6981. https://0-doi-org.brum.beds.ac.uk/10.3390/ijerph17196981
Chicago/Turabian StyleKim, Jayeun, and Kyuhyun Yoon. 2020. "Municipal Residence Level of Long-Term PM10 Exposure Associated with Obesity among Young Adults in Seoul, Korea" International Journal of Environmental Research and Public Health 17, no. 19: 6981. https://0-doi-org.brum.beds.ac.uk/10.3390/ijerph17196981