Maternal Socioeconomic Factors and Racial/Ethnic Differences in Neonatal Anthropometry †

 ,
,
Abstract
:1. Introduction
2. Materials and Methods
Analysis
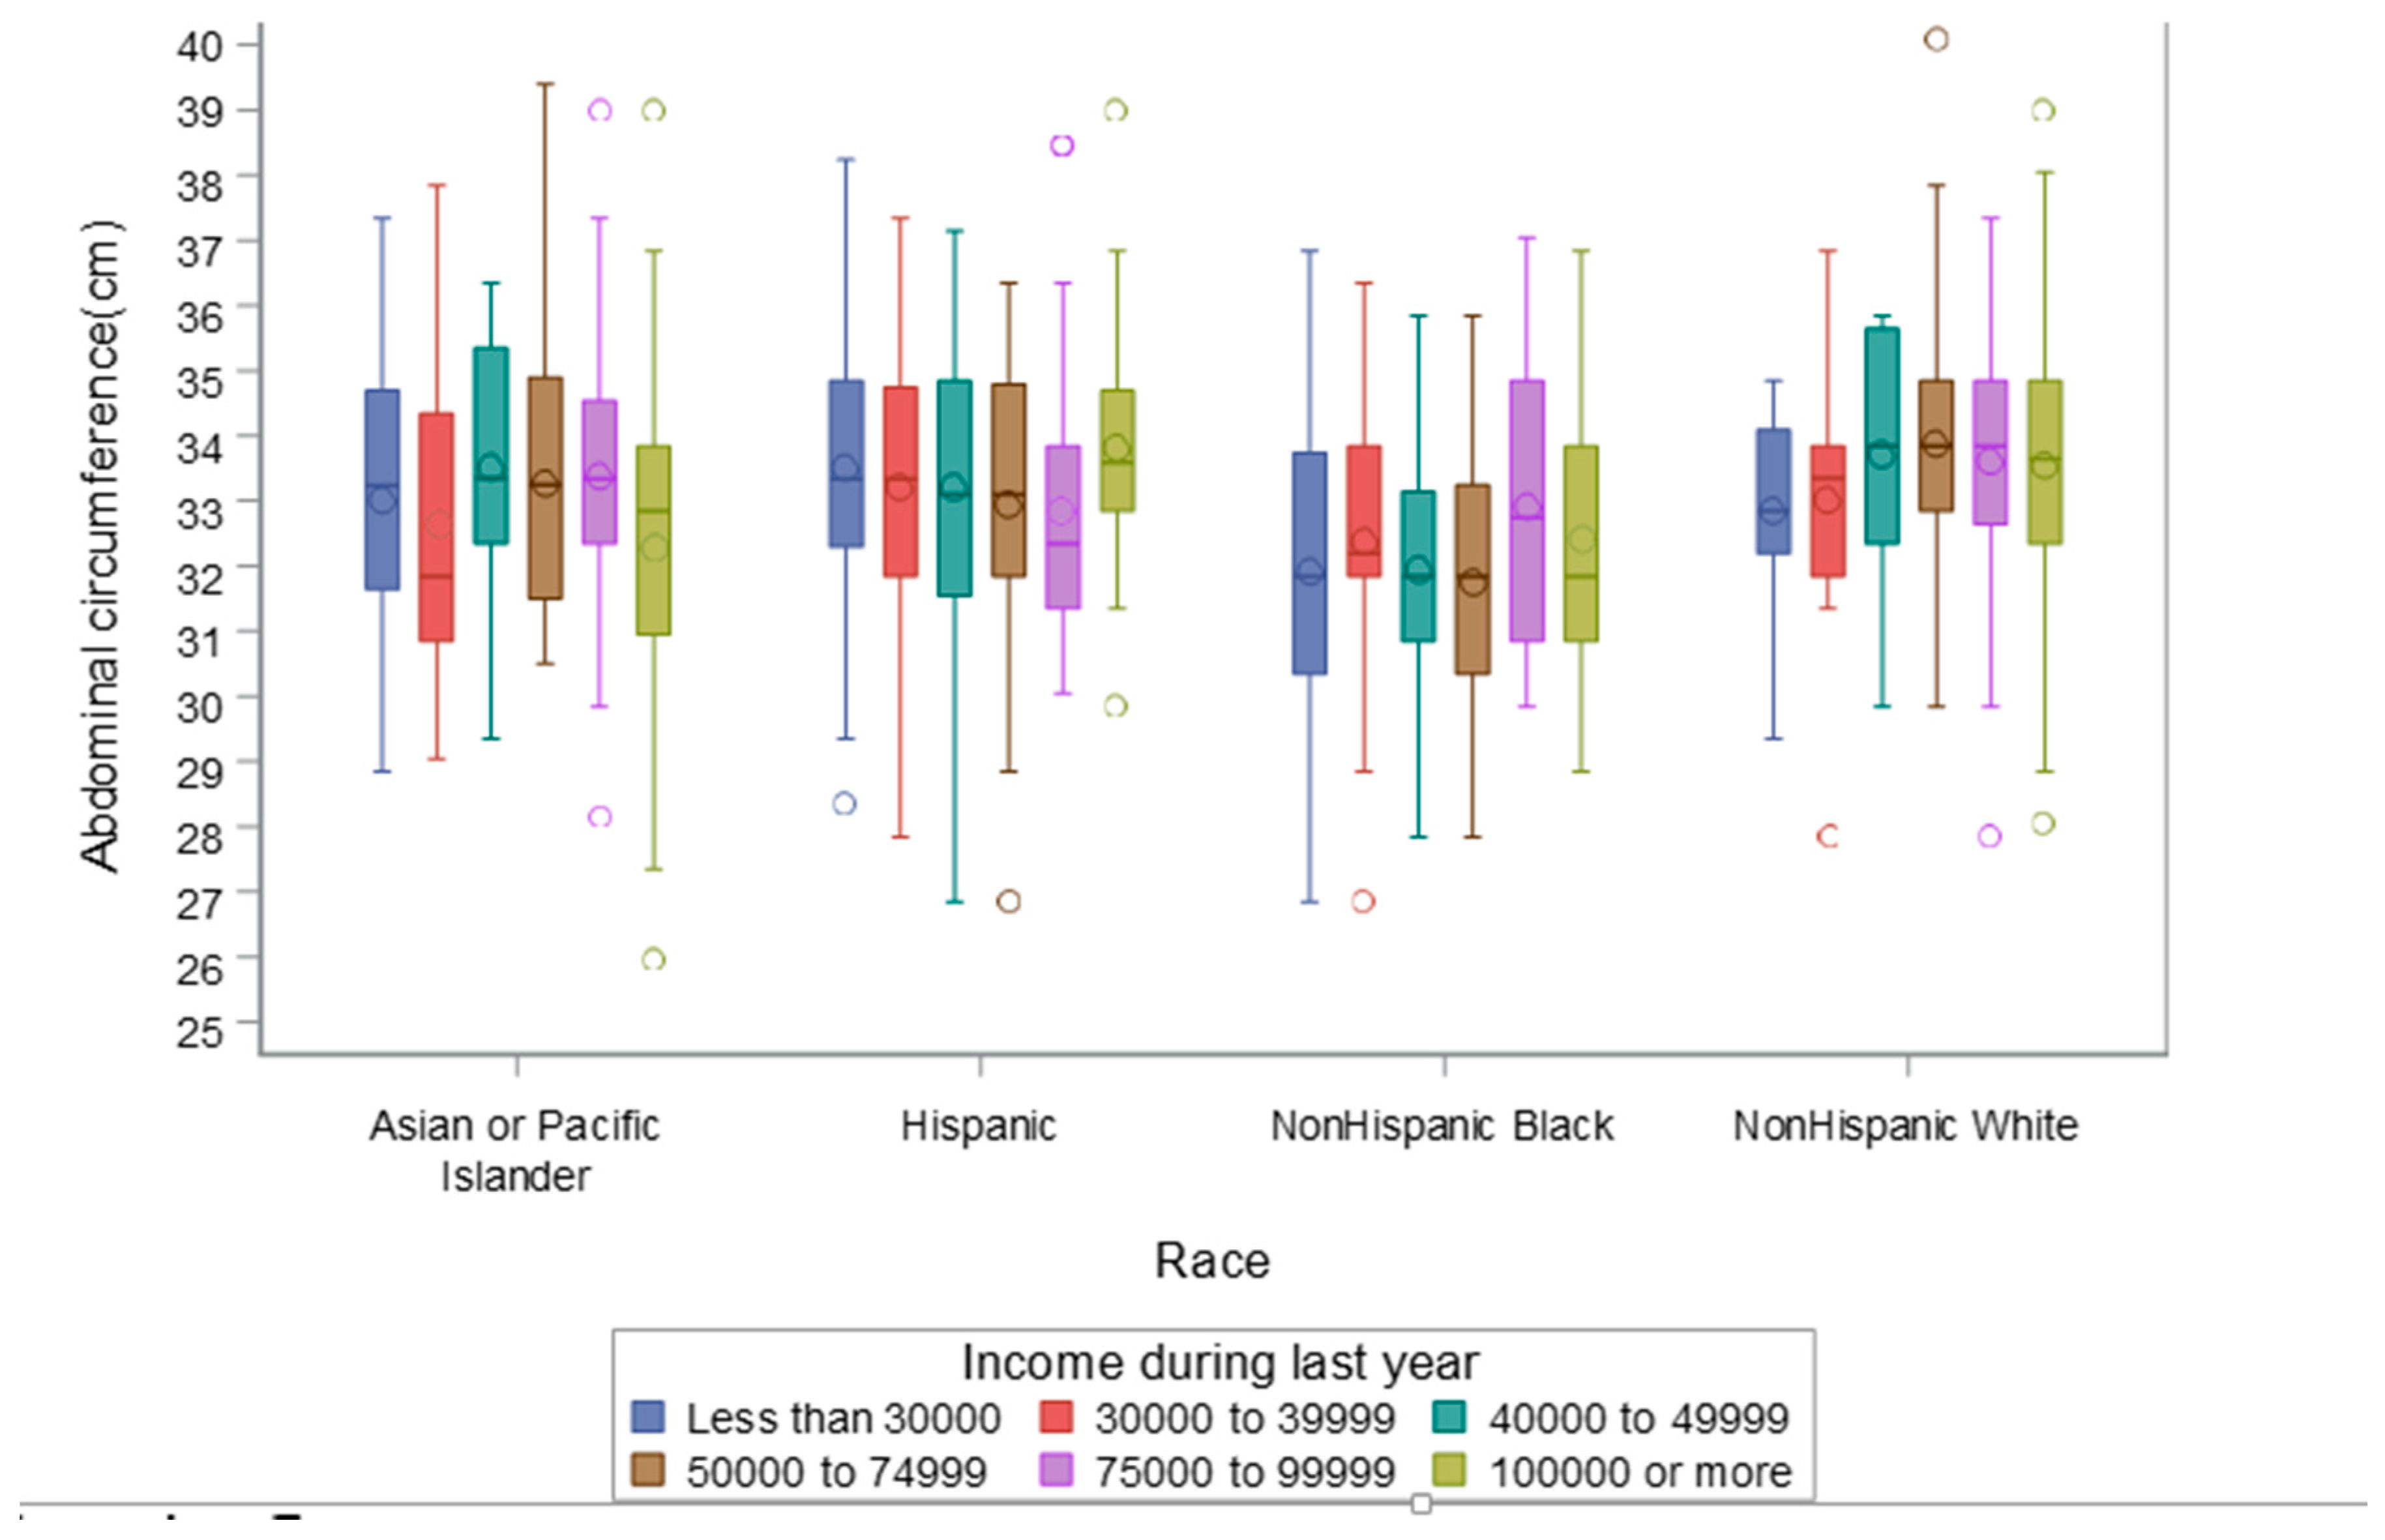
3. Results
4. Discussion
5. Conclusions
Author Contributions
Funding
Acknowledgments
Conflicts of Interest
References
- Burris, H.H.; Hacker, M.R. Birth outcome racial disparities: A result of intersecting social and environmental factors. Semin. Perinatol. 2017, 41, 360–366. [Google Scholar] [CrossRef] [PubMed]
- Buck Louis, G.M.; Grewal, J.; Albert, P.S.; Sciscione, A.; Wing, D.A.; Grobman, W.A.; Newman, R.B.; Wapner, R.; D’Alton, M.E.; Skupski, D.; et al. Racial/ethnic standards for fetal growth: The NICHD Fetal Growth Studies. Am. J. Obstet. Gynecol. 2015, 213, 449e1–449e41. [Google Scholar] [CrossRef] [PubMed]
- Buck Louis, G.M. Eunice Kennedy Shriver National Institute of Child Health and Human Development Fetal Growth Studies’ Research Team; Grewal, J. Clarification of estimating fetal weight between 10–14 weeks gestation, NICHD fetal growth studies. Am. J. Obstet. Gynecol. 2017, 217, 96–101. [Google Scholar] [CrossRef] [PubMed] [Green Version]
- Grantz, K.L.; Kim, S.; Grobman, W.A.; Newman, R.; Owen, J.; Skupski, D.; Grewal, J.; Chien, E.K.; Wing, D.A.; Wapner, R.J.; et al. Fetal growth velocity: The NICHD fetal growth studies. Am. J. Obstet. Gynecol. 2018, 219, 285e1–285e36. [Google Scholar] [CrossRef] [PubMed] [Green Version]
- Parker, J.D.; Schoendorf, K.C.; Kiely, J.L. Associations between measures of socioeconomic status and low birth weight, small for gestational age, and premature delivery in the United States. Ann. Epidemiol. 1994, 4, 271–278. [Google Scholar] [CrossRef]
- Blumenshine, P.; Egerter, S.; Barclay, C.J.; Cubbin, C.; Braveman, P.A. Socioeconomic disparities in adverse birth outcomes: A systematic review. Am. J. Prev. Med. 2010, 39, 263–272. [Google Scholar] [CrossRef]
- Braveman, P.A.; Cubbin, C.; Egerter, S.; Williams, D.R.; Pamuk, E. Socioeconomic disparities in health in the United States: What the patterns tell us. Am. J. Public Health 2010, 100 (Suppl. 1), S186–S196. [Google Scholar] [CrossRef]
- Villar, J.; Puglia, F.A.; Fenton, T.R.; Cheikh Ismail, L.; Staines-Urias, E.; Giuliani, F.; Ohuma, E.O.; Victora, C.G.; Sullivan, P.; Barros, F.C.; et al. Body composition at birth and its relationship with neonatal anthropometric ratios: The newborn body composition study of the INTERGROWTH-21(st) project. Pediatr. Res. 2017, 82, 305–316. [Google Scholar] [CrossRef]
- Ramel, S.E.; Zhang, L.; Misra, S.; Anderson, C.G.; Demerath, E.W. Do anthropometric measures accurately reflect body composition in preterm infants? Pediatr. Obes. 2017, 12 (Suppl. 1), 72–77. [Google Scholar] [CrossRef]
- Wells, J.C. Body composition in infants: Evidence for developmental programming and techniques for measurement. Rev. Endocr. Metab. Disord. 2012, 13, 93–101. [Google Scholar] [CrossRef]
- Wells, J.C.; Chomtho, S.; Fewtrell, M.S. Programming of body composition by early growth and nutrition. Proc. Nutr. Soc. 2007, 66, 423–434. [Google Scholar] [CrossRef] [PubMed] [Green Version]
- Ramel, S.E.; Gray, H.L.; Christiansen, E.; Boys, C.; Georgieff, M.K.; Demerath, E.W. Greater Early Gains in Fat-Free Mass, but Not Fat Mass, Are Associated with Improved Neurodevelopment at 1 Year Corrected Age for Prematurity in Very Low Birth Weight Preterm Infants. J. Pediatr. 2016, 173, 108–115. [Google Scholar] [CrossRef] [PubMed]
- Grewal, J.; Grantz, K.L.; Zhang, C.; Sciscione, A.; Wing, D.A.; Grobman, W.A.; Newman, R.B.; Wapner, R.; D’Alton, M.E.; Skupski, D.; et al. Cohort Profile: NICHD Fetal Growth Studies-Singletons and Twins. Int. J. Epidemiol. 2018, 47, 25–25l. [Google Scholar] [CrossRef] [PubMed] [Green Version]
- Lohman, T.G.; Martorell, R.; Roche, A.F. Anthropometric Standardization Reference Manual; Human Kinetics Books: Champaign, IL, USA, 1988. [Google Scholar]
- Doull, I.J.; McCaughey, E.S.; Bailey, B.J.; Betts, P.R. Reliability of infant length measurement. Arch. Dis. Child. 1995, 72, 520–521. [Google Scholar] [CrossRef] [Green Version]
- Shinwell, E.S.; Shlomo, M. Measured length of normal term infants changes over the first two days of life. J. Pediatr. Endocrinol. Metab. 2003, 16, 537–540. [Google Scholar] [CrossRef]
- Pereira-Da-Silva, L.; Bergmans, K.I.; van Kerkhoven, L.A.; Leal, F.; Virella, D.; Videira-Amaral, J.M. Reducing discomfort while measuring crown-heel length in neonates. Acta Paediatr. 2006, 95, 742–746. [Google Scholar] [CrossRef] [Green Version]
- Catalano, P.M.; Thomas, A.J.; Avallone, D.A.; Amini, S.B. Anthropometric estimation of neonatal body composition. Am. J. Obstet. Gynecol. 1995, 173, 1176–1781. [Google Scholar] [CrossRef]
- NCHS. National Health and Nutrition Examination Survey, 2007–2008: Anthropometry Procedures Manual; U.S. Department of Health and Human Services, Centers for Disease Control and Prevention: Hyattsville, MD, USA, 2008.
- Williams, A.M.; Brain, J.L. The normal position of the umbilicus in the newborn: An aid to improving the cosmetic result in exomphalos major. J. Pediatr. Surg. 2001, 36, 1045–1046. [Google Scholar] [CrossRef]
- Stetzer, B.P.; Thomas, A.; Amini, S.B.; Catalano, P.M. Neonatal anthropometric measurements to predict birth weight by ultrasound. J. Perinatol. 2002, 22, 397–402. [Google Scholar] [CrossRef]
- Rodriguez, G.; Samper, M.P.; Ventura, P.; Perez-Gonzalez, J.M. Sex-specific charts for abdominal circumference in term and near-term Caucasian newborns. J. Perinat. Med. 2008, 36, 527–530. [Google Scholar] [CrossRef]
- Fok, T.F.; Hon, K.L.; Wong, E.; Ng, P.C.; So, H.K.; Lau, J.; Chow, C.B.; Lee, W.H.; Hong Kong Neonatal Measurements Working, G. Trunk anthropometry of Hong Kong Chinese infants. Early Hum. Dev. 2005, 81, 781–790. [Google Scholar] [CrossRef] [PubMed]
- de Onis, M.; Onyango, A.W.; Van den Broeck, J.; Chumlea, W.C.; Martorell, R. Measurement and standardization protocols for anthropometry used in the construction of a new international growth reference. Food Nutr. Bull. 2004, 25 (Suppl. 1), S27–S36. [Google Scholar] [CrossRef] [PubMed]
- Johnson, T.S.; Engstrom, J.L.; Gelhar, D.K. Intra- and interexaminer reliability of anthropometric measurements of term infants. J. Pediatr. Gastroenterol. Nutr. 1997, 24, 497–505. [Google Scholar] [CrossRef] [PubMed]
- Frisbie, W.P.; Echevarria, S.; Hummer, R.A. Prenatal care utilization among non-Hispanic Whites, African Americans, and Mexican Americans. Matern. Child. Health J. 2001, 5, 21–33. [Google Scholar] [CrossRef]
- Sparks, P.J. Do biological, sociodemographic, and behavioral characteristics explain racial/ethnic disparities in preterm births? Soc. Sci. Med. 2009, 68, 1667–1675. [Google Scholar] [CrossRef]
- Ncube, C.N.; Enquobahrie, D.A.; Albert, S.M.; Herrick, A.L.; Burke, J.G. Association of neighborhood context with offspring risk of preterm birth and low birthweight: A systematic review and meta-analysis of population-based studies. Soc. Sci. Med. 2016, 153, 156–164. [Google Scholar] [CrossRef]
- Mehra, R.; Boyd, L.M.; Ickovics, J.R. Racial residential segregation and adverse birth outcomes: A systematic review and meta-analysis. Soc. Sci. Med. 2017, 191, 237–250. [Google Scholar] [CrossRef]
- Tanvig, M.; Wehberg, S.; Vinter, C.A.; Joergensen, J.S.; Ovesen, P.G.; Beck-Nielsen, H.; Jensen, D.M.; Christesen, H.T. Pregestational body mass index is related to neonatal abdominal circumference at birth—A Danish population-based study. BJOG 2013, 120, 320–330. [Google Scholar] [CrossRef]
- Gardeil, F.; Greene, R.; Stuart, B.; Turner, M.J. Subcutaneous fat in the fetal abdomen as a predictor of growth restriction. Obstet. Gynecol. 1999, 94, 209–212. [Google Scholar]
- Kramer, M.R.; Waller, L.A.; Dunlop, A.L.; Hogue, C.R. Housing transitions and low birth weight among low-income women: Longitudinal study of the perinatal consequences of changing public housing policy. Am. J. Public Health 2012, 102, 2255–2261. [Google Scholar] [CrossRef]
- Lu, M.C.; Halfon, N. Racial and ethnic disparities in birth outcomes: A life-course perspective. Matern Child. Health J. 2003, 7, 13–30. [Google Scholar] [CrossRef] [PubMed]
- Peneau, S.; Gonzalez-Carrascosa, R.; Gusto, G.; Goxe, D.; Lantieri, O.; Fezeu, L.; Hercberg, S.; Rolland-Cachera, M.F. Age at adiposity rebound: Determinants and association with nutritional status and the metabolic syndrome at adulthood. Int. J. Obes. (Lond) 2016, 40, 1150–1156. [Google Scholar] [CrossRef] [PubMed]
- Sletner, L.; Jenum, A.K.; Morkrid, K.; Vangen, S.; Holme, I.M.; Birkeland, K.I.; Nakstad, B. Maternal life course socio-economic position and offspring body composition at birth in a multi-ethnic population. Paediatr. Perinat. Epidemiol. 2014, 28, 445–454. [Google Scholar] [CrossRef] [PubMed]
- Kane, J.B.; Miles, G.; Yourkavitch, J.; King, K. Neighborhood context and birth outcomes: Going beyond neighborhood disadvantage, incorporating affluence. SSM Popul. Health 2017, 3, 699–712. [Google Scholar] [CrossRef]
- Braveman, P.A.; Cubbin, C.; Egerter, S.; Chideya, S.; Marchi, K.S.; Metzler, M.; Posner, S. Socioeconomic status in health research: One size does not fit all. JAMA 2005, 294, 2879–2888. [Google Scholar] [CrossRef]
- Lu, M.C.; Kotelchuck, M.; Hogan, V.; Jones, L.; Wright, K.; Halfon, N. Closing the Black-White gap in birth outcomes: A life-course approach. Ethn. Dis. 2010, 20 (Suppl. 2), 62–76. [Google Scholar]
- Bosquet Enlow, M.; Sideridis, G.; Chiu, Y.M.; Nentin, F.; Howell, E.A.; Le Grand, B.A.; Wright, R.J. Associations among maternal socioeconomic status in childhood and pregnancy and hair cortisol in pregnancy. Psychoneuroendocrinology 2019, 99, 216–224. [Google Scholar] [CrossRef]
- Freathy, R.M.; Mook-Kanamori, D.O.; Sovio, U.; Prokopenko, I.; Timpson, N.J.; Berry, D.J.; Warrington, N.M.; Widen, E.; Hottenga, J.J.; Kaakinen, M.; et al. Variants in ADCY5 and near CCNL1 are associated with fetal growth and birth weight. Nat. Genet. 2010, 42, 430–435. [Google Scholar] [CrossRef] [Green Version]
- Howard, D.L.; Marshall, S.S.; Kaufman, J.S.; Savitz, D.A. Variations in low birth weight and preterm delivery among blacks in relation to ancestry and nativity: New York City, 1998–2002. Pediatrics 2006, 118, e1399–e1405. [Google Scholar] [CrossRef]
- Tekola-Ayele, F.; Workalemahu, T.; Amare, A.T. High burden of birthweight-lowering genetic variants in Africans and Asians. BMC Med. 2018, 16, 70. [Google Scholar] [CrossRef]


| Characteristic | Non-Hispanic White | Non-Hispanic Black | Hispanic | Asian/Pacific Islander | Overall |
|---|---|---|---|---|---|
| n = 468 | n = 401 | n = 454 | n = 322 | n = 1645 | |
| Maternal age, years—mean ± (SD) | 30.3 (4.3) | 25.4 (5.3) | 27.0 (5.4) | 30.5 (4.4) | 28.2 (5.3) |
| Height, cm—mean ± (SD) | 165.7 (7.1) | 164.4 (6.8) | 159.9 (6.2) | 160.3 (5.9) | 162.7 (7.0) |
| Pregravid Weight, kg—mean ± (SD) | 63.5 (9.0) | 64.9 (9.6) | 62.3 (9.1) | 56.9 (8.2) | 62.2 (9.5) |
| Full-time employment/student status, n (%) | |||||
| No | 79 (16.9%) | 101 (25.2%) | 178 (39.2%) | 103 (32.0%) | 461 (28.0%) |
| Yes | 389 (83.1%) | 300 (74.8%) | 276 (60.8%) | 219 (68.0%) | 1184 (72.0%) |
| Marital status a, n (%) | |||||
| Not married | 27 (5.8%) | 207 (51.8%) | 120 (26.4%) | 28 (8.7%) | 382 (23.3%) |
| Married or living with partner | 440 (94.2%) | 193 (48.3%) | 334 (73.6%) | 294 (91.3%) | 1261 (76.7%) |
| Insurance, n (%) | |||||
| Other | 25 (5.3%) | 199 (49.6%) | 275 (60.6%) | 49 (15.2%) | 548 (33.3%) |
| Private or managed care | 443 (94.7%) | 202 (50.4%) | 179 (39.4%) | 273 (84.8%) | 1097 (66.7%) |
| Family income a, n (%) | |||||
| <$30,000 | 17 (3.8%) | 168 (48.3%) | 144 (38.2%) | 40 (16.5%) | 369 (26.0%) |
| $30,000–$39,999 | 14 (3.1%) | 26 (7.5%) | 64 (17.0%) | 15 (6.2%) | 119 (8.4%) |
| $40,000–$49,999 | 15 (3.3%) | 43 (12.4%) | 40 (10.6%) | 15 (6.2%) | 113 (8.0%) |
| $50,000–$74,999 | 58 (12.8%) | 31 (8.9%) | 52 (13.8%) | 32 (13.2%) | 173 (12.2%) |
| $75,000–$99,999 | 86 (19.0%) | 34 (9.8%) | 29 (7.7%) | 52 (21.4%) | 201 (14.1%) |
| $100,000 or more | 263 (58.1%) | 46 (13.2%) | 48 (12.7%) | 89 (36.6%) | 446 (31.4%) |
| Education, n (%) | |||||
| <High school | 4 (0.9%) | 44 (11.0%) | 99 (21.8%) | 17 (5.3%) | 164 (10.0%) |
| High school/equivalent | 22 (4.7%) | 114 (28.4%) | 108 (23.8%) | 38 (11.8%) | 282 (17.1%) |
| Some college/associate | 87 (18.6%) | 144 (35.9%) | 169 (37.2%) | 61 (18.9%) | 461 (28.0%) |
| Bachelor’s degree | 192 (41.0%) | 63 (15.7%) | 62 (13.7%) | 102 (31.7%) | 419 (25.5%) |
| Postgraduate degree | 163 (34.8%) | 36 (9.0%) | 16 (3.5%) | 104 (32.3%) | 319 (19.4%) |
| Parity, n (%) | |||||
| 0 | 249 (53.2%) | 196 (48.9%) | 173 (38.1%) | 164 (50.9%) | 782 (47.5%) |
| 1 | 159 (34.0%) | 135 (33.7%) | 173 (38.1%) | 125 (38.8%) | 592 (36.0%) |
| ≥2 | 60 (12.8%) | 70 (17.5%) | 108 (23.8%) | 33 (10.2%) | 271 (16.5%) |
| Gestational age at delivery—weeks, mean (S.D.) | 39.6 (1.0) | 39.5 (1.0) | 39.6 (1.0) | 39.4 (1.1) | 39.5 (1.0) |
| Infant sex, n (%) | |||||
| Male | 255 (54.5%) | 200 (49.9%) | 225 (49.6%) | 165 (51.2%) | 845 (51.4%) |
| Female | 213 (45.5%) | 201 (50.1%) | 229 (50.4%) | 157 (48.8%) | 800 (48.6%) |
| Neonatal Anthropometry (Units) | Non-Hispanic White | Non-Hispanic Black | Hispanic | Asian/Pacific Islander | Overall | p-Value | Variable n | |||||
|---|---|---|---|---|---|---|---|---|---|---|---|---|
| n = 468 | n = 401 | n = 454 | n = 322 | n = 1645 | ||||||||
| mean | SD | mean | SD | mean | SD | mean | SD | mean | SD | |||
| Birthweight (gm) | 3498 | 425 | 3273 | 415 | 3382 | 422 | 3325 | 414 | 3377 | 428 | <0.0001 | 1644 |
| Exam Weight (gm) | 3436 | 413 | 3229 | 414 | 3320 | 420 | 3265 | 413 | 3320 | 423 | <0.0001 | 1642 |
| Exam Length (cm) | 50.7 | 2.5 | 49.9 | 2.2 | 50.2 | 2.3 | 50.3 | 2.4 | 50.3 | 2.4 | <0.001 | 1632 |
| Exam Head Circumference (cm) | 34.4 | 1.4 | 33.8 | 1.4 | 34.2 | 1.3 | 34.1 | 1.4 | 34.1 | 1.4 | <0.0001 | 1643 |
| Abdominal Circumference (cm) | 33.7 | 1.9 | 32.3 | 2.2 | 33.4 | 1.9 | 33.1 | 2.2 | 33.2 | 2.1 | <0.0001 | 1637 |
| Birthweight (gm) | p-Value | Exam Weight (gm) | p-Value | Exam Length (cm) | p-Value | Exam Head Circumference (cm) | p-Value | Exam Abdominal Circumference (cm) | p-Value | |
|---|---|---|---|---|---|---|---|---|---|---|
| Full-time employment/student status, mean ± (SD) | 0.20 | 0.20 | 0.38 | 0.24 | 0.54 | |||||
| No (n = 461) | 3355 (433) | 3298 (432) | 50.2 (2.3) | 34.1 (1.5) | 33.2 (2.1) | |||||
| Yes (n = 1184) | 3386 (426) | 3329 (419) | 50.3 (2.4) | 34.2 (1.4) | 33.2 (2.1) | |||||
| Marital status, mean ± (SD) | <0.0001 | 0.0002 | 0.0001 | 0.003 | <0.0001 | |||||
| Not married (n = 382) | 3300 (431) | 3250 (425) | 49.9 (2.3) | 33.9 (1.5) | 32.6 (2.3) | |||||
| Married or living with partner (n = 1261) | 3400 (425) | 3342 (420) | 50.4 (2.4) | 34.2 (1.4) | 33.3 (2.0) | |||||
| Insurance, mean ± (SD) | 0.001 | 0.003 | 0.02 | <0.0001 | 0.003 | |||||
| Other (n = 548) | 3323 (427) | 3274 (423) | 50.1 (2.3) | 33.9 (1.3) | 33.0 (2.2) | |||||
| Private or managed care (n = 1097) | 3404 (426) | 3343 (421) | 50.4 (2.4) | 34.2 (1.4) | 33.3 (2.0) | |||||
| Family income, mean ± (SD) | 0.0002 | 0.001 | 0.01 | 0.001 | 0.0002 | |||||
| <$30,000 (n = 369) | 3335 (418) | 3282 (413) | 50.1 (2.4) | 34.0 (1.3) | 32.9 (2.2) | |||||
| $30,000–$39,999 (n = 119) | 3302 (428) | 3245 (417) | 49.9 (2.2) | 34.0 (1.2) | 33.1 (2.1) | |||||
| $40,000–$49,999 (n = 113) | 3351 (409) | 3305 (411) | 50.3 (2.2) | 33.8 (1.6) | 33.0 (2.2) | |||||
| $50,000–$74,999 (n = 173) | 3417 (452) | 3351 (461) | 50.5 (2.2) | 34.2 (1.5) | 33.2 (2.0) | |||||
| $75,000–$99,999 (n = 201) | 3444 (412) | 3380 (411) | 50.7 (2.4) | 34.3 (1.3) | 33.5 (1.9) | |||||
| $100,000 or more (n = 446) | 3430 (426) | 3367 (415) | 50.4 (2.4) | 34.3 (1.4) | 33.4 (2.1) | |||||
| Education, mean ± (SD) | 0.0003 | 0.001 | 0.0001 | 0.001 | 0.05 | |||||
| <High school (n = 164) | 3294 (416) | 3255 (411) | 49.8 (2.1) | 33.8 (1.3) | 33.0 (2.1) | |||||
| High school/equivalent (n = 282) | 3331 (419) | 3271 (412) | 50.1 (2.3) | 34.1 (1.5) | 33.0 (2.1) | |||||
| Some college/associate (n = 461) | 3374 (442) | 3311 (435) | 50.2 (2.5) | 34.1 (1.4) | 33.1 (2.2) | |||||
| Bachelor’s degree (n = 419) | 3416 (436) | 3359 (429) | 50.4 (2.3) | 34.3 (1.3) | 33.3 (2.0) | |||||
| Postgraduate degree (n = 319) | 3417 (402) | 3358 (403) | 50.7 (2.5) | 34.2 (1.4) | 33.3 (2.0) |
| Neonatal Anthropometry (Units) | Full-Time Employed/Student p-Value | Marital Status p-Value | Insurance p-Value | Income p-Value | Education p-Value | Infant Sex p-Value | Age p-Value | Height p-Value | Weight p-Value | Parity p-Value |
|---|---|---|---|---|---|---|---|---|---|---|
| Birthweight (gm) | 0.83 | 0.13 | 0.46 | 0.29 | 0.13 | 0.52 | 0.51 | 0.52 | 0.65 | 0.33 |
| Exam Weight (gm) | 0.83 | 0.19 | 0.70 | 0.33 | 0.23 | 0.43 | 0.46 | 0.62 | 0.81 | 0.19 |
| Exam Length (cm) | 0.99 | 0.11 | 0.62 | 0.46 | 0.42 | 0.03 | 0.38 | 0.59 | 0.66 | 0.83 |
| Exam Head circ. (cm) | 0.55 | 0.51 | 0.99 | 0.48 | 0.33 | 0.03 | 0.31 | 0.48 | 0.79 | 0.55 |
| Abdominal Circumference (cm) | 0.69 | 0.05 | 0.63 | 0.03 | 0.26 | 0.62 | 0.92 | 0.70 | 0.41 | 0.24 |
© 2020 by the authors. Licensee MDPI, Basel, Switzerland. This article is an open access article distributed under the terms and conditions of the Creative Commons Attribution (CC BY) license (http://creativecommons.org/licenses/by/4.0/).
Share and Cite
Lambert, C.; Gleason, J.L.; Pugh, S.J.; Liu, A.; Bever, A.; Grobman, W.A.; Newman, R.B.; Wing, D.; Gerlanc, N.M.; Tekola-Ayele, F.; et al. Maternal Socioeconomic Factors and Racial/Ethnic Differences in Neonatal Anthropometry. Int. J. Environ. Res. Public Health 2020, 17, 7323. https://0-doi-org.brum.beds.ac.uk/10.3390/ijerph17197323
Lambert C, Gleason JL, Pugh SJ, Liu A, Bever A, Grobman WA, Newman RB, Wing D, Gerlanc NM, Tekola-Ayele F, et al. Maternal Socioeconomic Factors and Racial/Ethnic Differences in Neonatal Anthropometry. International Journal of Environmental Research and Public Health. 2020; 17(19):7323. https://0-doi-org.brum.beds.ac.uk/10.3390/ijerph17197323
Chicago/Turabian StyleLambert, Calvin, Jessica L. Gleason, Sarah J. Pugh, Aiyi Liu, Alaina Bever, William A. Grobman, Roger B. Newman, Deborah Wing, Nicole M. Gerlanc, Fasil Tekola-Ayele, and et al. 2020. "Maternal Socioeconomic Factors and Racial/Ethnic Differences in Neonatal Anthropometry" International Journal of Environmental Research and Public Health 17, no. 19: 7323. https://0-doi-org.brum.beds.ac.uk/10.3390/ijerph17197323