The Mortality Risk and Socioeconomic Vulnerability Associated with High and Low Temperature in Hong Kong


Abstract
:1. Introduction
2. Materials and Methods
2.1. Environmental Data
2.2. Mortality Data
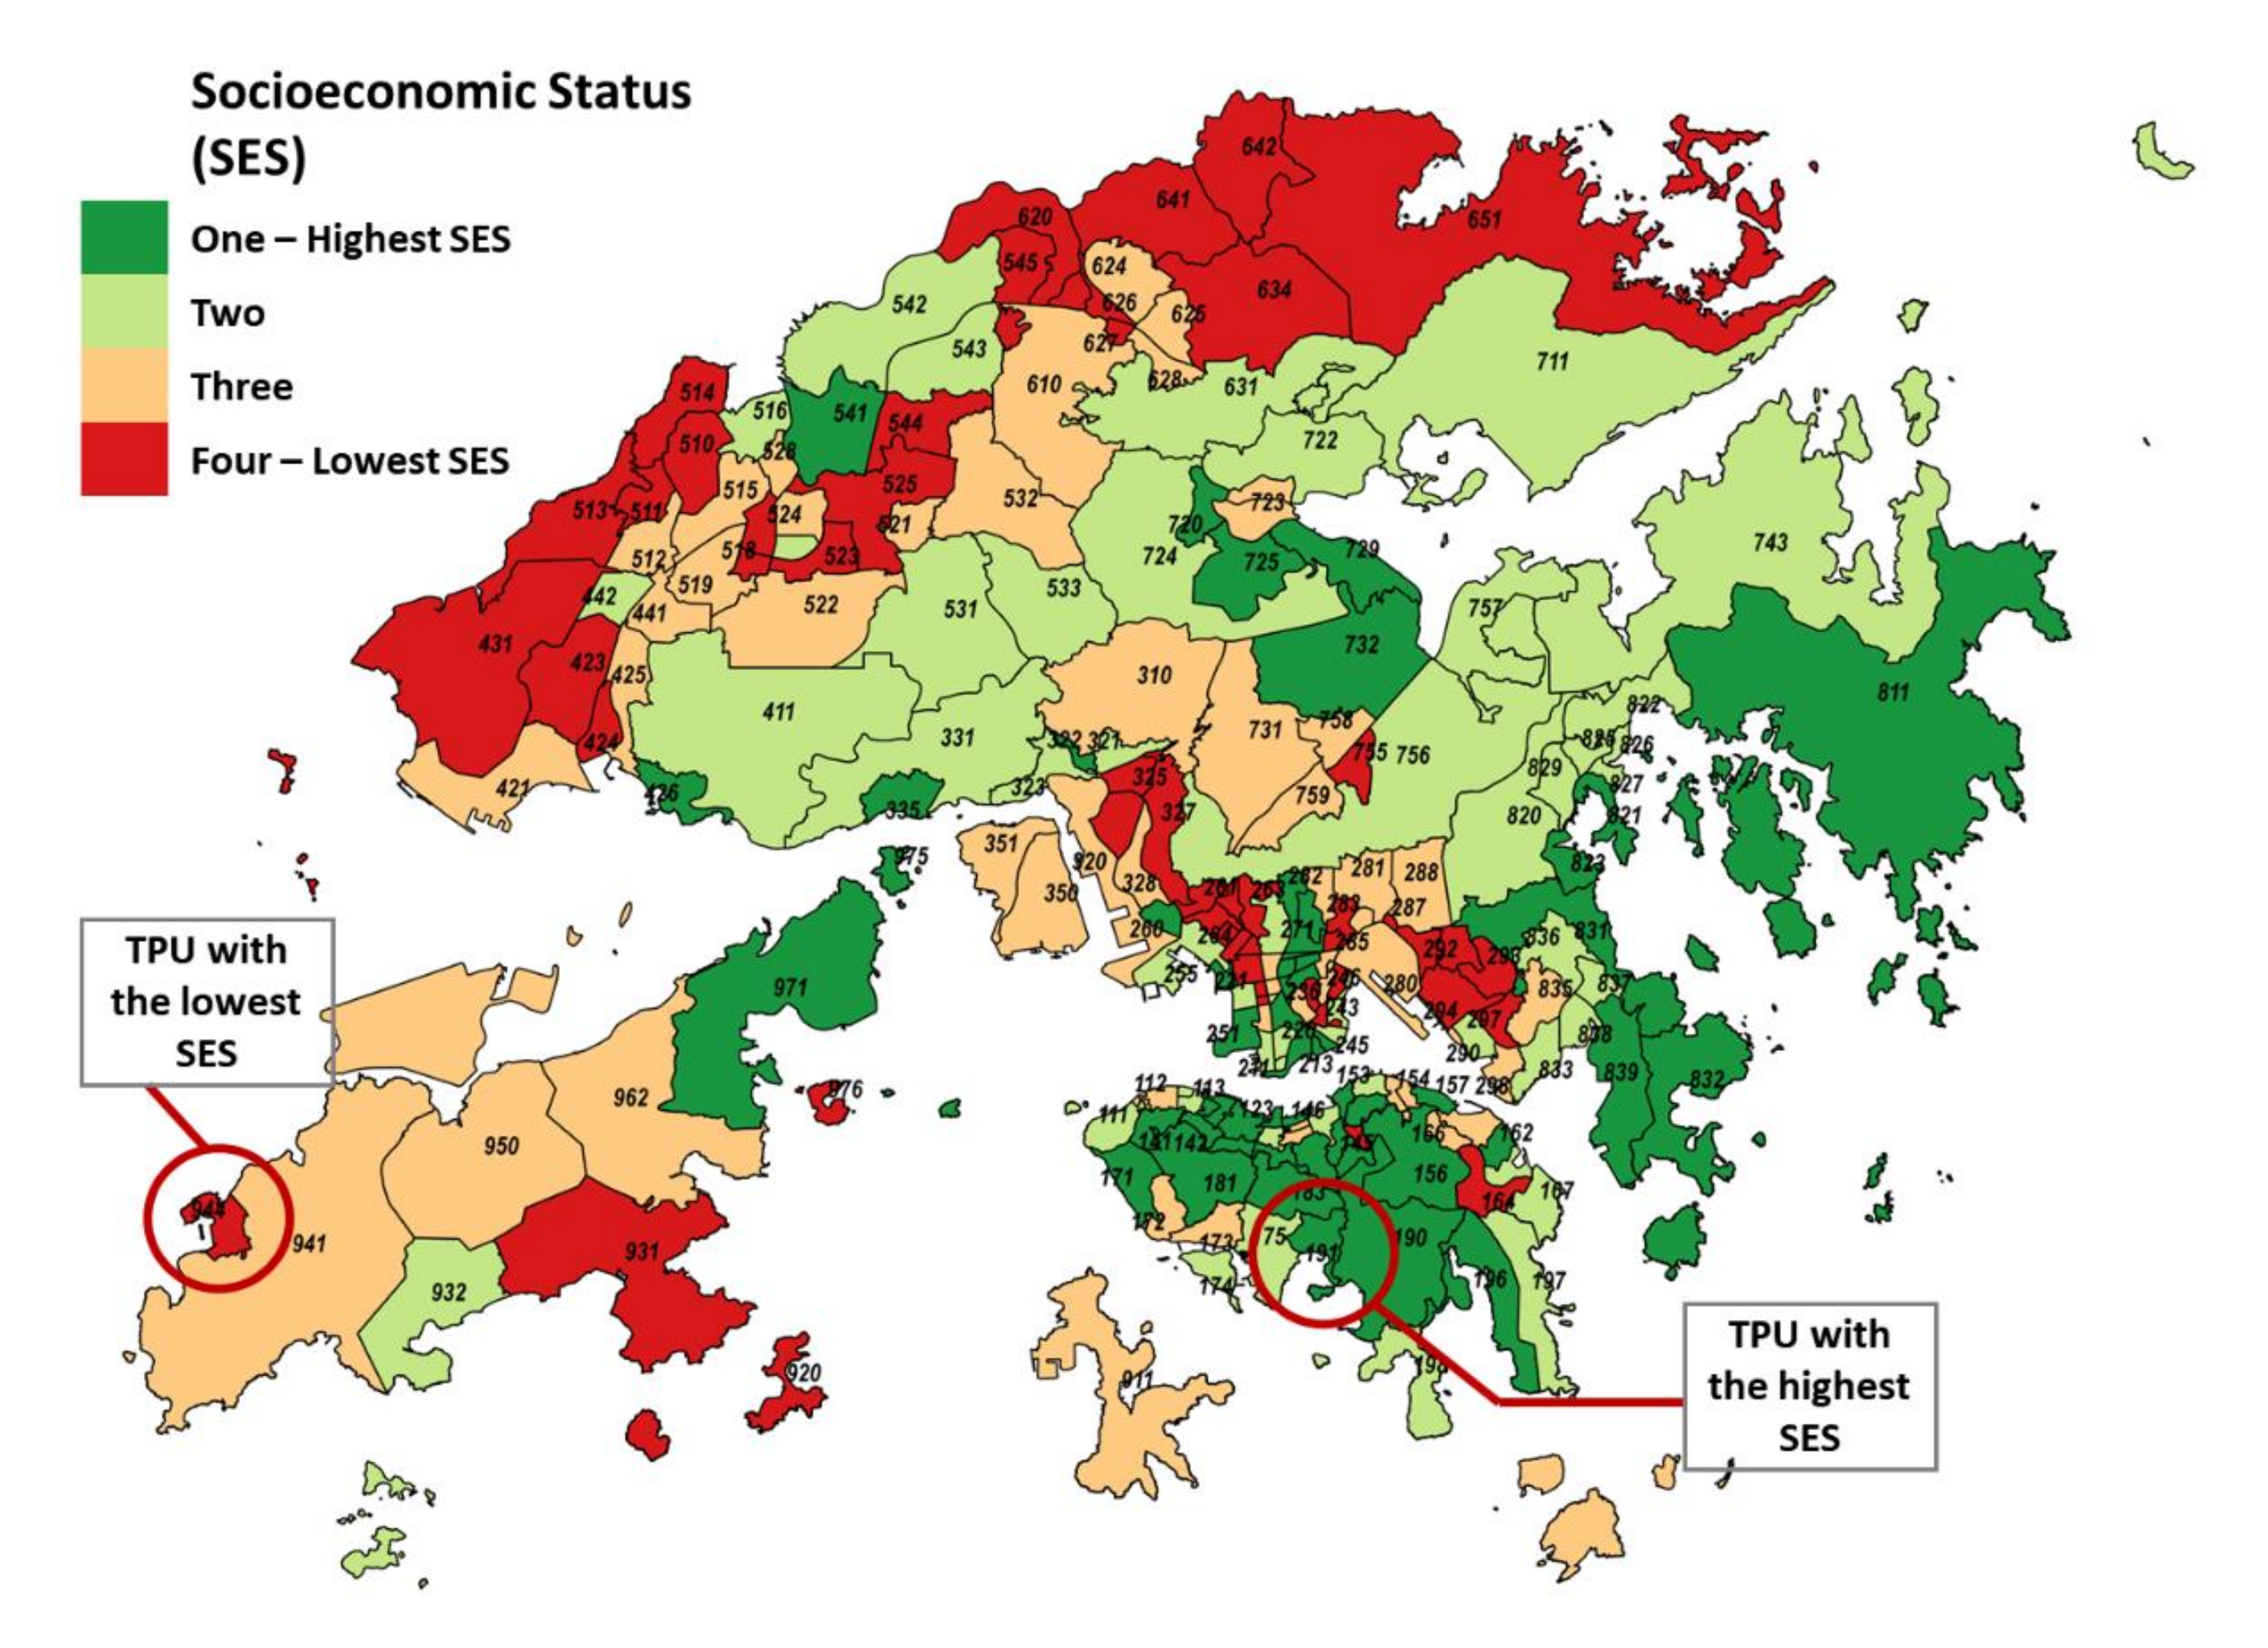
2.3. Socioeconomic Status Data
2.4. Statistical Analysis
3. Results
3.1. Data Description
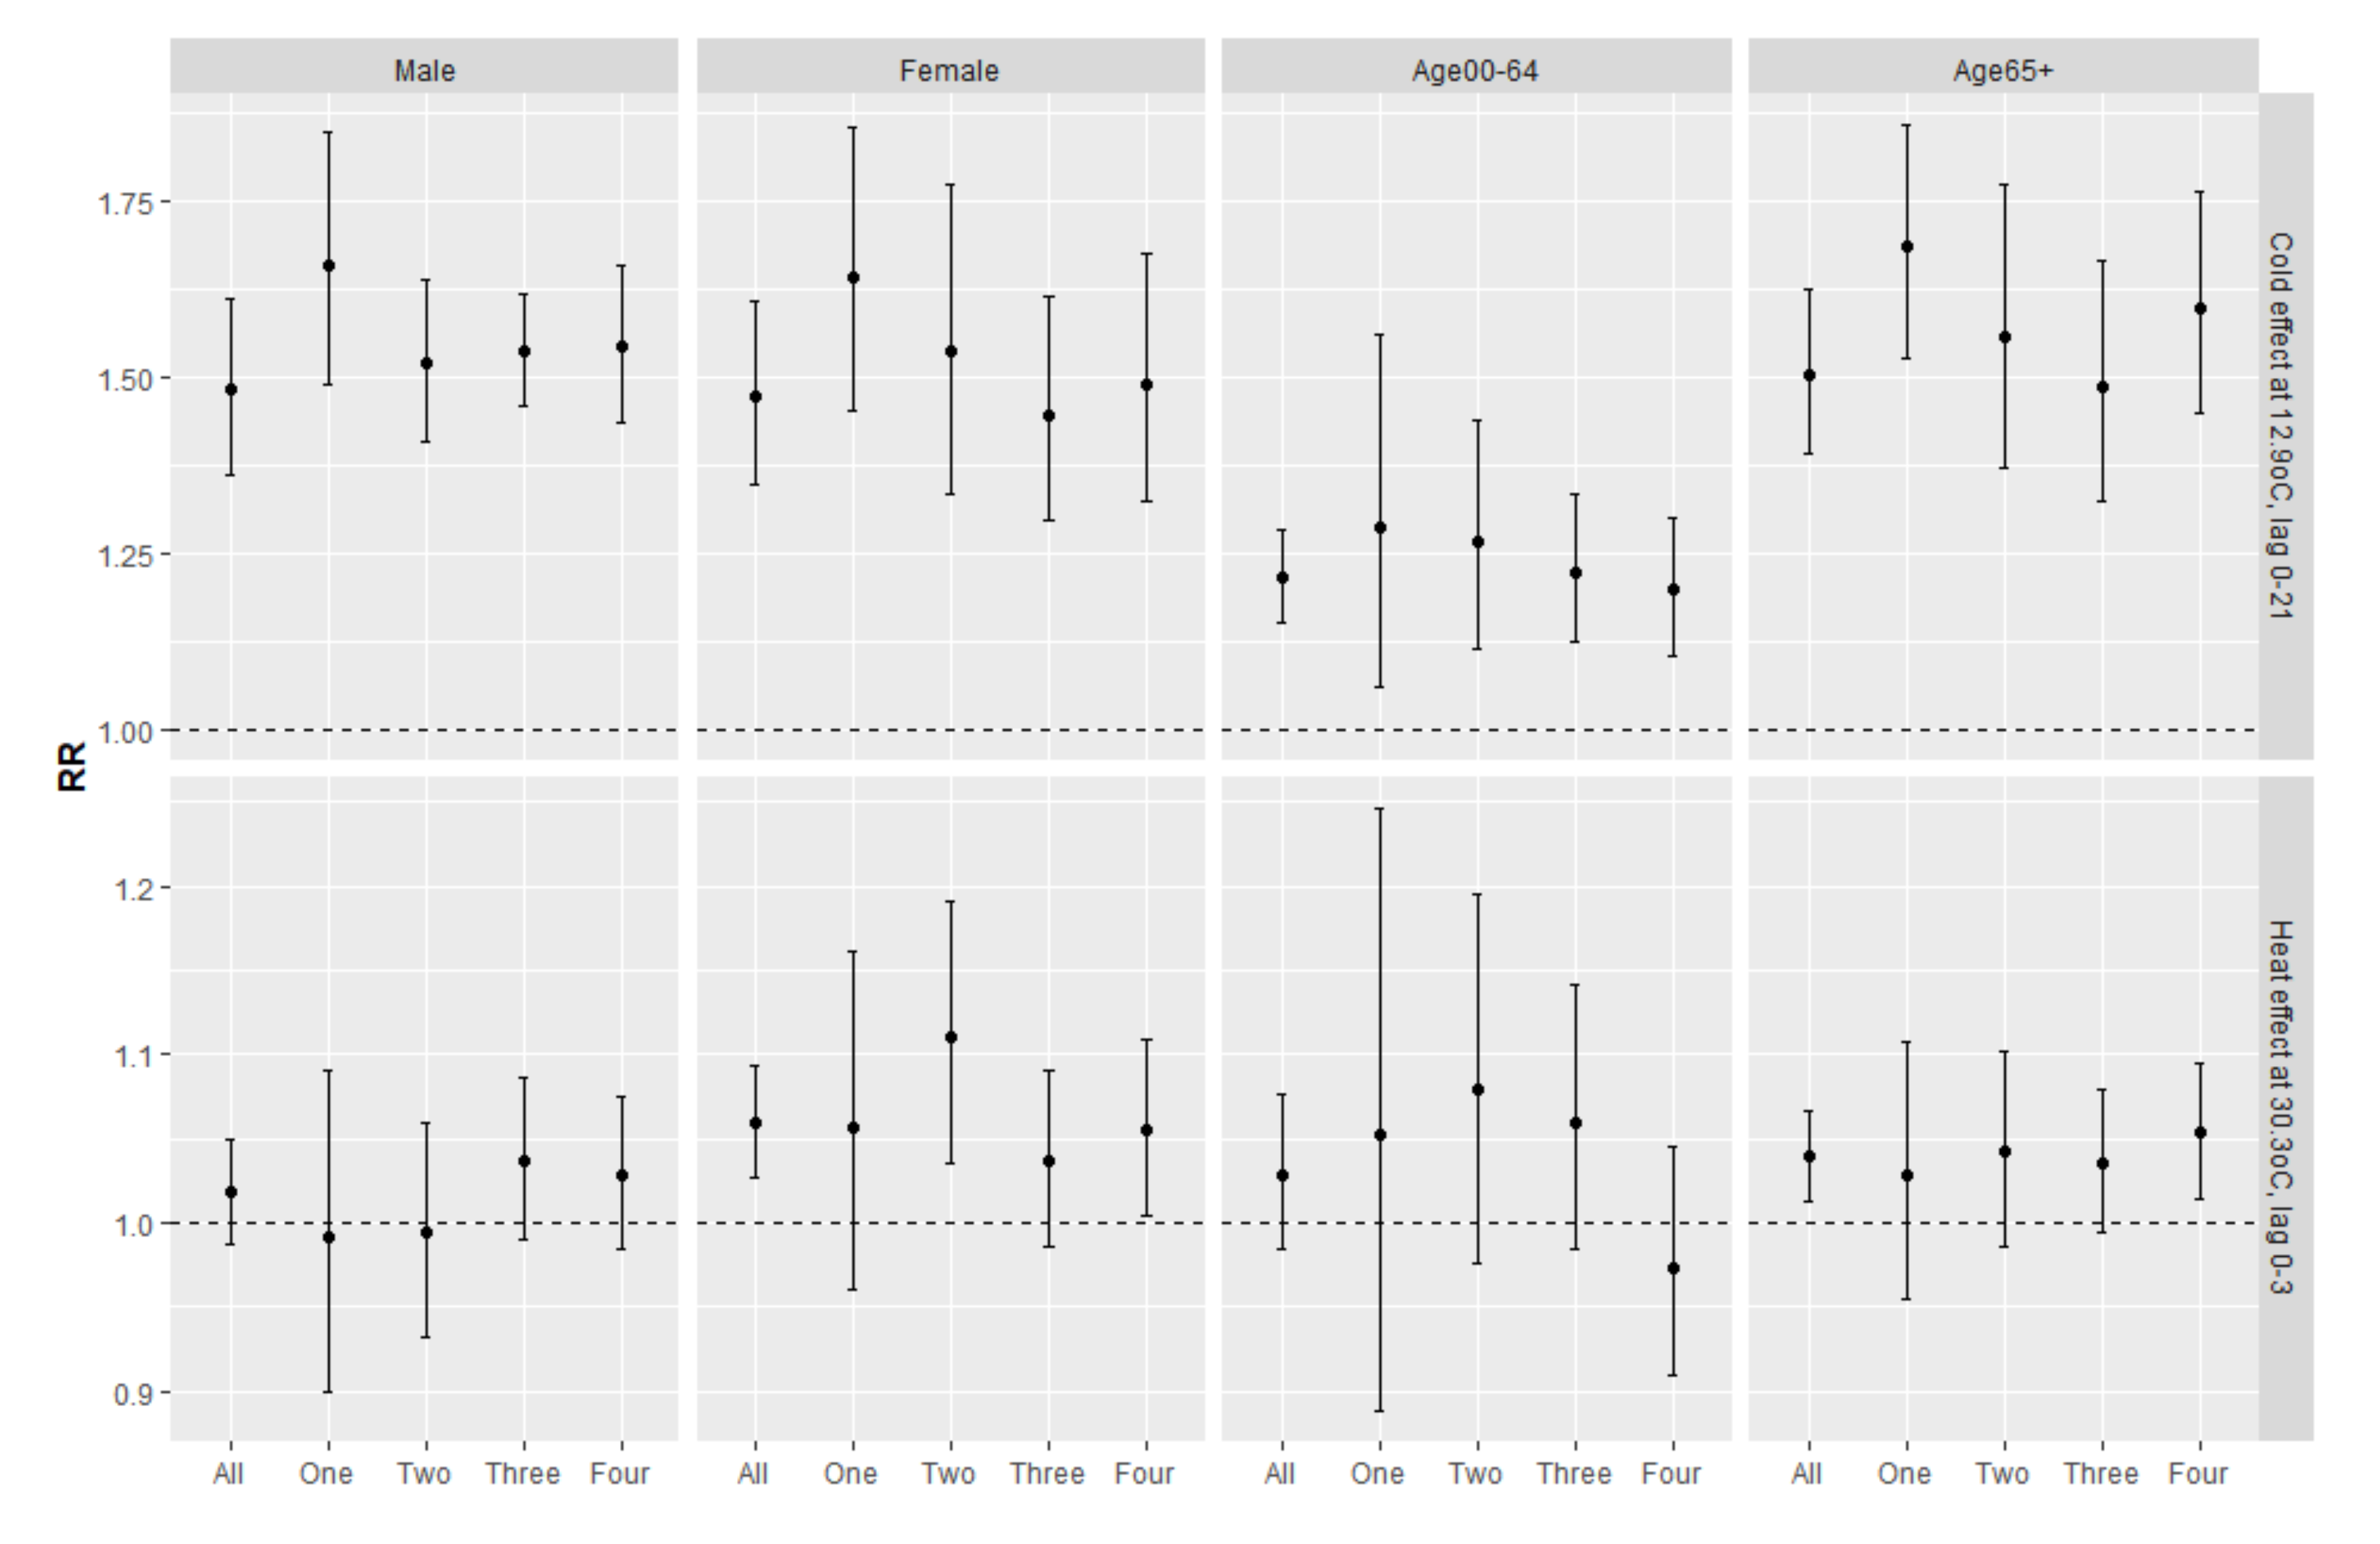
3.2. Main Findings
4. Discussion
5. Conclusions
Author Contributions
Funding
Acknowledgments
Conflicts of Interest
References
- Song, X.; Wang, S.; Hu, Y.; Yue, M.; Zhang, T.; Liu, Y.; Tian, J.; Shang, K. Impact of ambient temperature on morbidity and mortality: An overview of reviews. Sci. Total Environ. 2017, 586, 241–254. [Google Scholar] [CrossRef]
- Gronlund, C.J.; Sullivan, K.P.; Kefelegn, Y.; Cameron, L.; O’Neill, M.S. Climate change and temperature extremes: A review of heat- and cold-related morbidity and mortality concerns of municipalities. Maturitas 2018, 114, 54–59. [Google Scholar] [CrossRef]
- Medina-Ramón, M.; Schwartz, J. Temperature, temperature extremes, and mortality: A study of acclimatisation and effect modification in 50 US cities. Occup. Environ. Med. 2007, 64, 827–833. [Google Scholar] [CrossRef] [Green Version]
- Wang, X.; Li, G.; Liu, L.; Westerdahl, D.; Jin, X.; Pan, X. Effects of extreme temperatures on cause-specific cardiovascular mortality in China. Int. J. Environ Res. Public Health 2015, 12, 16136–16156. [Google Scholar] [CrossRef] [Green Version]
- Amegah, A.K.; Rezza, G.; Jaakkola, J.J.K.K. Temperature-related morbidity and mortality in Sub-Saharan Africa: A systematic review of the empirical evidence. Environ. Int. 2016, 91, 133–149. [Google Scholar] [CrossRef]
- Stocker, T.F.; Qin, D.; Plattner, G.K.; Tignor, M.M.B.; Allen, S.K.; Boschung, J.; Nauels, A.; Xia, Y.; Bex, V.; Midgley, P.M. Climate Change 2013 the Physical Science Basis: Working Group I Contribution to the Fifth Assessment Report of the Intergovernmental Panel on Climate Change; Cambridge University: New York, NY, USA, 2013; Volume 9781107057, ISBN 9781107415324. [Google Scholar]
- O’Neill, M.S.; Zanobetti, A.; Schwartz, J. Modifiers of the temperature and mortality association in seven US cities. Am. J. Epidemiol. 2003, 157, 1074–1082. [Google Scholar] [CrossRef] [PubMed] [Green Version]
- Huang, Z.; Lin, H.; Liu, Y.; Zhou, M.; Liu, T.; Xiao, J.; Zeng, W.; Li, X.; Zhang, Y.; Ebi, K.L.; et al. Individual-level and community-level effect modifiers of the temperature-mortality relationship in 66 Chinese communities. BMJ Open 2015, 5, e009172. [Google Scholar] [CrossRef] [PubMed] [Green Version]
- Sun, S.; Tian, L.; Qiu, H.; Chan, K.P.; Tsang, H.; Tang, R.; Lee, R.S.Y.; Thach, T.Q.; Wong, C.M. The influence of pre-existing health conditions on short-term mortality risks of temperature: Evidence from a prospective Chinese elderly cohort in Hong Kong. Environ. Res. 2016, 148, 7–14. [Google Scholar] [CrossRef] [PubMed] [Green Version]
- Bosma, H.; Van De Mheen, H.D.; Borsboom, G.J.J.M.; Mackenbach, J.P. Neighborhood socioeconomic status and all-cause mortality. Am. J. Epidemiol. 2001, 153, 363–371. [Google Scholar] [CrossRef] [Green Version]
- Bethea, T.N.; Palmer, J.R.; Rosenberg, L.; Cozier, Y.C. Neighborhood Socioeconomic Status in Relation to All-Cause, Cancer, and Cardiovascular Mortality in the Black Women’s Health Study. Ethn. Dis. 2016, 26, 157–164. [Google Scholar] [CrossRef] [Green Version]
- Kim, D.; Glazier, R.H.; Zagorski, B.; Kawachi, I.; Oreopoulos, P. Neighbourhood socioeconomic position and risks of major chronic diseases and all-cause mortality: A quasi-experimental study. BMJ Open 2018, 8, 18793. [Google Scholar] [CrossRef] [PubMed] [Green Version]
- Gouveia, N.; Hajat, S.; Armstrong, B. Socioeconomic differentials in the temperature–mortality relationship in São Paulo, Brazil. Int. J. Epidemiol. 2003, 32, 390–397. [Google Scholar] [CrossRef] [PubMed] [Green Version]
- Marí-Dell’Olmo, M.; Tobías, A.; Gómez-Gutiérrez, A.; Rodríguez-Sanz, M.; García de Olalla, P.; Camprubí, E.; Gasparrini, A.; Borrell, C. Social inequalities in the association between temperature and mortality in a South European context. Int. J. Public Health 2019, 64, 27–37. [Google Scholar] [CrossRef] [PubMed]
- Ma, W.; Chen, R.; Kan, H. Temperature-related mortality in 17 large Chinese cities: How heat and cold affect mortality in China. Environ. Res. 2014, 134, 127–133. [Google Scholar] [CrossRef] [PubMed]
- Brooke Anderson, G.; Bell, M.L. Heat waves in the United States: Mortality risk during heat waves and effect modification by heat wave characteristics in 43 U.S. communities. Environ. Health Perspect. 2011, 119, 210–218. [Google Scholar] [CrossRef] [PubMed] [Green Version]
- Basu, R.; Ostro, B.D. A multicounty analysis identifying the populations vulnerable to mortality associated with high ambient temperature in California. Am. J. Epidemiol. 2008, 168, 632–637. [Google Scholar] [CrossRef]
- Hong Kong Census and Statistics Department. 2016 Population By-census: Thematic Report : Household Income Distribution in Hong Kong; Hong Kong Census and Statistics Department: Hong Kong SAR, China, 2017. [Google Scholar]
- Chalabi, Z.; Erens, B.; Hajat, S.; Heffernan, C.; Jones, L.; Mays, N.; Ritchie, B.; Wilkinson, P. Evaluation of the Implementation and Health-Related Impacts of the Cold Weather Plan for England 2012 Final Report; Policy Innovation Research Unit: London, UK, 2015. [Google Scholar]
- WHO. Health Emergency and Disaster Risk Management Framework; WHO: Geneva, Switzerland, 2019. [Google Scholar]
- Chan, E.Y.Y.; Goggins, W.B.; Kim, J.J.; Griffiths, S.M. A study of intracity variation of temperature-related mortality and socioeconomic status among the Chinese population in Hong Kong. J. Epidemiol. Community Health 2012, 66, 322–327. [Google Scholar] [CrossRef] [Green Version]
- Ding, Z.; Li, L.; Wei, R.; Dong, W.; Guo, P.; Yang, S.; Liu, J.; Zhang, Q. Association of cold temperature and mortality and effect modification in the subtropical plateau monsoon climate of Yuxi, China. Environ Res. 2016, 150, 431–437. [Google Scholar] [CrossRef]
- Aylin, P.; Morris, S.; Wakefield, J.; Grossinho, A.; Jarup, L.; Elliott, P. Temperature, housing, deprivation and their relationship to excess winter mortality in Great Britain, 1986–1996. Int. J. Epidemiol. 2001, 30, 1100–1108. [Google Scholar] [CrossRef] [Green Version]
- Li, V.O.; Han, Y.; Lam, J.C.; Zhu, Y.; Bacon-Shone, J. Air pollution and environmental injustice: Are the socially deprived exposed to more PM2.5 pollution in Hong Kong? Environ. Sci. Policy 2018, 80, 53–61. [Google Scholar] [CrossRef]
- Wong, C.M.; Ou, C.Q.; Chan, K.P.; Chau, Y.K.; Thach, T.Q.; Yang, L.; Chung, R.Y.N.; Thomas, G.N.; Peiris, J.S.M.; Wong, T.W.; et al. The effects of air pollution on mortality in socially deprived urban areas in Hong Kong, China. Environ Health Perspect. 2008, 116, 1189–1194. [Google Scholar] [CrossRef] [PubMed] [Green Version]
- Yu, W.; Vaneckova, P.; Mengersen, K.; Pan, X.; Tong, S. Is the association between temperature and mortality modified by age, gender and socioeconomic status? Sci. Total Environ. 2010, 408, 3513–3518. [Google Scholar] [CrossRef] [PubMed]
- Gasparrini, A.; Guo, Y.; Hashizume, M.; Lavigne, E.; Zanobetti, A.; Schwartz, J.; Tobias, A.; Tong, S.; Rocklöv, J.; Forsberg, B.; et al. Mortality risk attributable to high and low ambient temperature: A multicountry observational study. Lancet 2015, 386, 369–375. [Google Scholar] [CrossRef]
- Guo, Y.; Barnett, A.G.; Pan, X.; Yu, W.; Tong, S. The impact of temperature on mortality in Tianjin, china: A case-crossover design with a distributed lag nonlinear model. Environ. Health Perspect. 2011, 119, 1719–1725. [Google Scholar] [CrossRef] [Green Version]
- Yang, J.; Ou, C.Q.; Ding, Y.; Zhou, Y.X.; Chen, P.Y. Daily temperature and mortality: A study of distributed lag non-linear effect and effect modification in Guangzhou. Environ. Health A Glob. Access Sci. Source 2012, 11, 63. [Google Scholar] [CrossRef] [Green Version]
- Gasparrini, A. Modeling exposure-lag-response associations with distributed lag non-linear models. Stat. Med. 2014, 33, 881–899. [Google Scholar] [CrossRef] [Green Version]
- Wood, S.N. Generalized Additive Models: An Introduction with R, 2nd ed.; CRC Press: Boca Raton, FL, USA, 2017; ISBN 9781498728348. [Google Scholar]
- Anderson, B.G.; Bell, M.L. Weather-related mortality: How heat, cold, and heat waves affect mortality in the United States. Epidemiology 2009, 20, 205–213. [Google Scholar] [CrossRef] [Green Version]
- Guo, Y.; Gasparrini, A.; Armstrong, B.; Li, S.; Tawatsupa, B.; Tobias, A.; Lavigne, E.; de Sousa Zanotti Stagliorio Coelho, M.; Leone, M.; Pan, X.; et al. Global variation in the effects of ambient temperature on mortality: A systematic evaluation. Epidemiology 2014, 25, 781–789. [Google Scholar] [CrossRef] [Green Version]
- Son, J.Y.; Gouveia, N.; Bravo, M.A.; de Freitas, C.U.; Bell, M.L. The impact of temperature on mortality in a subtropical city: Effects of cold, heat, and heat waves in São Paulo, Brazil. Int. J. Biometeorol. 2016, 60, 113–121. [Google Scholar] [CrossRef] [Green Version]
- Ma, W.; Wang, L.; Lin, H.; Liu, T.; Zhang, Y.; Rutherford, S.; Luo, Y.; Zeng, W.; Zhang, Y.; Wang, X.; et al. The temperature-mortality relationship in China: An analysis from 66 Chinese communities. Environ. Res. 2015, 137, 72–77. [Google Scholar] [CrossRef]
- Iñiguez, C.; Ballester, F.; Ferrandiz, J.; Pérez-Hoyos, S.; Sáez, M.; López, A. Tempro-Emecas Relation between temperature and mortality in thirteen Spanish cities. Int. J. Environ. Res. Public Health 2010, 7, 3196–3210. [Google Scholar] [CrossRef] [PubMed]
- Bobb, J.F.; Peng, R.D.; Bell, M.L.; Dominici, F. Heat-related mortality and adaptation to heat in the United States. Environ. Health Perspect. 2014, 122, 811–816. [Google Scholar] [CrossRef] [PubMed]
- Barreca, A.; Clay, K.; Deschênes, O.; Greenstone, M.; Shapiro, J.S. Convergence in adaptation to climate change: Evidence from high temperatures and mortality, 1900–2004. Am. Econ. Rev. 2015, 105, 247–251. [Google Scholar] [CrossRef] [Green Version]
- Ballester, J.; Robine, J.M.; Herrmann, F.R.; Rodó, X. Long-term projections and acclimatisation scenarios of temperature-related mortality in Europe. Nat. Commun. 2011, 2, 358. [Google Scholar] [CrossRef] [PubMed] [Green Version]
- Hajat, S.; Vardoulakis, S.; Heaviside, C.; Eggen, B. Climate change effects on human health: Projections of temperature-related mortality for the UK during the 2020s, 2050s and 2080s. J. Epidemiol. Community Health 2014, 68, 641–648. [Google Scholar] [CrossRef] [Green Version]
- Gasparrini, A.; Guo, Y.; Sera, F.; Vicedo-Cabrera, A.M.; Huber, V.; Tong, S.; de Sousa Zanotti Stagliorio Coelho, M.; Nascimento Saldiva, P.H.; Lavigne, E.; Matus Correa, P.; et al. Projections of temperature-related excess mortality under climate change scenarios. Lancet Planet. Health 2017, 1, e360–e367. [Google Scholar] [CrossRef]
- Guo, Y.; Li, S.; Liu, D.L.; Chen, D.; Williams, G.; Tong, S. Projecting future temperature-related mortality in three largest Australian cities. Environ. Pollut. 2016, 208, 66–73. [Google Scholar] [CrossRef]
- Wu, W.; Xiao, Y.; Li, G.; Zeng, W.; Lin, H.; Rutherford, S.; Xu, Y.; Luo, Y.; Xu, X.; Chu, C.; et al. Temperature-mortality relationship in four subtropical Chinese cities: A time-series study using a distributed lag non-linear model. Sci. Total Environ. 2013, 449, 355–362. [Google Scholar] [CrossRef]
- Basu, R. High ambient temperature and mortality: A review of epidemiologic studies from 2001 to 2008. Environ. Health Glob. Access Sci. Source 2009, 8, 40. [Google Scholar] [CrossRef] [Green Version]
- Madrigano, J.; Mittleman, M.A.; Baccarelli, A.; Goldberg, R.; Melly, S.; Von Klot, S.; Schwartz, J. Temperature, myocardial infarction, and mortality: Effect modification by individual-and area-level characteristics. Epidemiology 2013, 24, 439–446. [Google Scholar] [CrossRef]
- Tim Wong, L. Tiny affordable housing in Hong Kong. Indoor Built Environ. 2018, 27, 1159–1161. [Google Scholar] [CrossRef] [Green Version]
- Goggins, W.B.; Chan, E.Y.Y.Y.; Ng, E.; Ren, C.; Chen, L. Effect modification of the association between short-term meteorological factors and mortality by urban heat islands in Hong Kong. PLoS ONE 2012, 7, e38551. [Google Scholar] [CrossRef] [PubMed] [Green Version]
- Yang, J.; Bou-Zeid, E. Should cities embrace their heat islands as shields from extreme cold? J. Appl. Meteorol. Clim. 2018, 57, 1309–1320. [Google Scholar] [CrossRef]
- Goggins, W.B.; Chan, E.Y. A study of the short-term associations between hospital admissions and mortality from heart failure and meteorological variables in Hong Kong: Weather and heart failure in Hong Kong. Int. J. Cardiol. 2017, 228, 537–542. [Google Scholar] [CrossRef]
- Shiue, I.; Shiue, M. Indoor temperature below 18 °C accounts for 9% population attributable risk for high blood pressure in Scotland. Int. J. Cardiol. 2014, 171, e1. [Google Scholar] [CrossRef]
- Saeki, K.; Obayashi, K.; Iwamoto, J.; Tanaka, Y.; Tanaka, N.; Takata, S.; Kubo, H.; Okamoto, N.; Tomioka, K.; Nezu, S.; et al. Influence of room heating on ambulatory blood pressure in winter: A randomised controlled study. J. Epidemiol. Community Health 2013, 67, 484–490. [Google Scholar] [CrossRef]
- Brown, H.K.; Simpson, A.J.; Murchison, J.T. The influence of meteorological variables on the development of deep venous thrombosis. Thromb. Haemost. 2009, 102, 676–682. [Google Scholar] [CrossRef]
- Huynen, M.M.T.E.; Martens, P.; Schram, D.; Weijenberg, M.P.; Kunst, A.E. The impact of heat waves and cold spells on mortality rates in the Dutch population. Environ. Health Perspect. 2001, 109, 463–470. [Google Scholar] [CrossRef]
- Clark, L.P.; Millet, D.B.; Marshall, J.D. National patterns in environmental injustice and inequality: Outdoor NO2 air pollution in the United States. PLoS ONE 2014, 9, e94431. [Google Scholar] [CrossRef]
- Pearce, J.R.; Richardson, E.A.; Mitchell, R.J.; Shortt, N.K. Environmental justice and health: The implications of the socio-spatial distribution of multiple environmental deprivation for health inequalities in the United Kingdom. Trans. Inst. Br. Geogr. 2010, 35, 522–539. [Google Scholar] [CrossRef] [Green Version]
- Hoek, G.; Krishnan, R.M.; Beelen, R.; Peters, A.; Ostro, B.; Brunekreef, B.; Kaufman, J.D. Long-term air pollution exposure and cardio-respiratory mortality: A review. Environ. Health Glob. Access Sci. Source 2013, 12, 43. [Google Scholar] [CrossRef] [PubMed] [Green Version]
- Shang, Y.; Sun, Z.; Cao, J.; Wang, X.; Zhong, L.; Bi, X.; Li, H.; Liu, W.; Zhu, T.; Huang, W. Systematic review of Chinese studies of short-term exposure to air pollution and daily mortality. Environ. Int. 2013, 54, 100–111. [Google Scholar] [CrossRef] [PubMed]
- Meng, X.; Zhang, Y.; Zhao, Z.; Duan, X.; Xu, X.; Kan, H. Temperature modifies the acute effect of particulate air pollution on mortality in eight Chinese cities. Sci. Total Environ. 2012, 435–436, 215–221. [Google Scholar] [CrossRef] [PubMed]
- Stafoggia, M.; Schwartz, J.; Forastiere, F.; Perucci, C.A. Does temperature modify the association between air pollution and mortality? A multi-city case-crossover analysis in Italy. Am. J. Epidemiol. 2008, 167, 1476–1485. [Google Scholar] [CrossRef] [Green Version]
- Sharma, A.; Sharma, T.; Panwar, M.S.; Sharma, D.; Bundel, R.; Hamilton, R.T.; Radosevich, J.A.; Mandal, C.C. Colder environments are associated with a greater cancer incidence in the female population of the United States. Tumor Biol. 2017, 39, 1–12. [Google Scholar] [CrossRef] [Green Version]
- Sharma, A.; Verma, H.K.; Joshi, S.; Panwar, M.S.; Mandal, C.C. A link between cold environment and cancer. Tumor Biol. 2015, 36, 5953–5964. [Google Scholar] [CrossRef]
- Bandyopadhayaya, S.; Ford, B.; Mandal, C.C. Cold-hearted: A case for cold stress in cancer risk. J. Biol. 2020, 91, 102608. [Google Scholar] [CrossRef]
- Singh, G.K.; Jemal, A. Socioeconomic and Racial/Ethnic Disparities in Cancer Mortality, Incidence, and Survival in the United States, 1950-2014: Over Six Decades of Changing Patterns and Widening Inequalities. J. Environ. Public Health 2017. [Google Scholar] [CrossRef]
- Kim, C.W.; Lee, S.Y.; Moon, O.R. Inequalities in cancer incidence and mortality across income groups and policy implications in South Korea. Public Health 2008, 122, 229–236. [Google Scholar] [CrossRef]
- Yang, J.; Yin, P.; Zhou, M.; Ou, C.Q.; Li, M.; Liu, Y.; Gao, J.; Chen, B.; Liu, J.; Bai, L.; et al. The effect of ambient temperature on diabetes mortality in China: A multi-city time series study. Sci. Total Environ. 2016, 543, 75–82. [Google Scholar] [CrossRef]
- Li, J.; Xu, X.; Yang, J.; Liu, Z.; Xu, L.; Gao, J.; Liu, X.; Wu, H.; Wang, J.; Yu, J.; et al. Ambient high temperature and mortality in Jinan, China: A study of heat thresholds and vulnerable populations. Environ. Res. 2017, 156, 657–664. [Google Scholar] [CrossRef]
- Onozuka, D.; Hagihara, A. Variation in vulnerability to extreme-temperature-related mortality in Japan: A 40-year time-series analysis. Environ. Res. 2015, 140, 177–184. [Google Scholar] [CrossRef] [PubMed]
- Khare, S.; Hajat, S.; Kovats, S.; Lefevre, C.E.; De Bruin, W.B.; Dessai, S.; Bone, A. Heat protection behaviour in the UK: Results of an online survey after the 2013 heatwave. BMC Public Health 2015, 15, 878. [Google Scholar] [CrossRef] [PubMed] [Green Version]
- Lee, W.K.M. Women and Retirement Planning: Towards the “Feminization of Poverty” in an Aging Hong Kong. J. Women Aging 2003, 15, 31–53. [Google Scholar] [CrossRef] [PubMed]
- Lam, H.C.Y.; Huang, Z.; Liu, S.; Guo, C.; Goggins, W.B.; Chan, E.Y.Y. Personal cold protection behaviour and its associated factors in 2016/17 cold days in Hong Kong: A two-year cohort telephone survey study. Int. J. Environ. Res. Public Health 2020, 17, 1672. [Google Scholar] [CrossRef] [Green Version]
- Hong Kong Home Affairs Department Public Services–Emergency Relief Services. Available online: https://www.had.gov.hk/en/public_services/emergency_services/emergency.htm (accessed on 26 July 2020).


| Percentile | ||||||||
|---|---|---|---|---|---|---|---|---|
| Variables | Mean | Min | 5th | 25th | 50th | 75th | 95th | Max |
| Mean Temperature (°C) | 23.5 | 8.4 | 14.2 | 19.2 | 24.7 | 28.1 | 30.0 | 32.4 |
| Mean Relative Humidity (%) | 78.1 | 29.0 | 58.0 | 73.0 | 79.0 | 85.0 | 95.0 | 99.0 |
| Atmospheric pressure (hPa) | 1012.7 | 992.2 | 1002.6 | 1007.9 | 1012.7 | 1017.7 | 1023.1 | 1029.8 |
| NO2 (μg/m3) | 41.2 | 11.4 | 28.2 | 38.3 | 48.4 | 61 | 83.8 | 152.5 |
| O3 (μg/m3) | 51.2 | 4.9 | 13.6 | 21.7 | 36.9 | 56.1 | 85.4 | 139.3 |
| SO2 (μg/m3) | 13.9 | 3.2 | 5.6 | 8.4 | 11.8 | 16.9 | 28.9 | 80.6 |
| PM2.5 (μg/m3) | 31.4 | 4.9 | 9.2 | 15.8 | 27.5 | 42.5 | 67.5 | 138.5 |
| SES Groups | Percentile | |||||||
|---|---|---|---|---|---|---|---|---|
| Min | 5th | 25th | 50th | 75th | 95th | Max | Total | |
| One—Highest SES | 0 | 4 | 7 | 9 | 11 | 15 | 26 | 30,169 |
| Two | 3 | 10 | 14 | 18 | 21 | 26 | 38 | 63,808 |
| Three | 6 | 23 | 30 | 34 | 39 | 47 | 67 | 125,750 |
| Four—Lowest SES | 14 | 34 | 42 | 48 | 55 | 67 | 92 | 143,230 |
| Total | 31 | 86 | 99 | 109 | 120 | 143 | 192 | 362,957 |
| Non-Accidental | Cardiovascular | Respiratory | Cancer | |||||
|---|---|---|---|---|---|---|---|---|
| SES Group | Cold | Heat | Cold | Heat | Cold | Heat | Cold | Heat |
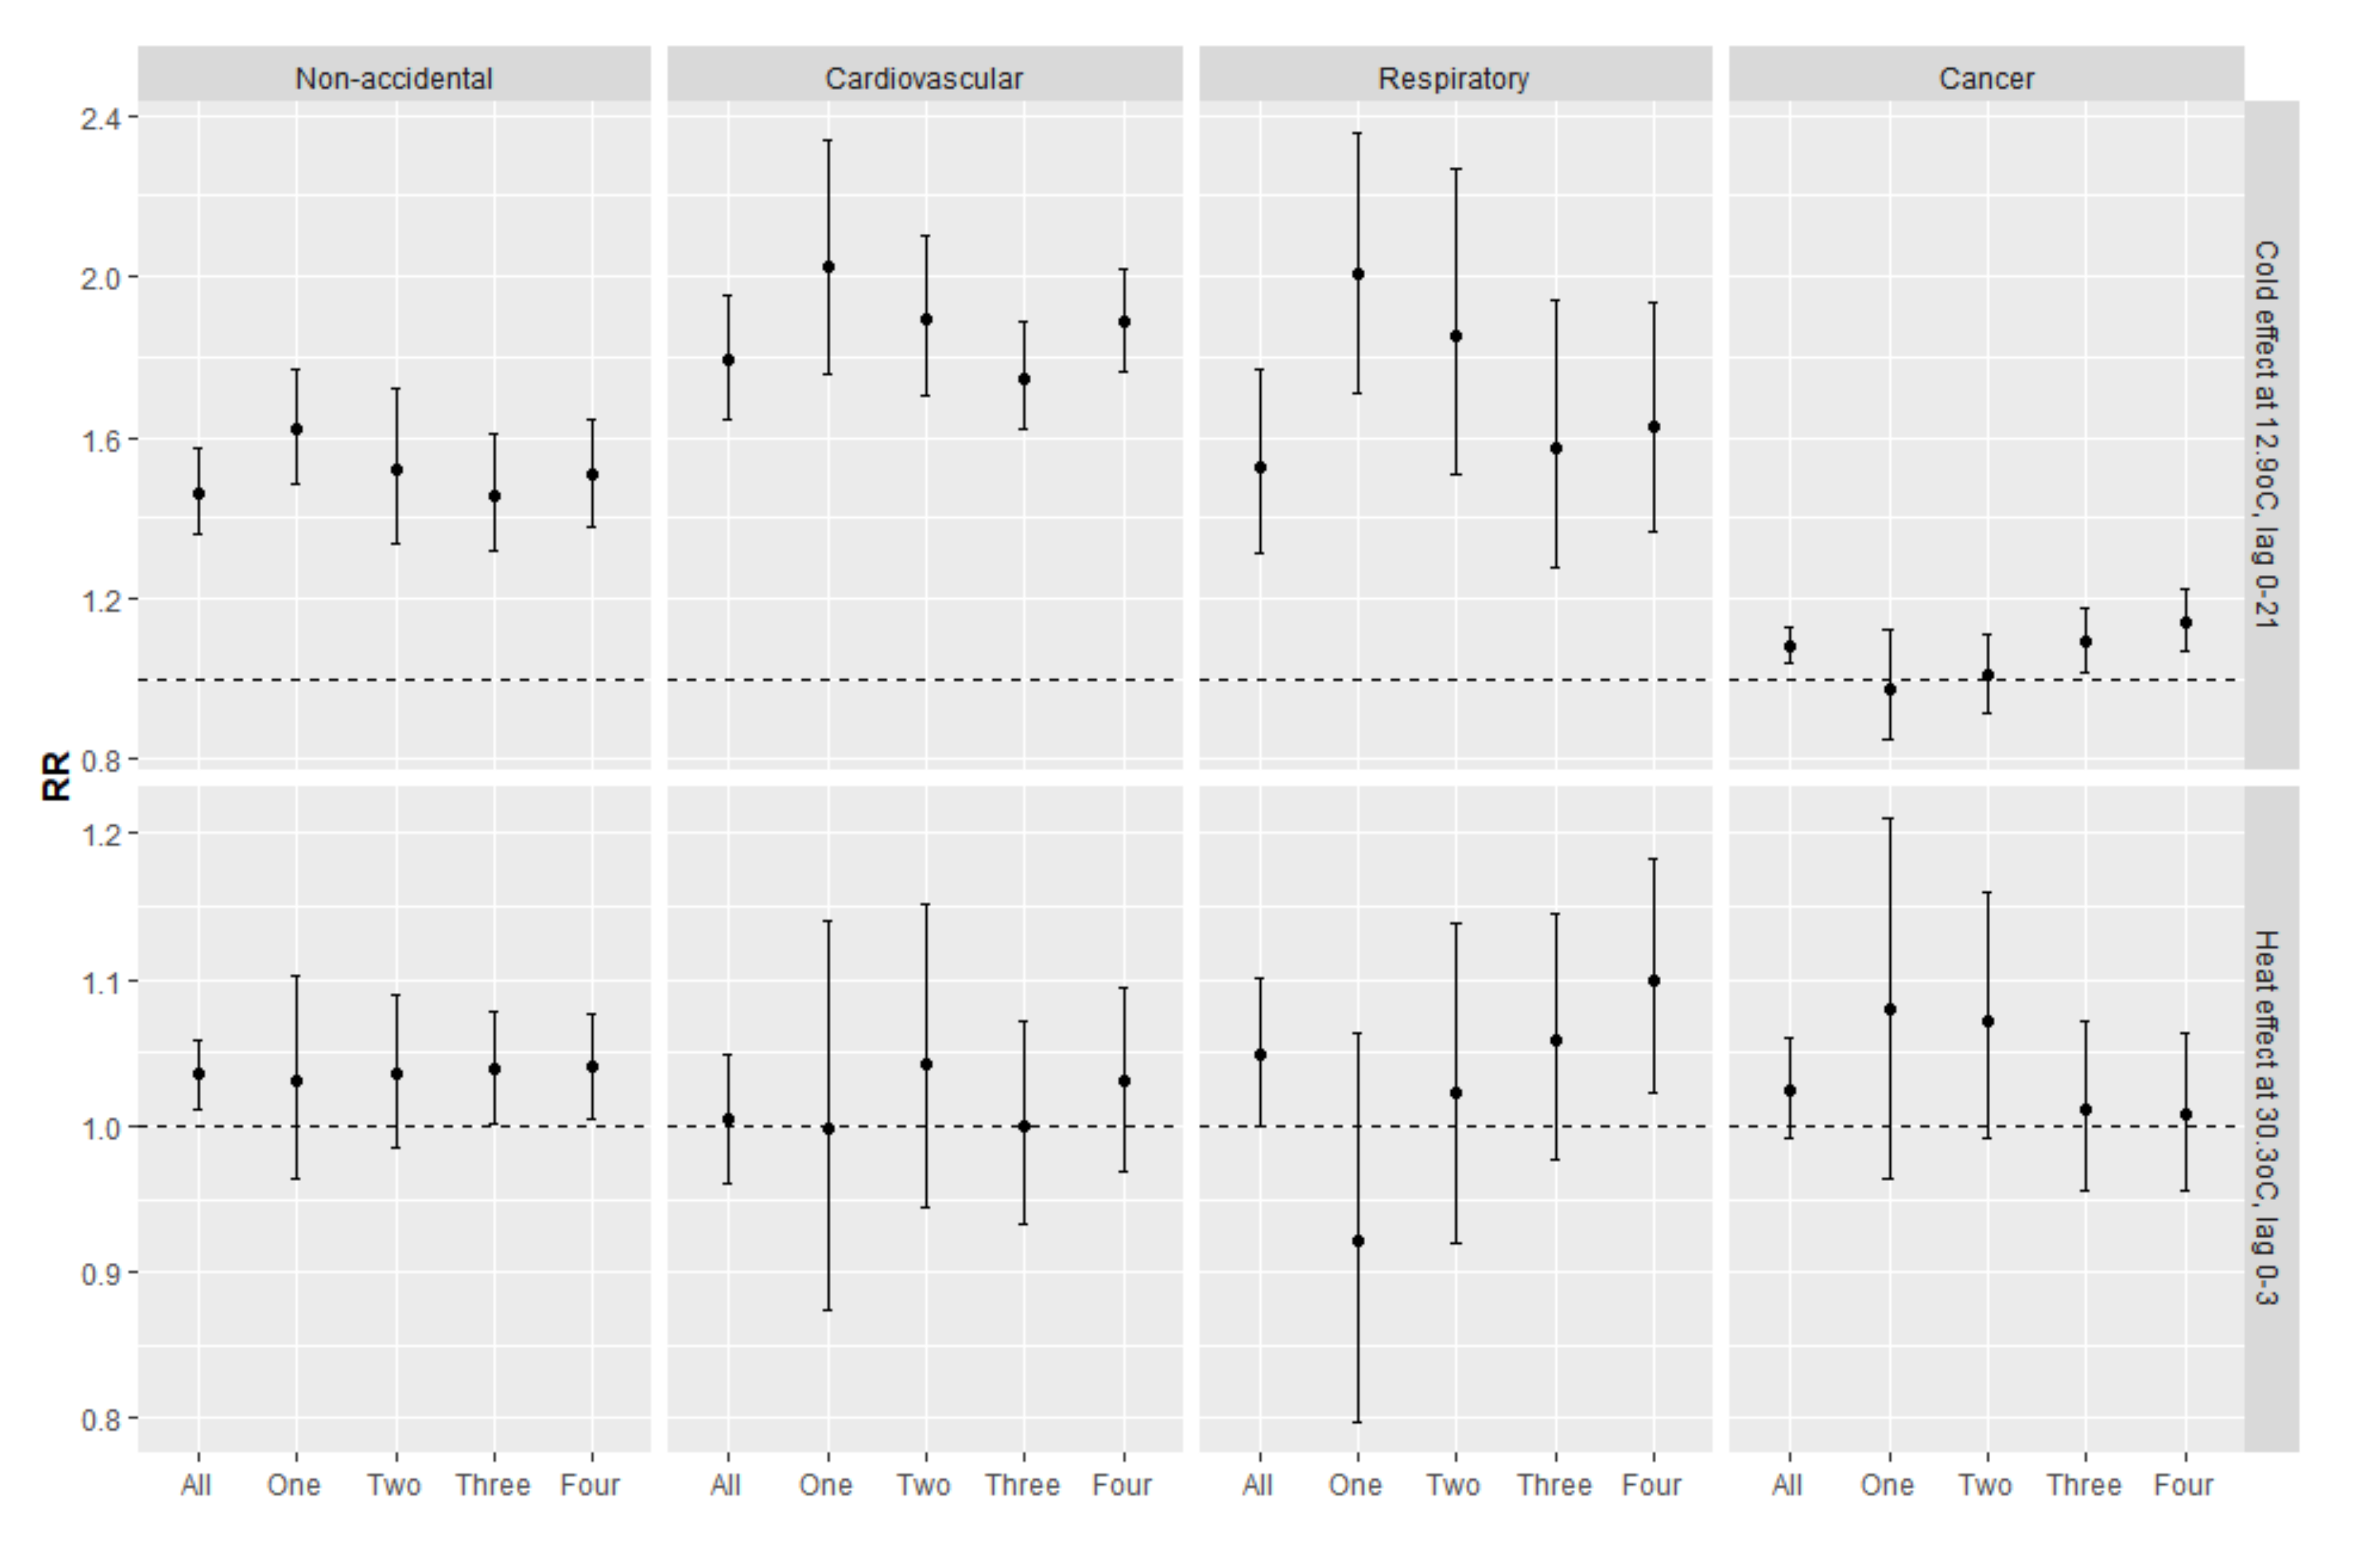
| One | 1.622 * (1.485, 1.771) | 1.031 (0.964, 1.103) | 2.026 * (1.755, 2.339) | 0.998 (0.874, 1.140) | 2.009 * (1.713, 2.356) | 0.921 (0.797, 1.064) | 0.976 (0.850, 1.121) | 1.080 (0.964, 1.211) |
| Two | 1.518 * (1.337, 1.723) | 1.036 (0.985, 1.089) | 1.893 * (1.707, 2.100) | 1.043 (0.945, 1.152) | 1.851 * (1.510, 2.268) | 1.023 (0.920, 1.138) | 1.009 (0.916, 1.111) | 1.072 (0.991, 1.160) |
| Three | 1.457 * (1.320, 1.607) | 1.039 * (1.001, 1.078) | 1.748 * (1.619, 1.888) | 1.000 (0.933, 1.071) | 1.575 * (1.278, 1.940) | 1.058 (0.977, 1.145) | 1.094 (1.018, 1.176) | 1.012 (0.956, 1.071) |
| Four | 1.506 * (1.378, 1.645) | 1.040* (1.005, 1.076) | 1.888 * (1.764, 2.019) | 1.030 (0.969, 1.095) | 1.626 * (1.364, 1.938) | 1.099 * (1.022, 1.182) | 1.142 * (1.068, 1.223) | 1.008 (0.955, 1.064) |
| All | 1.463 * (1.362, 1.571) | 1.035 * (1.011, 1.059) | 1.794 * (1.645, 1.955) | 1.004 (0.961, 1.048) | 1.525 * (1.312, 1.772) | 1.049 * (0.999, 1.101) | 1.081 * (1.037, 1.127) | 1.025 (0.991, 1.060) |
© 2020 by the authors. Licensee MDPI, Basel, Switzerland. This article is an open access article distributed under the terms and conditions of the Creative Commons Attribution (CC BY) license (http://creativecommons.org/licenses/by/4.0/).
Share and Cite
Liu, S.; Chan, E.Y.Y.; Goggins, W.B.; Huang, Z. The Mortality Risk and Socioeconomic Vulnerability Associated with High and Low Temperature in Hong Kong. Int. J. Environ. Res. Public Health 2020, 17, 7326. https://0-doi-org.brum.beds.ac.uk/10.3390/ijerph17197326
Liu S, Chan EYY, Goggins WB, Huang Z. The Mortality Risk and Socioeconomic Vulnerability Associated with High and Low Temperature in Hong Kong. International Journal of Environmental Research and Public Health. 2020; 17(19):7326. https://0-doi-org.brum.beds.ac.uk/10.3390/ijerph17197326
Chicago/Turabian StyleLiu, Sida, Emily Yang Ying Chan, William Bernard Goggins, and Zhe Huang. 2020. "The Mortality Risk and Socioeconomic Vulnerability Associated with High and Low Temperature in Hong Kong" International Journal of Environmental Research and Public Health 17, no. 19: 7326. https://0-doi-org.brum.beds.ac.uk/10.3390/ijerph17197326