A Low-Intensity Internet-Based Intervention Focused on the Promotion of Positive Affect for the Treatment of Depression in Spanish Primary Care: Secondary Analysis of a Randomized Controlled Trial

 , , , , , and
Abstract
:1. Introduction
2. Materials and Methods
2.1. Study Design
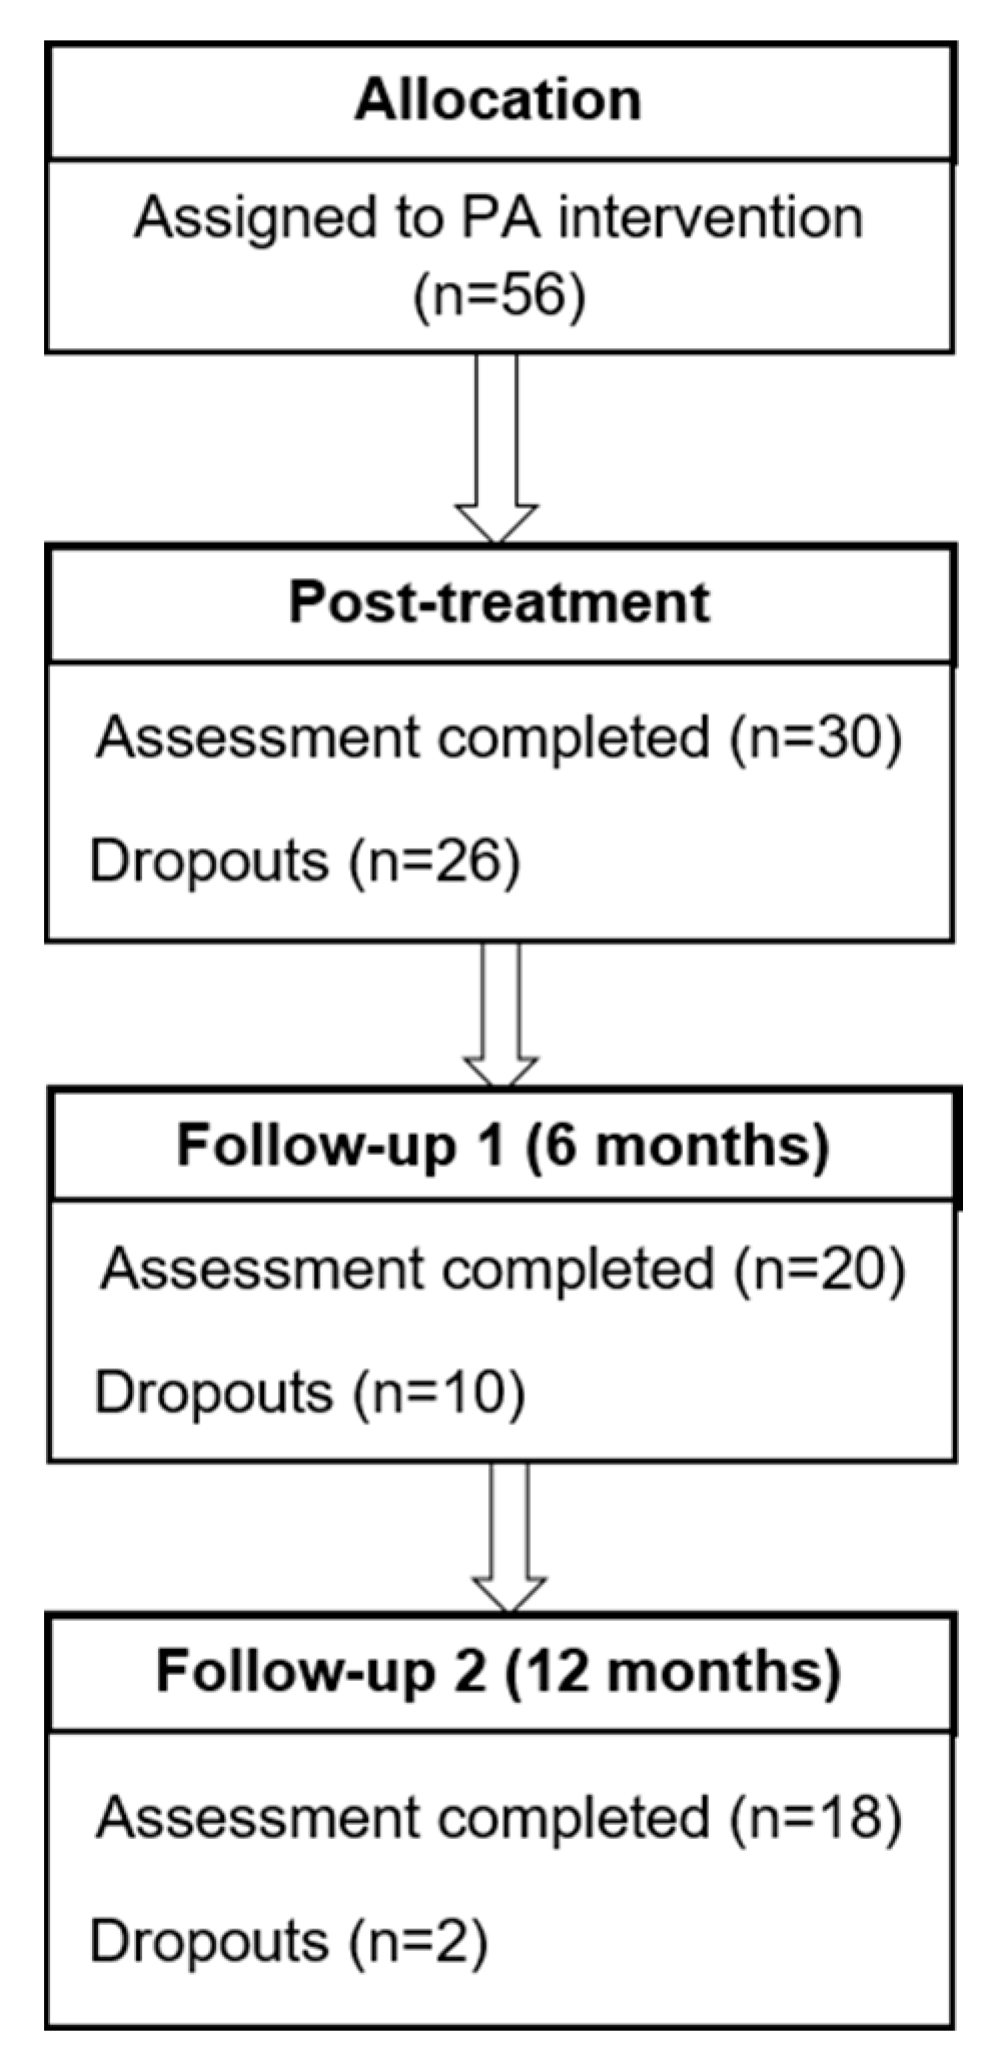
2.2. Participants
2.3. Interventions
2.3.1. Low-Intensity Internet-Based Computerized Intervention (IBI) Focused on the Promotion of PA
2.3.2. iTAU
2.4. Measures
2.4.1. Primary Outcome Measure
2.4.2. Secondary Outcomes Measures
2.4.3. Screening Related Measures
2.5. Procedure
2.6. Data Analyses
3. Results
3.1. Sociodemographic Characteristics of the Sample
3.2. Primary and Secondary Outcome Scores at Pre-Treatment, Post-Treatment, and 6- and 12-Month Follow-Ups
3.3. Sociodemographic Variables and Pre-Treatment Scores as Predictors of the Changes in Primary and Secondary Outcomes in the PA Intervention
3.4. Change in Depression Severity and PA and NA as Predictors of Change in Well-Being, Mental and Physical Health, and Health Status
4. Discussion
5. Conclusions
Author Contributions
Funding
Acknowledgments
Conflicts of Interest
References
- Kessler, R.C. The Costs of Depression. Psychiatr. Clin. N. Am. 2012, 35, 1–14. [Google Scholar] [CrossRef] [Green Version]
- Mrazek, D.A.; Hornberger, J.C.; Altar, C.A.; Degtiar, I. A Review of the Clinical, Economic, and Societal Burden of Treatment-Resistant Depression: 1996–2013. Psychiatr. Serv. 2014, 65, 977–987. [Google Scholar] [CrossRef] [PubMed]
- Roca, M.; Gili, M.; García-García, M.; Salva, J.; Vives, M.; Campayo, J.G.; Comas, A. Prevalence and comorbidity of common mental disorders in primary care. J. Affect. Disord. 2009, 119, 52–58. [Google Scholar] [CrossRef] [PubMed]
- Cuijpers, P.; Van Straten, A.; Andersson, G.; Van Oppen, P. Psychotherapy for depression in adults: A meta-analysis of comparative outcome studies. J. Consult. Clin. Psychol. 2008, 76, 909–922. [Google Scholar] [CrossRef] [PubMed]
- Cuijpers, P.; Beekman, A.T.F.; Reynolds, C.F. Preventing Depression. JAMA 2012, 307, 1033–1034. [Google Scholar] [CrossRef] [PubMed]
- Craven, M.; Bland, R. Depression in Primary Care: Current and Future Challenges. Can. J. Psychiatry 2013, 58, 442–448. [Google Scholar] [CrossRef] [Green Version]
- Al-Harbi, K.S. Treatment-resistant depression: Therapeutic trends, challenges, and future directions. Patient Prefer Adher 2012, 6, 369–388. [Google Scholar] [CrossRef] [PubMed] [Green Version]
- Cuijpers, P.; Karyotaki, E.; Weitz, E.; Andersson, G.; Hollon, S.D.; Van Straten, A. The effects of psychotherapies for major depression in adults on remission, recovery and improvement: A meta-analysis. J. Affect. Disord. 2014, 159, 118–126. [Google Scholar] [CrossRef] [PubMed]
- Linde, K.; Sigterman, K.; Kriston, L.; Rücker, G.; Jamil, S.; Meissner, K.; Schneider, A. Effectiveness of Psychological Treatments for Depressive Disorders in Primary Care: Systematic Review and Meta-Analysis. Ann. Fam. Med. 2015, 13, 56–68. [Google Scholar] [CrossRef] [Green Version]
- Carl, J.R.; Soskin, D.P.; Kerns, C.; Barlow, D.H. Positive emotion regulation in emotional disorders: A theoretical review. Clin. Psychol. Rev. 2013, 33, 343–360. [Google Scholar] [CrossRef]
- Ruini, C. Positive Psychology in the Clinical Domains; Springer Science and Business Media LLC: Berlin/Heidelberg, Germany, 2017. [Google Scholar]
- Watson, D.; Naragon-Gainey, K. On the specificity of positive emotional dysfunction in psychopathology: Evidence from the mood and anxiety disorders and schizophrenia/schizotypy. Clin. Psychol. Rev. 2010, 30, 839–848. [Google Scholar] [CrossRef] [Green Version]
- Werner-Seidler, A.; Banks, R.; Dunn, B.D.; Moulds, M.L. An investigation of the relationship between positive affect regulation and depression. Behav. Res. Ther. 2013, 51, 46–56. [Google Scholar] [CrossRef]
- Pressman, S.D.; Jenkins, B.N.; Moskowitz, J.T. Positive Affect and Health: What Do We Know and Where Next Should We Go? Annu. Rev. Psychol. 2019, 70, 627–650. [Google Scholar] [CrossRef]
- Dalgleish, T.; Black, M.; Johnston, D.; Bevan, A. Transdiagnostic approaches to mental health problems: Current status and future directions. J. Consult. Clin. Psychol. 2020, 88, 179–195. [Google Scholar] [CrossRef]
- Gray, J.A. Précis ofThe neuropsychology of anxiety: An enquiry into the functions of the septo-hippocampal system. Behav. Brain Sci. 1982, 5, 469–484. [Google Scholar] [CrossRef] [Green Version]
- Watson, D.; Wiese, D.; Vaidya, J.; Tellegen, A. The two general activation systems of affect: Structural findings, evolutionary considerations, and psychobiological evidence. J. Pers. Soc. Psychol. 1999, 76, 820–838. [Google Scholar] [CrossRef]
- Seligman, M.E.; Csikszentmihalyi, M. Special issue on happiness, excellence, and optimal human functioning. Am. Psychol. 2000, 55, 5–183. [Google Scholar] [CrossRef] [PubMed]
- Sin, N.L.; Lyubomirsky, S. Enhancing well-being and alleviating depressive symptoms with positive psychology interventions: A practice-friendly meta-analysis. J. Clin. Psychol. 2009, 65, 467–487. [Google Scholar] [CrossRef] [Green Version]
- Bolier, L.; Haverman, M.; Westerhof, G.J.; Riper, H.; Smit, F.; Bohlmeijer, E. Positive psychology interventions: A meta-analysis of randomized controlled studies. BMC Public Health 2013, 13, 119. [Google Scholar] [CrossRef] [Green Version]
- Weiss, L.A.; Westerhof, G.J.; Bohlmeijer, E.T. Can We Increase Psychological Well-Being? The Effects of Interventions on Psychological Well-Being: A Meta-Analysis of Randomized Controlled Trials. PLoS ONE 2016, 11, e0158092. [Google Scholar] [CrossRef]
- Chakhssi, F.; Kraiss, J.T.; Sommers-Spijkerman, M.; Bohlmeijer, E.T. The effect of positive psychology interventions on well-being and distress in clinical samples with psychiatric or somatic disorders: A systematic review and meta-analysis. BMC Psychiatry 2018, 18, 1–17. [Google Scholar] [CrossRef] [Green Version]
- Johnson, J.; Wood, A.M. Integrating Positive and Clinical Psychology: Viewing Human Functioning as Continua from Positive to Negative Can Benefit Clinical Assessment, Interventions and Understandings of Resilience. Cogn. Ther. Res. 2015, 41, 335–349. [Google Scholar] [CrossRef] [Green Version]
- Wakida, E.K.; Talib, Z.; Akena, D.; Okello, E.S.; Kinengyere, A.; Mindra, A.; Obua, C. Barriers and facilitators to the integration of mental health services into primary health care: A systematic review. Syst. Rev. 2018, 7, 211. [Google Scholar] [CrossRef]
- Beck, J.S. Cognitive Therapy: Basics and Beyond; Guilford Press: New York, NY, USA, 1995. [Google Scholar]
- Weissman, M.M.; Markowitz, J.C.; Klerman, G.L. Comprehensive Guide to Interpersonal Psychotherapy; Basic Books: New York, NY, USA, 2000. [Google Scholar]
- Andrews, G.; Williams, A.D. Up-scaling clinician assisted internet cognitive behavioural therapy (iCBT) for depression: A model for dissemination into primary care. Clin. Psychol. Rev. 2015, 41, 40–48. [Google Scholar] [CrossRef]
- Castro, A.; Garcia-Palacios, A.; Campayo, J.G.; Mayoral, F.; Botella, C.; Garcia-Herrera, J.M.; Pérez-Yus, M.-C.; Vives, M.; Baños, R.; Roca, M.; et al. Efficacy of low-intensity psychological intervention applied by ICTs for the treatment of depression in primary care: A controlled trial. BMC Psychiatry 2015, 15, 1–10. [Google Scholar] [CrossRef] [Green Version]
- Gili, M.; Castro, A.; García-Palacios, A.; García-Campayo, J.; Mayoral-Cleries, F.; Botella, C.; Roca, M.; Barceló-Soler, A.; Hurtado, M.M.; Navarro, M.T.; et al. In primary care: Randomized Controlled Trial. J. Med. Internet Res. 2020, 22, e15845. [Google Scholar] [CrossRef]
- Diez-Quevedo, C.; Rangil, T.; Sanchez-Planell, L.; Kroenke, K.; Spitzer, R.L. Validation and Utility of the Patient Health Questionnaire in Diagnosing Mental Disorders in 1003 General Hospital Spanish Inpatients. Psychosom. Med. 2001, 63, 679–686. [Google Scholar] [CrossRef]
- Sheehan, D.V.; Lecrubier, Y.; Sheehan, K.H.; Amorim, P.; Janavs, J.; Weiller, E.; Hergueta, T.; Baker, R.; Dunbar, G.C. The Mini-International Neuropsychiatric Interview (M.I.N.I.): The development and validation of a structured diagnostic psychiatric interview for DSM-IV and ICD-10. J. Clin. Psychiatry 1998, 59, 22–33. [Google Scholar]
- Bobes, J. A Spanish validation study of the mini international neuropsychiatric interview. Eur. Psychiatry 1998, 13, 198S–199S. [Google Scholar] [CrossRef]
- García-Palacios, A.; Mira, A.; Mayoral, F.; Baños, R.M.; Botella, C. Psychological Intervention in Primary Care for Mild-Moderate Depression. Protocol for the Promotion of Positive Affect. Therapist’s Manual; Publications of the University Jaume I: Castellón de la Plana, Spain, 2017. (In Spanish) [Google Scholar]
- Fernández, A.; Haro, J.M.; Codony, M.; Vilagut, G.; Martinez-Alonso, M.; Autonell, J.; Salvador-Carulla, L.; Ayuso-Mateos, J.L.; Fullana, M.A.; Alonso, J. Treatment adequacy of anxiety and depressive disorders: Primary versus specialised care in Spain. J. Affect. Disord. 2006, 96, 9–20. [Google Scholar] [CrossRef]
- Kroenke, K.; Spitzer, R.L.; Williams, J.B. The PHQ-9: Validity of a brief depression severity measure. J. Gen. Intern. Med. 2001, 16, 606–613. [Google Scholar] [CrossRef] [PubMed]
- American Psychiatric Association. Diagnostic and Statistical Manual of Mental Disorders, Fourth Edition, Text Revision (DSM-IV-TR); Masson: Barcelona, Spain, 1995. [Google Scholar]
- Watson, D.; Clark, L.A.; Tellegen, A. Development and Validation of Brief Measures of Positive and Negative Affect: The PANAS Scales. J. Pers. Soc. Psychol. 1988, 54, 1063–1070. [Google Scholar] [CrossRef]
- Sandín, B.; Chorot, P.; Lostao, L.; Joiner, T.E.; Santed, M.A.; Valiente, R.M. Escalas PANAS de afecto positivo y negativo: Validación factorial y convergencia transcultural. Psicothema 1999, 11, 37–51. [Google Scholar]
- Hervás, G.; Vázquez, C. Construction and validation of a measure of integrative well-being in seven languages: The Pemberton Happiness Index. Heal. Qual. Life Outcomes 2013, 11, 66. [Google Scholar] [CrossRef] [Green Version]
- Ware, J.E.; Kosinski, M.; Keller, S.D. A 12-Item Short-Form Health Survey. Med Care 1996, 34, 220–233. [Google Scholar] [CrossRef] [PubMed] [Green Version]
- Vilagut, G.; Valderas, J.M.; Ferrer, M.; Garin, O.; López-García, E.; Alonso, J. Interpretación de los cuestionarios de salud SF-36 y SF-12 en España: Componentes físico y mental. Medicina Clínica 2008, 130, 726–735. [Google Scholar] [CrossRef] [Green Version]
- Badia, X.; Roset, M.; Montserrat, S.; Herdman, M.; Segura, A. [The Spanish version of EuroQol: A description and its applications. European Quality of Life scale]. Medicina Clínica 1999, 112, 79–85. [Google Scholar]
- Azur, M.J.; Stuart, E.A.; Frangakis, C.; Leaf, P.J. Multiple imputation by chained equations: What is it and how does it work? Int. J. Methods Psychiatr. Res. 2011, 20, 40–49. [Google Scholar] [CrossRef]
- Bowerman, B.L.; O’Connell, R.T. Linear Statistical Models: An. Applied Approach; Duxbury: Belmont, CA, USA, 1990. [Google Scholar]
- Myers, R. Classical and Modern Regression with Applications; Duxbury: Boston, MS, USA, 2000. [Google Scholar]
- Santos, V.; Paes, F.; Pereira, V.; Arias-Carrión, O.; Silva, A.C.; Carta, M.G.; Nardi, A.E.; Machado, S. The Role of Positive Emotion and Contributions of Positive Psychology in Depression Treatment: Systematic Review. Clin. Pr. Epidemiology Ment. Heal. 2013, 9, 221–237. [Google Scholar] [CrossRef] [Green Version]
- Chaves, C.; Lopez-Gomez, I.; Hervas, G.; Vazquez, C. A Comparative Study on the Efficacy of a Positive Psychology Intervention and a Cognitive Behavioral Therapy for Clinical Depression. Cogn. Ther. Res. 2016, 41, 417–433. [Google Scholar] [CrossRef]
- Geschwind, N.; Arntz, A.; Bannink, F.; Peeters, F. Positive cognitive behavior therapy in the treatment of depression: A randomized order within-subject comparison with traditional cognitive behavior therapy. Behav. Res. Ther. 2019, 116, 119–130. [Google Scholar] [CrossRef]
- Mira, A.; Bretón-López, J.; Enrique, Á.; Castilla, D.; Garcia-Palacios, A.; Baños, R.; Botella, C. Exploring the Incorporation of a Positive Psychology Component in a Cognitive Behavioral Internet-Based Program for Depressive Symptoms. Results Throughout the Intervention Process. Front. Psychol. 2018, 9, 2360. [Google Scholar] [CrossRef] [Green Version]
- Proyer, R.T.; Wellenzohn, S.; Gander, F.; Ruch, W. Toward a better understanding of what makes positive psychology interventions work: Predicting happiness and depression from the person × intervention fit in a follow-up after 3.5 years. Appl. Psychol. Health Well Being. 2015, 7, 108–128. [Google Scholar] [CrossRef]
- Bower, J.E.; Moskowitz, J.T.; Epel, E. Is benefit finding good for your health? Pathways linking positive life changes after stress and physical health outcomes. Curr. Dir. Psychol. Sci. 2009, 18, 337–341. [Google Scholar] [CrossRef] [Green Version]
- Craske, M.G.; Meuret, A.E.; Ritz, T.; Treanor, M.; Dour, H.; Rosenfield, D. Positive affect treatment for depression and anxiety: A randomized clinical trial for a core feature of anhedonia. J. Consult. Clin. Psychol. 2019, 87, 457–471. [Google Scholar] [CrossRef] [PubMed]
- Craske, M.G.; Meuret, A.E.; Ritz, T.; Treanor, M.; Dour, H.J. Treatment for Anhedonia: A Neuroscience Driven Approach. Depress. Anxiety 2016, 33, 927–938. [Google Scholar] [CrossRef] [PubMed]
- Gilbert, K.; Nolen-Hoeksema, S.; Gruber, J. Positive emotion dysregulation across mood disorders: How amplifying versus dampening predicts emotional reactivity and illness course. Behav. Res. Ther. 2013, 51, 736–741. [Google Scholar] [CrossRef]
- Fredrickson, B.L. The role of positive emotions in positive psychology: The broaden-and-build theory of positive emotions. Am. Psychol. 2001, 56, 218–226. [Google Scholar] [CrossRef]
- Seligman, M.E.P.; Rashid, T.; Parks, A.C. Positive psychotherapy. Am. Psychol. 2006, 61, 774–788. [Google Scholar] [CrossRef] [Green Version]
- Ryff, C.D. Psychological Well-Being Revisited: Advances in the Science and Practice of Eudaimonia. Psychother. Psychosom. 2014, 83, 10–28. [Google Scholar] [CrossRef] [Green Version]
- Taylor, C.T.; Lyubomirsky, S.; Stein, M.B. Upregulating the positive affect system in anxiety and depression: Outcomes of a positive activity intervention. Depress. Anxiety 2017, 34, 267–280. [Google Scholar] [CrossRef]
- Karyotaki, E.; Riper, H.; Twisk, J.; Hoogendoorn, A.; Kleiboer, A.; Mira, A.; MacKinnon, A.; Meyer, B.; Botella, C.; Littlewood, E.; et al. Efficacy of Self-guided Internet-Based Cognitive Behavioral Therapy in the Treatment of Depressive Symptoms. JAMA Psychiatry 2017, 74, 351–359. [Google Scholar] [CrossRef]
- Bower, P.; Kontopantelis, E.; Sutton, A.; Kendrick, T.; Richards, D.A.; Gilbody, S.; Knowles, S.; Cuijpers, P.; Andersson, G.; Christensen, H.; et al. Influence of initial severity of depression on effectiveness of low intensity interventions: Meta-analysis of individual patient data. BMJ 2013, 346, f540. [Google Scholar] [CrossRef] [Green Version]
- White, C.A.; Uttl, B.; Holder, M.D. Meta-analyses of positive psychology interventions: The effects are much smaller than previously reported. PLoS ONE 2019, 14, e0216588. [Google Scholar] [CrossRef]
- Wood, A.M.; Tarrier, N. Positive Clinical Psychology: A new vision and strategy for integrated research and practice. Clin. Psychol. Rev. 2010, 30, 819–829. [Google Scholar] [CrossRef] [PubMed]
- Rashid, T. Positive interventions in clinical practice. J. Clin. Psychol. 2009, 65, 461–466. [Google Scholar] [CrossRef]
- Fava, G.A.; Ruini, C. Development and characteristics of a well-being enhancing psychotherapeutic strategy: Well-being therapy. J. Behav. Ther. Exp. Psychiatry 2003, 34, 45–63. [Google Scholar] [CrossRef]


| Module | Objectives | Therapeutic Content |
|---|---|---|
|
|
|
|
|
|
|
|
|
|
|
|
| Sociodemographic Variables | % | n = 56 |
|---|---|---|
| Sex | ||
| Women | 78.6% | 44 |
| Men | 21.4% | 12 |
| Age (years) | 44.14 (10.38) a | |
| Marital status | ||
| Single | 16.1% b | 31 |
| In a relationship/Married | 55.4% | 9 |
| Divorced/Separated | 16.1% | 9 |
| Widowed | 1.8% | 1 |
| Income level | ||
| Lower than the minimum income (<641,40€) | 23.2% | 13 |
| Between 1–2 minimum incomes c | 25.0% | 14 |
| Between 2–4 minimum incomes | 21.4% | 12 |
| Work status | ||
| Student | 3.6% | 2 |
| Housekeeper | 3.6% | 2 |
| Subsidized unemployed | 5.4% | 3 |
| Unemployed with no subsidy | 12.5% | 7 |
| Employee | 44.6% | 25 |
| Sick leave | 8.9% | 5 |
| Retired | 3.6% | 2 |
| Disability | 3.6% | 2 |
| Others | 3.6% | 2 |
| Educational Level | ||
| No education | 5.4% | 3 |
| Primary school | 16.1% | 9 |
| Secondary school | 33.9% | 19 |
| University studies | 28.6% | 16 |
| Living alone or with others | ||
| Alone | 8.9% | 5 |
| Living with partner | 16.1% | 9 |
| Living with partner and children | 53.6% | 30 |
| Living with relatives | 8.9% | 5 |
| Living with friends or neighbors | 1.8% | 1 |
| PreM (SD) | PostM (SD) | FW6M (SD) | FW12M (SD) | F | Within-Group Effect Size, d [95% CI] Pre–Post | Within-Group Effect Size, d [95% CI] Pre-FW6 | Within-Group Effect Size, d [95% CI] Pre-FW12 | |
|---|---|---|---|---|---|---|---|---|
| 1. Depression Severity (PHQ-9) | 15.79 (6.21) | 10.57 (6.68) | 8.63 (6.11) | 9.75 (5.65) | F(2.51, 137.89) = 33.15, MSE = 20.32, p < 0.001 | 0.83 [0.55, 1.11] | 1.14 [0.78, 1.49] | 0.96 [0.61, 1.31] |
| 2. Positive Affect (PANAS-PA) | 17.63 (6.11) | 20.75 (7.92) | 22.27 (8.23) | 22.95 (9.66) | F(2.37, 130.09) = 9.61, MSE = 41.42, p < 0.001 | −0.50 [−0.78, −0.22] | −0.75 [−1.06, −0.43] | −0.86 [−1.15, −0.57] |
| 3. Negative Affect (PANAS-NA) | 26.82 (8.56) | 22.23 (8.07) | 21.21 (7.30) | 22.02 (8.56) | F(2.54, 139.72) = 11.37, MSE = 37.47, p < 0.001 | 0.53 [0.28, 0.78] | 0.65 [0.34, 0.96] | 0.55 [0.25, 0.85] |
| 4. Well-being (PHI) | 4.21 (1.72) | - | 5.70 (1.89) | 5.59 (1.78) | F(2110) = 33.48, MSE = 1.15, p < 0.001 | - | −0.85 [−1.12, −0.59] | −0.79 [−1.09, −0.49] |
| 5. Mental Health (SF-12) | 26.22 (8.08) | 30.50 (10.43) | 38.61 (10.83) | 35.26 (13.42) | F(2.53, 139.31) = 20.65, MSE = 94.52, p < 0.001 | −0.52 [−0.79, −0.26] | −1.51 [−1.98, −1.04] | −1.10 [−1.47, −0.74] |
| 6. Physical Health (SF-12) | 42.45 (9.83) | 45.11 (11.32) | 45.58 (10.15) | 47.04 (10.66) | F(3, 165) = 4.66, MSE = 44.02, p = 0.004 | −0.27 [−0.50, −0.03] | −0.31 [−0.59, −0.04] | −0.46 [−0.70, −0.22] |
| 7. Health Status (EQ-5D) | 47.86 (20.34) | - | 62.68 (15.24) | 66.57 (19.04) | F(1.65, 90.64) = 24.68, MSE = 268.55, p < 0.001 | - | −0.72 [−1.00, −0.44] | −0.91 [−1.29, −0.53] |
| Sociodemographic Variables and Pre-Treatment Scores | 1 | 2 | 3 | 4 | 5 | 6 | 7 | 8 | 9 | 10 | 11 | 12 | 13 | 14 |
|---|---|---|---|---|---|---|---|---|---|---|---|---|---|---|
| 1. Sex | — | |||||||||||||
| 2. Age | −0.13 | — | ||||||||||||
| 3. Marital status (binary variable) | −0.05 | 0.03 | — | |||||||||||
| 4. Living alone or not (binary variable) | 0.13 | −0.04 | 0.29 * | — | ||||||||||
| 5. Educational level (binary variable) | −0.19 | 0.33 * | 0.04 | −0.04 | — | |||||||||
| 6. Work status (binary variable) | −0.17 | 0.03 | 0.02 | −0.14 | 0.02 | — | ||||||||
| 7. Income level (binary variable) | −0.13 | 0.50 ** | 0.26 | 0.05 | 0.21 | 0.22 | — | |||||||
| 8. Depression Severity (PHQ-9) | 0.02 | −0.09 | -0.23 | 0.05 | −0.20 | −0.12 | −0.24 | — | ||||||
| 9. Positive Affect (PANAS-PA) | −0.03 | 0.04 | 0.07 | 0.08 | 0.08 | 0.15 | 0.25 | −0.33 * | — | |||||
| 10. Negative Affect (PANAS-NA) | −0.05 | −0.20 | 0.04 | 0.26 | −0.16 | 0.04 | −0.14 | 0.55 *** | −0.33 * | — | ||||
| 11. Well-being (PHI) | 0.04 | 0.10 | 0.33 * | −0.15 | 0.13 | 0.15 | 0.23 | −0.51 *** | 0.50 *** | −0.40 ** | — | |||
| 12. Mental Health (SF-12) | 0.13 | 0.08 | 0.26 | 0.11 | 0.09 | 0.05 | 0.28 | −0.43 ** | 0.50 *** | −0.21 | 0.53 *** | — | ||
| 13. Physical Health (SF-12) | −0.05 | −0.30 * | 0.15 | 0.15 | 0.23 | 0.22 | 0.08 | −0.36 ** | 0.15 | −0.25 | 0.09 | −0.09 | — | |
| 14. Health Status (EQ-5D) | −0.03 | −0.12 | 0.20 | 0.07 | 0.15 | 0.26 | 0.44 ** | −0.43 ** | 0.36 ** | −0.16 | 0.42 ** | 0.26 | 0.40 ** | — |
| Outcomes | Predictors | R | Adjusted R2 | R2 Change | B | SE | β | t |
|---|---|---|---|---|---|---|---|---|
| Change in PHQ | ||||||||
| Pre-Post | Constant | −8.93 | 1.41 | 6.32 *** | ||||
| Level of incomes (binary variable) | 0.47 | 0.20 | 0.22 | 5.57 | 1.73 | 0.47 | 3.22 ** | |
| Pre-FW6 | Constant | −10.49 | 1.74 | 6.04 *** | ||||
| Level of incomes (binary variable) | 0.36 | 0.11 | 0.13 | 4.99 | 2.13 | 0.36 | 2.35 * | |
| Pre-FW12 | Constant | −16.40 | 2.36 | 6.95 *** | ||||
| Level of incomes (binary variable) | 0.55 | 0.28 | 0.30 | 6.57 | 1.83 | 0.47 | 3.60 ** | |
| PHI | 0.65 | 0.40 | 0.13 | 1.42 | 0.51 | 0.36 | 2.80 ** | |
| Change in PANAS positive | ||||||||
| Pre-Post | - | - | - | - | - | - | - | - |
| Pre-FW6 | - | - | - | - | - | - | - | - |
| Pre-FW12 | - | - | - | - | - | - | - | - |
| Change in PANAS negative | ||||||||
| Pre-Post | - | - | - | - | - | - | - | - |
| Pre-FW6 | - | - | - | - | - | - | - | - |
| Pre-FW12 | - | - | - | - | - | - | - | - |
| Change in PHI | ||||||||
| Pre-FW6 | Constant | 2.97 | 0.75 | 3.97 *** | ||||
| SF-12 (Mental Health) | 0.32 | 0.08 | 0.10 | −0.06 | 0.03 | −0.32 | 2.07 * | |
| Pre-FW12 | - | - | - | - | - | - | - | - |
| Change in SF-12 (Mental Health) | ||||||||
| Pre-Post | - | - | - | - | - | - | - | - |
| Pre-FW6 | Constant | 19.23 | 3.51 | 5.48 *** | ||||
| Level of incomes (binary variable) | 0.37 | 0.11 | 0.13 | −10.26 | 4.29 | −0.37 | 2.39 * | |
| Pre-FW12 | - | - | - | - | - | - | - | - |
| Change in SF-12 (Physical Health) | ||||||||
| Pre-Post | Constant | 7.77 | 2.85 | 2.73 * | ||||
| Education level (binary variable) | 0.32 | 0.08 | 0.11 | −6.87 | 3.30 | −0.32 | 2.08 * | |
| Pre-FW6 | Constant | 10.58 | 3.010 | 3.52 ** | ||||
| Education level (binary variable) | 0.43 | 0.16 | 0.18 | −10.01 | 3.490 | −0.43 | 2.87 ** | |
| Pre-FW12 | Constant | 11.11 | 2.51 | 4.42 *** | ||||
| Education level (binary variable) | 0.44 | 0.18 | 0.20 | −8.76 | 2.91 | −0.44 | 3.01 ** | |
| Change in EQ-5D | ||||||||
| Pre-FW6 | Constant | 26.30 | 4.40 | 5.98 *** | ||||
| Level of incomes (binary variable) | 0.47 | 0.20 | 0.22 | −17.21 | 5.39 | −0.47 | 3.19 ** | |
| Pre-FW12 | - | - | - | - | - | - | - | - |
| Outcomes | Predictors | R | Adjusted R2 | R2 Change | B | SE | β | t |
|---|---|---|---|---|---|---|---|---|
| Change in PHI | ||||||||
| Pre-FW6 | Constant | 1.06 | 0.25 | 4.33 *** | ||||
| Change in PHQ-9 Pre-Post | 0.33 | 0.09 | 0.11 | −0.08 | 0.03 | −0.33 | 2.57 * | |
| Pre-FW12 | Constant | 0.57 | 0.27 | 2.14 * | ||||
| Change in PHQ-9 Pre-FW12 | 0.50 | 0.24 | 0.25 | −0.22 | 0.04 | −0.88 | 5.84 *** | |
| Change in PANAS-PA Pre-FW12 | 0.63 | 0.37 | 0.14 | 0.08 | 0.02 | 0.37 | 3.73 *** | |
| Change in PHQ Pre-FW6 | 0.71 | 0.48 | 0.12 | 0.14 | 0.04 | 0.52 | 3.50 ** | |
| Change in SF-12 (Mental Health) | ||||||||
| Pre-Post | - | - | - | - | - | - | - | - |
| Pre-FW6 | Constant | 7.37 | 2.51 | 2.94 ** | ||||
| Change in PHQ-9 Pre-FW6 | 0.35 | 0.10 | 0.12 | −0.70 | 0.26 | −0.35 | 2.72 ** | |
| Pre-FW12 | - | - | - | - | - | - | - | - |
| Change in SF-12 (Physical Health) | ||||||||
| Pre-Post | Constant | −1.18 | 1.68 | 0.70 | ||||
| Change in PHQ-9 Pre-Post | 0.31 | 0.08 | 0.10 | −0.44 | 0.21 | −0.27 | 2.10 * | |
| Change in PANAS-NA Pre-Post | 0.41 | 0.13 | 0.07 | −0.34 | 0.17 | −0.26 | 2.04 * | |
| Pre-FW6 | - | |||||||
| Pre-FW12 | - | |||||||
| Change in EQ-5D | ||||||||
| Pre-FW6 | - | - | - | - | - | - | - | - |
| Pre-FW12 | Constant | 11.56 | 4.39 | 2.64 * | ||||
| Change in PHQ-9 Pre-FW12 | 0.31 | 0.08 | 0.10 | −1.19 | 0.49 | −0.31 | 2.43 * |
Publisher’s Note: MDPI stays neutral with regard to jurisdictional claims in published maps and institutional affiliations. |
© 2020 by the authors. Licensee MDPI, Basel, Switzerland. This article is an open access article distributed under the terms and conditions of the Creative Commons Attribution (CC BY) license (http://creativecommons.org/licenses/by/4.0/).
Share and Cite
Vara, M.D.; Mira, A.; Miragall, M.; García-Palacios, A.; Botella, C.; Gili, M.; Riera-Serra, P.; García-Campayo, J.; Mayoral-Cleries, F.; Baños, R.M. A Low-Intensity Internet-Based Intervention Focused on the Promotion of Positive Affect for the Treatment of Depression in Spanish Primary Care: Secondary Analysis of a Randomized Controlled Trial. Int. J. Environ. Res. Public Health 2020, 17, 8094. https://0-doi-org.brum.beds.ac.uk/10.3390/ijerph17218094
Vara MD, Mira A, Miragall M, García-Palacios A, Botella C, Gili M, Riera-Serra P, García-Campayo J, Mayoral-Cleries F, Baños RM. A Low-Intensity Internet-Based Intervention Focused on the Promotion of Positive Affect for the Treatment of Depression in Spanish Primary Care: Secondary Analysis of a Randomized Controlled Trial. International Journal of Environmental Research and Public Health. 2020; 17(21):8094. https://0-doi-org.brum.beds.ac.uk/10.3390/ijerph17218094
Chicago/Turabian StyleVara, Mª Dolores, Adriana Mira, Marta Miragall, Azucena García-Palacios, Cristina Botella, Margalida Gili, Pau Riera-Serra, Javier García-Campayo, Fermín Mayoral-Cleries, and Rosa Mª Baños. 2020. "A Low-Intensity Internet-Based Intervention Focused on the Promotion of Positive Affect for the Treatment of Depression in Spanish Primary Care: Secondary Analysis of a Randomized Controlled Trial" International Journal of Environmental Research and Public Health 17, no. 21: 8094. https://0-doi-org.brum.beds.ac.uk/10.3390/ijerph17218094