Objectively Measured Sedentary Behavior and Physical Fitness in Adults: A Systematic Review and Meta-Analysis

 , , , , , and
Abstract
:1. Introduction
2. Materials and Methods
2.1. Data Sources
2.2. Eligibility Criteria and Selection of Studies
2.3. Data Extraction
2.4. Quality Assessment
2.5. Statistical Analysis
3. Results
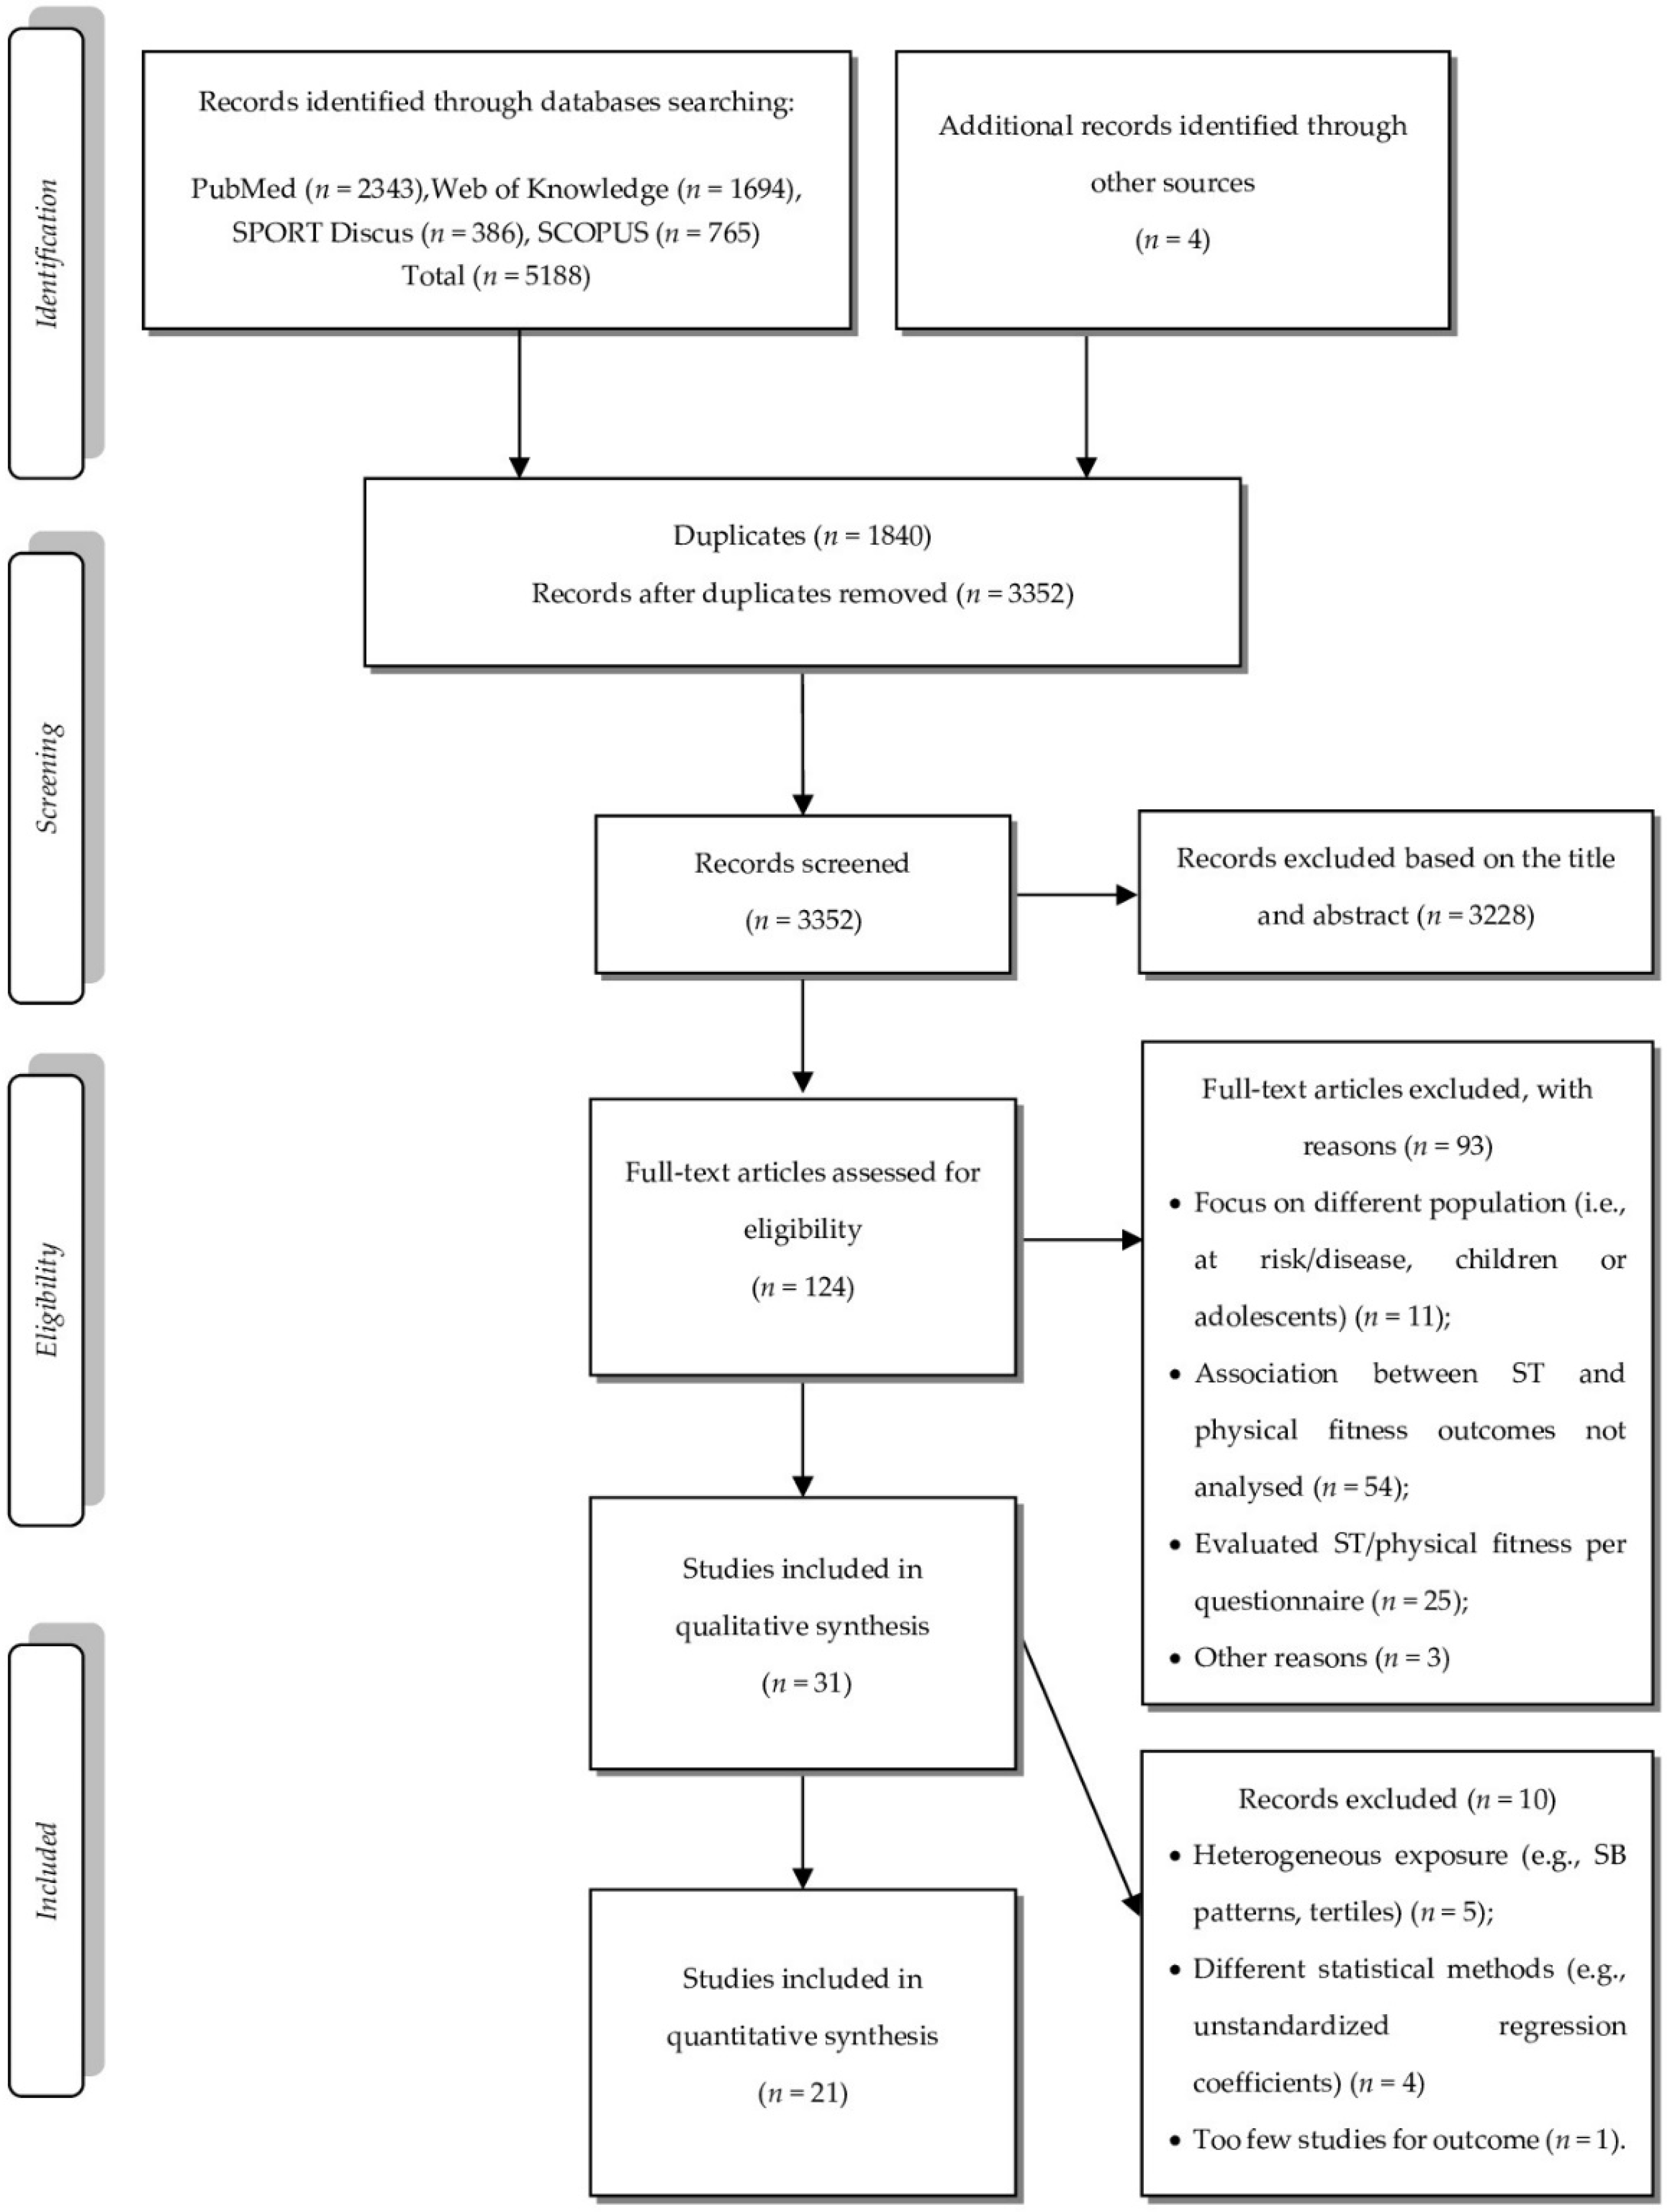
3.1. Data Search
3.2. Characteristics of Studies and Participants
3.3. Synthesis of Quantitative Data
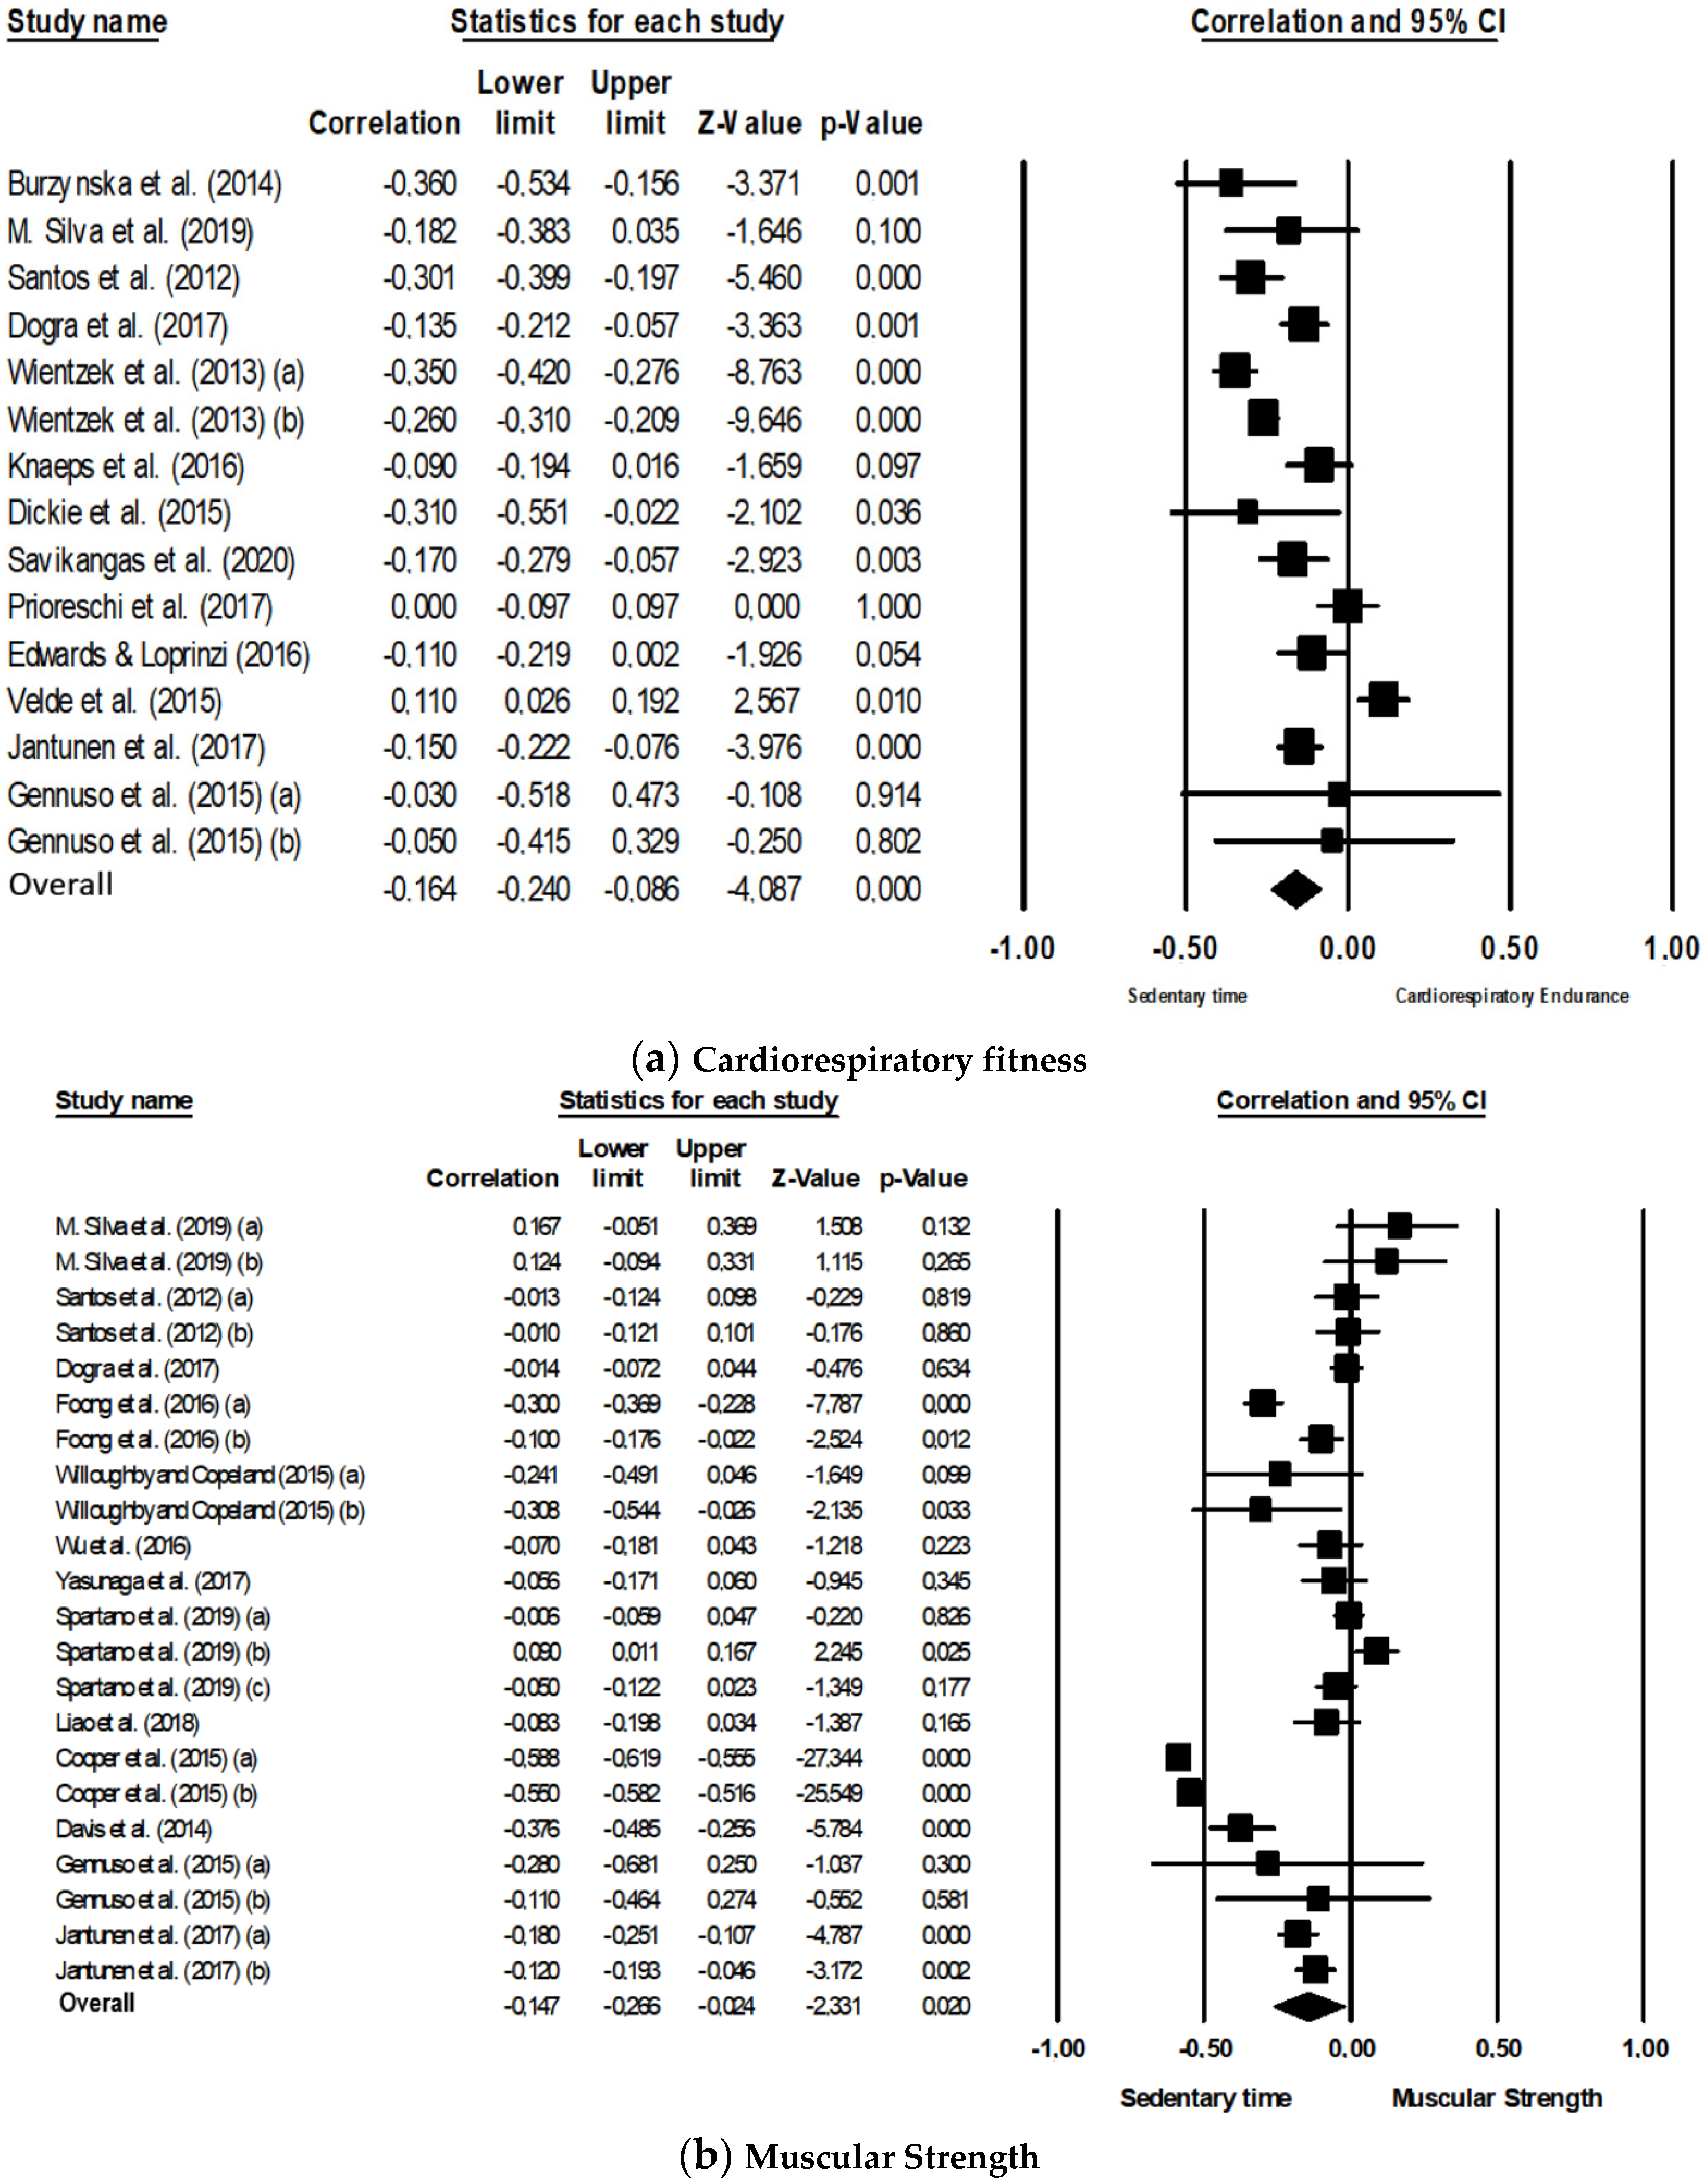
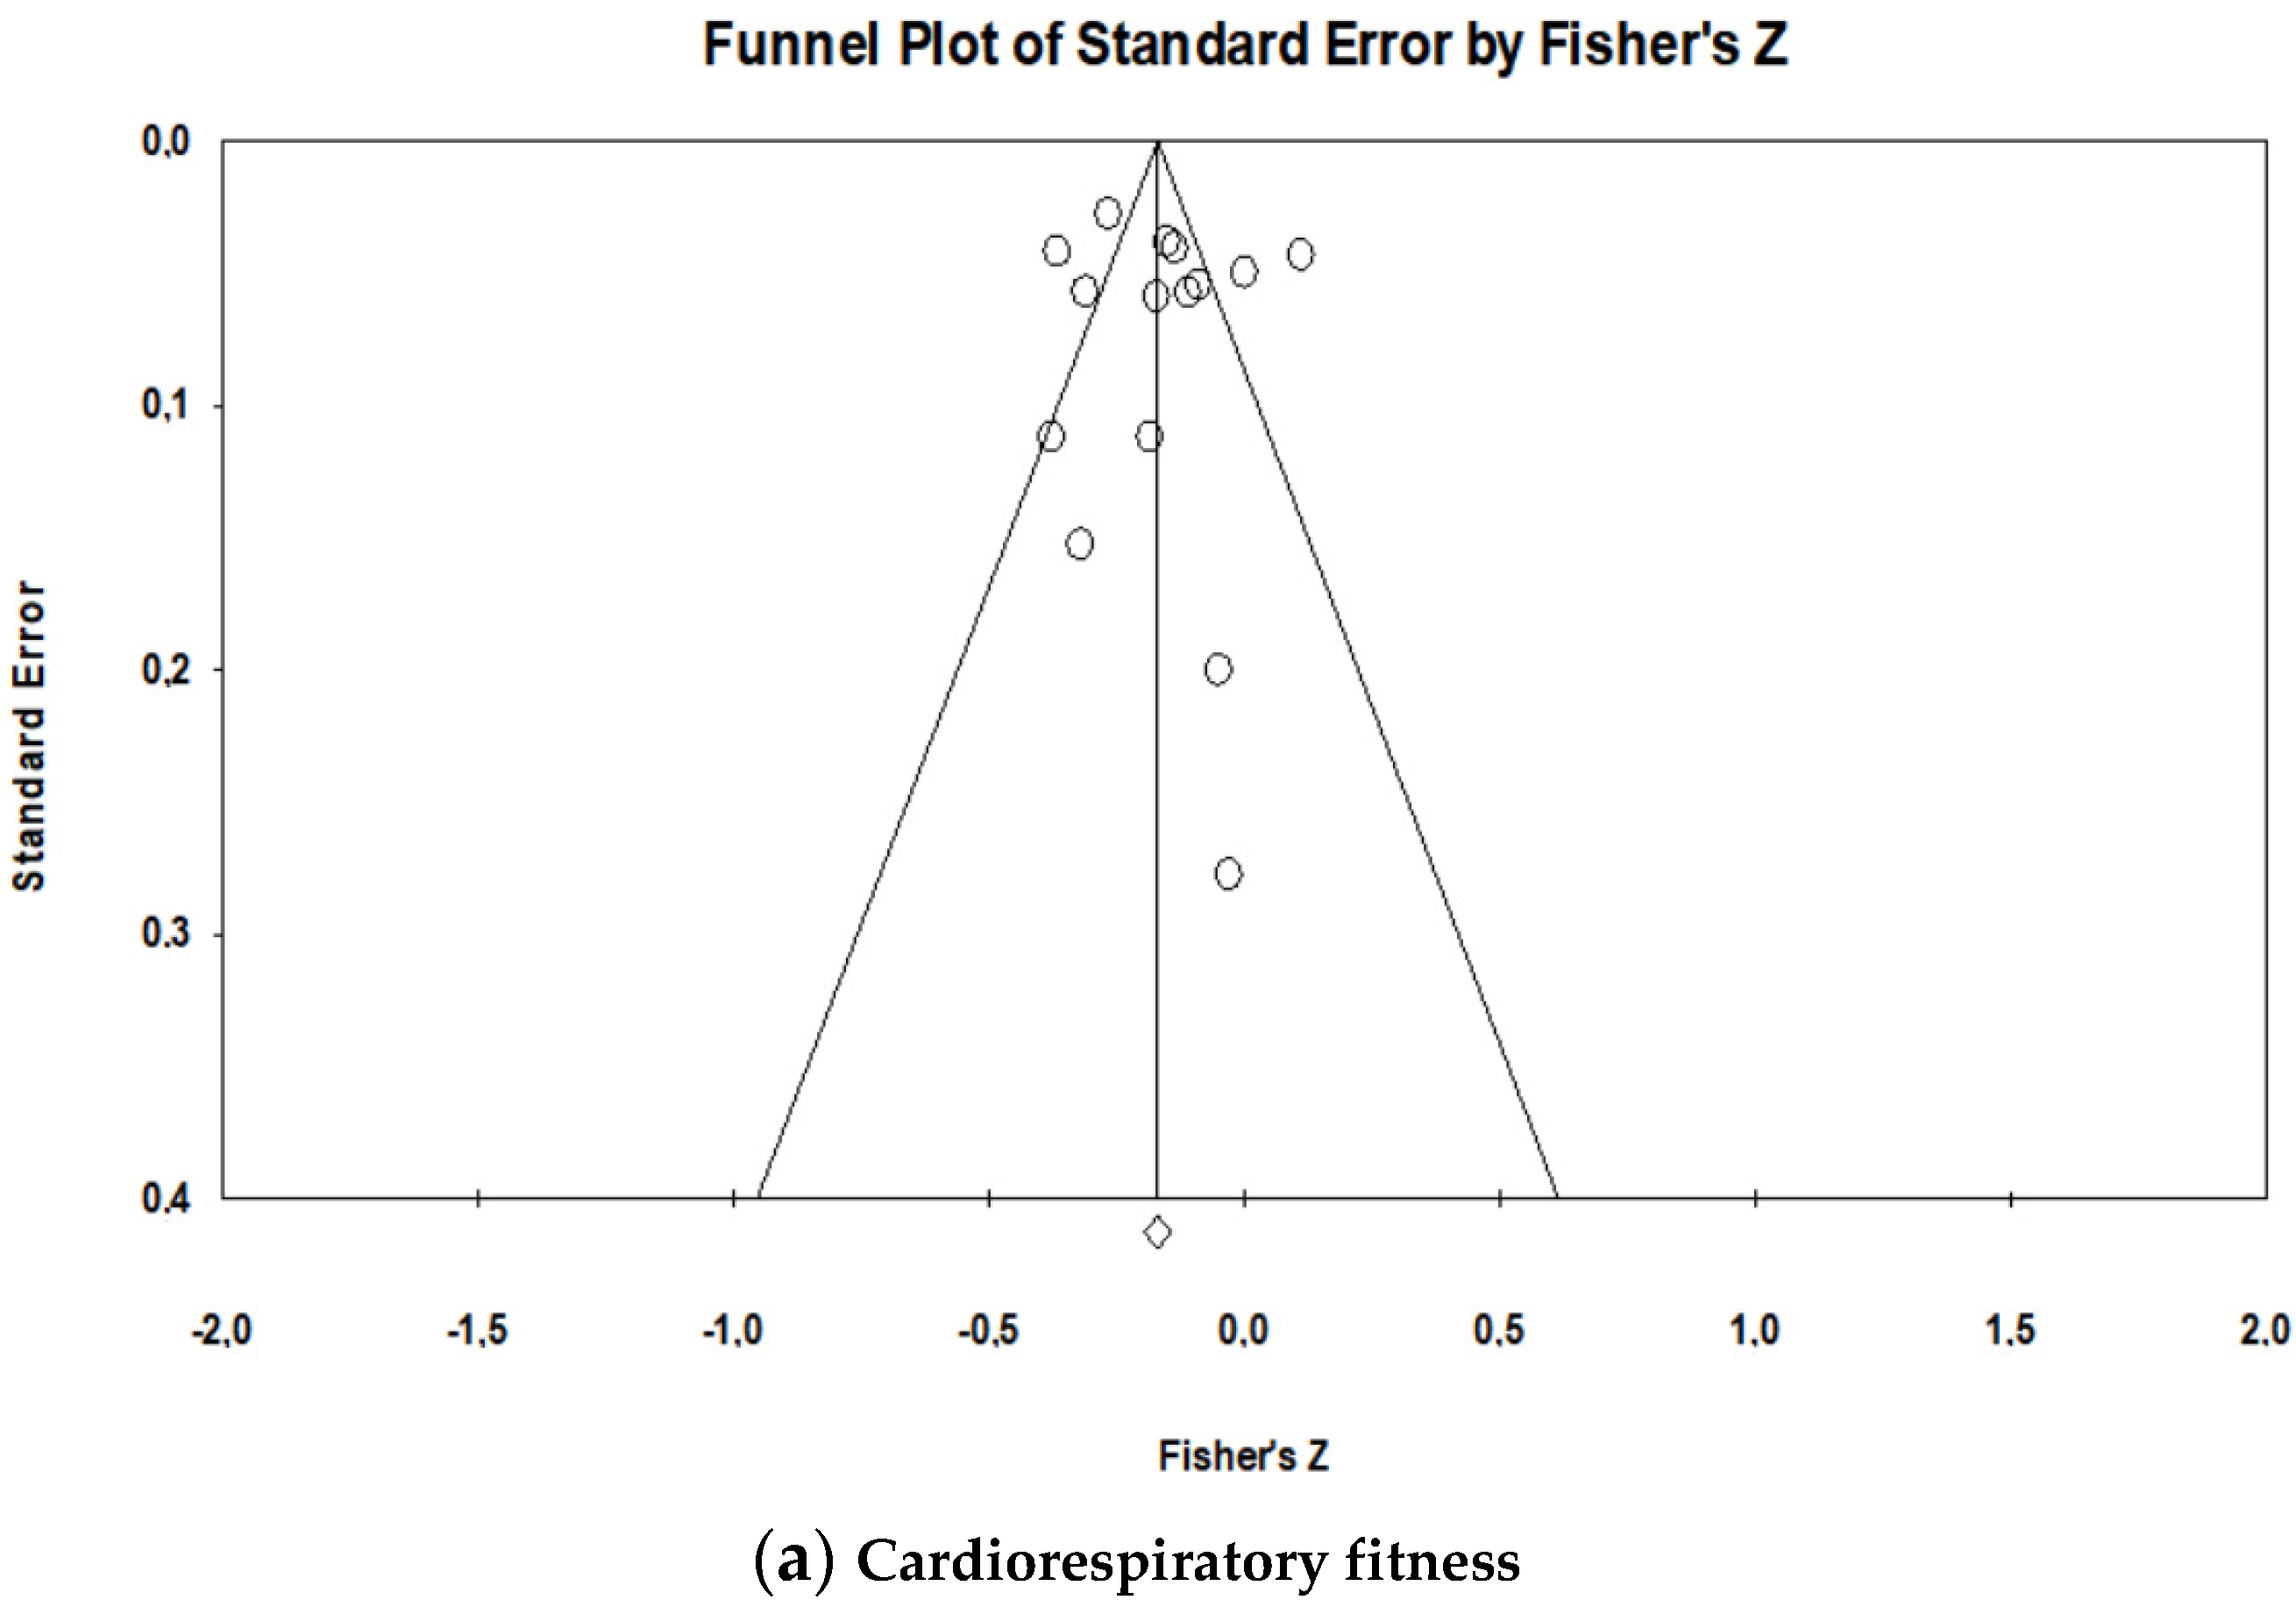
3.3.1. Cardiorespiratory Fitness
3.3.2. Muscular Strength
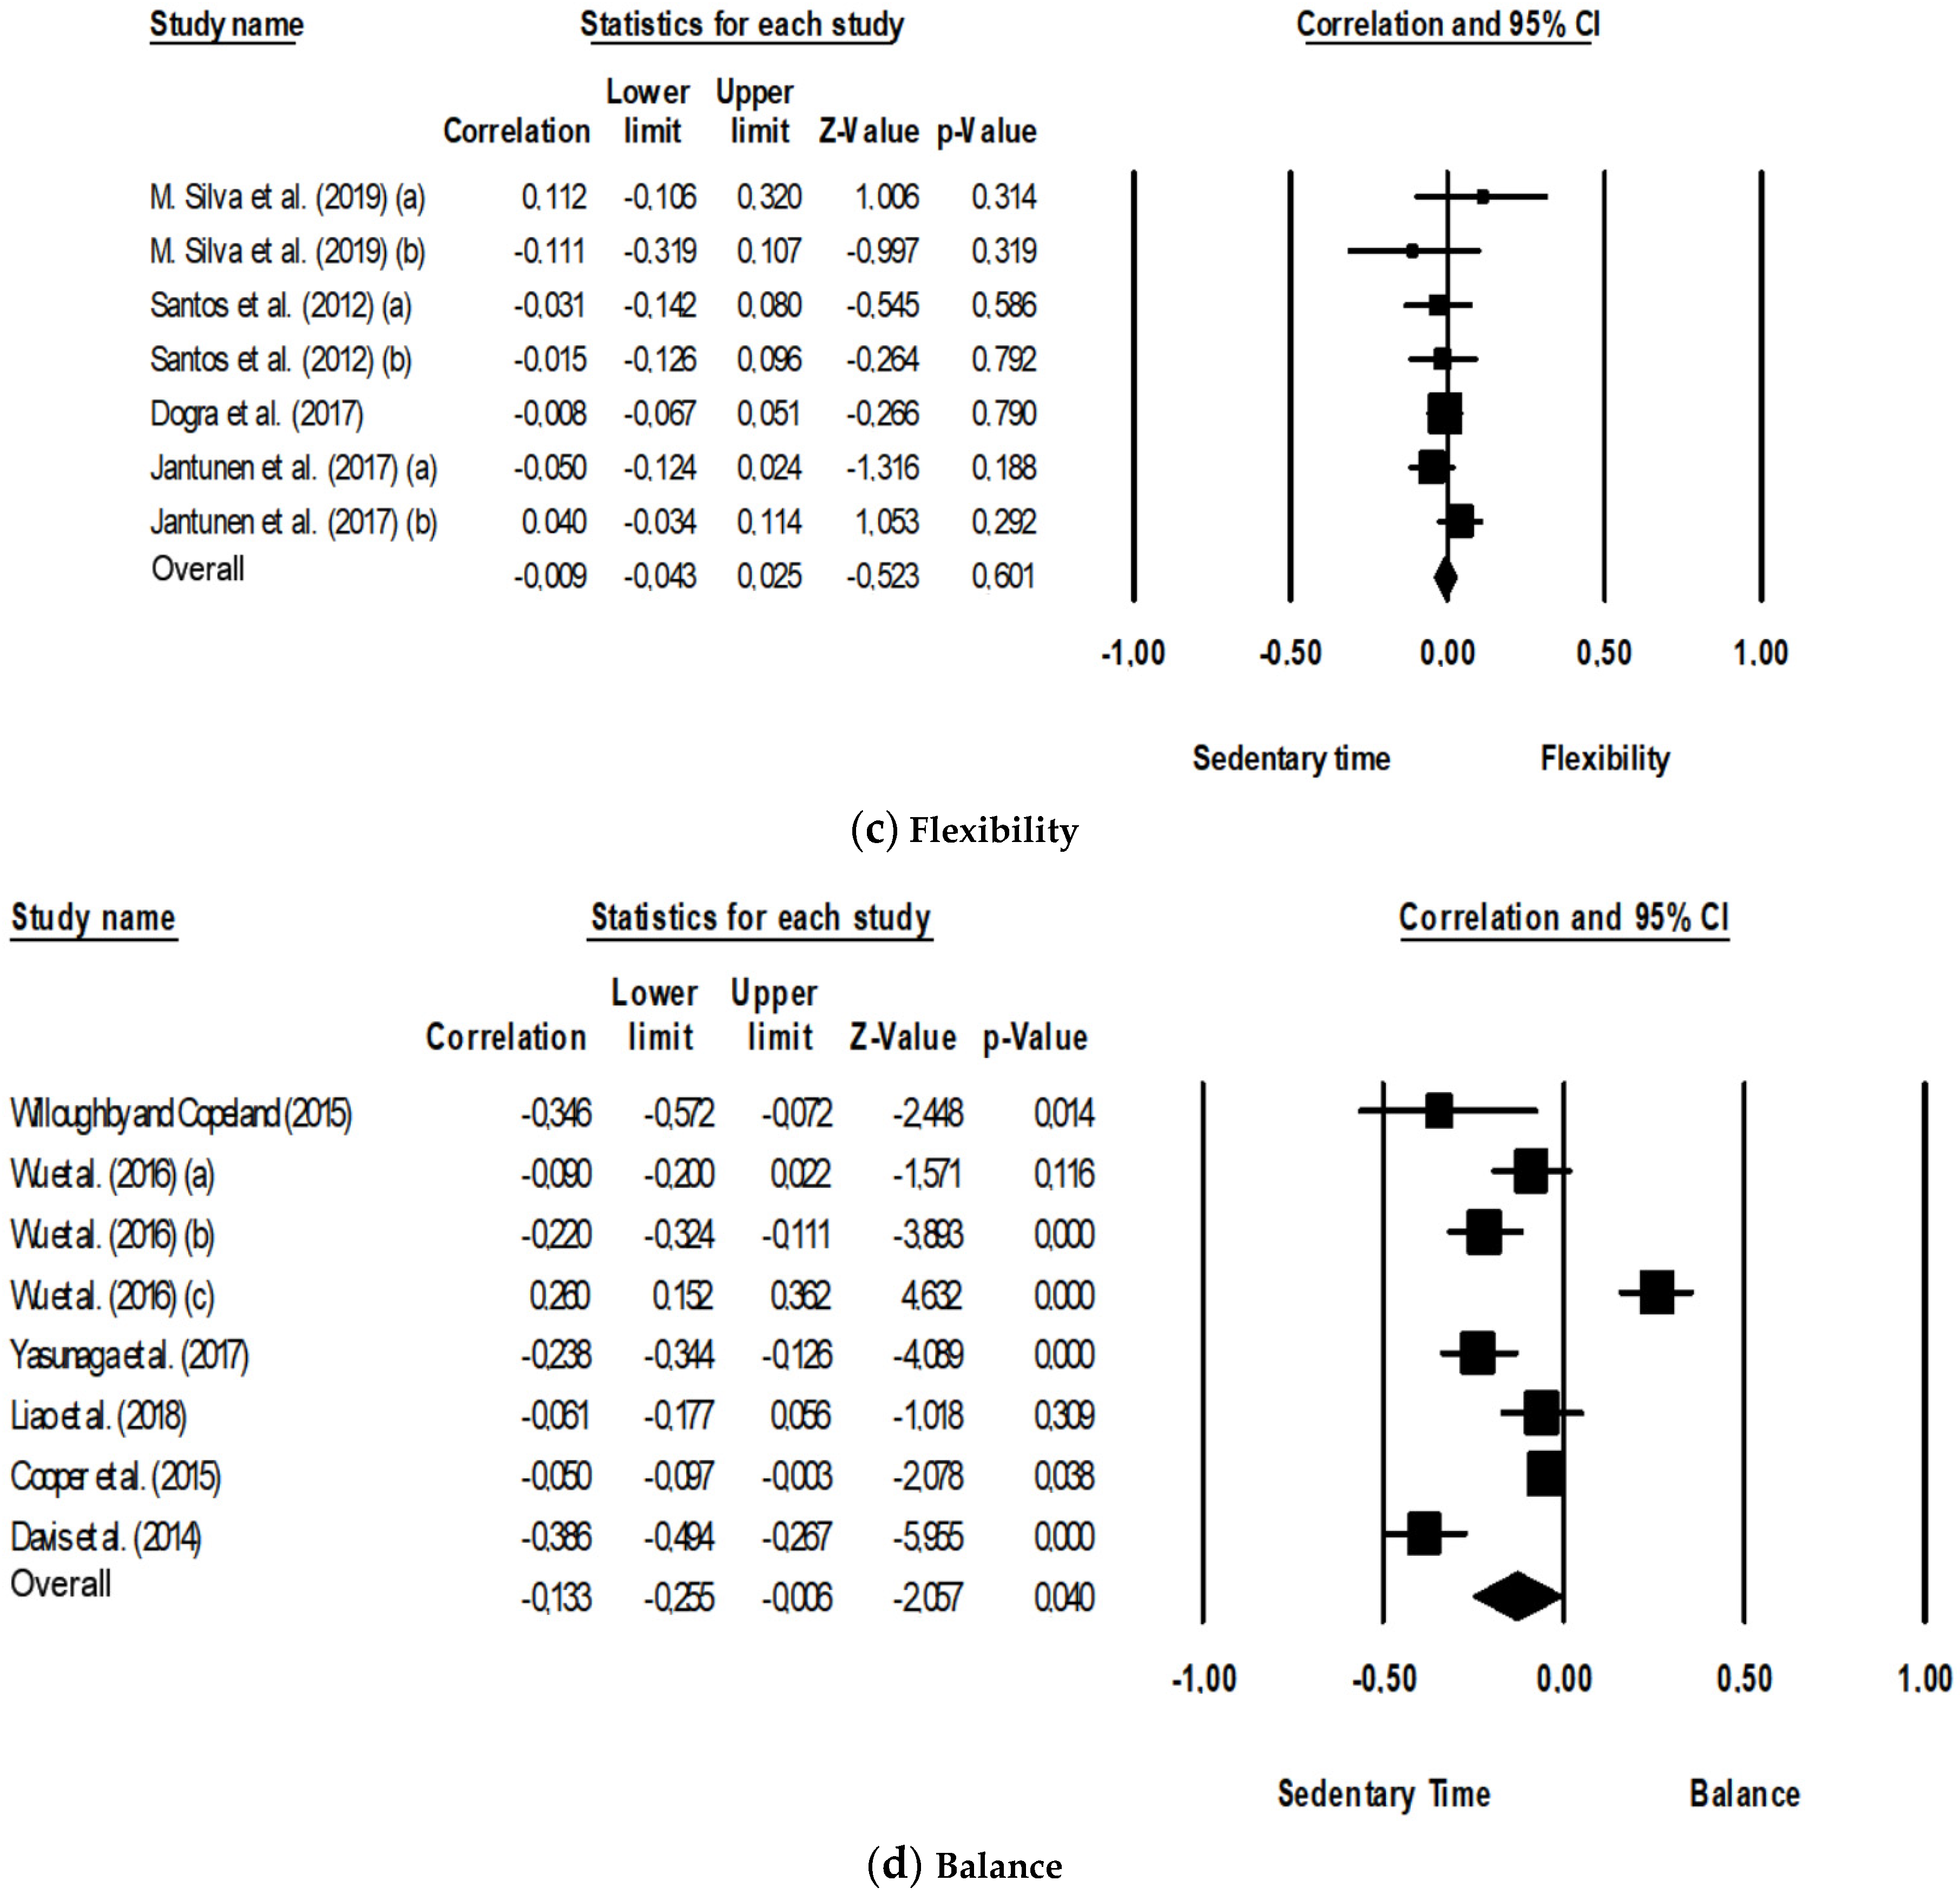
3.3.3. Flexibility
3.3.4. Balance
4. Discussion
Strengths and Limitations
5. Conclusions
Author Contributions
Funding
Conflicts of Interest
References
- Caspersen, C.J.; Powell, K.E.; Christenson, G.M. Physical Activity, Exercise, and Physical Fitness: Definitions and Distinctions for Health-Related Research. Public Health Rep. 1985, 100, 126–131. [Google Scholar] [PubMed]
- Maslow, A.; Sui, A.; Lee, D.; Vuori, I.; Blair, S. Fitness and Adiposity as Predictors of Functional Limitation in Adults. J. Phys. Act. Health 2011, 8, 18–26. [Google Scholar] [CrossRef] [PubMed] [Green Version]
- Rosengren, B.E.; Ribom, E.L.; Nilsson, J.Å.; Mallmin, H.; Ljunggren, Ö.; Ohlsson, C.; Mellström, D.; Lorentzon, M.; Stefanick, M.; Lapidus, J.; et al. Inferior physical performance test results of 10.998 men in the MrOS Study is associated with high fracture risk. Age Ageing 2012, 41, 339–344. [Google Scholar] [CrossRef] [PubMed] [Green Version]
- Edholm, P.; Nilsson, A.; Kadi, F. Physical function in older adults: Impacts of past and present physical activity behaviors. Scand. J. Med. Sci. Sports 2019, 29, 415–421. [Google Scholar] [CrossRef]
- McPhee, J.S.; French, D.P.; Jackson, D.; Nazroo, J.; Pendleton, N.; Degens, H. Physical activity in older age: Perspectives for healthy ageing and frailty. Biogerontology 2016, 17, 567–580. [Google Scholar] [CrossRef]
- Kodama, S.; Saito, K.; Tanaka, S.; Maki, M.; Yachi, Y.; Asumi, M.; Sugawara, A.; Totsuka, K.; Shimano, H.; Ohashi, Y.; et al. Aerobic endurance as a quantitative predictor of all-cause mortality and cardiovascular events in healthy men and women. A meta-analysis. JAMA 2009, 301, 2024–2035. [Google Scholar] [CrossRef] [Green Version]
- Leong, D.P.; Teo, K.K.; Rangarajan, S.; Lopez-Jaramillo, P.; Avezum, A., Jr.; Orlandini, A.; Seron, P.; Ahmed, S.H.; Rosengren, A.; Kelishadi, R.; et al. Prognostic value of grip strength: Findings from the Prospective Urban Rural Epidemiology (PURE) study. Lancet 2015, 386, 266–273. [Google Scholar] [CrossRef]
- García-Hermoso, A.; Cavero-Redondo, I.; Ramírez-Vélez, R.; Ruiz, J.R.; Ortega, F.B.; Lee, D.-C.; Martínez-Vizcaíno, V. Muscular Strength as a Predictor of All-Cause Mortality in an Apparently Healthy Population: A Systematic Review and Meta-Analysis of Data from Approximately 2 Million Men and Women. Arch. Phys. Med. Rehabil. 2018, 99, 2100–2113. [Google Scholar] [CrossRef]
- Lin, P.-S.; Hsieh, C.-C.; Cheng, H.-S.; Tseng, T.-J.; Su, S.-C. Association between Physical Fitness and Successful Aging in Taiwanese Older Adults. PLoS ONE 2016, 11, e0150389. [Google Scholar] [CrossRef] [Green Version]
- Moratalla-Cecilia, N.; Soriano-Maldonado, A.; Ruiz-Cabello, P.; Fernández, M.M.; Gregorio-Arenas, E.; Aranda, P.; Aparicio, V.A. Association of physical fitness with health-related quality of life in early postmenopause. Qual. Life Res. 2016, 25, 2675–2681. [Google Scholar] [CrossRef] [Green Version]
- Katzmarzyk, P.T.; Craig, C.L. Musculoskeletal fitness and risk of mortality. Med. Sci. Sports Exerc. 2002, 34, 740–744. [Google Scholar] [CrossRef] [PubMed]
- Breton, É.; Beloin, F.; Fortin, C.; Martin, A.; Ouellet, M.; Payette, H.; Levasseur, M. Gender-specific associations between functional autonomy and physical capacities in independent older adults: Results from the NuAge study. Arch. Gerontol. Geriat. 2014, 58, 56–62. [Google Scholar] [CrossRef] [PubMed]
- Davis, M.G.; Fox, K.R.; Stathi, A.; Trayers, T.; Thompson, J.L.; Cooper, A.R. Objectively measured sedentary time and its association with physical function in older adults. J. Aging Phys. Act. 2014, 22, 474–481. [Google Scholar] [CrossRef] [PubMed]
- Dogra, S.; Ashe, M.C.; Biddle, S.J.H.; Brown, W.J.; Buman, M.; Chastin, S.; Gardiner, O.; Inoue, S.; Jefferis, B.J.; Oka, K.; et al. Sedentary time in older men and women: An international consensus statement and research priorities. Br. J. Sports Med. Publ. 2017, 51, 1526–1532. [Google Scholar] [CrossRef]
- Panahi, S.; Tremblay, A. Sedentariness and Health: Is Sedentary Behavior More Than Just Physical Inactivity? Front. Public Health 2018, 6, 258. [Google Scholar] [CrossRef] [Green Version]
- Tremblay, M.S.; Aubert, A.; Barnes, J.D.; Saunders, T.J.; Carson, V.; Latimer-Cheung, A.E.; Chastin, S.F.M.; Altenburg, T.M.; Chinapaw, M.J.M. Sedentary Behavior Research Network (SBRN)-Terminology Consensus Project process and outcome. Int. J. Behav. Nutr. Phys. Act. 2017, 14, 75. [Google Scholar] [CrossRef] [Green Version]
- Loyen, A.; Clarke-Cornwell, A.M.; Anderssen, S.; Hagströmer, M.; Sardinha, L.B.; Sundquist, K.; Ekelund, U.; Steene-Johannessen, J.; Baptista, F.; Hansen, B.; et al. Sedentary Time and Physical Activity Surveillance through Accelerometer Pooling in Four European Countries. Sports Med. 2017, 47, 1421–1435. [Google Scholar] [CrossRef] [Green Version]
- Powell, C.; Herring, M.P.; Dowd, K.P.; Donnelly, A.E.; Carson, B.P. The cross-sectional associations between objectively measured sedentary time and cardiometabolic health markers in adults—A systematic review with meta-analysis component. Obes. Rev. 2018, 19, 381–395. [Google Scholar] [CrossRef]
- Ku, P.; Steptoe, A.; Liao, Y.; Hsueh, M.; Chen, L. A cut-off of daily sedentary time and all-cause mortality in adults: A meta-regression analysis involving more than 1 million participants. BMC Med. 2018, 16, 74. [Google Scholar] [CrossRef]
- Young, D.R.; Hivert, M.F.; Alhassan, S.; Camhi, S.M.; Ferguson, J.F.; Katzmarzyk, P.T.; Lewis, C.E.; Owen, N.; Perry, C.K. Sedentary Behavior and Cardiovascular Morbidity and Mortality: A Science Advisory from the American Heart Association. Circulation 2016, 134, e262–e279. [Google Scholar] [CrossRef]
- Cooper, A.J.M.; Simmons, R.K.; Kuh, D.; Brage, S.; Cooper, R. Physical Activity, Sedentary Time and Physical Capability in Early Old Age: British Birth Cohort Study. PLoS ONE 2015, 10, e0126465. [Google Scholar] [CrossRef] [PubMed] [Green Version]
- Dogra, S.; Clarke, J.M.; Copeland, J.L. Prolonged Sedentary time and physical fitness among Canadian men and women aged 60 to 69. Health Rep. 2017, 28, 3–9. [Google Scholar] [PubMed]
- Spartano, N.L.; Lyass, A.; Larson, M.G.; Trand, T.; Andersson, C.; Blease, S.J.; Esliger, D.W.; Vasan, R.S.; Murabito, J.M. Objective physical activity and physical performance in middle-aged and older adults. Exp. Gerontol. 2019, 119, 203–211. [Google Scholar] [CrossRef] [PubMed] [Green Version]
- Velde, J.H.P.M.; Savelberg, H.H.C.M.; van der Berg, J.D.; Sep, S.J.S.; van der Kallen, C.J.H.M.; Dagnelie, P.C.; Schram, M.T.; Henry, R.M.A.; Reijven, P.L.M.; van Geel, T.A.C.M. Sedentary Behavior is Only Marginally Associated with Physical Function in Adults Aged 40–75 Years—The Maastricht Study. Front. Physiol. 2017, 8, 242. [Google Scholar] [CrossRef] [PubMed]
- Dickie, K.; Micklesfield, L.K.; Chantler, S.; Lambert, E.V.; Goedecke, J.H. Cardiorespiratory Fitness and Light-Intensity Physical Activity are Independently Associated with Reduced Cardiovascular Disease Risk in Urban Black South African Women: A Cross-Sectional Study. Metab. Syndr. Relat. Disord. 2015, 14, 23–32. [Google Scholar] [CrossRef] [PubMed]
- Wientzek, A.; Tormo Díaz, M.J.; Castaño, J.M.H.; Amiano, P.; Arriola, L.; Overvad, K.; Østergaard, J.N.; Charles, M.A.; Fagherazzi, G.; Palli, D.; et al. Cross-sectional associations of Objetively Measured Physical Activity, Cardiorrespiratory Fitness and Anthropometry in European Adults. Obesity 2013, 22, 127–134. [Google Scholar] [CrossRef]
- Edwards, M.K.; Loprinzi, P.D. High Amounts of Sitting, Low Cardiorespiratory Fitness, and Low Physical Activity Levels: 3 Key Ingredients in the Recipe for Influencing Metabolic Syndrome Prevalence. Am. J. Health Promot. 2016, 32, 587–594. [Google Scholar] [CrossRef]
- Velde, J.H.P.M.; Koster, A.; Berg, J.D.; Sep, S.J.S.; Kallen, C.J.H.; Dagnelie, P.C.; Schram, M.T.; Henry, R.M.A.; Eussen, S.J.P.; Van Dongen, M.C.J.M.; et al. Sedentary Behavior, Physical Activity, and Fitness—The Maastricht Study. Med. Sci. Sports Exerc. 2017, 49, 1583–1591. [Google Scholar] [CrossRef]
- Willoughby, T.; Copeland, J.L. Sedentary time is not independently related to postural stability or leg strength in women 50–67 years old. Appl. Physiol. Nutr. Metab. 2015, 40, 1123–1128. [Google Scholar] [CrossRef]
- Wu, F.; Laslett, L.L.; Oldenburg, B.; Jones, G.; Winzenberg, T. Moderate-to-Vigorous Physical Activity but not Sedentary Time is Associated with Musculoskeletal Health Outcomes in a Cohort of Australian Middle-Aged Women. J. Bone Miner. Res. 2017, 32, 708–715. [Google Scholar] [CrossRef]
- Foong, Y.C.; Chherawala, N.; Aitken, D.; Scott, D.; Winzenberg, T.; Jones, G. Accelerometer-determined physical activity, muscle mass, and leg strength in community-dwelling older adults. J. Cachexia Sarcopenia Muscle 2016, 7, 275–283. [Google Scholar] [CrossRef] [PubMed] [Green Version]
- Reid, N.; Daly, R.M.; Winkler, E.A.H.; Gardiner, P.A.; Eakin, E.G.; Owen, N.; Dunstan, D.W.; Healy, G.N. Associations of Monitor-Assessed Activity with Performance-Based Physical Function. PLoS ONE 2016, 11, e0153398. [Google Scholar] [CrossRef] [PubMed]
- Prioreschi, A.; Brage, S.; Westgate, K.; Norris, S.A.; Micklesfield, L.K. Cardiorespiratory fitness levels and associations with physical activity and body composition in young South African adults from Soweto. BMC Public Health 2017, 17, 301. [Google Scholar] [CrossRef] [PubMed] [Green Version]
- Knaeps, S.; Lefevre, J.; Wijtzes, A.; Charlier, R.; Mertens, E.; Bourgois, J.G. Independent Associations between Sedentary Time, Moderate-To-Vigorous Physical Activity, Cardiorespiratory Fitness and Cardio-Metabolic Health: A Cross-Sectional Study. PLoS ONE 2016, 11, e0160166. [Google Scholar] [CrossRef] [PubMed]
- Velde, J.H.P.M.V.; Savelberg, H.H.C.M.; Schaper, N.C.; Koster, A. Moderate Activity and Fitness, Not Sedentary Time, Are Independently Associated with Cardio-Metabolic Risk in U.S. Adults Aged 18–49. Int. J. Environ. Res. Public Health 2015, 12, 2330–2343. [Google Scholar] [CrossRef] [Green Version]
- Atkin, A.J.; Gorely, T.; Clemes, S.A.; Yates, T.; Edwardson, C.; Brage, S.; Salmon, J.; Marshall, S.J.; Biddle, S.J.H. Methods of Measurement in epidemiology: Sedentary Behaviour. Int. J. Epidemiol. 2012, 41, 1460–1471. [Google Scholar] [CrossRef] [Green Version]
- Campbell, S.D.I.; Brosnan, B.J.; Chu, A.K.Y.; Skeaff, C.M.; Rehrer, N.J.; Perry, T.L.; Peddie, M.C. Sedentary Behavior and Body Weight and Composition in Adults: A Systematic Review and Meta-analysis of Prospective Studies. Sports Med. 2018, 48, 585–595. [Google Scholar] [CrossRef]
- Guthold, R.; Stevens, G.A.; Riley, L.M.; Bull, F.C. Worldwide trends in insufficient physical activity from 2001 to 2016: A pooled analysis of 358 population-based surveys with 1·9 million participants. Lancet Glob. Health 2018, 6, e1077–e1086. [Google Scholar] [CrossRef] [Green Version]
- Compernolle, S.; DeSmet, A.; Poppe, L.; Crombez, G.; Bourdeaudhuij, I.; Cardon, G.; Van der Ploeg, H.P.; Dyck, D.V. Effectiveness of interventions using self-monitoring to reduce sedentary behavior in adults: A systematic review and meta-analysis. Int. J. Behav. Nutr. Phys. Act. 2019, 16, 63. [Google Scholar] [CrossRef]
- Moher, D.; Liberati, A.; Tetzlaff, J.; Altman, D.G.; The PRISMA Group. Preferred Reporting Items for Systematic Reviews and Meta-Analyses: The PRISMA Statement. PLoS Med. 2009, 6, e1000097. [Google Scholar] [CrossRef] [Green Version]
- World Health Organization. Global Recommendations on Physical Activity for Health; World Health Organization: Geneva, Switzerland, 2010; Available online: http://apps.who.int/iris/bitstream/10665/44399/1/9789241599979_eng (accessed on 15 August 2020).
- Panic, N.; Leoncini, E.; de Belvis, G.; Ricciardi, W.; Boccia, S. Evaluation of the endorsement of the preferred reporting items for systematic reviews and meta-analysis (PRISMA) statement on the quality of published systematic review and meta-analyses. PLoS ONE 2013, 8, e83138. [Google Scholar] [CrossRef] [PubMed]
- Malta, M.; Cardoso, L.O.; Bastos, F.I.; Magnanini, M.M.F.; Silva, C.M. Iniciativa STROBE: Subsídios para a comunicação de estudos observacionais. Rev. Saúde Pública 2010, 44, 559–565. [Google Scholar] [CrossRef] [PubMed] [Green Version]
- von Elm, E.; Altman, D.G.; Egger, M.; Pocock, S.J.; Gøtzsche, P.C.; Vandenbroucke, J.P. The strengthening the reporting of observational studies in epidemiology (STROBE) statement: Guidelines for reporting observational studies. Lancet 2007, 370, 1453–1457. [Google Scholar] [CrossRef]
- Sterne, J.A.C.; Sutton, A.J.; Loannidis, J.P.A.; Terrin, N.; Jones, D.R.; Lau, J.; Carpenter, J.; Rücker, G.; Harboard, R.M.; Scmid, C.H.; et al. Recommendations for examining and interpreting funnel plot asymmetry in meta-analyses of randomized controlled trials. BMJ 2011, 342, d4002. [Google Scholar] [CrossRef] [Green Version]
- Borenstein, M.; Hedges, L.V.; Higgins, J.P.T.; Rothstein, H.R. A basic introduction to fixed-effect and random-effects models for meta-analysis. Res. Synth. Methods 2010, 1, 97–111. [Google Scholar] [CrossRef]
- Higgins, J.P.T.; Thompson, S.G.; Deeks, J.J.; Altman, D.G. Measuring inconsistency in meta-analyses. BMJ 2003, 327, 557–560. [Google Scholar] [CrossRef] [Green Version]
- Egger, M.; Smith, G.D.; Schneider, M.; Minder, C. Bias in meta-analysis detected by a simple, graphical test. BMJ 1997, 315, 629. [Google Scholar] [CrossRef] [Green Version]
- Burzynska, A.Z.; Chaddock-Heyman, L.; Voss, M.W.; Wong, C.N.; Gothe, N.P.; Olson, E.A.; Knecht, A.; Lewis, A.; Monti, J.M.; Cooke, G.E.; et al. Physical Activity and Cardiorespiratory Fitness are Beneficial for White Matter in Low-Fit Older Adults. PLoS ONE 2014, 9, e107413. [Google Scholar] [CrossRef]
- Jantunen, H.; Wasenius, N.; Salonen, M.; Perala, M.; Osmond, C.; Kautianen, H.; Simonen, M.; Pohjolainen, P.; Kajantie, E.; Rantanen, T. Objectively measured physical activity and physical performance in old age. Age Ageing 2017, 46, 232–237. [Google Scholar] [CrossRef] [Green Version]
- Gennuso, K.P.; Thraen-Borowski, K.M.; Gangnon, R.E.; Colbert, L.H. Patterns of sedentary behaviour and physical function in older adults. Aging Clin. Exp. Res. 2015, 28, 943–950. [Google Scholar] [CrossRef]
- Liao, Y.; Hsu, H.; Ishii, K.; Koohsari, M.J.; Oka, K. Associations of total amount and patterns of objectively measured sedentary behaviour with performance-based physical function. Prev. Med. Rep. 2018, 12, 128–134. [Google Scholar] [CrossRef] [PubMed]
- Silva, F.M.; Petrica, J.; Serrano, J.; Paulo, R.; Ramalho, A.; Lucas, D.; Ferreira, J.P.; Duarte-Mendes, P. The Sedentary Time and Physical Activity Levels on Physical Fitness in the Elderly: A Comparative Cross-Sectional Study. Int. J. Environ. Res. Public Health 2019, 16, 3697. [Google Scholar] [CrossRef] [PubMed] [Green Version]
- Santos, D.; Silva, A.; Baptista, F.; Santos, R.; Vale, S.; Mota, J.; Sardinha, L. Sedentary behavior and physical activity are independently related to functional fitness in older adults. Exp. Gerontol. 2012, 47, 908–912. [Google Scholar] [CrossRef] [PubMed]
- Savikangas, T.; Tirkkonen, A.; Alen, M.; Rantanen, T.; Fielding, R.A.; Rantalainen, T.; Sipilä, S. Associations of physical activity in detailed intensity ranges with body composition and physical function. A cross-sectional study among sedentary older adults. Eur. Rev. Aging Phys. Act. 2020, 17, 4. [Google Scholar] [CrossRef]
- Yasunaga, A.; Shibata, A.; Ishii, K.; Koohsari, M.J.; Inoue, S.; Sugiyama, T.; Owen, N.; Oka, K. Associations of sedentary behavior and physical activity with older adults’ physical function: An isotemporal substitution approach. BMC Geriatr. 2017, 17, 280–287. [Google Scholar] [CrossRef] [Green Version]
- Zeiher, J.; Ombrellaro, K.J.; Perumal, N.; Keil, T.; Mensink, G.B.M.; Finger, J.D. Correlates and Determinants of Cardiorespiratory Fitness in Adults: A Systematic Review. Sports Med. 2019, 5, 39. [Google Scholar] [CrossRef] [Green Version]
- Cliff, D.P.; Hesketh, K.D.; Vella, S.A.; Hinkley, T.; Tsiros, M.D.; Ridgers, N.D.; Carver, A.; Veitch, J.; Parrish, A.-M.; Hardy, L.L.; et al. Objectively measured sedentary behaviour and health and development in children and adolescents: Systematic review and meta-analysis. Obes. Rev. 2016, 17, 330–344. [Google Scholar] [CrossRef] [Green Version]
- Thijssen, D.H.; Green, D.J.; Hopman, M.T. Blood vessel remodeling and physical inactivity in humans. J. Appl. Physiol. 2011, 111, 1836–1845. [Google Scholar] [CrossRef]
- Wang, D.X.M.; Yao, J.; Zirek, Y.; Reijnierse, E.M.; Maier, A.B. Muscle mass, strength, and physical performance predicting activities of daily living: A meta-analysis. J. Cachexia Sarcopenia Muscle 2020, 11, 3–25. [Google Scholar] [CrossRef] [Green Version]
- Wullems, J.A.; Verschueren, S.M.P.; Degens, H.; Morse, C.; Onambélé, G.L. A review of the assessment and prevalence of sedentarism in older adults, its physiology/health impact and non-exercise mobility counter-measures. Biogerontology 2016, 17, 547–565. [Google Scholar] [CrossRef] [Green Version]
- Chastin, S.F.M.; Ferriolli, E.; Stephens, N.A.; Fearon, K.C.H.; Greig, C. Relationship between sedentary behaviour, physical activity, muscle quality and body composition in healthy older adults. Age Ageing 2012, 41, 111–114. [Google Scholar] [CrossRef] [PubMed] [Green Version]
- Gianoudis, J.; Bailey, C.A.; Daly, R.M. Associations between sedentary behaviour and body composition, muscle function and sarcopenia in community-dwelling older adults. Osteoporos. Int. 2015, 26, 571–579. [Google Scholar] [CrossRef]
- Westbury, L.D.; Fuggle, N.R.; Syddall, H.E.; Duggal, N.A.; Shaw, S.C.; Maslin, K.; Dennison, E.M.; Lord, J.M.; Cooper, C. Relationships between Markers of Inflammation and Muscle Mass, Strength and Function: Findings from the Hertfordshire Cohort Study. Calcif. Tissue Int. 2018, 102, 287–295. [Google Scholar] [CrossRef] [PubMed] [Green Version]
- Schaap, L.A.; Pluijm, S.M.F.; Deeg, D.J.H.; Harris, T.B.; Kritchevsky, S.B.; Newman, A.B.; Colbert, L.H.; Pahor, M.; Rubin, S.M.; Tylavsky, F.A. Higher Inflammatory Marker Levels in Older Persons: Associations with 5-Year Change in Muscle Mass and Muscle Strength. J. Gerontol. A Biol. Sci. Med. Sci. 2009, 64, 1183–1189. [Google Scholar] [CrossRef] [PubMed] [Green Version]
- Lord, S.R.; Clark, R.D.; Webster, I.W. Postural Stability and Associated Physiological Factors in a Population of Aged Persons. J. Gerontol. A Biol. Sci. Med. Sci. 1991, 46, 69–76. [Google Scholar] [CrossRef] [PubMed]
- Choy, N.L.; Brauer, S.; Nitz, J. Changes in postural stability in women aged 20 to 80 years. J. Gerontol. A Biol. Sci. Med. Sci. 2003, 58, 525–530. [Google Scholar] [CrossRef] [Green Version]
- Medeiros, H.B.; de Araujo, D.S.; de Araujo, C.G. Age-related mobility loss is joint-specifc: An analysis from 6000 Flexitest results. Age 2013, 35, 2399–2407. [Google Scholar] [CrossRef] [Green Version]
- Zhao, Y.; Chung, P. Differences in function fitness among older adults with and without risk of falling. Asian Nurs. Res. 2016, 10, 51–55. [Google Scholar] [CrossRef] [Green Version]
- Mañas, A.; Del Pozo-Cruz, B.; García-García, F.J.; Guadalupe-Grau, A.; Ara, I. Role of objectively measured sedentary behaviour in physical performance, frailty and mortality among older adults: A short systematic review. Eur. J. Sport Sci. 2017, 17, 940–953. [Google Scholar] [CrossRef]
- Wirth, K.; Klenk, J.; Brefka, S.; Dallmeier, D.; Faehling, K.; Figuls, M.R.; Tully, M.A.; Giné-Garriga, M.; Caserotti, P.; Salvà, A.; et al. Biomarkers associated with sedentary behaviour in older adults: A Systematic review. Ageing Res. Rev. 2017, 35, 87–111. [Google Scholar] [CrossRef] [Green Version]
- Biddle, S.J.; Bennie, J.A.; De Cocker, K.; Dunstan, D.; Gardiner, P.A.; Healy, G.N.; Lynch, B.; Owen, N.; Brakenridge, C.; Brown, W.; et al. Controversies in the Science of Sedentary Behaviour and Health: Insights, Perspectives and Future Directions from the 2018 Queensland Sedentary Behaviour Think Tank. Int. J. Environ. Res. Public Health 2019, 16, 4762. [Google Scholar] [CrossRef] [PubMed] [Green Version]
- Lavie, C.J.; Ozemek, C.; Carbone, S.; Katzmarzyk, P.T.; Blair, S.N. Sedentary Behavior, Exercise, and Cardiovascular Health. Circ. Res. 2019, 124, 799–815. [Google Scholar] [CrossRef] [PubMed]
- Thyfault, J.P.; Du, M.; Kraus, W.E.; Levine, J.A.; Booth, F.W. Physiology of Sedentary Behavior and its Relationship to Health Outcomes. Med. Sci. Sports Exerc. 2015, 47, 1301–1305. [Google Scholar] [CrossRef] [Green Version]
- Migueles, J.H.; Cadenas-Sanchez, C.; Ekelund, U.; Nyström, C.D.; Mora-Gonzalez, J.; Löf, M.; Labayen, I.; Ruiz, J.R.; Ortega, F.B. Accelerometer data collection and processing criteria to assess physical activity and other outcomes: A systematic review and practical considerations. Sports Med. 2017, 47, 1821–1845. [Google Scholar] [CrossRef] [PubMed]


| Study | 1 | 2 | 3 | 4 | 5 | 6 | 7 | 8 | 9 | 10 | 11 | 12 | 13 | 14 | 15 | 16 | 17 | 18 | 19 | 20 | 21 | 22 | 100% | 22 |
|---|---|---|---|---|---|---|---|---|---|---|---|---|---|---|---|---|---|---|---|---|---|---|---|---|
| 1. Burzynska et al. (2014) [49] | 1 | 1 | 1 | 0 | 0 | 1 | 1 | 1 | 1 | 1 | 1 | 1 | 0 | 1 | 1 | 1 | 1 | 1 | 0 | 1 | 1 | 1 | 82 | 18 |
| 2. Cooper et al. (2015) [21] | 1 | 1 | 0 | 1 | 1 | 0 | 1 | 1 | 1 | 1 | 1 | 1 | 1 | 1 | 1 | 1 | 1 | 1 | 1 | 1 | 1 | 1 | 91 | 20 |
| 3. Davis et al. (2014) [13] | 1 | 1 | 1 | 1 | 1 | 0 | 1 | 1 | 0 | 1 | 1 | 1 | 1 | 1 | 1 | 1 | 1 | 1 | 0 | 1 | 1 | 1 | 86 | 19 |
| 4. Dickie et al. (2015) [25] | 1 | 1 | 0 | 1 | 1 | 1 | 1 | 1 | 0 | 1 | 1 | 1 | 1 | 1 | 1 | 1 | 0 | 1 | 1 | 1 | 1 | 1 | 86 | 19 |
| 5. Dogra et al. (2017) [22] | 1 | 1 | 0 | 1 | 1 | 1 | 1 | 1 | 0 | 1 | 1 | 1 | 1 | 1 | 1 | 1 | 0 | 1 | 1 | 1 | 1 | 0 | 82 | 18 |
| 6. Edwards and Loprinzi (2016) [27] | 1 | 1 | 1 | 1 | 1 | 0 | 1 | 1 | 0 | 1 | 1 | 1 | 1 | 1 | 1 | 1 | 1 | 1 | 1 | 1 | 1 | 1 | 91 | 20 |
| 7. Foong et al. (2016) [31] | 1 | 1 | 0 | 1 | 1 | 1 | 1 | 1 | 0 | 1 | 1 | 1 | 1 | 1 | 1 | 1 | 1 | 1 | 1 | 1 | 1 | 1 | 91 | 20 |
| 8. Gennuso et al. (2015) [51] | 1 | 1 | 1 | 1 | 1 | 0 | 1 | 1 | 0 | 1 | 1 | 1 | 1 | 1 | 1 | 1 | 1 | 1 | 1 | 1 | 1 | 1 | 91 | 20 |
| 9. Jantunen et al. (2017) [50] | 1 | 1 | 0 | 1 | 1 | 0 | 1 | 1 | 0 | 1 | 1 | 1 | 1 | 1 | 1 | 1 | 1 | 1 | 1 | 1 | 1 | 0 | 82 | 18 |
| 10. Knaeps et al. (2016) [34] | 1 | 1 | 1 | 1 | 1 | 0 | 1 | 1 | 0 | 1 | 1 | 1 | 1 | 1 | 1 | 1 | 1 | 1 | 1 | 1 | 1 | 1 | 91 | 20 |
| 11. Liao et al. (2018) [52] | 1 | 1 | 1 | 1 | 1 | 1 | 1 | 1 | 0 | 1 | 1 | 1 | 1 | 1 | 1 | 1 | 1 | 1 | 1 | 1 | 1 | 1 | 95 | 21 |
| 12. Silva et al. (2019) [53] | 1 | 1 | 1 | 1 | 1 | 1 | 1 | 1 | 0 | 1 | 1 | 1 | 0 | 1 | 1 | 1 | 0 | 1 | 1 | 1 | 1 | 1 | 86 | 19 |
| 13. Prioreschi et al. (2017) [33] | 1 | 1 | 0 | 1 | 1 | 1 | 1 | 1 | 0 | 1 | 1 | 1 | 1 | 1 | 1 | 1 | 1 | 1 | 1 | 1 | 1 | 1 | 91 | 20 |
| 14. Santos et al. (2012) [54] | 1 | 1 | 0 | 1 | 1 | 1 | 1 | 1 | 0 | 1 | 1 | 1 | 1 | 1 | 1 | 1 | 1 | 1 | 1 | 1 | 1 | 1 | 91 | 20 |
| 15. Savikangas et al. (2020) [55] | 1 | 1 | 1 | 1 | 1 | 1 | 1 | 1 | 0 | 1 | 1 | 1 | 1 | 1 | 1 | 1 | 1 | 1 | 1 | 1 | 1 | 1 | 95 | 21 |
| 16. Spartano et al. (2019) [23] | 1 | 1 | 1 | 1 | 1 | 1 | 1 | 1 | 0 | 1 | 1 | 1 | 1 | 1 | 1 | 1 | 1 | 1 | 1 | 1 | 1 | 1 | 95 | 21 |
| 17. Velde et al. (2015) [35] | 1 | 1 | 0 | 1 | 1 | 1 | 1 | 1 | 0 | 1 | 1 | 1 | 1 | 1 | 1 | 1 | 1 | 1 | 1 | 1 | 1 | 1 | 91 | 20 |
| 18. Wientzek et al. (2013) [26] | 1 | 1 | 1 | 1 | 1 | 1 | 1 | 1 | 0 | 1 | 1 | 1 | 1 | 1 | 1 | 1 | 1 | 1 | 1 | 1 | 1 | 1 | 95 | 21 |
| 19. Willoughby and Copeland (2015) [29] | 1 | 1 | 1 | 1 | 1 | 1 | 1 | 1 | 1 | 1 | 1 | 1 | 1 | 1 | 1 | 1 | 1 | 1 | 1 | 1 | 1 | 1 | 100 | 22 |
| 20. Wu et al. (2017) [30] | 1 | 1 | 0 | 1 | 1 | 1 | 1 | 1 | 1 | 1 | 1 | 1 | 1 | 1 | 1 | 1 | 1 | 1 | 1 | 1 | 1 | 1 | 95 | 21 |
| 21. Yasunaga et al. (2017) [56] | 1 | 1 | 0 | 1 | 1 | 1 | 1 | 1 | 0 | 1 | 1 | 1 | 1 | 1 | 1 | 1 | 1 | 1 | 1 | 1 | 1 | 1 | 91 | 20 |
| Mean of total scores | 90 | 20 |
| Author, Year, Country, Study Name | Sample Size (n total; n ♂/ n ♀) | Age (Years ± SD; Range) | Sedentary Behavior Assessment (Data Reduction and Quantification of Sedentary Time) | Physical Fitness Assessment | Central Outcomes | Main Goal | Conclusions |
|---|---|---|---|---|---|---|---|
| 1. Burzynska et al. (2014) [49] United States of America | 88 (33 ♂; 55 ♀) | 65 ± 4 (60–78 y) | Device: ActiGraph GT3X; SB cut-point: ≤100 counts/min; Epoch: NA; Non-wear: 30 min; Minimum wear: ≥3 d, ≥600 min/day; Average wear (days and h/day): 6.8 ± 0.8 days, 13.7 ± 1.3 h/day; Quantification of SB: Total ST (h/day). | CRF (modified Balke graded maximal exercise test (mL/kg/min)). | PA levels, ST, CRF and White Matter integrity | To examine the association of both PA and CRF with measures of white matter integrity. | CRF was negatively associated with ST (r = −0.36; p = 0.001) |
| 2. Cooper et al. (2015) [21] Britain MRC NSHD | 1727 (837 ♂; 890 ♀) | 63.3 (60–64 y) | Device: Actiheart, CamNtech; SB cut-point: ≤1.5 METs; Epoch: 30 s; Non-wear: 60 min; Minimum wear: ≥2 days; Average wear (days and min/day): NA; Quantification of SB: Total ST (h/day). | Muscular strength (handgrip strength test (kg); chair rise time (s)); balance (standing balance time (s)). | ST, MVPA, PAEE, strength, balance, gait speed | To investigate the associations of ST, MVPA and PAEE with physical capability measures at age 60–64 years. | Greater time spent sedentary was associated with lower grip strength (kg), chair rise (stands/min) and standing balance time (s) (p < 0.05). |
| 3. Davis et al. (2014) [13] United Kingdom Project OPAL (Older People and Active Living) | 217 (108 ♂; 109 ♀) | 78.1 ± 5.8 (NA) | Device: ActiGraph GT1M; SB cut-point: ≤100 counts/min; Epoch: 60 s; Non-wear: 100 min; Minimum wear: ≥5 days, ≥600 min/day; Average wear (days and min/day): NA, 14.4 ± 1.4 h/day; Quantification of SB: Total ST (min/h). | Balance (ability to maintain tandem, semitandem and side-by-side stands for 10s (score)); muscular strength (chair rise (score)). | ST, frequency of ST breaks and lower extremity strength | To evaluate the relationship of objectively measured ST, frequency of breaks in ST and lower extremity function | Negative association between ST with balance (r = −0.386, p < 0.05) and lower limb strength (r = −0.376, p < 0.05). |
| 4. Dickie et al. (2015) [25] South Africa | 76 (76 ♀) | 34 ± 7 (25–52 y) | Device: ActiGraph MTI 7164; SB cut-point: ≤100 counts/min; Epoch: 60 s; Non-wear: 60 min; Minimum wear: ≥4 days, ≥600 min/day; Average wear (days and min/day): NA; Quantification of SB: Total ST (min/day). | CRF (Submaximal MRC Step test, predicted VO2max (mL/kg/min)). | PA, CRF, body composition and cardiometabolic risk factors | To examine the independent associations of PA, CRF and ST on body composition and cardiometabolic risk factors for CVD and T2D in black South African women. | CRF was negatively associated with ST (r = −0.31, p = 0.031). |
| 5. Dogra et al. (2017) [22] Canada Canadian Health Measures Survey | 1157 (564 ♂; 593 ♀) | 64 (60–69 y) | Device: Actical accelerometer; SB cut-point: ≤100 counts/min; Epoch: 60 s; Non-wear: 60 min; Minimum wear: ≥4 days, ≥600 min/day; Average wear (days and min/d): NA, 595 min/day; Quantification of SB: Total ST (min/day), ST bouts, ST breaks. | CRF (Canadian Aerobic Fitness Test (ml/kg/min)); Flexibility (Sit-and-reach (cm)); Muscular strength (hand grip strength (kg)). | ST, ST breaks, CRF and musculoskeletal fitness | To analyze the associations between total ST and ST breaks with CRF and musculoskeletal fitness. | ST was negatively associated with CRF (r = −0.135, p < 0.05) and handgrip strength (r = −0.014, p < 0.05). |
| 6. Edwards and Loprinzi (2016) [27] US NHANES 2003-2004 | 307 (54.2% ♂; 45.8% ♀) | 34.3 (20–49 y) | Device: ActiGraph MTI 7164; SB cut-point: ≤99 counts/min; Epoch: 60 s; Non-wear: 60 min; Minimum wear: ≥4 days, ≥600 min/d; Average wear (days and min/day): NA; Quantification of SB: Total ST (min/day). | CRF (treadmill-based CRF component (mL/kg/min)). | MVPA, ST, CRF, metabolic syndrome | To evaluate the independent and additive associations of MVPA, SB, CRF with metabolic syndrome. | ST was not associated with CRF (r = −0.11, p = 0.06). |
| 7. Foong et al. (2016) [31] Australia Tasmanian Older Adult Cohort study, | 636 (313 ♂; 323 ♀) | 66.0 ± 6.7 (50–80 y) | Device: ActiGraph GT1M; SB cut-point: ≤100 counts/min; Epoch: NA; Non-wear: NA; Minimum wear: ≥4 days, ≥600 min/day; Average wear (days and min/day): NA; Quantification of SB: Total ST (min/day). | Muscular strength (knee extension strength (kg); leg strength (kg)). | PA, muscle mass and lower-limb strength | To describe the relationship between accelerometer-determined PA, muscle mass and lower-limb strength in community-dwelling older adults. | ST was not associated with muscular strength (leg strength, r = −0.30, p = 0.162; knee extension strength, r = −0.1, p = 0.072). |
| 8. Gennuso et al. (2015) [51] Wisconsin | 44 (16 ♂; 28 ♀) | 70 ± 8 (68–76 y) | Device: activPAL PA monitor; SB cut-point: Postural classification; Epoch: NA; Non-wear: NA; Minimum wear: ≥3 days, ≥600 min/day; Average wear (days and min/day): NA; Quantification of SB: Total ST (h/day), SB bout length, break rate. | Muscular strength (chair stand (score)); CRF (400-m walk (m/s)). | Total ST, patterns of SB, strength and aerobic fitness | To examine the relationship between various objectively measured SB variables and physical function. | Total ST was not associated with muscular strength and CRF (p > 0.05). |
| 9. Jantunen et al. (2017) [50] Finland Helsinki Birth Cohort Study | 695 (316 ♂; 379 ♀) | 70.7 ± 2.7 (NA) | Device: SenseWear Pro 3 Armband; SB cut-point: ≤1.5 MET; Epoch: NA; Non-wear: NA; Minimum wear: ≥5 days (include 1 weekend day); Average wear (days and min/day): NA, 1436.8 ± 6.0 min/day; Quantification of SB: Total ST (h/day). | CRF (6 MWT (m)); muscular strength (chair stand and arm curl (reps)); flexibility (chair sit-and-reach and Back scratch (cm)). | PA levels, ST, physical fitness | To explore the association between objectively measured PA and physical performance in old age. | ST was negatively correlated with physical fitness components (lower limb strength, r = −0.18, p < 0.001; upper limb strength, r = −0.12, p < 0.001; and CRF, r = −0.15, p < 0.001). |
| 10. Knaeps et al. (2016) [34] Belgium Flemish longitudinal study | 341 (207 ♂; 134 ♀) | 53.8 ± 8.9 (29–82 y) | Device: SenseWear Pro 3 Armband; SB cut-point: ≤1.5 MET; Epoch: NA; Non-wear: NA; Minimum wear: ≥3 days (1 weekday and both weekend days), ≥1296 min/day; Average wear (days and min/day): NA; Quantification of SB: Total ST (h/day). | CRF (Cycle Ergometer, Lode, Groningen, the Netherlands, predicted VO2max (mL/kg/min)). | ST, MVPA, CRF, cardiometabolic risk markers | To study the independent associations of ST, MVPA and objectively measured CRF with cardiometabolic risk markers and individual components. | ST was not associated with CRF (r = −0.09; p = 0.11). |
| 11. Liao et al. (2018) [52] Japan | 281 (174 ♂; 107 ♀) | 74.5 ± 5.2 (65–84 y) | Device: Active Style Pro HJA-350IT; SB cut-point: ≤1.5 METs; Epoch: 60 s; Non-wear: 60 min; Minimum wear: ≥4 days (include 1 weekend day), ≥600 min/d; Average wear (days and min/day): NA, 900.9 ± 86.4 min/day; Quantification of SB: Total ST (min/day), sedentary bouts, sedentary breaks. | Muscular strength (hand grip strength test (kg)); balance (eye-open one leg standing test (s)). | ST, balance, gait speed and strength | To examine the associations between objectively measured SB and physical function among older Japanese adults. | Total ST was not associated with handgrip (r = −0.083, p = 0.165) and balance (r = −0.061, p = 0.411) |
| 12. Silva et al. (2019) [53] Portugal | 83 (27 ♂; 56 ♀) | 72.14 ± 5.61 (65–87 y) | Device: ActiGraph GT1M; SB cut-point: ≤100 counts/min; Epoch: 15 s; Non-wear: 60 min; Minimum wear: ≥3 days (include 1 weekend day), ≥600 min/day; Average wear (days and min/day): NA, 782.47 ± 80.59 min/day; Quantification of SB: Total ST (min/day). | CRF (6 MWT (m)); muscular strength (Chair stand and arm curl (reps)); flexibility (chair sit-and-reach and Back scratch (cm)). | PA levels, ST, physical fitness | To examine the relationship between ST, LPA and MVPA with the elderly’s physical fitness. | ST was not significantly associated with physical fitness measures (p > 0.05). |
| 13. Prioreschi et al. (2017) [33] South Africa Birth to Twenty (BT20) cohort study | 409 (218 ♂; 191 ♀) | NA (19–20 y) | Device: ActiGraph GT1M; SB cut-point: ≤100 counts/min; Epoch: 5 s; Non-wear: 90 min; Minimum wear: ≥3 days, ≥500 min/day; Average wear (days and min/day): NA; Quantification of SB: Total ST (min/d). | CRF (Submaximal Ramped Step Test (mlO2/kg/min)). | PA levels, fitness, BMI | To describe fitness and objectively measure PA levels and patterns in adults, as well as to examine associations between PA, fitness and BMI. | ST was not associated with CRF (r = 0.00, p = 0.42). |
| 14. Santos et al. (2012) [54] Portugal | 312 (117 ♂; 195 ♀) | 74.3 ± 6.6 (65–103 y) | Device: ActiGraph GT1M; SB cut-point: ≤100 counts/min; Epoch: 15 s; Non-wear: 60 min; Minimum wear: ≥3 days (include 1 weekend day), ≥600 min/day; Average wear (days and min/day): NA; Quantification of SB: Total ST (min/day). | CRF (6 MWT (m)); muscular strength (Chair stand and arm curl (reps)); flexibility (chair sit-and-reach and back scratch (cm)). | PA levels, ST, physical fitness | To examine the independent impact of objectively measured MVPA and ST on functional fitness. | ST was negatively associated with physical fitness components (upper limb strength, r = −0.013, p < 0.05; lower limb strength, r = −0.010, p < 0.05; CRF, r = −0.301, p < 0.05). |
| 15. Savikangas et al. (2020) [55] Finland PASSWORD -study | 293 (122 ♂; 171 ♀) | 74.44 ± 3.78 (70–85 y) | Device: UKK RM42 accelerometer (UKK, Tampere, Finland); SB cut-point: bin threshold <0.0167 g; Epoch: 5 s; Non-wear: 60 min; Minimum wear: ≥3 days, ≥600 min/day; Average wear (days and h/day): 6.7 days; 14.1 h/day; Quantification of SB: Total ST (min/day). | CRF (6 MWT (m)). | PA, body composition, physical function | To investigate the associations of particular PA intensities with body composition and physical function among older adults. | ST was negatively associated with CRF (r = −0.170, p < 0.01). |
| 16. Spartano et al. (2019) [23] US Framingham Offspring Study | 1352 (46% ♂; 54% ♀) | 68.6 ± 7.5 (NA) | Device: Actical model no. 198-0200-00; SB cut-point: ≤200 cpm; Epoch: 60 s; Non-wear: 60 min; Minimum wear: ≥4 days, ≥600 min/day; Average wear (days and min/day): NA, 749 ± 71 min/day; Quantification of SB: Total ST (%/day). | Muscular strength (handgrip strength test (kg); chair stand(s)). | PA, ST, gait speed, strength | To explore associations of PA/ST with physical performance across mid-older age in adults. | ST was associated with poorer performance on chair stand test (p < 0.001) and handgrip in men (p = 0.025). |
| 17. Velde et al. (2015) [35] US NHANES 2003–2004 | 543 (297 ♂; 246 ♀) | 32.19 ± 0.57 (18–49 y) | Device: ActiGraph AM-7164; SB cut-point: ≤100 counts/min; Epoch: 60 s; Non-wear: 60 min; Minimum wear: ≥1 day, ≥600 min/d; Average wear (days and min/day): NA, 851.87 ± 4.5 min/day; Quantification of SB: Total ST (min/day). | CRF (submaximal treadmill test (mL/kg/min)). | ST, PA, CRF and cardiometabolic risk factors | To examine and compare the independent associations of objectively measured ST, MVPA and fitness with cardiometabolic risk factors. | The correlation between ST and CRF was r = 0.11. |
| 18. Wientzek et al. (2013) [26] Denmark, Greece, the Netherlands, United Kingdom, Italy, Spain, France, etc. EPIC-Europe cohort | 1895 (578 ♂; 1317 ♀) | 53.78 ± 9.36 (NA) | Device: Actiheart, CamNtech; SB cut-point: <0.25 m/s2/d; Epoch: 60 s; Non-wear: NA; Minimum wear: ≥4 days, NA; Average wear (days and min/day): NA; Quantification of SB: Total ST (%/day). | CRF (8-min submaximal ramped step test (ml/kg/min)); | PA, CRF and anthropometry | To quantify the independent associations between objectively measured total PA, MVPA, ST and CRF and anthropometric markers in apparently healthy European men and women. | ST was negatively associated with CRF in men (r = −0.35, p < 0.01) and women (r = −0.26, p < 0.01). |
| 19. Willoughby and Copeland (2015) [29] Canada | 49 (49 ♀) | 56.6 ± 4.1 (50–67 y) | Device: ActiGraph GT3X; SB cut-point: ≤100 counts/min; Epoch: 60 s; Non-wear: 90 min; Minimum wear: ≥4 days, ≥600 min/d; Average wear (days and min/d): NA; Quantification of SB: Total ST (%/day), number of sedentary breaks. | Balance (NeuroCom Equitest CRS+ Balance Master computerized dynamic posturography system); muscular strength (peak torque of the dominant knee extensors and flexors). | ST, lower body muscular strength and postural stability | To determine whether ST is negatively associated with laboratory-based measures of lower body muscular strength and postural stability in middle-aged women. | Balance and relative peak torque of the knee flexors were significantly associated with ST (r = −0.35, p = 0.01 and r = −0.31, p = 0.03, respectively). |
| 20. Wu e al. (2017) [30] Australia 2000 Tasmanian Electoral Roll | 309 (309 ♀) | 50 ± 5 (36–57 y) | Device: ActiGraph GT1M; SB cut-point: ≤150 counts/min; Epoch: 60 s; Non-wear: NA; Minimum wear: ≥5 days, ≥600 min/day; Average wear (days and min/day): NA, 851 min/day; Quantification of SB: Total ST (min/day). | Muscular strength (lower limb muscular strength (kg)); balance (step test (steps), functional reach test (cm) and lateral reach test (cm)). | PA levels, ST, lumbar spine and femoral neck, bone mineral density, muscular strength and balance | To describe associations between objectively-measured PA and ST and musculoskeletal health outcomes in middle-aged women. | ST was not associated with muscular strength and balance (p > 0.05). |
| 21. Yasunaga et al. (2017) [56] Japan | 287 (180 ♂; 107 ♀) | 74.4 ± 5.2 (65–84 y) | Device: Active style Pro HJA-350IT; SB cut-point: ≤1.5 METs; Epoch: 60 s; Non-wear: 60 min; Minimum wear: ≥4 days (include 1 weekend day), ≥600 min/day; Average wear (days and min/day): 7.2 ± 0.9 days, 901.1 ± 87.5 min/day; Quantification of SB: Total ST (min/day). | Muscular strength (hand grip strength (kg)); balance (one-legged stance with eyes open (s)). | SB, PA, gait speed, balance, mobility, strength | To examine the associations of objectively-assessed ST and PA with performance-based physical function. | ST was not associated with muscular strength (r = −0.056, p > 0.05) and balance (r = −0.238, p > 0.05). |
Publisher’s Note: MDPI stays neutral with regard to jurisdictional claims in published maps and institutional affiliations. |
© 2020 by the authors. Licensee MDPI, Basel, Switzerland. This article is an open access article distributed under the terms and conditions of the Creative Commons Attribution (CC BY) license (http://creativecommons.org/licenses/by/4.0/).
Share and Cite
Silva, F.M.; Duarte-Mendes, P.; Rusenhack, M.C.; Furmann, M.; Nobre, P.R.; Fachada, M.Â.; Soares, C.M.; Teixeira, A.; Ferreira, J.P. Objectively Measured Sedentary Behavior and Physical Fitness in Adults: A Systematic Review and Meta-Analysis. Int. J. Environ. Res. Public Health 2020, 17, 8660. https://0-doi-org.brum.beds.ac.uk/10.3390/ijerph17228660
Silva FM, Duarte-Mendes P, Rusenhack MC, Furmann M, Nobre PR, Fachada MÂ, Soares CM, Teixeira A, Ferreira JP. Objectively Measured Sedentary Behavior and Physical Fitness in Adults: A Systematic Review and Meta-Analysis. International Journal of Environmental Research and Public Health. 2020; 17(22):8660. https://0-doi-org.brum.beds.ac.uk/10.3390/ijerph17228660
Chicago/Turabian StyleSilva, Fernanda M., Pedro Duarte-Mendes, Marcio Cascante Rusenhack, Meirielly Furmann, Paulo Renato Nobre, Miguel Ângelo Fachada, Carlos M. Soares, Ana Teixeira, and José Pedro Ferreira. 2020. "Objectively Measured Sedentary Behavior and Physical Fitness in Adults: A Systematic Review and Meta-Analysis" International Journal of Environmental Research and Public Health 17, no. 22: 8660. https://0-doi-org.brum.beds.ac.uk/10.3390/ijerph17228660