A Systematic Review of Methods and Criteria Standard Proposal for the Use of Principal Component Analysis in Team’s Sports Science

 ,
,  ,
,  and
and 
Abstract
:1. Introduction
2. Materials and Methods
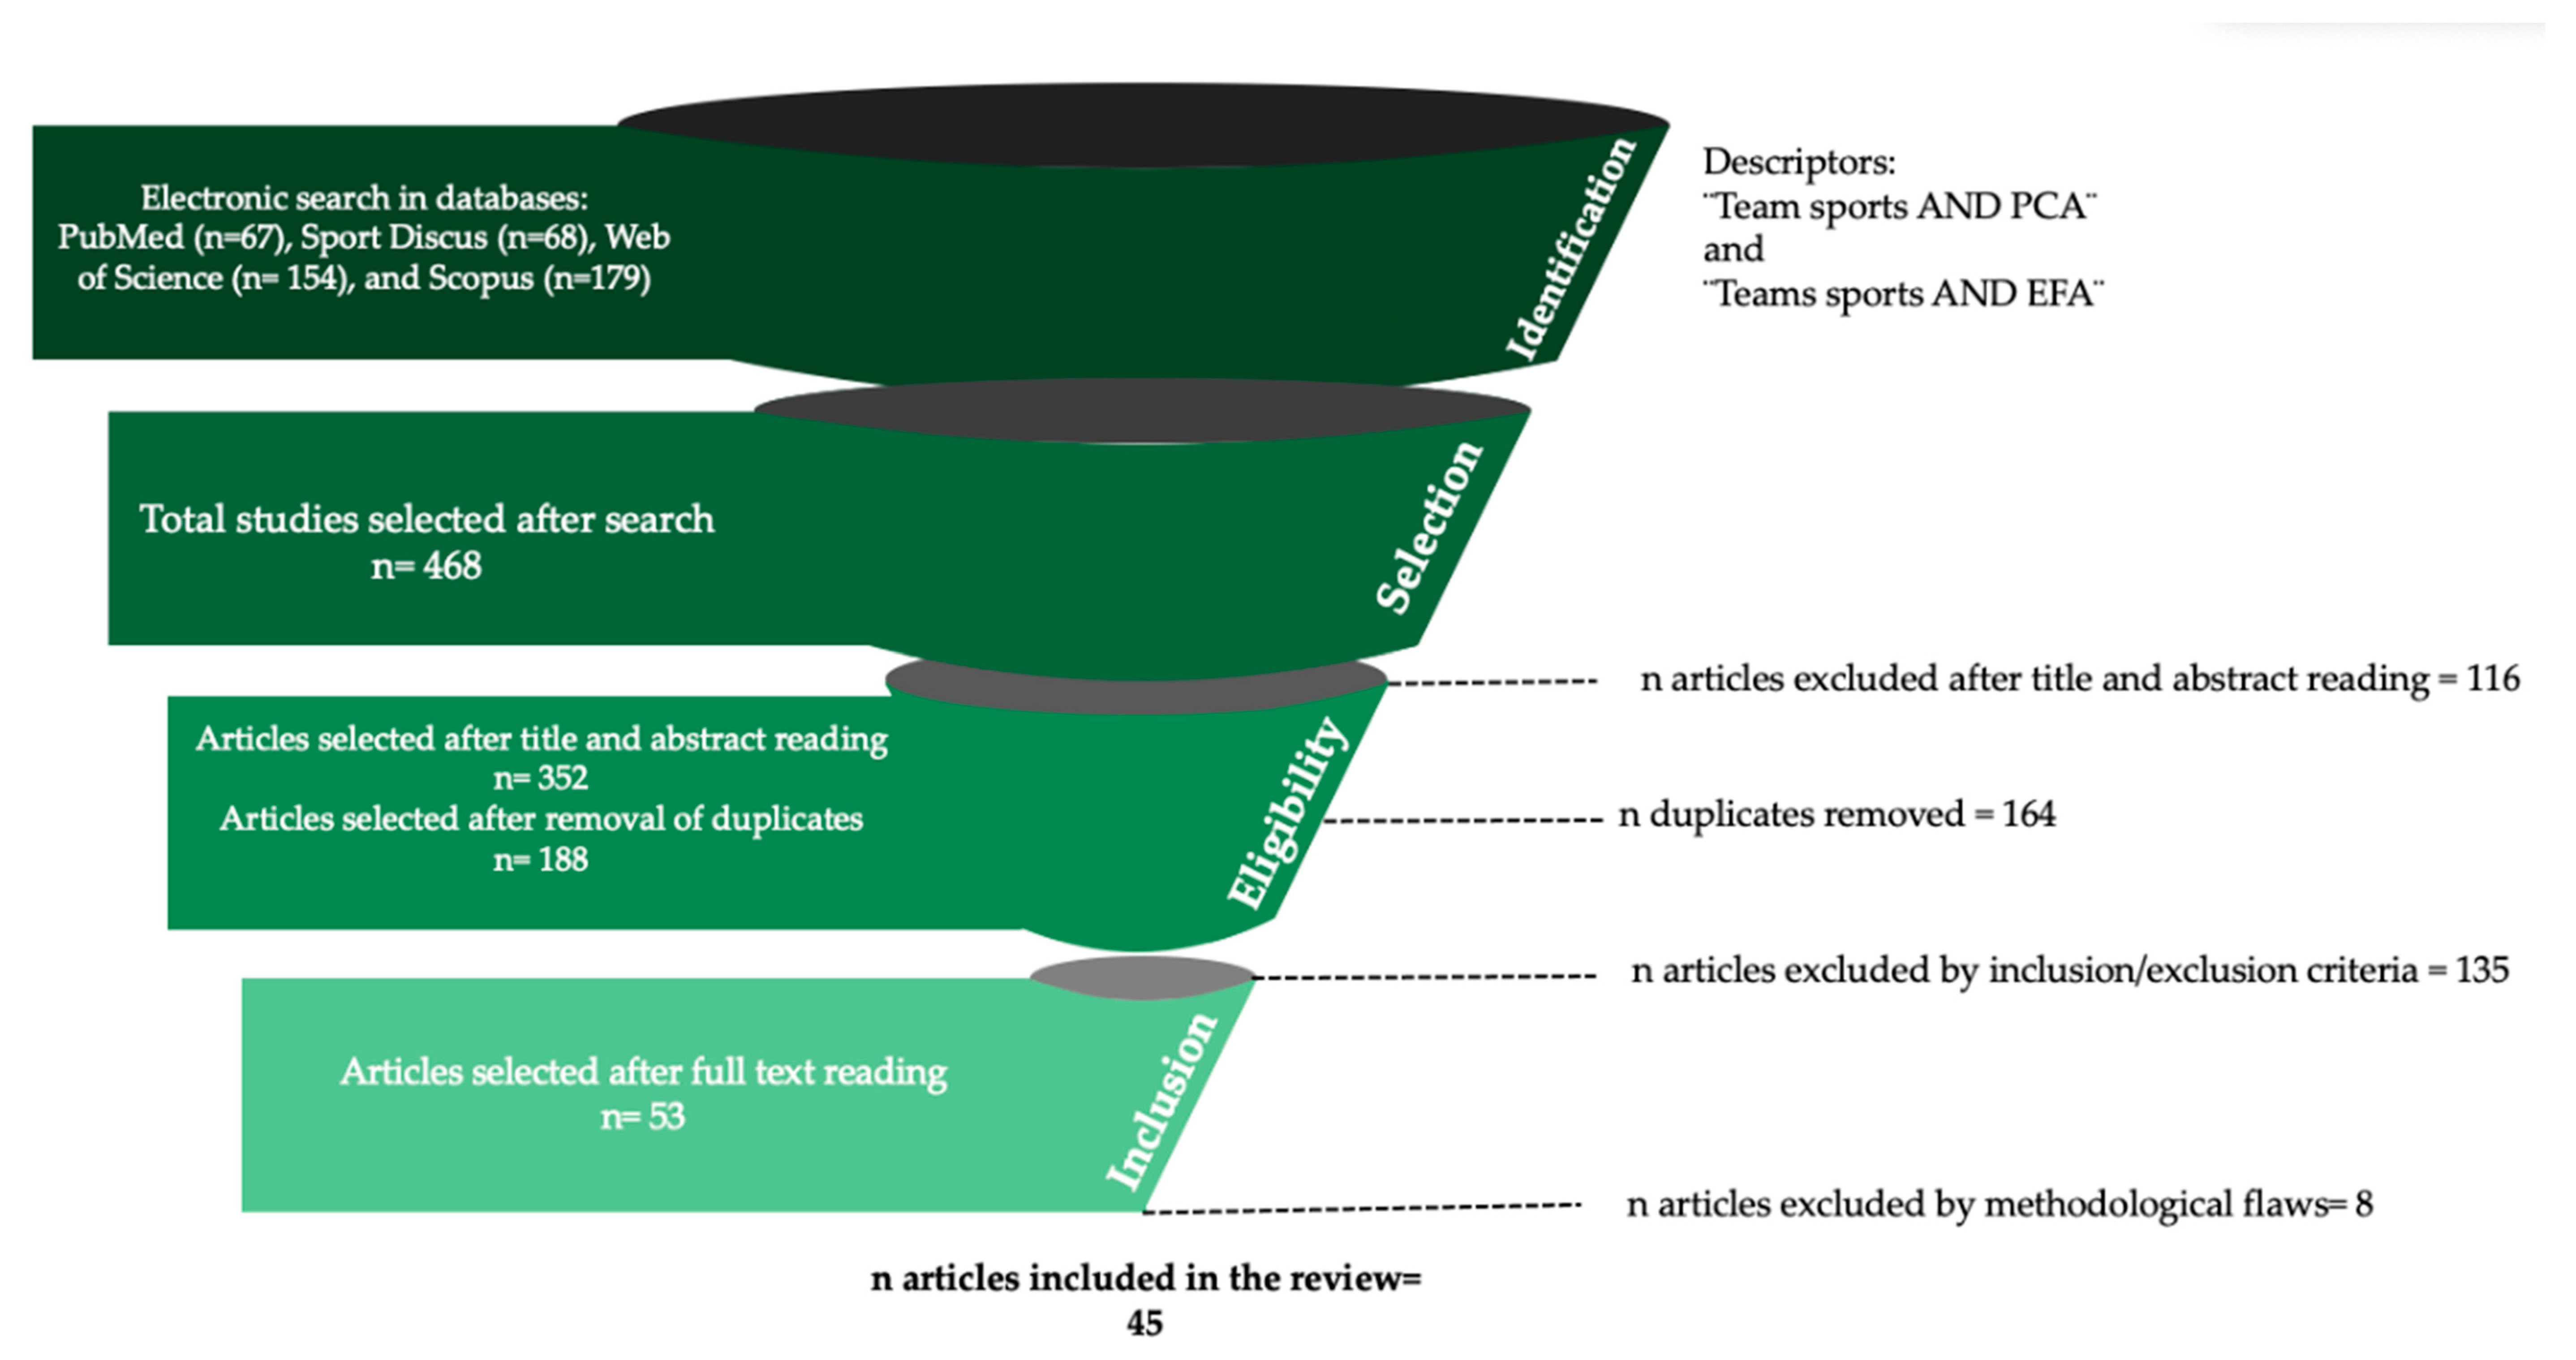
2.1. Information Sources and Search Strategy
2.2. Studies Selection
2.3. Data Collecting
3. Results
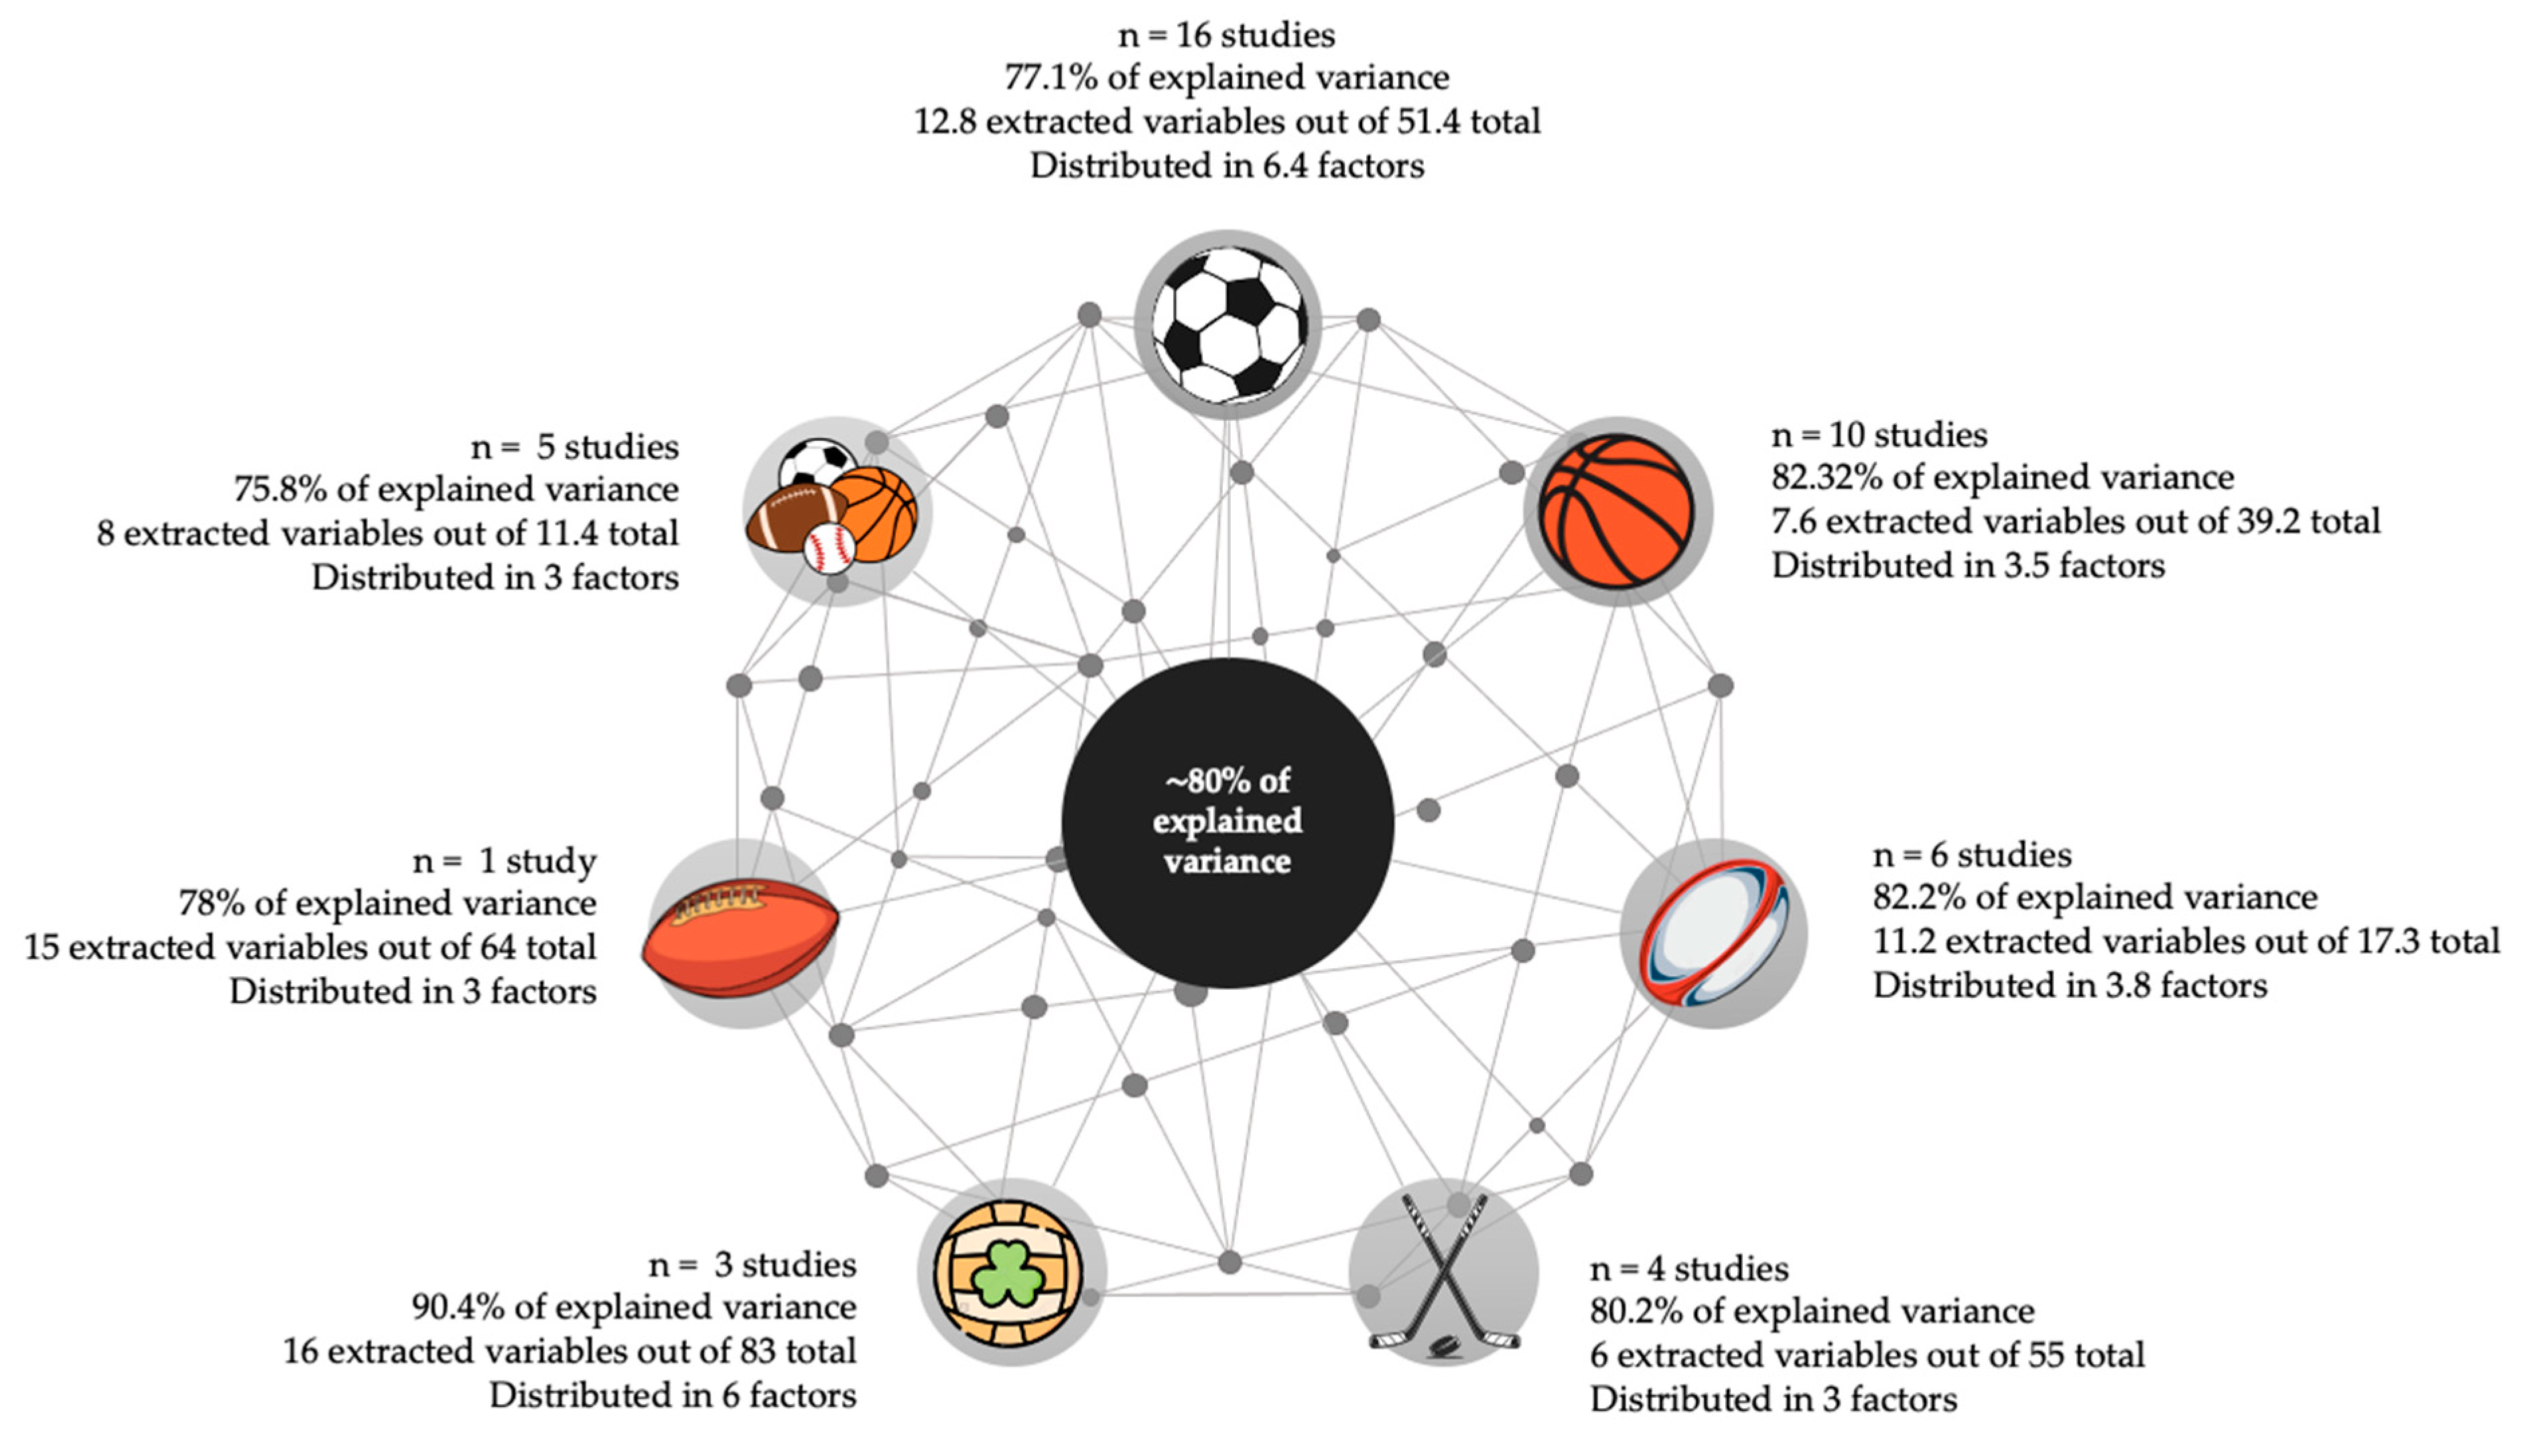
3.1. Sample Characteristics
3.2. Methodological Criteria Used
4. Discussion
5. Conclusions
Author Contributions
Funding
Conflicts of Interest
References
- Haff, G.G. Sport Science. Strength Cond. J. 2010, 32, 33–45. [Google Scholar] [CrossRef]
- Wright, C.; Atkins, S.; Jones, B.; Todd, J. The role of performance analysts within the coaching process: Performance Analysts Survey ‘The role of performance analysts in elite football club settings’. Int. J. Perform. Anal. Sport 2013, 13, 240–261. [Google Scholar] [CrossRef]
- Bampouras, M.T.; Cronin, C.; Miller, K.P. Performance analytic processes in elite sport practice: An exploratory investigation of the perspectives of a sport scientist, coach and athlete. Int. J. Perform. Anal. Sport 2012, 12, 468–483. [Google Scholar] [CrossRef]
- Rojas-Valverde, D.; Gómez-Carmona, C.D.; Gutiérrez-Vargas, R.; Pino-Ortega, J. From big data mining to technical sport reports: The case of inertial measurement units. BMJ Open Sport Exerc. Med. 2019, 5, e000565. [Google Scholar] [CrossRef] [PubMed]
- Bonomi, A.G. Towards valid estimates of activity energy expenditure using an accelerometer: Searching for a proper analytical strategy and big data. J. Appl. Physiol. 2013, 115, 1227–1228. [Google Scholar] [CrossRef] [PubMed] [Green Version]
- Costa, F.F. Big data in biomedicine. Drug Discov. Today 2014, 19, 433–440. [Google Scholar] [CrossRef] [PubMed]
- Federolf, P.; Reid, R.; Gilgien, M.; Haugen, P.; Smith, G. The application of principal component analysis to quantify technique in sports: PCA quantification of technique. Scand. J. Med. Sci. Sports 2014, 24, 491–499. [Google Scholar] [CrossRef]
- Gløersen, Ø.; Myklebust, H.; Hallén, J.; Federolf, P. Technique analysis in elite athletes using principal component analysis. J. Sports Sci. 2018, 36, 229–237. [Google Scholar] [CrossRef]
- Parmar, N.; James, N.; Hearne, G.; Jones, B. Using principal component analysis to develop performance indicators in professional rugby league. Int. J. Perform. Anal. Sport 2018, 18, 938–949. [Google Scholar] [CrossRef]
- Oliva-Lozano, J.M.; Rojas-Valverde, D.; Gómez-Carmona, C.D.; Fortes, V.; Pino-Ortega, J. Impact of Contextual Variables on the Representative External Load Profile of Spanish Professional Soccer Match-Play: A Full Season Study. Eur. J. Sport Sci. 2020. [Google Scholar] [CrossRef]
- Rojas-Valverde, D.; Sánchez-Ureña, B.; Pino-Ortega, J.; Gómez-Carmona, C.; Gutiérrez-Vargas, R.; Timón, R.; Olcina, G. External Workload Indicators of Muscle and Kidney Mechanical Injury in Endurance Trail Running. Int. J. Environ. Res. Public Health 2019, 16, 3909. [Google Scholar] [CrossRef] [PubMed] [Green Version]
- Williams, B.; Onsman, A.; Brown, T. Exploratory factor analysis: A five-step guide for novices. Australas. J. Paramed. 2010, 8, 1–13. [Google Scholar] [CrossRef] [Green Version]
- O’Donoghue, P. Principal Components Analysis in the selection of Key Performance Indicators in Sport. Int. J. Perform. Anal. Sport 2008, 8, 145–155. [Google Scholar] [CrossRef]
- Weaving, D.; Marshall, P.; Earle, K.; Nevill, A.; Abt, G. Combining Internal- and External-Training-Load Measures in Professional Rugby League. Int. J. Sports Physiol. Perform. 2014, 9, 905–912. [Google Scholar] [CrossRef]
- Casamichana, D.; Castellano, J.; Gómez Díaz, A.; Martín-García, A. Looking for Complementary Intensity Variables in Different Training Games in Football. J. Strength Cond. Res. 2019. [Google Scholar] [CrossRef] [PubMed]
- Svilar, L.; Castellano, J.; Jukic, I.; Casamichana, D. Positional Differences in Elite Basketball: Selecting Appropriate Training-Load Measures. Int. J. Sports Physiol. Perform. 2018, 13, 947–952. [Google Scholar] [CrossRef]
- Tabachnick, B.; Fidell, L. Using Multivariate Statistics, 6th ed.; Pearson Education: Boston, MA, USA, 2007. [Google Scholar]
- Maskey, R.; Fei, J.; Nguyen, H.-O. Use of exploratory factor analysis in maritime research. Asian J. Shipp. Logist. 2018, 34, 91–111. [Google Scholar] [CrossRef]
- Henson, R.K.; Roberts, J.K. Use of Exploratory Factor Analysis in Published Research: Common Errors and Some Comment on Improved Practice. Educ. Psychol. Meas. 2006, 66, 393–416. [Google Scholar] [CrossRef] [Green Version]
- Moher, D.; Shamseer, L.; Clarke, M.; Ghersi, D.; Liberati, A.; Petticrew, M.; Shekelle, P.; Stewart, L.A. Preferred reporting items for systematic review and meta-analysis protocols (PRISMA-P) 2015 statement. Syst. Rev. 2015, 4, 1. [Google Scholar] [CrossRef] [Green Version]
- Sampaio, J.; Drinkwater, E.J.; Leite, N.M. Effects of season period, team quality, and playing time on basketball players’ game-related statistics. Eur. J. Sport Sci. 2010, 10, 141–149. [Google Scholar] [CrossRef]
- Andrade, M.D.S.; De Lira, C.A.B.; Koffes, F.D.C.; Mascarin, N.C.; Benedito-Silva, A.A.; Da Silva, A.C. Isokinetic hamstrings-to-quadriceps peak torque ratio: The influence of sport modality, gender, and angular velocity. J. Sports Sci. 2012, 30, 547–553. [Google Scholar] [CrossRef] [PubMed]
- Gómez, M.A.; Gómez-Lopez, M.; Lago, C.; Sampaio, J. Effects of game location and final outcome on game-related statistics in each zone of the pitch in professional football. Eur. J. Sport Sci. 2012, 12, 393–398. [Google Scholar] [CrossRef]
- Ricotti, L.; Rigosa, J.; Niosi, A.; Menciassi, A. Analysis of Balance, Rapidity, Force and Reaction Times of Soccer Players at Different Levels of Competition. PLoS ONE 2013, 8, e77264. [Google Scholar] [CrossRef] [PubMed] [Green Version]
- Liu, J. The correlation analysis and strategy between basketball scoring index and physical fitness based on principal component model. J. Chem. Pharm. Res. 2014, 6, 1–25. [Google Scholar]
- Yin, W. Based on the principal component factor analysis method of NBA players comprehensive ability evaluation research. Biotechnol. Indian J. 2014, 10, 4734–4742. [Google Scholar]
- Yin, W. Principal component factor analysis-based NBA player comprehensive ability evaluation research. J. Chem. Pharm. Res. 2014, 6, 2400–2405. [Google Scholar]
- Parrington, L.; Ball, K.; MacMahon, C. Biomechanical characteristics of handballing maximally in Australian football. Sports Biomech. 2014, 13, 307–319. [Google Scholar] [CrossRef]
- Laffaye, G.; Wagner, P.P.; Tombleson, T.I.L. Countermovement jump height: Gender and sport-specific differences in the force-time variables. J. Strength Cond. Res. 2014, 28, 1096–1105. [Google Scholar] [CrossRef]
- Ra, S.-G.; Maeda, S.; Higashino, R.; Imai, T.; Miyakawa, S. Metabolomics of salivary fatigue markers in soccer players after consecutive games. Appl. Physiol. Nutr. Metab. 2014, 39, 1120–1126. [Google Scholar] [CrossRef]
- Carpita, M.; Sandri, M.; Simonetto, A.; Zuccolotto, P. Discovering the Drivers of Football Match Outcomes with Data Mining. Qual. Technol. Quant. Manag. 2015, 12, 561–577. [Google Scholar] [CrossRef]
- Moura, F.A.; Santana, J.E.; Vieira, N.A.; Santiago, P.R.P.; Cunha, S.A. Analysis of Soccer Players’ Positional Variability During the 2012 UEFA European Championship: A Case Study. J. Hum. Kinet. 2015, 47, 225–236. [Google Scholar] [CrossRef] [PubMed] [Green Version]
- Zago, M.; Codari, M.; Grilli, M.; Bellistri, G.; Lovecchio, N.; Sforza, C. Determinants of the half-turn with the ball in sub-elite youth soccer players. Sports Biomech. 2016, 15, 234–244. [Google Scholar] [CrossRef]
- Leiva Deantonio, J.H.; Amú-Ruiz, F.A. Características morfofuncionales y motoras de los seleccionados deportivos de la Universidad del Valle. Revista Científica General José María Córdova 2016, 14, 169–193. [Google Scholar] [CrossRef] [Green Version]
- Torrents, C.; Ric, A.; Hristovski, R.; Torres-Ronda, L.; Vicente, E.; Sampaio, J. Emergence of Exploratory, Technical and Tactical Behavior in Small-Sided Soccer Games when Manipulating the Number of Teammates and Opponents. PLoS ONE 2016, 11, e0168866. [Google Scholar] [CrossRef] [PubMed] [Green Version]
- Ric, A.; Torrents, C.; Gonçalves, B.; Sampaio, J.; Hristovski, R. Soft-assembled Multilevel Dynamics of Tactical Behaviors in Soccer. Front. Psychol. 2016, 7, 1513. [Google Scholar] [CrossRef] [Green Version]
- Abdullah, M.R.; Maliki, A.B.H.M.; Musa, R.M.; Kosni, N.A.; Juahir, H. Intelligent Prediction of Soccer Technical Skill on Youth Soccer Player’s Relative Performance Using Multivariate Analysis and Artificial Neural Network Techniques. Int. J. Adv. Sci. Eng. Inf. Technol. 2016, 6, 668–674. [Google Scholar] [CrossRef] [Green Version]
- Abdullah, M.R.; Musa, R.M.; Azura, N. Similarities and Distinction Pattern Recognition of Physical Fitness Related Performance between Amateur Soccer and Field Hockey Players. Int. J. Life Sci. Pharma Res. 2016, 6, 12. [Google Scholar]
- Negra, Y.; Chaabene, H.; Hammami, M.; Amara, S.; Sammoud, S.; Mkaouer, B.; Hachana, Y. Agility in Young Athletes: Is It a Different Ability From Speed and Power? J. Strength Cond. Res. 2017, 31, 727–735. [Google Scholar] [CrossRef]
- Abdullah, M.R.; Maliki, A.B.H.M.; Musa, R.M.; Kosni, N.A.; Juahir, H.; Mohamed, S.B. Identification and Comparative Analysis of Essential Performance Indicators in Two Levels of Soccer Expertise. Int. J. Adv. Sci. Eng. Inf. Technol. 2017, 7, 305–314. [Google Scholar] [CrossRef] [Green Version]
- Los Arcos, A.; Mendiguchia, J.; Yanci, J. Specificity of jumping, acceleration and quick change of direction motor abilities in soccer players. Kinesiology 2017, 49, 22–29. [Google Scholar] [CrossRef] [Green Version]
- Alias, N.; Abdullah, M.R.; Musa, R.M.; Maliki, A.B.H.M.; Kosni, N.A.; Eswaramoorthi, V.; Mat-Rasid, S.M.; Adnan, A.; Juahir, H. A novel scientific approach in identifying talents among female adolescent athletes in field hockey sport based on physical fitness and anthro-energy intake. J. Fundam. Appl. Sci. 2017, 9, 616–636. [Google Scholar] [CrossRef] [Green Version]
- Williams, S.; Trewartha, G.; Cross, M.J.; Kemp, S.P.T.; Stokes, K.A. Monitoring What Matters: A Systematic Process for Selecting Training-Load Measures. Int. J. Sports Physiol. Perform. 2017, 12, S2-101–S2-106. [Google Scholar] [CrossRef] [PubMed] [Green Version]
- Weaving, D.; Jones, B.; Marshall, P.; Till, K.; Abt, G. Multiple Measures are Needed to Quantify Training Loads in Professional Rugby League. Int. J. Sports Med. 2017, 38, 735–740. [Google Scholar] [CrossRef] [PubMed] [Green Version]
- Maliki, A.B.H.M.; Abdullah, M.R.; Juahir, H.; Musa, R.M.; Mat-Rasid, S.M.; Adnan, A.; Kosni, N.A.; Eswaramoorthi, V.; Alias, N. Sensitivity pattern recognition and variableness of competitive adolescent soccer relative performance indicators. J. Fundam. Appl. Sci. 2017, 9, 539–562. [Google Scholar] [CrossRef] [Green Version]
- Razali, M.R.; Alias, N.; Maliki, A.B.; Musa, R.M.; Kosni, L.A.; Juahir, H. Unsupervised Pattern Recognition of Physical Fitness Related Performance Parameters among Terengganu Youth Female Field Hockey Players. Int. J. Adv. Sci. Eng. Inf. Technol. 2017, 7, 100–105. [Google Scholar] [CrossRef] [Green Version]
- Henderson, M.J.; Fransen, J.; McGrath, J.J.; Harries, S.K.; Poulos, N.; Coutts, A.J. Individual Factors Affecting Rugby Sevens Match Performance. Int. J. Sports Physiol. Perform. 2019, 14, 620–626. [Google Scholar] [CrossRef]
- Svilar, L.; Castellano, J.; Jukic, I. Load monitoring system in top-level basketball team: Relationship between external and internal training load. Kinesiology 2018, 50, 25–33. [Google Scholar] [CrossRef]
- Teramoto, M.; Cross, C.L.; Rieger, R.H.; Maak, T.G.; Willick, S.E. Predictive Validity of National Basketball Association Draft Combine on Future Performance. J. Strength Cond. Res. 2018, 32, 396–408. [Google Scholar] [CrossRef]
- Robbins, S.M.; Renaud, P.J.; Pearsall, D.J. Principal component analysis identifies differences in ice hockey skating stride between high- and low-calibre players. Sports Biomech. 2018, 1–19. [Google Scholar] [CrossRef]
- Floría, P.; Sánchez-Sixto, A.; Harrison, A.J. Application of the principal component waveform analysis to identify improvements in vertical jump performance. J. Sports Sci. 2019, 37, 370–377. [Google Scholar] [CrossRef]
- Maliki, A.B.H.M.; Abdullah, M.R.; Juahir, H.; Muhamad, W.S.A.W.; Nasir, N.A.M.; Musa, R.M.; Mat-Rasid, S.M.; Adnan, A.; Kosni, N.A.; Abdullah, F.; et al. The role of anthropometric, growth and maturity index (AGaMI) influencing youth soccer relative performance. In IOP Conference Series: Materials Science and Engineering; IOP Publishing: Bristol, UK, 2018; Volume 342, p. 012056. [Google Scholar] [CrossRef]
- Weaving, D.; Dalton, N.E.; Black, C.; Darrall-Jones, J.; Phibbs, P.J.; Gray, M.; Jones, B.; Roe, G.A.B. The Same Story or a Unique Novel? Within-Participant Principal-Component Analysis of Measures of Training Load in Professional Rugby Union Skills Training. Int. J. Sports Physiol. Perform. 2018, 13, 1175–1181. [Google Scholar] [CrossRef] [Green Version]
- Figueiredo, D.H.; Figueiredo, D.H.; Gonçalves, H.R.; Stanganelli, L.C.R.; Dourado, A.C. Análise de componentes principais na identificação de características primordiais em esportes coletivos. Revista Brasileira Ciência Movimento 2019, 27, 41–51. [Google Scholar] [CrossRef] [Green Version]
- Welch, N.; Richter, C.; Moran, K.; Franklyn-Miller, A. Principal Component Analysis of the Associations Between Kinetic Variables in Cutting and Jumping, and Cutting Performance Outcome. J. Strength Cond. Res. 2019. [Google Scholar] [CrossRef] [PubMed]
- Welch, N.; Richter, C.; Franklyn-Miller, A.; Moran, K. Principal Component Analysis of the Biomechanical Factors Associated with Performance during Cutting. J. Strength Cond. Res. 2019. [Google Scholar] [CrossRef] [PubMed]
- Verheul, J.; Warmenhoven, J.; Lisboa, P.; Gregson, W.; Vanrenterghem, J.; Robinson, M.A. Identifying generalised segmental acceleration patterns that contribute to ground reaction force features across different running tasks. J. Sci. Med. Sport 2019, 22, 1355–1360. [Google Scholar] [CrossRef] [PubMed]
- Gonçalves, B.; Coutinho, D.; Exel, J.; Travassos, B.; Lago, C.; Sampaio, J. Extracting spatial-temporal features that describe a team match demands when considering the effects of the quality of opposition in elite football. PLoS ONE 2019, 14, e0221368. [Google Scholar] [CrossRef] [PubMed]
- Gamble, D.; Bradley, J.; McCarren, A.; Moyna, N.M. Team performance indicators which differentiate between winning and losing in elite Gaelic football. Int. J. Perform. Anal. Sport 2019, 19, 478–490. [Google Scholar] [CrossRef]
- Pino-Ortega, J.; Gómez-Carmona, C.D.; Nakamura, F.; Rojas-Valverde, D. Setting kinematic parameters that explain youth basketball behavior: Influence of relative age effect according to playing position. J. Strength Cond. Res. 2020, in press. [Google Scholar] [CrossRef]
- Rojas-Valverde, D.; Gómez-Carmona, C.D.; Oliva-Lozano, J.M.; Ibáñez, S.J.; Pino-Ortega, J. Quarter’s external workload demands of basketball referees during a European youth congested-fixture tournament. Int. J. Perform. Anal. Sport 2020, 20, 432–444. [Google Scholar] [CrossRef]
- Hair, J.F.; Anderson, R.E.; Tatham, R.L.; Black, W.C. Multivariate Data Analysis: With Readings, 4th ed.; Prentice-Hall, Inc.: Upper Saddle River, NJ, USA, 1995; ISBN 978-0-02-349020-0. [Google Scholar]
- Kaiser, H.F. The Application of Electronic Computers to Factor Analysis. Educ. Psychol. Meas. 1960, 20, 141–151. [Google Scholar] [CrossRef]
- Bartlett, M.S. A Note on the Multiplying Factors for Various χ2 Approximations. J. R. Stat. Soc. Ser. B Methodol. 1954, 16, 296–298. [Google Scholar] [CrossRef]
- Dominick, D.; Juahir, H.; Latif, M.T.; Zain, S.M.; Aris, A.Z. Spatial assessment of air quality patterns in Malaysia using multivariate analysis. Atmos. Environ. 2012, 60, 172–181. [Google Scholar] [CrossRef]
- Thompson, B. (Ed.) Exploratory and Confirmatory Factor Analysis: Understanding Concepts and Applications, 1st ed.; American Psychological Association: Washington, DC, USA, 2004; ISBN 978-1-59147-093-9. [Google Scholar]
- Finch, H. Comparison of the Performance of Varimax and Promax Rotations: Factor Structure Recovery for Dichotomous Items. J. Educ. Meas. 2006, 43, 39–52. [Google Scholar] [CrossRef]
- Norris, M.; Lecavalier, L. Evaluating the Use of Exploratory Factor Analysis in Developmental Disability Psychological Research. J. Autism. Dev. Disord. 2010, 40, 8–20. [Google Scholar] [CrossRef]
- Kim, D.J.-O.; Mueller, C.W. Introduction to Factor Analysis: What It Is and How to Do It, 1st ed.; SAGE Publications, Inc.: Beverly Hills, CA, USA, 1978; ISBN 978-0-8039-1165-9. [Google Scholar]
- Liu, C.-W.; Lin, K.-H.; Kuo, Y.-M. Application of factor analysis in the assessment of groundwater quality in a blackfoot disease area in Taiwan. Sci. Total Environ. 2003, 313, 77–89. [Google Scholar] [CrossRef]


| Code | Reference | Sport | Factorability | Data Suitability Testing | Extraction Method | Retention Criteria | Rotation Method | |||
|---|---|---|---|---|---|---|---|---|---|---|
| Retention Loading Criteria | Sample Adequacy Criteria | Sphericity Criteria | Factor | Loading | Cross-Loading | |||||
| 1 | Sampaio et al. [21] | Basketball | r > 0.5 | KMO = 0.78 | NR | PCA | >1 | >0.4 | NR | NR |
| 2 | Andrade et al. [22] | Basketball | NR | NR | Bartlett’s | PCA | >1 | NR | NR | VariMax |
| 3 | Gómez et al. [23] | Soccer | r > 0.5 | KMO = 0.65 | NR | PCA | >1.5 | >0.6 | NR | VariMax |
| 4 | Ricotti et al. [24] | Soccer | NR | NR | NR | PCA | NR | NR | NR | NR |
| 5 | Liu [25] | Basketball | NR | NR | NR | PCA | NR | NR | NR | NR |
| 6 | Yin [26] | Basketball | NR | KMO = 0.8 | Bartlett’s | PCA | NR | NR | NR | NR |
| 7 | Yin [27] | Basketball | NR | KMO = 0.8 | Bartlett’s | PCA | NR | NR | NR | NR |
| 8 | Parrington et al. [28] | Australian Football | r > 0.4 | KMO > 0.05 | Bartlett’s | PCA | >1 | >0.6–0.7 | NR | NR |
| 9 | Laffaye & Tombleson [29] | Team sports | NR | NR | NR | PCA | >1 | NR | NR | VariMax |
| 10 | Ra et al. [30] | Soccer | NR | NR | NR | PCA | NR | NR | NR | NR |
| 11 | Weaving et al. [14] | Rugby | NR | KMO = 0.5–0.75 | Bartlett’s | PCA | >1 | NR | NR | NR |
| 12 | Carpita et al. [31] | Soccer | NR | NR | NR | PCA | NR | NR | NR | NR |
| 13 | Arruda et al. [32] | Soccer | NR | NR | NR | PCA | NR | NR | NR | NR |
| 14 | Zago et al. [33] | Soccer | NR | NR | NR | PCA | >1 | NR | NR | NR |
| 15 | Leiva & Amú-Ruiz [34] | Team Sports | NR | NR | NR | PCA | NR | NR | NR | NR |
| 16 | Torrents et al. [35] | Soccer | NR | NR | NR | PCA | >1 | NR | NR | Direct Oblimin |
| 17 | Ric et al. [36] | Soccer | NR | NR | NR | PCA | >1 | NR | NR | NR |
| 18 | Abdullah et al. [37] | Soccer | NR | KMO = 0.77 | Bartlett’s | PCA | >1 | >0.7 | NR | VariMax |
| 19 | Abdullah et al. [38] | Soccer Hockey | r > 0.5 | KMO = 0.65–0.69 | Bartlett’s | PCA | >1 | >0.6 | NR | VariMax |
| 20 | Negra et al. [39] | Soccer and Handball | NR | KMO = NR | NR | PCA | >1 | NR | NR | NR |
| 21 | Abdullah et al. [40] | Soccer | r > 0.5 | KMO = 0.7–0.73 | Bartlett’s | PCA | >1 | >0.6 | NR | VariMax |
| 22 | Los Arcos et al. [41] | Soccer | >0.55 | NR | NR | PCA | >1 | NR | NR | Nonorthogonal |
| 23 | Alias et al. [42] | Field hockey | NR | KMO = 055–0.58 | Bartlett’s | PCA | >1 | >0.7 | NR | VariMax |
| 24 | Williams et al. [43] | Rugby | NR | KMO > 0.05 | Bartlett’s | PCA | >1 | >0.7 | NR | VariMax |
| 25 | Weaving et al. [44] | Rugby | NR | KMO = 0.59 | Bartlett’s | PCA | >1 | >0.7 | NR | VariMax |
| 26 | Maliki et al. [45] | Soccer | NR | KMO = 0.77 | Bartlett’s | PCA | >1 | NR | NR | VariMax |
| 27 | Razali et al. [46] | Hockey | NR | KMO = 0.54 | Bartlett’s | PCA | NR | >0.7 | NR | VariMax |
| 28 | Parmar et al. [9] | Rugby | NR | NR | NR | PCA | >1 | NR | NR | VariMax |
| 29 | Henderson et al. [47] | Rugby | NR | NR | NR | PCA | NR | >0.4 | NR | NR |
| 30 | Svilar, Castellano, Jukic, et al. [48] | Basketball | NR | KMO = 0.84–0.85 | Bartlett’s | PCA | >1 | >0.7 | NR | VariMax |
| 31 | Teramoto et al. [49] | Basketball | NR | KMO = 0.78 | Bartlett’s | PCA | >1 | >0.6 | NR | Direct Oblimin |
| 32 | Robbins et al. [50] | Ice hockey | NR | NR | NR | PCA | NR | NR | NR | NR |
| 33 | Floría et al. [51] | Basketball | NR | NR | NR | PCA | NR | NR | NR | NR |
| 34 | Maliki et al. [52] | Soccer | NR | KMO = NR | Bartlett’s | PCA | >1 | >0.65 | NR | VariMax |
| 35 | Weaving et al. [53] | Rugby | NR | NR | NR | PCA | >1 | >0.7 | NR | VariMax |
| 36 | Hilgemberg et al. [54] | Futsal, Handball, Basketball and Volleyball | NR | KMO = NR | Bartlett´s | PCA | NR | NR | NR | VariMax |
| 37 | Welch et al. [55] | Gaelic football | >0.4 | NR | NR | PCA | NR | NR | NR | NR |
| 38 | Welch et al. [56] | Gaelic football | NR | NR | NR | PCA | NR | NR | NR | NR |
| 39 | Verheul et al. [57] | Team Sports | NR | NR | NR | PCA | NR | NR | NR | NR |
| 40 | Goncalves et al. [58] | Soccer | NR | KMO > 0.5 | Bartlett’s | PCA | >1 | >0.6 | NR | VariMax |
| 41 | Casamichana et al. [15] | Soccer | NR | KMO = NR | Bartlett’s | PCA | >1 | >0.7 | NR | VariMax |
| 42 | Gamble et al. [59] | Gaelic football | NR | KMO = 0.73 | NR | PCA | >1 | NR | NR | VariMax |
| 43 | Pino-Ortega et al. [60] | Basketball | r > 0.7 | KMO = 0.77 | Bartlett’s | PCA | >1 | >0.6 | Highest Loading | VariMax |
| 44 | Oliva-Lozano et al. [10] | Soccer | r > 0.7 | KMO = 0.78 | Bartlett’s | PCA | >1 | >0.6 | Highest Loading | VariMax |
| 45 | Rojas-Valverde et al. [61] | Basketball | r > 0.7 | KMO > 0.5 | Bartlett’s | PCA | >1 | >0.6 | Highest Loading | VariMax |
| Item | Reported | Non-Reported | Recommended Criteria |
|---|---|---|---|
| Statistical Analysis Section | |||
| Was the initial number of variables reported? | Yes = 1 | No = 0 | - |
| Was the variable selection criterion reported based on sports characteristics? | Yes = 1 | No = 0 | - |
| Was a correlation matrix exploration (factorability) between variables performed? | Yes = 1 | No = 0 | - |
| Was a correlation retention loading criterion (factorability) reported? | Yes = 1 | No = 0 | Factorability > 5 |
| Was the number of variables reported after correlation matrix exploration (factorability)? | Yes = 1 | No = 0 | - |
| Were the variables scaled and centered (if necessary)? | Yes = 1 | No = 0 | - |
| Was the data suitability (sample adequacy criteria) test performed? | Yes = 1 | No = 0 | KMO test |
| Was the data suitability (sample adequacy criteria) testing result reported? | Yes = 1 | No = 0 | KMO > 5 |
| Was the data suitability (sphericity criteria) test performed? | Yes = 1 | No = 0 | Bartlett´s Test |
| Was the data suitability (sphericity criteria) testing result reported? | Yes = 1 | No = 0 | p < 0.05 |
| Was the extraction method reported? | Yes = 1 | No = 0 | PCA |
| Were the retention criteria (factors) reported? | Yes = 1 | No = 0 | Eigenvalues > 1 |
| Were the retention criteria (loadings) reported? | Yes = 1 | No = 0 | Loadings > 0.6—0.7 |
| Was the cross-loading retention criterion reported? | Yes = 1 | No = 0 | Highest loading |
| Was the rotation method reported? | Yes = 1 | No = 0 | VariMax (may vary) |
| Was the post PCA following analysis reported? | Yes = 1 | No = 0 | - |
| Results section | |||
| Was the number of factors extracted reported? | Yes = 1 | No = 0 | - |
| Was the final number of variables reported? | Yes = 1 | No = 0 | - |
| Were partial and total variance reported? | Yes = 1 | No = 0 | - |
| Was the percentage of total variance reported? | Yes = 1 | No = 0 | - |
| Were the eigenvalues reported? | Yes = 1 | No = 0 | - |
| Were the final variables selection reported? | Yes = 1 | No = 0 | - |
| Total punctuation | 21 | 0 | |
Publisher’s Note: MDPI stays neutral with regard to jurisdictional claims in published maps and institutional affiliations. |
© 2020 by the authors. Licensee MDPI, Basel, Switzerland. This article is an open access article distributed under the terms and conditions of the Creative Commons Attribution (CC BY) license (http://creativecommons.org/licenses/by/4.0/).
Share and Cite
Rojas-Valverde, D.; Pino-Ortega, J.; Gómez-Carmona, C.D.; Rico-González, M. A Systematic Review of Methods and Criteria Standard Proposal for the Use of Principal Component Analysis in Team’s Sports Science. Int. J. Environ. Res. Public Health 2020, 17, 8712. https://0-doi-org.brum.beds.ac.uk/10.3390/ijerph17238712
Rojas-Valverde D, Pino-Ortega J, Gómez-Carmona CD, Rico-González M. A Systematic Review of Methods and Criteria Standard Proposal for the Use of Principal Component Analysis in Team’s Sports Science. International Journal of Environmental Research and Public Health. 2020; 17(23):8712. https://0-doi-org.brum.beds.ac.uk/10.3390/ijerph17238712
Chicago/Turabian StyleRojas-Valverde, Daniel, José Pino-Ortega, Carlos D. Gómez-Carmona, and Markel Rico-González. 2020. "A Systematic Review of Methods and Criteria Standard Proposal for the Use of Principal Component Analysis in Team’s Sports Science" International Journal of Environmental Research and Public Health 17, no. 23: 8712. https://0-doi-org.brum.beds.ac.uk/10.3390/ijerph17238712