Cardiometabolic Risk Factor in Obese and Normal Weight Individuals in Community Dwelling Men

Abstract
:1. Introduction
2. Materials and Methods
2.1. Participants
2.2. Measurement
2.3. Criteria of Obesity and Cardiovascular Disease Risk Factors
- (1)
- High blood pressure: a systolic blood pressure of at least 130 mm Hg and/or a diastolic blood pressure of at least 85 mm Hg and/or treatment for previously diagnosed hypertension.
- (2)
- Hyperglycemia: an FPG of at least 100 mg/dL (≥5.6 mmol/L) and/or treatment for previously diagnosed type 2 diabetes mellitus.
- (3)
- Dyslipidemia: a TG of at least 150 mg/dL (≥1.7 mmol/L) and/or an HDL-C less than 40 mg/dL (b1.03 mmol/L) and/or an LDL-C of at least 160 mg/dL (≥4.1 mmol/L) and/or treatment for previously diagnosed dyslipidemia.
2.4. Statistical Analysis
3. Results
4. Discussion
5. Conclusions
Author Contributions
Funding
Conflicts of Interest
References
- World Health Organization. Obesity: Preventing and managing the global epidemic. In Report of a WHO Consultation on Obesity; World Health Organization: Geneva, Switzerland, 1998. [Google Scholar]
- National Institutes of Health. Clinical guidelines on the identification, evaluation and treatment of overweight and obesity in adults—The evidence report. Obes Res. 1998, 6, 51S–209S. [Google Scholar]
- Colditz, G.A.; Willett, W.C.; Rotnitzky, A.; Manson, J.E. Weight Gain as a Risk Factor for Clinical Diabetes Mellitus in Women. Ann. Intern. Med. 1995, 122, 481–486. [Google Scholar] [CrossRef] [PubMed]
- Calle, E.E.; Thun, M.J.; Petrelli, J.M.; Rodriguez, C.; Heath, C.W. Body-Mass Index and Mortality in a Prospective Cohort of U.S. Adults. N. Engl. J. Med. 1999, 341, 1097–1105. [Google Scholar] [CrossRef] [PubMed]
- Chang, Y.; Ryu, S.; Suh, B.-S.; Yun, K.E.; Kim, C.-W.; Cho, S.-I. Impact of BMI on the incidence of metabolic abnormalities in metabolically healthy men. Int. J. Obes. 2011, 36, 1187–1194. [Google Scholar] [CrossRef] [Green Version]
- Lavie, C.J.; Milani, R.V.; Ventura, H.O. The “obesity paradox” in coronary heart disease. Am. J. Cardiol. 2010, 106, 11. [Google Scholar] [CrossRef]
- WHO Expert Consultation. Appropriate body-mass index for Asian populations and its implications for policy and intervention strategies. Lancet 2004, 363, 157–163. [Google Scholar] [CrossRef]
- Lavie, C.J.; De Schutter, A.; Patel, D.; Artham, S.M.; Milani, R.V. Body composition and coronary heart disease mortality—An obesity or a lean paradox? Mayo Clin. Proc. 2011, 86, 857–864. [Google Scholar] [CrossRef] [Green Version]
- Folsom, A.R.; Kushi, L.H.; Anderson, K.E.; Mink, P.J.; Olson, J.E.; Hong, C.-P.; Sellers, T.A.; Lazovich, D.; Prineas, R.J. Associations of general and abdominal obesity with multiple health outcomes in older women. Arch. Intern. Med. 2000, 160, 2117–2128. [Google Scholar] [CrossRef]
- Lean, M.J.; Han, T.S. Waist worries. Am. J. Clin. Nutr. 2002, 76, 699–700. [Google Scholar] [CrossRef] [Green Version]
- Pouliot, M.-C.; Després, J.-P.; Lemieux, S.; Moorjani, S.; Bouchard, C.; Tremblay, A.; Nadeau, A.; Lupien, P.J. Waist circumference and abdominal sagittal diameter: Best simple anthropometric indexes of abdominal visceral adipose tissue accumulation and related cardiovascular risk in men and women. Am. J. Cardiol. 1994, 73, 460–468. [Google Scholar] [CrossRef]
- Kissebah, A.H.; Vydelingum, N.; Murray, R.; Evans, D.J.; Kalkhoff, R.K.; Adams, P.W. Relation of body fat distribution to metabolic complications of obesity. J. Clin. Endocrinol. Metab. 1982, 54, 254–260. [Google Scholar] [CrossRef] [PubMed]
- Kim, J.Y.; Han, S.-H.; Yang, B.-M. Implication of high-body-fat percentage on cardiometabolic risk in middle-aged, healthy, normal-weight adults. Obesity 2013, 21, 1571–1577. [Google Scholar] [CrossRef] [PubMed]
- Cho, Y.G.; Song, H.J.; Kim, J.M.; Park, K.H.; Paek, Y.J.; Cho, J.J.; Caterson, I.; Kang, J.G. The estimation of cardiovascular risk factors by body mass index and body fat percentage in Korean male adults. Metabolism 2009, 58, 765–771. [Google Scholar] [CrossRef] [PubMed]
- WHO/IASO/IOTF. The Asia-Pacific Perspective: Redefining Obesity and Its Treatment; Health Communications Australia Pty Ltd.: Sydney, Australia, 2000. [Google Scholar]
- Dudeja, V.; Misra, A.; Pandey, R.; Devina, G.; Kumar, G.; Vikram, N. BMI does not accurately predict overweight in Asian Indians in northern India. Br. J. Nutr. 2001, 86, 105–112. [Google Scholar] [CrossRef] [Green Version]
- National Cholesterol Education Program (NCEP) Expert Panel on Detection, Evaluation and Treatment of High Blood Cholesterol in Adults (Adult Treatment Panel III). Third Report of the National Cholesterol Education Program (NCEP) Expert Panel on Detection, Evaluation, and Treatment of High Blood Cholesterol in Adults (Adult Treatment Panel III) Final Report. Circulation 2002, 106, 3143. [Google Scholar] [CrossRef]
- Friedewald, W.T.; Levy, R.I.; Fredrickson, D.S. Estimation of the concentration of low-density lipoprotein cholesterol in plasma, without use of the preparative ultracentrifuge. Clin. Chem. 1972, 18, 499–502. [Google Scholar] [CrossRef]
- Conus, F.; Allison, D.B.; Rabasa-Lhoret, R.; St-Onge, M.; St-Pierre, D.H.; Tremblay-Lebeau, A.; Poehlman, E.T. Metabolic and behavioral characteristics of metabolically obese but normal-weight women. J. Clin. Endocrinol. Metab. 2004, 89, 5013–5020. [Google Scholar] [CrossRef] [Green Version]
- Darren, R.B.; Kasia, T.; Karen, M.E.; Leah, E.C.; Ahmed, E.S. Comparison of body mass index and waist circumference as predictors of cardiometabolic health in a population of young Canadian adults. Diabetol. Metab. Syndr. 2010, 2, 28. [Google Scholar] [CrossRef] [Green Version]
- Coutinho, T.; Goel, K.; De Sá, D.C.; Carter, R.E.; Hodge, D.O.; Kragelund, C.; Kanaya, A.M.; Zeller, M.; Park, J.S.; Kober, L.; et al. Combining body mass index with measures of central obesity in the assessment of mortality in subjects with coronary disease. J. Am. Coll. Cardiol. 2013, 61, 553–560. [Google Scholar] [CrossRef] [Green Version]
- Rubenoff, R. Sarcopenic obesity: The confluence of two epidemics. Obes Res. 2004, 12, 887–888. [Google Scholar] [CrossRef]
- Meigs, J.B.; Wilson, P.W.F.; Fox, C.S.; Vasan, R.S.; Nathan, D.M.; Sullivan, L.M.; D’Agostino, R.B. Body mass index, metabolic syndrome, and risk of type 2 diabetes or cardiovascular disease. J. Clin. Endocrinol. Metab. 2006, 91, 2906–2912. [Google Scholar] [CrossRef]
- Shin, S.; Kim, J.-M.; Sung, S.; Kim, H.-S. Prevalence and Associated Characteristics of Metabolically Healthy Obese Phenotypes in a Community Dwelling Population. J. Obes. Metab. Syndr. 2017, 26, 130–137. [Google Scholar] [CrossRef] [PubMed] [Green Version]
- Lemieux, I.; Alméras, N.; Mauriège, P.; Blanchet, C.; Dewailly, E.; Bergeron, J.; Després, J.-P. Prevalence of ‘hypertriglyceridemic waist’ in men who participated in the Quebec Health Survey: Association with atherogenic and diabetogenic metabolic risk factors. Can. J. Cardiol. 2002, 18, 725–732. [Google Scholar] [PubMed]
- Katzmarzyk, P.T.; Janssen, I.; Ross, R.; Church, T.S.; Blair, S.N. The importance of waist circumference in the definition of metabolic syndrome: Prospective analyses of mortality in men. Diabetes Care 2006, 29, 404–409. [Google Scholar] [CrossRef] [Green Version]
- Hanley, A.J.; Karter, A.J.; Williams, K.; Festa, A.; D’Agostino, R.B.; Wagenknecht, L.E.; Haffner, S.M. Prediction of type 2 diabetes mellitus with alternative definitions of the metabolic syndrome. Circulation 2005, 112, 3713–3721. [Google Scholar] [CrossRef] [PubMed]
- Han, T.S.; The EMAS Study Group; Correa, E.; Lean, M.E.J.; Lee, D.M.; O’Neill, T.W.; Bartfai, G.; Forti, G.; Giwercman, A.; Kula, K.; et al. Changes in prevalence of obesity and high waist circumference over four years across European regions: The European male ageing study (EMAS). Endocrine 2017, 55, 456–469. [Google Scholar] [CrossRef] [PubMed] [Green Version]
- Kim, J. Prevalence and Related Factors of Metabolically Obese, Normal-Weight Adolescents. Korean J. Health Educ. Promot. 2011, 28, 93–101. [Google Scholar]


| Parameters | Group | n | Mean | SD | One-Way ANOVA | ||
|---|---|---|---|---|---|---|---|
| F-Value | Tukey’ HSD | ||||||
| Age (yr) | 1 | 519 | 45.2 | 14.6 | 2.0 | ||
| 2 | 28 | 50.6 | 12.1 | ||||
| 3 | 125 | 45.5 | 13.7 | ||||
| 4 | 195 | 43.8 | 13.5 | ||||
| Height (cm) | 1 | 519 | 170.8 | 6.4 | 11.3 | * | 1, 3 < 2, 4 |
| 2 | 28 | 174.3 | 5.9 | ||||
| 3 | 125 | 169.8 | 6.6 | ||||
| 4 | 195 | 173.1 | 5.8 | ||||
| Weight (kg) | 1 | 519 | 65.1 | 6.8 | 324.6 | * | 1 <2, 3 < 4 |
| 2 | 28 | 73.3 | 4.7 | ||||
| 3 | 125 | 75.4 | 6.0 | ||||
| 4 | 195 | 84.0 | 9.7 | ||||
| BMI | 1 | 519 | 22.3 | 1.7 | 513.9 | * | 1 < 2 < 3 < 4 |
| 2 | 28 | 24.1 | 0.7 | ||||
| 3 | 125 | 26.1 | 1.0 | ||||
| 4 | 195 | 28.0 | 2.5 | ||||
| WC (cm) | 1 | 519 | 81.2 | 5.4 | 473.5 | * | 1 < 3 < 2 < 4 |
| 2 | 28 | 92.6 | 1.6 | ||||
| 3 | 125 | 87.2 | 2.4 | ||||
| 4 | 195 | 96.9 | 5.6 | ||||
| SLM (kg) | 1 | 519 | 48.3 | 5.6 | 99.6 | * | 1 < 2, 3 < 4 |
| 2 | 28 | 51.6 | 3.9 | ||||
| 3 | 125 | 52.6 | 5.5 | ||||
| 4 | 195 | 56.2 | 6.0 | ||||
| BFM (kg) | 1 | 519 | 12.8 | 3.3 | 417.5 | * | 1 < 2, 3 < 4 |
| 2 | 28 | 17.6 | 1.2 | ||||
| 3 | 125 | 18.6 | 2.6 | ||||
| 4 | 195 | 22.9 | 4.7 | ||||
| PBF (%) | 1 | 519 | 19.5 | 4.1 | 220.2 | * | 1 < 2, 3 < 4 |
| 2 | 28 | 24.0 | 1.5 | ||||
| 3 | 125 | 24.6 | 3.3 | ||||
| 4 | 195 | 27.1 | 3.3 | ||||
| Parameters | Group | Descriptive Statistics | One-Way ANOVA | Post Hoc. | ||
|---|---|---|---|---|---|---|
| Mean | SD | F-Value | Tukey’HSD | |||
| TG (mg/dL) | 1 | 128.0 | 81.7 | 24.84 | * | 1 < 2, 3, 4 |
| 2 | 253.0 | 299.9 | 3 < 2 | |||
| 3 | 177.6 | 144.0 | ||||
| 4 | 208.2 | 177.3 | ||||
| HDLC (mg/dL) | 1 | 51.0 | 12.1 | 17.88 | * | 3, 4 < 1 |
| 2 | 46.4 | 11.4 | ||||
| 3 | 45.9 | 9.0 | ||||
| 4 | 45.0 | 9.4 | ||||
| LDLC (mg/dL) | 1 | 121.8 | 30.8 | 10.48 | * | 1 < 4 |
| 2 | 134.4 | 35.2 | ||||
| 3 | 128.5 | 31.7 | ||||
| 4 | 136.0 | 32.2 | ||||
| TC (mg/dL) | 1 | 189.5 | 36.1 | 8.12 | * | 1 < 4 |
| 2 | 203.9 | 39.0 | ||||
| 3 | 196.5 | 37.3 | ||||
| 4 | 204.0 | 39.6 | ||||
| SBP (mmHg) | 1 | 124.3 | 10.9 | 17.94 | * | 1 < 3, 4 |
| 2 | 127.1 | 9.1 | ||||
| 3 | 128.0 | 9.5 | ||||
| 4 | 130.9 | 12.0 | ||||
| DBP (mmHg) | 1 | 76.5 | 8.6 | 10.67 | * | 1 < 3, 4 |
| 2 | 78.0 | 8.0 | ||||
| 3 | 79.0 | 7.7 | ||||
| 4 | 80.5 | 9.9 | ||||
| FBS (mg/dL) | 1 | 94.3 | 16.2 | 8.17 | * | 1, 3 < 2, 4 |
| 2 | 112.3 | 55.8 | ||||
| 3 | 95.2 | 11.5 | ||||
| 4 | 100.8 | 34.4 | ||||
| Parameters | Group | Frequency | Odds Ratio | 95% CI | ||
|---|---|---|---|---|---|---|
| n | (%) | Lower | Upper | |||
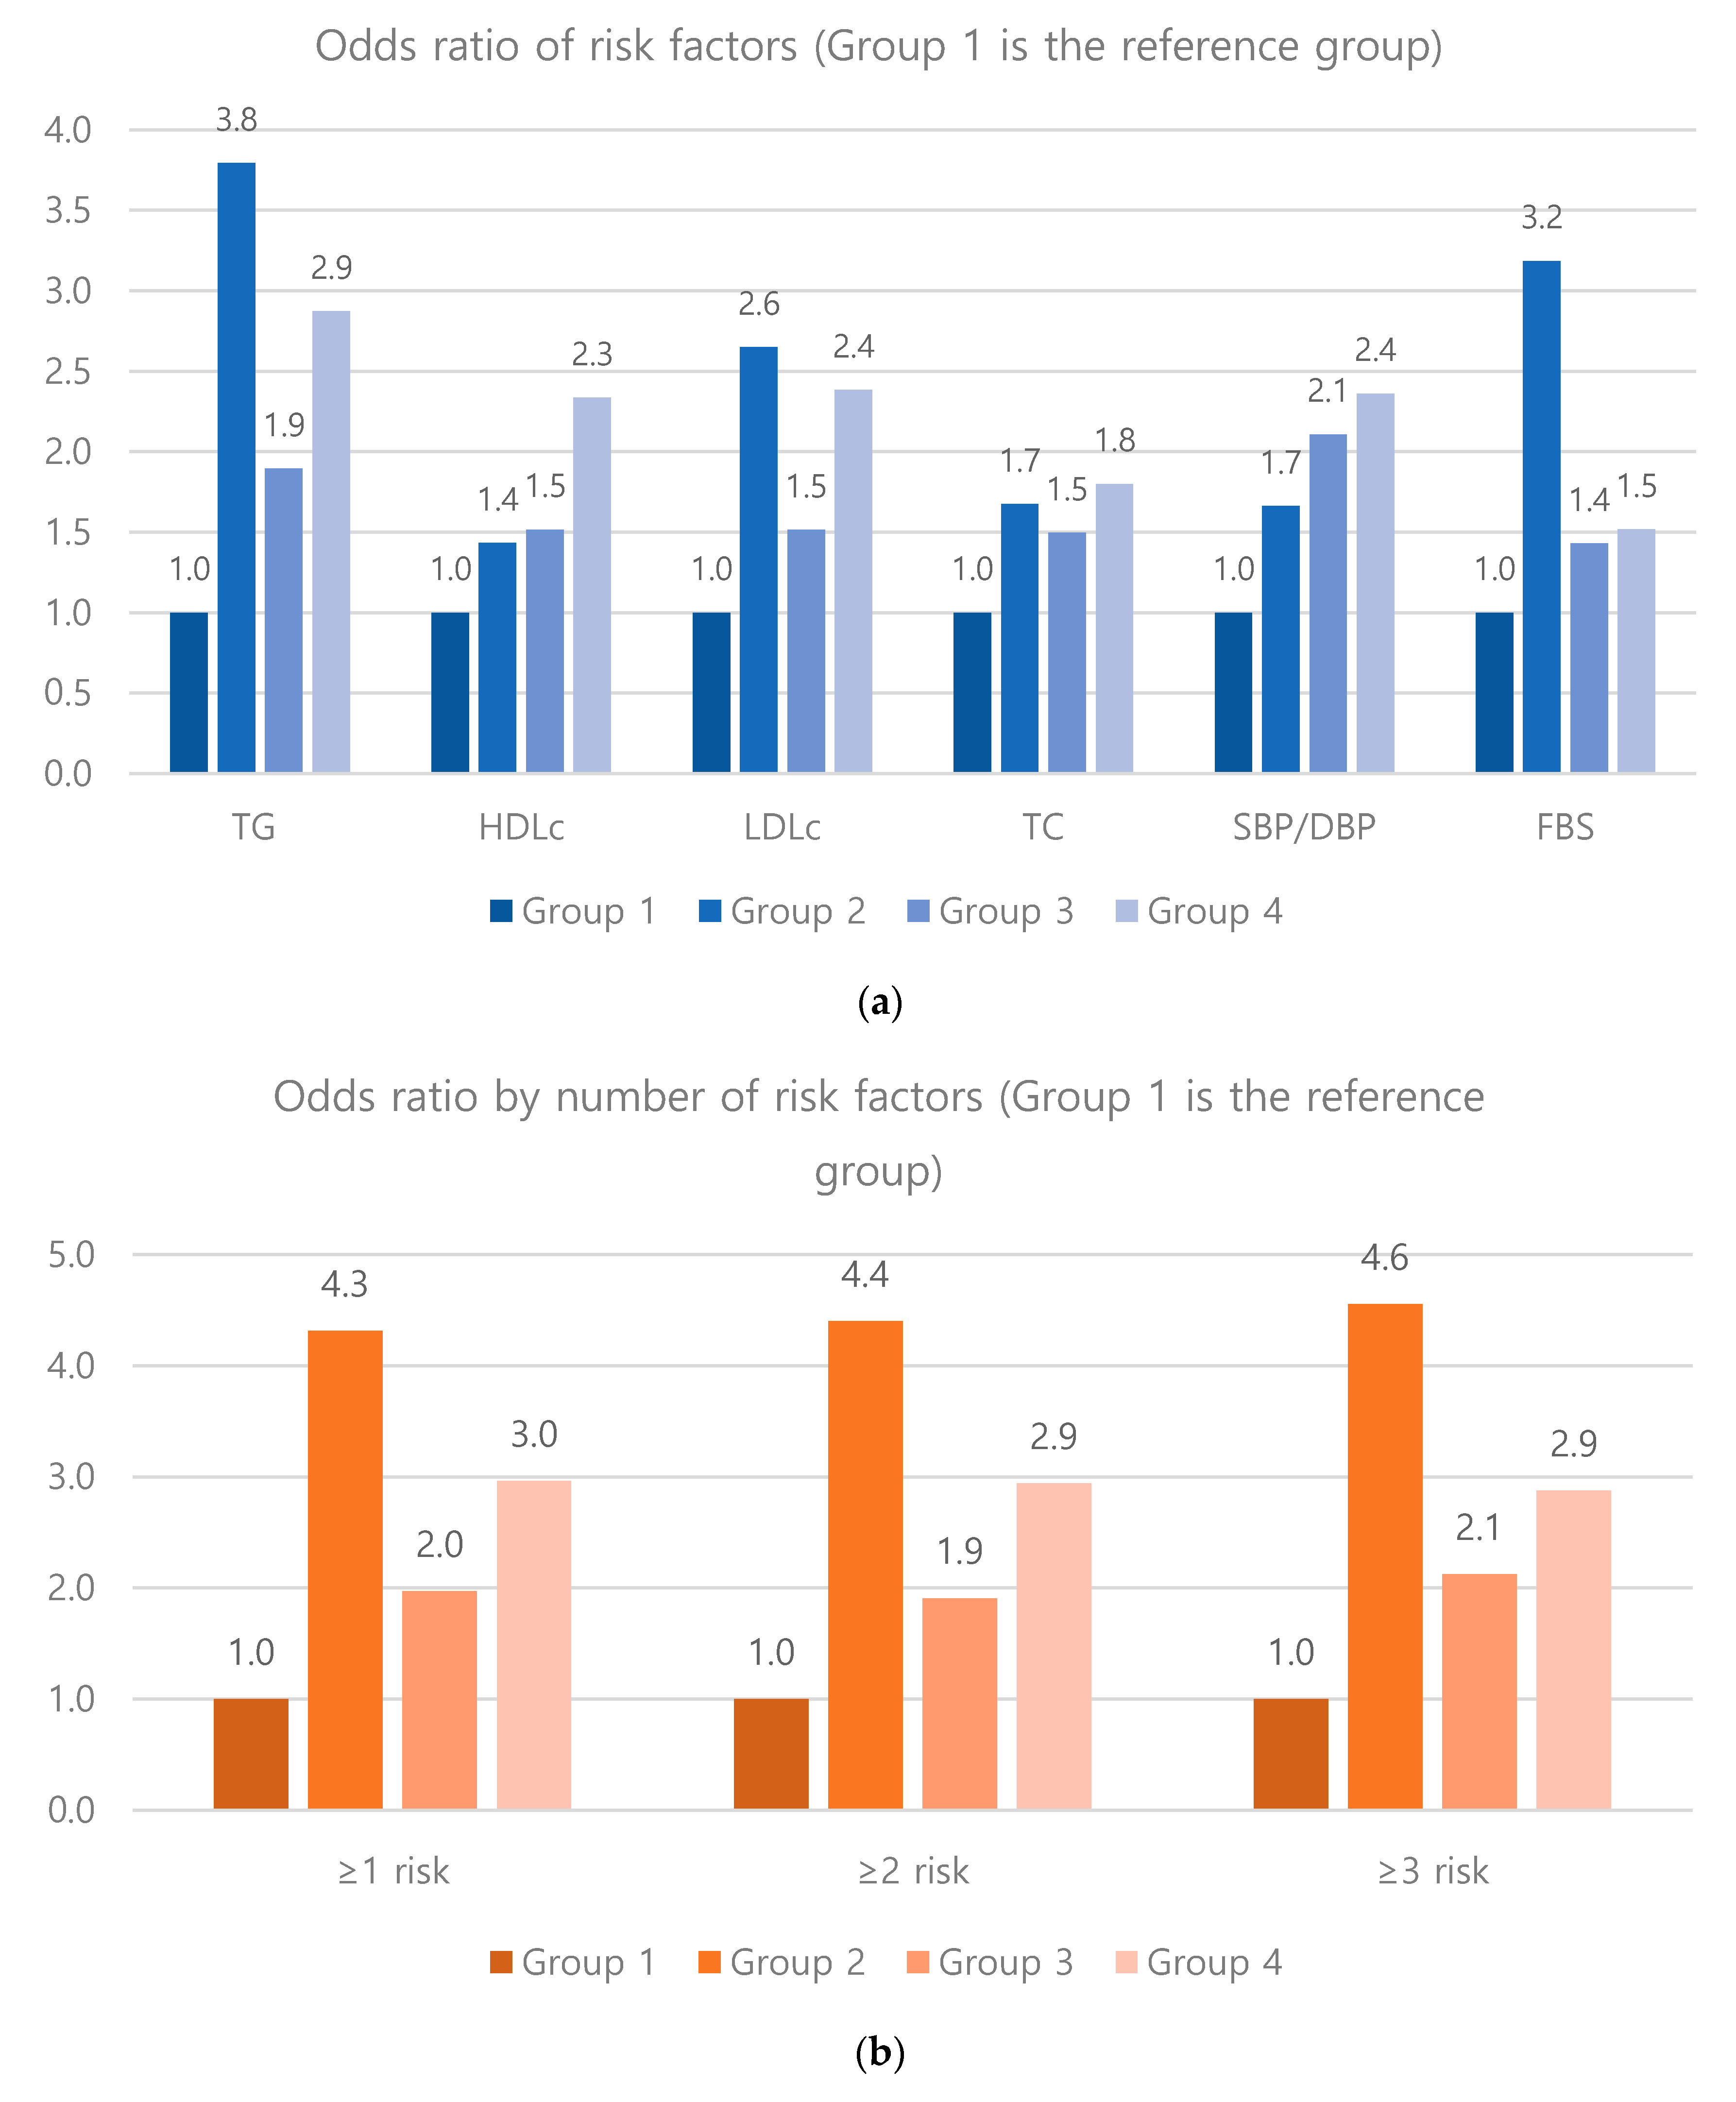
| TG (≥150 mg/dL) | 1 | 135 | 26% | 1.00 | (Reference) | |
| 2 | 16 | 57% | 3.79 * | 1.75 | 8.22 | |
| 3 | 50 | 40% | 1.90 * | 1.26 | 2.85 | |
| 4 | 98 | 50% | 2.87 * | 2.04 | 4.05 | |
| HDLC (<40 mg/dL) | 1 | 83 | 16% | 1.00 | (Reference) | |
| 2 | 6 | 21% | 1.43 | 0.56 | 3.64 | |
| 3 | 28 | 22% | 1.52 | 0.94 | 2.45 | |
| 4 | 60 | 31% | 2.33 * | 1.59 | 3.43 | |
| LDLC (≥160 mg/dL) | 1 | 58 | 11% | 1.00 | (Reference) | |
| 2 | 7 | 25% | 2.65 * | 1.08 | 6.50 | |
| 3 | 20 | 16% | 1.51 | 0.87 | 2.63 | |
| 4 | 45 | 23% | 2.38 * | 1.55 | 3.67 | |
| TC (≥220 mg/dL) | 1 | 194 | 37% | 1.00 | (Reference) | |
| 2 | 14 | 50% | 1.68 | 0.78 | 3.59 | |
| 3 | 59 | 47% | 1.50 * | 1.01 | 2.22 | |
| 4 | 101 | 52% | 1.80 * | 1.29 | 2.51 | |
| SBP/DBP (≥85/130 mmHg) | 1 | 60 | 12% | 1.00 | (Reference) | |
| 2 | 5 | 18% | 1.66 | 0.61 | 4.54 | |
| 3 | 27 | 22% | 2.11 * | 1.27 | 3.49 | |
| 4 | 46 | 24% | 2.36 * | 1.54 | 3.62 | |
| FBS (≥100 mg/dl) | 1 | 111 | 21% | 1.00 | (Reference) | |
| 2 | 13 | 46% | 3.19 * | 1.47 | 6.89 | |
| 3 | 35 | 28% | 1.43 | 0.92 | 2.23 | |
| 4 | 57 | 29% | 1.52 * | 1.05 | 2.20 | |
| 1 or more risks | 1 | 342 | 66% | 1.00 | (Reference) | |
| 2 | 25 | 89% | 4.31 * | 1.28 | 14.48 | |
| 3 | 99 | 79% | 1.97 * | 1.23 | 3.15 | |
| 4 | 166 | 85% | 2.96 * | 1.92 | 4.57 | |
| 2 or more risks | 1 | 188 | 36% | 1.00 | (Reference) | |
| 2 | 20 | 71% | 4.40 * | 1.90 | 10.19 | |
| 3 | 65 | 52% | 1.91 * | 1.29 | 2.83 | |
| 4 | 122 | 63% | 2.94 * | 2.09 | 4.14 | |
| 3 or more risks | 1 | 83 | 16% | 1.00 | (Reference) | |
| 2 | 13 | 46% | 4.55 * | 2.09 | 9.92 | |
| 3 | 36 | 29% | 2.12 * | 1.35 | 3.34 | |
| 4 | 69 | 35% | 2.88 * | 1.98 | 4.19 | |
Publisher’s Note: MDPI stays neutral with regard to jurisdictional claims in published maps and institutional affiliations. |
© 2020 by the authors. Licensee MDPI, Basel, Switzerland. This article is an open access article distributed under the terms and conditions of the Creative Commons Attribution (CC BY) license (http://creativecommons.org/licenses/by/4.0/).
Share and Cite
Kim, H.; Kim, K.; Shin, S. Cardiometabolic Risk Factor in Obese and Normal Weight Individuals in Community Dwelling Men. Int. J. Environ. Res. Public Health 2020, 17, 8925. https://0-doi-org.brum.beds.ac.uk/10.3390/ijerph17238925
Kim H, Kim K, Shin S. Cardiometabolic Risk Factor in Obese and Normal Weight Individuals in Community Dwelling Men. International Journal of Environmental Research and Public Health. 2020; 17(23):8925. https://0-doi-org.brum.beds.ac.uk/10.3390/ijerph17238925
Chicago/Turabian StyleKim, Hyunsoo, Kijeong Kim, and Sohee Shin. 2020. "Cardiometabolic Risk Factor in Obese and Normal Weight Individuals in Community Dwelling Men" International Journal of Environmental Research and Public Health 17, no. 23: 8925. https://0-doi-org.brum.beds.ac.uk/10.3390/ijerph17238925