Satellite Imaging-Based Residential Greenness and Accelerometry Measured Physical Activity at Midlife—Population-Based Northern Finland Birth Cohort 1966 Study

 , , , ,
Abstract
:1. Introduction
2. Materials and Methods
2.1. Accelerometer-Measured Physical Activity
2.2. Geographical Information System
2.3. Normalized Difference Vegetation Index
2.4. Body Mass Index
2.5. Urban–Rural Classification
2.6. Number of Sports Facilities
2.7. Questionnaire
2.8. Statistical Methods
3. Results
3.1. Physical Activity
3.2. Factors Associated with Physical Activity
4. Discussion
Strengths and Weaknesses
5. Conclusions
Author Contributions
Funding
Acknowledgments
Conflicts of Interest
Availability of Data and Materials
Abbreviations
| PA | physical activity |
| LPA | light physical activity |
| MPA | moderate physical activity |
| VPA/VVPA | vigorous/very vigorous physical activity |
| MVPA | moderate to vigorous physical activity |
| BMI | body mass index |
| GIS | geographic information system |
| CI | confidence interval |
| SD | standard deviation |
Appendix A

| All, N = 5433 | ||
|---|---|---|
| Light Physical Activity (LPA) R2 = 20.4% | Unadjusted B (95% CI) | Adjusted B * (95% CI) |
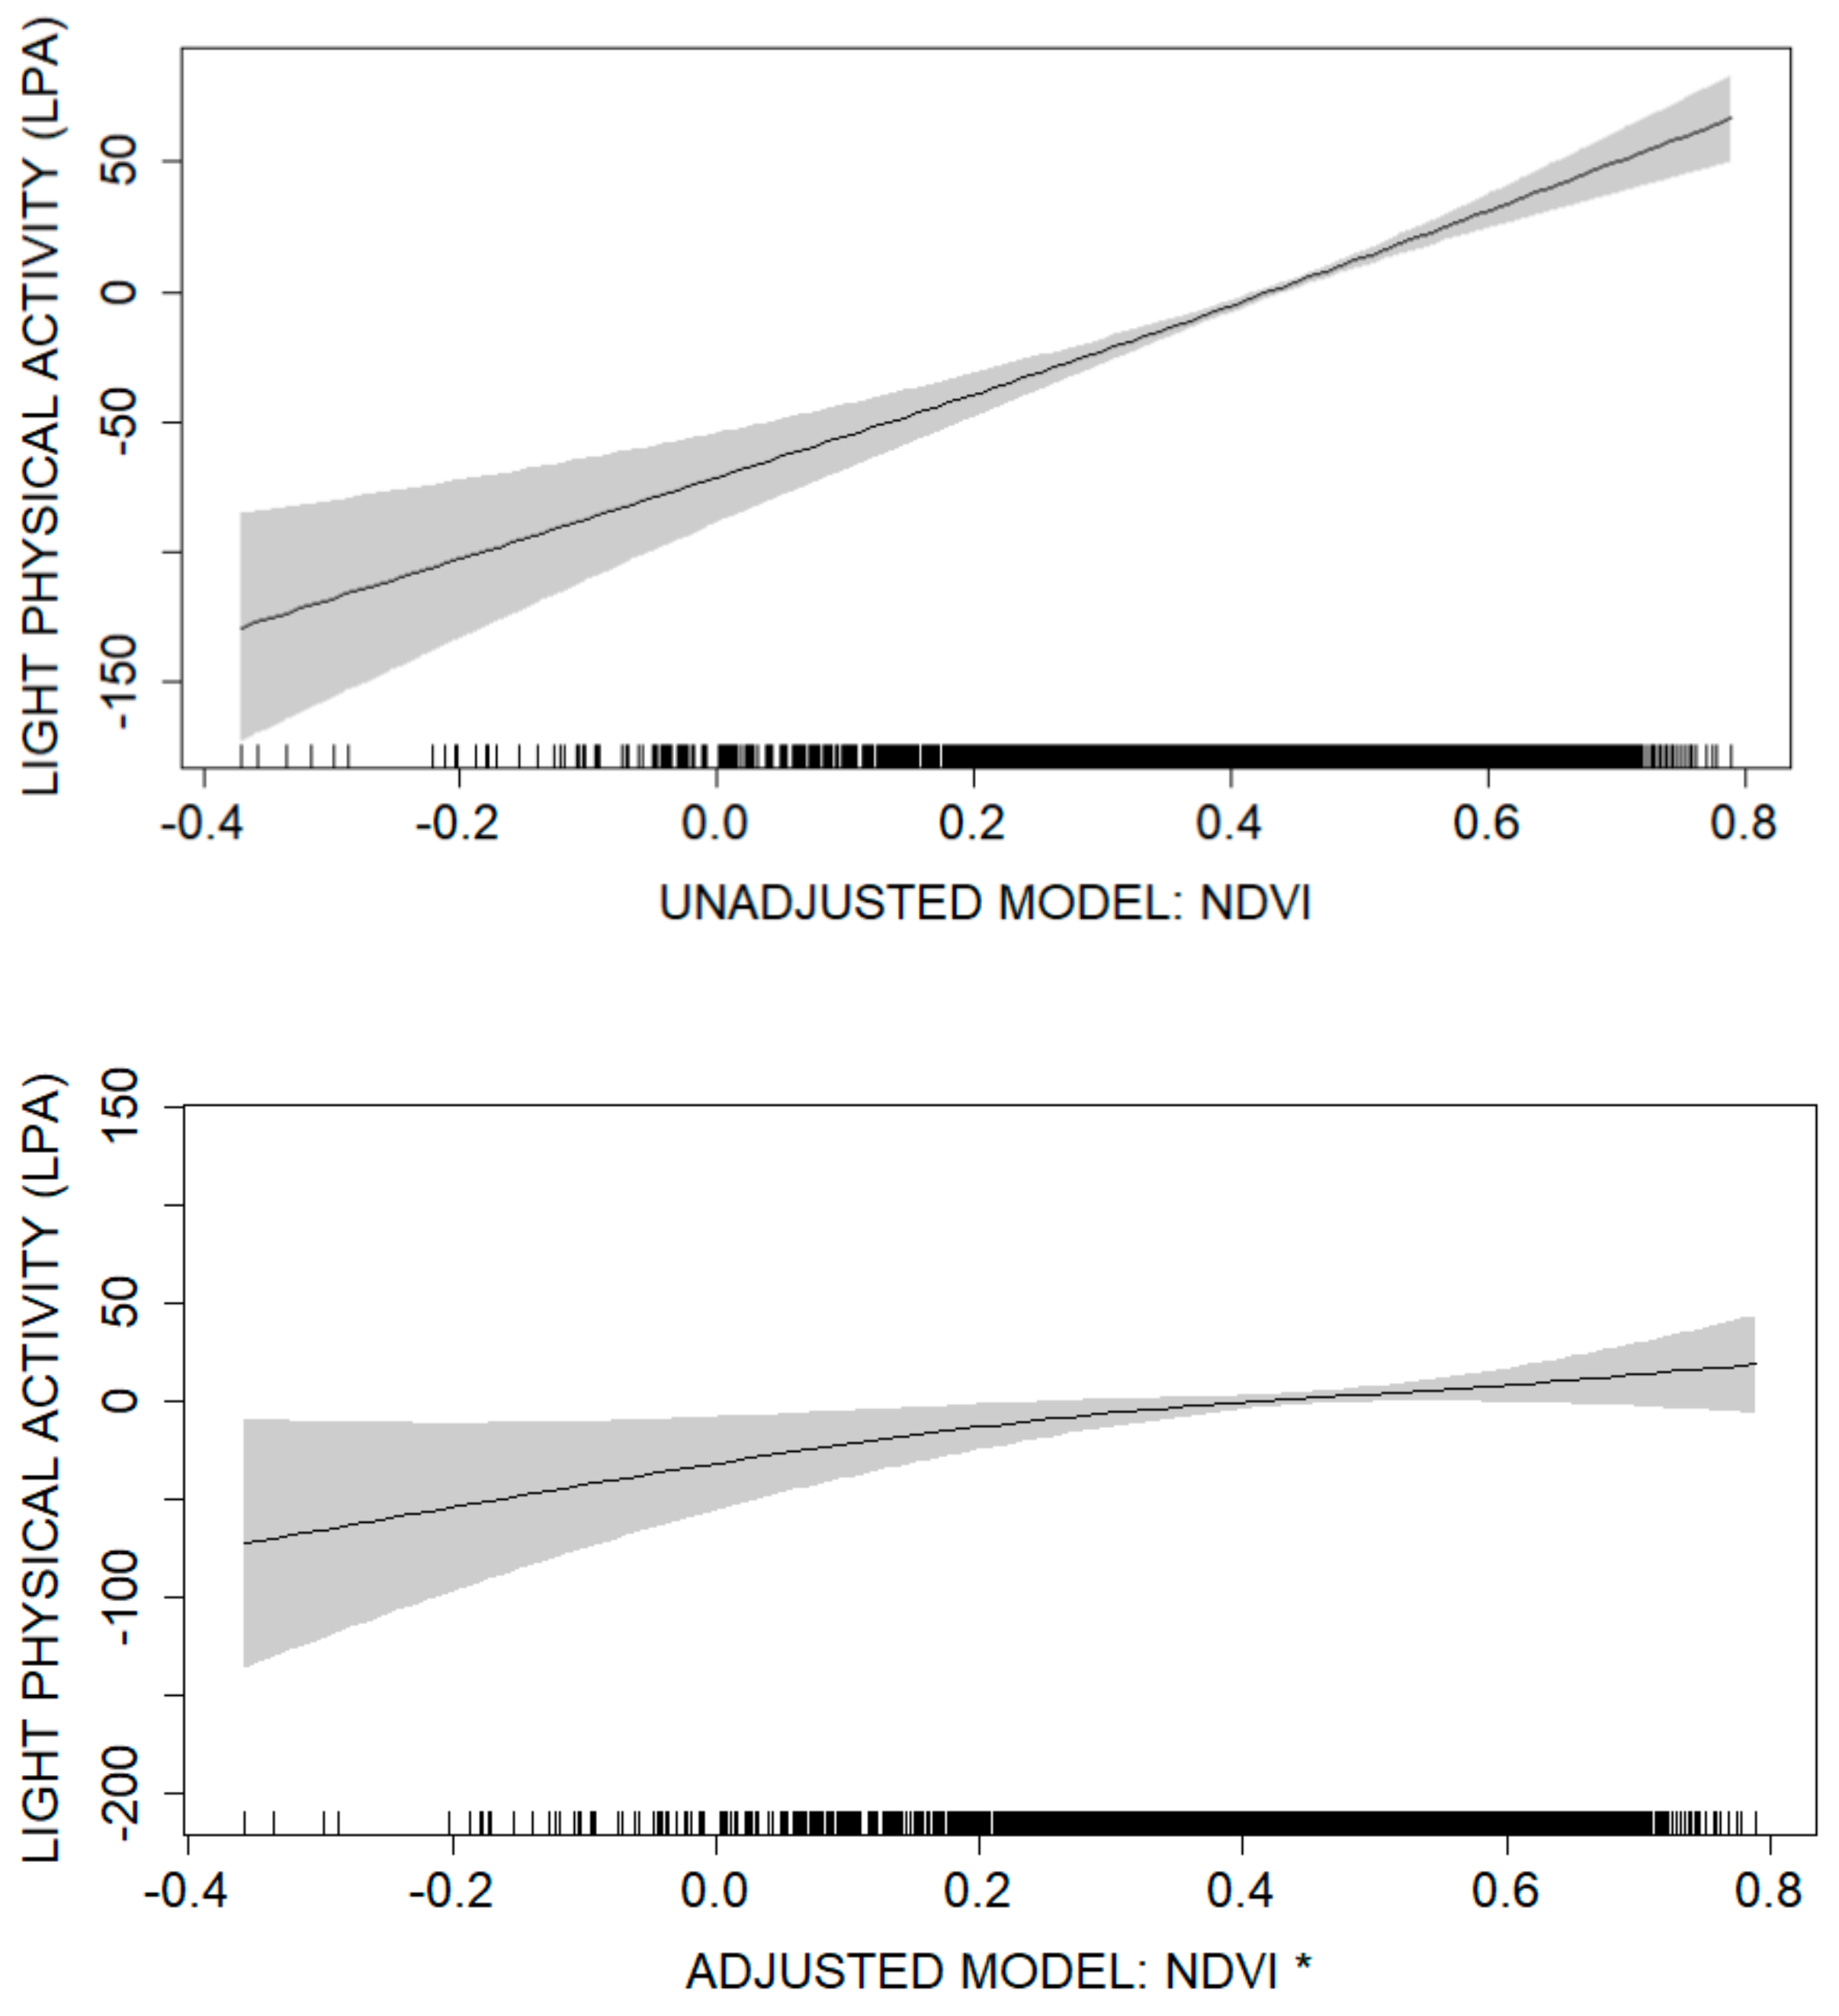
| NDVI (residential greenness) * | 174 (140, 209) *** | 70 (26, 114) ** |
| Family with children < 18 years old (yes) | 56 (44, 68) *** | 44 (31, 57) *** |
| Gender (female) | 38 (28, 49) *** | 43 (31, 54) *** |
| Level of education, low (yes) | −80 (−92, −69) *** | −38 (−51, −26) *** |
| Physically strenuous work * | 23 (22, 25) *** | 21 (19, 23) *** |
| Number of sport facilities | −1 (−1, −2) *** | −0.60 (−1, −0.13) * |
| BMI, kg/m2 | −5 (−6, −4) *** | −5 (−7, −4) *** |
| Daily alcohol intake | −0.82 (−1, −0.51) *** | −0.06 (−0.45, 0.31) |
| Good self-rated health | 17 (6, 28) ** | 3 (−9, 15) |
| Moderate physical activity (MPA) R2 = 24.5% | ||
| NDVI (residential greenness) * | 27 (11, 43) ** | 5 (−14, 24) |
| Family with children < 18 years old (yes) | 10 (4, 15) *** | 6 (0.6, 12) * |
| Gender (men) | −78 (−82, −74) *** | −80 (−85, −75) *** |
| Level of education, low (yes) | −14 (−19, −8) *** | −2 (−8, −3) *** |
| Physically strenuous work * | 4 (3, 4) *** | 3 (2,4) *** |
| Number of sport facilities | −0.29 (−0.46, −0.12) *** | 0.04 (−14, 24) |
| BMI, kg/m2 | −1 (−2, −1) *** | −2 (−2, −1) *** |
| Daily alcohol intake | 0.50 (0.36, 0.64) | 0.08 (−0.09, 0.25) |
| Good self-rated health | 9 (4, 14) *** | 3 (−1, 9) *** |
| Vigorous/very vigorous physical activity (VPA/VVPA) R2 = 4.1% | ||
| NDVI (residential greenness) * | −20 (−48, 8) | −16 (−56, 23) |
| Family with children < 18 years old (no) | 1 (−8, 12) | −3 (−14, 8) |
| Gender (men) | −15 (−23, −6) *** | −18 (−29, −8) *** |
| Level of education, high (yes) | 12 (3, 22) ** | 3 (−7, 15) |
| Physically strenuous work * | 1 (−0.41, 2) | 2 (−0.35, 3) ** |
| Number of sport facilities | 0.29 (0.00, 0.60) * | 0.25 (−17, 0.67) |
| BMI, kg/m2 | −6 (−6, −5) *** | −5 (−6, −4) *** |
| Daily alcohol intake | −0.24 (−0.49, 0.01) | 0.04 (−0.31, 0.40) |
| Good self-rated health | 49 (40, 59) *** | 29 (18, 40) *** |
| Moderate–vigorous physical activity (MVPA) R2 = 9.9% | ||
| NDVI (residential greenness) * | 7 (−29, 44) | −11 (−61, 39) |
| Family with children < 18 years old (yes) | 12 (−1, 25) | 3 (−11, 17) |
| Gender (men) | −93 (−104, −82) *** | −99 (−112, 86) *** |
| Level of education, low (yes) | −1 (−14, 11) | 1 (−13, 15) |
| Physically strenuous work * | 5 (3, 7) *** | 5 (3, 8) *** |
| Number of sport facilities | 0.00 (−0.39, 0.39) | 0.29 (−0.23, 0.83) |
| BMI, kg/m2 | −7 (−8, −6) *** | −7 (−9, −6) *** |
| Daily alcohol intake | 0.26 (−0.06, 0.60) | 0.13 (−0.31, 0.58) |
| Good self-rated health | 59 (47, 71) *** | 33 (18, 47) *** |
| Men, N = 2388 | Women, N = 3040 | |||
|---|---|---|---|---|
| Light Physical Activity (LPA) | Unadjusted B (95 % CI) | Adjusted B * (95% CI) | Unadjusted B (95% CI) | Adjusted B * (95% CI) |
| NDVI (residential greenness) * | 224 (173, 275) *** | 140 (75, 204) *** | 142 (96, 188) *** | 17 (−42, 76) |
| Family with children < 18 years old * | 58 (39, 76) *** | 31 (12, 51) ** | 54 (38, 71) *** | 52 (35, 69) *** |
| Level of education * | −93 (−111, −75) *** | −33 (−54, −113) ** | −79 (−94, −64) *** | −41 (−57, −25) *** |
| Physically strenuous work * | 23 (21, 26) *** | 20 (18, 23) *** | 24 (21, 26) *** | 22 (19, 25) *** |
| Number of sport facilities | −2 (−2, −1) *** | −0.50 (−1, 0.25) | −1 (−2, −1) *** | −0.74 (−1, −0.15) ** |
| BMI, kg/m2 | −4 (−6, −2) *** | −4 (−6, −2) *** | −5 (−6, −4) *** | −9 (−7, −4) *** |
| Daily alcohol intake | −0.58 (−0.94, −0.22) ** | −0.34 (−0.78, 0.09) | −0.48 (−1, 0.19) | 0.76 (−0.07, 1) |
| Good self-rated health | 9 (−7, 26) | 6 (−11, 24) | 21 (6, 36) ** | 2(−14, 19) |
| Moderate physical activity (MPA) | ||||
| NDVI (residential greenness) * | 75 (48, 101) *** | 23 (−12, 60) | −22 (−36, −8) ** | −12 (−32, 7) |
| Family with children < 18 years old * | 24 (14, 33) *** | 11 (1, 22) | −0.32 (−4, 5) | 0.47 (−5, 6) |
| Level of education * | −21 (−30, −11) *** | −7 (−18, 3) | 1 (−2, 6) | 1 (−3, 6) |
| Physically strenuous work * | 6 (5, 7) *** | 6 (4, 7) *** | 0.78 (0.00, 1) * | 1 (0.47, 2) ** |
| Number of sport facilities | −0.82 (−1, −0.52) *** | −0.37 (−0.80, 0.05) | 0.26 (0.12, 0.40) *** | 0.19 (−0.006, 0.38) * |
| BMI, kg/m2 | −3 (−4, −2) *** | −2 (−4, −1) *** | −2 (−2, −1) *** | −2 (−2, −1) *** |
| Daily alcohol intake | −0.19 (−0.38, −0.01) * | 21 (8, 35) ** | 0.16 (−0.03, 0.37) | 0.36 (0.08, 0.64) ** |
| Good self-rated health | 16 (7, 25) *** | 10 (0.15, 20) * | 8 (3, 12) *** | −0.09 (−5, 5) |
| Vigorous/very vigorous physical activity (VPA/VVPA) | ||||
| NDVI (residential greenness) * | −13 (−33, 61) | 15 (−49, 80) | −49 (−84, −14) ** | −36 (−86, 13) |
| Family with children < 18 years old * | 4 (−11, 21) | −6 (−26, 12) | −0.16 (−12, 12) | −1 (−15, 12) |
| Level of education * | 30 (13, 47) *** | 28 (7, 48) ** | 4 (−7, 15) | −10 (−24, 3) |
| Physically strenuous work * | 1 (−0.67, 4) | 3 (0.92, 6) ** | 0.38 (−1, 2) | 1 (−1, 3) |
| Number of sport facilities | −12 (−0.41, 0.66) | 0.15 (−0.61, 0.91) | 0.45 (0.09, 0.80) * | 0.27 (−0.22, 0.76) |
| BMI, kg/m2 | −7 (−9, −6) *** | −6 (−8, −4) *** | −5 (−6, −4) *** | −4 (−5, −3) *** |
| Daily alcohol intake | −0.56 (−0.89, −0.23) ** | −0.10 (−0.54, 0.33) | 0.23 (−0.29, 0.74) | 0.64 (−0.05, 1) |
| Good self-rated health | 53 (38, 68) *** | 34 (16, 52) *** | 47 (36, 59) *** | 26 (12, 40) *** |
| Moderate–vigorous physical activity (MVPA) | ||||
| NDVI (residential greenness) * | 89 (25, 152) ** | 39 (−46, 125) | −71 (−113, −26) ** | −48 (−108, 10) |
| Family with children < 18 years old * | 28 (6, 51) ** | 4 (−20, 30 | 0.16 (−15, 15) | −1 (−17, 15) |
| Level of education, high * | 9 (−13, 32) | 20 (−6, 47) | 5 (−8, 19) | −8 (−25, 7) |
| Physically strenuous work * | 8 (5, 11) *** | 9 (6, 13) *** | 1 (−1, 3) | 2 (−0.08, 5) |
| Number of sport facilities | −0.69 (−1, 0.01) * | −0.22 (−1, 0.78) | 0.71 (0.28, 1) ** | 0.46 (−0.12, 1) |
| BMI, kg/m2 | −10 (−12, −8) *** | −9 (−12, −6) *** | −7 (−8, −6) *** | −6 (−8, −5) *** |
| Daily alcohol intake | −0.76 (−1, −0.32) ** | −0.07 (−0.65, 0.50) | 0.39 (−0.23, 1) | 1 (0.01, 1) ** |
| Good self-rated health | 70 (49, 90) *** | 44 (20, 69) *** | 56 (42, 69) *** | 26 (9, 43) ** |
References
- Loprinzi, P.D.; Kohli, M. Effect of physical activity and sedentary behavior on serum prostate-specific antigen concentrations: Results from the National Health and Nutrition Examination Survey (NHANES), 2003–2006. Mayo Clin. Proc. 2013, 88, 11–21. [Google Scholar] [CrossRef]
- Riou, M.; Abdulnour, J.; Brochu, M.; Prud’homme, D.; Rabasa-Lhoret, R.; Doucet, E. Light physical activity is a better determinant of lower adiposity during the menopausal transition. Climacteric 2014, 17, 79–86. [Google Scholar] [CrossRef] [PubMed]
- Piercy, K.L.; Troiano, R.P.; Ballard, R.M.; Carlson, S.; Fulton, J.E.; Galuska, D.A.; George, S.N.; Olson, R.D. The physical activity guidelines for Americans. JAMA 2018, 320, 2020–2028. [Google Scholar] [CrossRef] [PubMed]
- Lee, I.; Shiroma, E.J. Using accelerometers to measure physical activity in large-scale epidemiological studies: Issues and challenges. Br. J. Sports Med. 2014, 48, 197–201. [Google Scholar] [CrossRef] [PubMed] [Green Version]
- Chastin, S.F.; De Craemer, M.; De Cocker, K.; Powell, L.; Van Cauwenberg, J.; Dall, P.; Hamer, M.; Stamatakis, E. How does light-intensity physical activity associate with adult cardiometabolic health and mortality? Systematic review with meta-analysis of experimental and observational studies. Br. J. Sports Med. 2019, 53, 370–376. [Google Scholar] [CrossRef] [Green Version]
- Howard, B.; Winkler, E.A.; Sethi, P.; Carson, V.; Ridgers, N.D.; Salmon, J.O.; Healy, G.N.; Owen, N.; Dunstan, D.W. Associations of low- and high-intensity light activity with cardiometabolic biomarkers. Med. Sci. Sports Exerc. 2015, 47, 2093–2101. [Google Scholar] [CrossRef] [PubMed]
- Villeneuve, P.J.; Jerrett, M.; Su, J.G.; Burnett, R.T.; Chen, H.; Wheeler, A.J.; Goldberg, M.S. A cohort study relating urban green space with mortality in Ontario, Canada. Environ. Res. 2012, 115, 51–58. [Google Scholar] [CrossRef] [PubMed]
- Matthews, C.E.; Keadle, S.K.; Troiano, R.P.; Kahle, L.; Koster, A.; Brychta, R.; Van Domelen, D.; Caserotti, P.; Chen, K.Y.; Harris, T.B.; et al. Accelerometer-measured dose-response for physical activity, sedentary time, and mortality in US adults. Am. J. Clin. Nutr. 2016, 104, 1424–1432. [Google Scholar] [CrossRef] [Green Version]
- Borgundvaag, E.; Janssen, I. Objectively measured physical activity and mortality risk among American adults. Am. J. Prev. Med. 2017, 52, e25–e31. [Google Scholar] [CrossRef]
- Karusisi, N.; Bean, K.; Oppert, J.M.; Pannier, B.; Chaix, B. Multiple dimensions of residential environments, neighborhood experiences, and jogging behavior in the RECORD Study. Prev. Med. 2012, 55, 50–55. [Google Scholar] [CrossRef]
- Klompmaker, J.O.; Hoek, G.; Bloemsma, L.D.; Gehring, U.; Strak, M.; Wijga, A.H.; van den Brink, C.; Brunekreef, B.; Lebret, E.; Janssen, N.A. Green space definition affects associations of green space with overweight and physical activity. Environ. Res. 2018, 160, 531–540. [Google Scholar] [CrossRef] [PubMed]
- Smith, L.; Panter, J.; Ogilvie, D. Characteristics of the environment and physical activity in midlife: Findings from UK Biobank. Prev. Med. 2019, 118, 150–158. Available online: http://0-www-sciencedirect-com.brum.beds.ac.uk/science/article/pii/S0091743518303438 (accessed on 10 December 2019). [CrossRef] [PubMed]
- Nowak, D.J.; Crane, D.E.; Stevens, J.C. Air pollution removal by urban trees and shrubs in the United States. Urban For. Urban Green. 2006, 4, 115–123. [Google Scholar] [CrossRef]
- Gidlöf-Gunnarsson, A.; Öhrström, E. Noise and well-being in urban residential environments: The potential role of perceived availability to nearby green areas. Landsc. Urban Plan. 2007, 83, 115–126. [Google Scholar] [CrossRef]
- Kaplan, R.; Kaplan, S. The Experience of Nature: A Psychological Perspective; CUP Archive: Cambridge, UK, 1989; p. 340. [Google Scholar]
- Kaplan, S. The restorative benefits of nature: Toward an integrative framework. J. Environ. Psychol. 1995, 15, 169–182. [Google Scholar] [CrossRef]
- Grinde, B.; Patil, G.G. Biophilia: Does visual contact with nature impact on health and well-being? Int. J. Environ. Res. Public Health 2009, 6, 2332–2343. [Google Scholar] [CrossRef] [Green Version]
- Ulrich, R. View through a window may influence recovery from surgery. Science 1984, 224, 420–421. [Google Scholar] [CrossRef] [Green Version]
- Ulrich, R.S.; Simons, R.F.; Losito, B.D.; Fiorito, E.; Miles, M.A.; Zelson, M. Stress recovery during exposure to natural and urban environments. J. Environ. Psychol. 1991, 11, 201–230. [Google Scholar] [CrossRef]
- Hartig, T.; Book, A.; Garvill, J.; Olsson, T.; Gärling, T. Environmental influences on psychological restoration. Scand. J. Psychol. 1996, 37, 378–393. [Google Scholar] [CrossRef]
- Shanahan, D.F.; Franco, L.; Lin, B.B.; Gaston, K.J.; Fuller, R.A. The benefits of natural environments for physical activity. Sports Med. 2016, 46, 989–995. [Google Scholar] [CrossRef] [Green Version]
- Cox, D.T.; Shanahan, D.F.; Hudson, H.L.; Fuller, R.A.; Anderson, K.; Hancock, S.; Gaston, K.J. Doses of nearby nature simultaneously associated with multiple health benefits. Int. J. Environ. Res. Public Health 2017, 14, 172. [Google Scholar] [CrossRef] [PubMed] [Green Version]
- Focht, B.C. Brief walks in outdoor and laboratory environments: Effects on affective responses, enjoyment, and intentions to walk for exercise. Res. Q. Exerc. Sport 2009, 80, 611–620. [Google Scholar] [CrossRef] [PubMed]
- Akers, A.; Barton, J.; Cossey, R.; Gainsford, P.; Griffin, M.; Micklewright, D. Visual color perception in green exercise: Positive effects on mood and perceived exertion. Environ. Sci. Technol. 2012, 46, 8661–8666. [Google Scholar] [CrossRef]
- Gladwell, V.F.; Brown, D.K.; Wood, C.; Sandercock, G.R.; Barton, J.L. The great outdoors: How a green exercise environment can benefit all. Extrem. Physiol. Med. 2013, 2, 3. [Google Scholar] [CrossRef] [PubMed] [Green Version]
- Hug, S.M.; Hartig, T.; Hansmann, R.; Seeland, K.; Hornung, R. Restorative qualities of indoor and outdoor exercise settings as predictors of exercise frequency. Health Place 2009, 15, 971–980. [Google Scholar] [CrossRef] [PubMed]
- Pretty, J.; Peacock, J.; Hine, R.; Sellens, M.; South, N.; Griffin, M. Green exercise in the UK countryside: Effects on health and psychological well-being and implications for policy and planning. J. Environ. Plan. Manag. 2007, 50, 211–231. [Google Scholar] [CrossRef]
- Sugiyama, T.; Giles-Corti, B.; Summers, J.; du Toit, L.; Leslie, E.; Owen, N. Initiating and Maintaining Recreational Walking: A longitudinal Study on the Influence of Neighborhood Green Space. Prev. Med. 2013, 57, 178–182. Available online: http://0-www-sciencedirect-com.brum.beds.ac.uk/science/article/pii/S0091743513001783 (accessed on 11 April 2019). [CrossRef]
- Northern Finland Cohorts. Oulu: University of Oulu. 2019. Available online: http://www.oulu.fi/nfbc/ (accessed on 26 March 2020).
- Hautala, A.; Martinmaki, K.; Kiviniemi, A.; Kinnunen, H.; Virtanen, P.; Jaatinen, J.; Tulppo, M. Effects of habitual physical activity on response to endurance training. J. Sports Sci. 2012, 30, 563–569. [Google Scholar] [CrossRef]
- Kinnunen, H.; Tanskanen, M.; Kyröläinen, H.; Westerterp, K.R. Wrist-worn accelerometers in assessment of energy expenditure during intensive training. Physiol. Meas. 2012, 33, 1841–1854. [Google Scholar] [CrossRef]
- Jauho, A.M.; Pyky, R.; Ahola, R.; Kangas, M.; Virtanen, P.; Korpelainen, R.; Jämsä, T. Effect of wrist-worn activity monitor feedback on physical activity behavior: A randomized controlled trial in Finnish young men. Prev. Med. Rep. 2015, 2, 628–634. [Google Scholar] [CrossRef] [Green Version]
- Husu, P.; Suni, J.; Vähä-Ypyä, H.; Sievänen, H.; Tokola, K.; Valkeinen, H. The level of physical activity and sedentary behaviour in Finnish adults. Suom. Lääkärilehti 2014, 69, 1860–1866. [Google Scholar]
- Niemelä, M.S.; Kangas, M.; Ahola, R.J.; Auvinen, J.P.; Leinonen, A.M.; Tammelin, T.H.; Vaaramo, E.S.; Keinänen-Kiukaanniemi, S.M.; Korpelainen, R.I.; Jämsä, T.J. Dose-response relation of self-reported and accelerometer-measured physical activity to perceived health in middle age—The Northern Finland Birth Cohort 1966 study. BMC Public Health 2019, 19, 21. [Google Scholar] [CrossRef] [PubMed]
- Browning, M.; Lee, K. Within what distance does “greenness” best predict physical health? A systematic review of articles with GIS buffer analyses across the lifespan. Int. J. Environ. Res. Public Health 2017, 14, 675. [Google Scholar] [CrossRef] [PubMed] [Green Version]
- Younan, D.; Tuvblad, C.; Li, L.; Wu, J.; Lurmann, F.; Franklin, M.; Berhane, K.; McConnell, R.; Wu, A.H.; Baker, L.A.; et al. Environmental determinants of aggression in adolescents: Role of urban neighborhood greenspace. J. Am. Acad. Child Adolesc. Psychiatry 2016, 55, 591–601. [Google Scholar] [CrossRef] [PubMed] [Green Version]
- ArcGIS Pro, Version 2.1; Environmental Systems Research Institute: Redlands, CA, USA, 2001.
- Cusack, L.; Larkin, A.; Carozza, S.E.; Hystad, P. Associations between multiple green space measures and birth weight across two US cities. Health Place 2017, 47, 36–43. [Google Scholar] [CrossRef] [PubMed]
- James, P.; Hart, J.E.; Hipp, J.A.; Mitchell, J.A.; Kerr, J.; Hurvitz, P.M.; Glanz, K.; Laden, F. GPS-based exposure to greenness and walkability and accelerometry-based physical activity. Cancer Epidemiol. Biomark. Prev. 2017, 26, 525–532. [Google Scholar] [CrossRef] [Green Version]
- Rhew, I.C.; Vander Stoep, A.; Kearney, A.; Smith, N.L.; Dunbar, M.D. Validation of the Normalized Difference Vegetation Index as a Measure of Neighborhood Greenness. Ann. Epidemiol. 2011, 21, 946–952. Available online: http://0-www-sciencedirect-com.brum.beds.ac.uk/science/article/pii/S104727971100250X (accessed on 8 August 2019). [CrossRef] [Green Version]
- Weier, J.; Herring, D. Measuring Vegetation (NDVI & EVI). NASA Earth Observatory, 2000. Available online: http://earthobservatory.nasa.gov/Features/MeasuringVegetation/measuring_vegetation_2.php (accessed on 26 March 2020).
- USGS. US Geological Survey Earth Explorer; USGS: Reston, VA, USA, 2017.
- Statistics Finland. Standard Industrial Classification TOL 2008; Statistics Finland: Helsinki, Finland, 2016. [Google Scholar]
- Helminen, V.; Nurmio, K.; Rehunen, A.; Ristimäki, M.; Oinonen, K.; Tiitu, M.; Kotavaara, O.; Antikainen, H.; Rusanen, J. Urban–Rural Area Classification; Finnish Environment Institute: Helsinki, Finland, 2014; Available online: https://helda.helsinki.fi/handle/10138/135861 (accessed on 20 August 2019).
- LIPAS. National Database of the Finnish Sport Facilities. Jyväskylä: University of Jyväskylä. 2020. Available online: http://www.liikuntapaikat.fi/lipas (accessed on 10 January 2020).
- Punakallio, A.; Lusa, S.; Ala-Mursula, L.; Ek, E.; Nevanperä, N.; Remes, J.; Auvinen, J.; Seitsamo, J.; Karppinen, J.; Laitinen, J. Personal meaning of work and perceived work ability among middle-aged workers with physically strenuous work: A Northern Finland Birth Cohort 1966 study. Int. Arch. Occup. Environ. Health 2019, 92, 371–381. [Google Scholar] [CrossRef] [Green Version]
- IBM Corp. IBM SPSS Statistics for Windows; IBM Corp: Armonk, NY, USA, 2017. [Google Scholar]
- Hastie, T.J.; Tibshirani, R.J. Generalized additive models. Stat. Sci. 1986, 1, 297–310. [Google Scholar] [CrossRef]
- Austin, M.P. Spatial prediction of species distribution: An interface between ecological theory and statistical modelling. Ecol. Model. 2002, 157, 101–118. [Google Scholar] [CrossRef] [Green Version]
- Benedetti, A.; Abrahamowicz, M.; Leffondré, K.; Goldberg, M.S.; Tamblyn, R. Using generalized additive models to detect and estimate threshold associations. Int. J. Biostat. 2009, 5, 26. [Google Scholar] [CrossRef] [Green Version]
- Astell-Burt, T.; Feng, X.; Kolt, G.S. Mental health benefits of neighbourhood green space are stronger among physically active adults in middle-to-older age: Evidence from 260,061 Australians. Prev. Med. 2013, 57, 601–606. [Google Scholar] [CrossRef] [PubMed]
- Calogiuri, G.; Chroni, S. The impact of the natural environment on the promotion of active living: An integrative systematic review. BMC Public Health 2014, 14, 873. [Google Scholar] [CrossRef] [PubMed] [Green Version]
- Jokela, M.; Kivimäki, M.; Elovainio, M.; Viikari, J.; Raitakari, O.T.; Keltikangas-Järvinen, L. Urban/rural differences in body weight: Evidence for social selection and causation hypotheses in Finland. Soc. Sci. Med. 2009, 68, 867–875. [Google Scholar] [CrossRef]
- Sievänen, T.; Neuvonen, M. Luonnon Virkistyskäyttö 2010; Finnish Forest Research Institute: Vantaa, Finland, 2011. [Google Scholar]
- Liu, H.; Li, F.; Li, J.; Zhang, Y. The relationships between urban parks, residents’ physical activity, and mental health benefits: A case study from Beijing, China. J. Environ. Manag. 2017, 190, 223–230. [Google Scholar] [CrossRef]
- Ayala-Azcárraga, C.; Diaz, D.; Zambrano, L. Characteristics of urban parks and their relation to user well-being. Landsc. Urban Plan. 2019, 189, 27–35. [Google Scholar] [CrossRef]
- Roemmich, J.; Johnson, L.; Oberg, G.; Beeler, J.; Ufholz, K. Youth and adult visitation and physical activity intensity at rural and urban parks. Int. J. Environ. Res. Public Health 2018, 15, 1760. [Google Scholar] [CrossRef] [Green Version]
- Van Cauwenberg, J.; Nathan, A.; Barnett, A.; Barnett, D.W.; Cerin, E. Relationships between neighbourhood physical environmental attributes and older adults’ leisure-time physical activity: A systematic review and meta-analysis. Sports Med. 2018, 48, 1635–1660. [Google Scholar] [CrossRef]
- Celis-Morales, C.A.; Lyall, D.M.; Welsh, P.; Anderson, J.; Steell, L.; Guo, Y.; Maldonado, R.; Mackay, D.F.; Pell, J.P.; Sattar, N.; et al. Association between active commuting and incident cardiovascular disease, cancer, and mortality: Prospective cohort study. BMJ 2017, 357, j1456. [Google Scholar] [CrossRef] [Green Version]
- Saint-Maurice, P.F.; Troiano, R.P.; Berrigan, D.; Kraus, W.E.; Matthews, C.E. Volume of light versus moderate-to-vigorous physical activity: Similar benefits for all-cause mortality? J. Am. Heart Assoc. 2018, 7, e008815. [Google Scholar] [CrossRef] [Green Version]

| Characteristics | All (n = 5433) | Men (n = 3043) | Women (n = 2388) |
|---|---|---|---|
| NDVI, (SD) * | 0.4268 (0.1486) | 0.4315 (0.1481) | 0.4231 (0.1489) |
| Weight, kg, (SD) | 77.6 (16.1) | 87.1 (14.8) | 71.8 (14.7) |
| BMI, kg/m2, (SD) | 26.8 (4.8) | 27.3 (4.2) | 26.4 (5.2) |
| Highly educated, N (%) | 1443 (26.5) | 538 (17.6) | 905 (37.8) |
| Physical strenuousness of work, (SD) * | 4 (3) | 4 (3) | 3 (2) |
| Children < 18 years old in the family (yes), N (%) | 3500 (64.4) | 1504 (49.4) | 1996 (83.5) |
| Daily alcohol intake, g, (SD) | 10.4 (16.9) | 15.6 (21.8) | 71.8 (14.7) |
| Smoking (yes), N (%) | 1168 (21.4) | 569 (18.6) | 599 (25.0) |
| Total annual household income, €, (SD) | 72,202 (298,532) | 80,141 (439,388) | 65,823 (74,487) |
| Excellent/good perceived health (yes), N (%) | 3510 (64.6) | 1485 (48.8) | 2025 (84.7) |
| Living in semi-rural and rural areas (vs. urban area), N (%) | 1891 (34.8) | 867 (28.4) | 1024 (42.8) |
| Number of sport facilities, (SD) | 10 (14) | 9 (13) | 11 (14) |
| Characteristics | LPA | MPA | VPA/VVPA | MVPA |
|---|---|---|---|---|
| All (n = 5433) | 719 (193) | 144 (88) | 226 (160) | 370 (209) |
| Men | 697 (191) | 188 (98) | 234 (174) | 422 (233) |
| Women | 736 (193) ** | 109 (58) ** | 219 (147) * | 328 (176) ** |
| High education | 662 (169) ** | 134 (71) ** | 236 (152) * | 371 (188) |
| Low education | 743 (198) | 149 (93) | 223 (163) | 372 (217) |
| Children <18 years old (yes) | 677 (196) ** | 146 (87) ** | 227 (154) | 374 (203) |
| Children <18 years old (no) | 733 (187) | 136 (80) | 225 (162) | 362 (206) |
| Smoker | 725 (188) | 138 (87) ** | 330 (195) ** | 191 (143) ** |
| Nonsmoker | 725 (188) | 150 (88) | 378 (198) | 227 (149) |
| Perceived health (excellent/good) | 724 (190) * | 147 (86) ** | 390 (203) ** | 243 (158) ** |
| Perceived health (moderate/poor) | 707 (200) | 138 (90) | 331 (214) | 193 (159) |
| Living in semirural or rural areas | 764 (196) ** | 152 (101) ** | 378 (237) | 225 (175) * |
| Living in urban areas | 695 (188) | 139 (78) | 225 (151) | 365 (191) |
| All, N = 5433 | Men, N = 2388 | Women, N = 3040 | ||||
|---|---|---|---|---|---|---|
| Unadjusted B (95% CI) | Adjusted B (95% CI) | Unadjusted B (95% CI) | Adjusted B (95% CI) | Unadjusted B (95% CI) | Adjusted B (95% CI) | |
| Light physical activity (LPA) | ||||||
| NDVI (residential greenness) | 174 (140, 209) ** | 70 (26, 114) ** | 224 (173, 275) ** | 140 (75, 204) ** | 142 (96, 188) ** | 17 (−42, 76) |
| Moderate physical activity (MPA) | ||||||
| NDVI (residential greenness) | 27 (11, 43) * | 5 (−14, 24) | 75 (48, 101) ** | 23 (−12, 60) | −22 (−36, −8) * | −12 (−32, 7) |
| Vigorous/very vigorous physical activity (VPA/VVPA) | ||||||
| NDVI (residential greenness) | −20 (−48, 8) | −16 (−56, 23) | 13 (−33, 61) | 15 (−49, 80) | −49 (−84, −14) * | −36 (−86, 13) |
| Moderate–vigorous physical activity (MPA) | ||||||
| NDVI (residential greenness) | 7 (−29, 44) | −11 (−61, 39) | 89 (25, 152) * | 39 (−46, 125) | −71 (−113, −29) * | −48 (−108, 10) |
Publisher’s Note: MDPI stays neutral with regard to jurisdictional claims in published maps and institutional affiliations. |
© 2020 by the authors. Licensee MDPI, Basel, Switzerland. This article is an open access article distributed under the terms and conditions of the Creative Commons Attribution (CC BY) license (http://creativecommons.org/licenses/by/4.0/).
Share and Cite
Puhakka, S.; Lankila, T.; Pyky, R.; Kärmeniemi, M.; Niemelä, M.; Kangas, K.; Rusanen, J.; Kangas, M.; Näyhä, S.; Korpelainen, R. Satellite Imaging-Based Residential Greenness and Accelerometry Measured Physical Activity at Midlife—Population-Based Northern Finland Birth Cohort 1966 Study. Int. J. Environ. Res. Public Health 2020, 17, 9202. https://0-doi-org.brum.beds.ac.uk/10.3390/ijerph17249202
Puhakka S, Lankila T, Pyky R, Kärmeniemi M, Niemelä M, Kangas K, Rusanen J, Kangas M, Näyhä S, Korpelainen R. Satellite Imaging-Based Residential Greenness and Accelerometry Measured Physical Activity at Midlife—Population-Based Northern Finland Birth Cohort 1966 Study. International Journal of Environmental Research and Public Health. 2020; 17(24):9202. https://0-doi-org.brum.beds.ac.uk/10.3390/ijerph17249202
Chicago/Turabian StylePuhakka, Soile, Tiina Lankila, Riitta Pyky, Mikko Kärmeniemi, Maisa Niemelä, Katja Kangas, Jarmo Rusanen, Maarit Kangas, Simo Näyhä, and Raija Korpelainen. 2020. "Satellite Imaging-Based Residential Greenness and Accelerometry Measured Physical Activity at Midlife—Population-Based Northern Finland Birth Cohort 1966 Study" International Journal of Environmental Research and Public Health 17, no. 24: 9202. https://0-doi-org.brum.beds.ac.uk/10.3390/ijerph17249202