Feasibility of Indonesia Family Life Survey Wave 5 (IFLS5) Data for Air Pollution Exposure–Response Study in Indonesia

 , , ,
, , ,
Abstract
:1. Introduction
2. Materials and Methods
3. Results
3.1. Review of Data Completeness and Prevalence Data
3.2. Comparison of Self-Reported and Health Measurement Data
3.3. Review of Potential Confounder Data
3.3.1. Demographics
3.3.2. Smoking Status
3.3.3. Diet
3.3.4. Socio-Economic Status and Other Exposure
4. Discussion
5. Conclusions
Supplementary Materials
Author Contributions
Funding
Acknowledgments
Conflicts of Interest
References
- WHO. European High-level Conference on Noncommunicable Diseases. Available online: https://www.who.int/news-room/events/detail/2019/04/09/default-calendar/who-european-high-level-conference-on-noncommunicable-diseases (accessed on 27 October 2020).
- Kementerian Lingkungan Hidup dan Kehutanan Status Lingkungan Hidup Indonesia. 2013. Available online: https://deposit.perpusnas.go.id/wajibserah/terbitan/1170245 (accessed on 27 October 2020).
- Yudison, A.P.; Driejana, D.; Reksowardojo, I.K.; Sulaeman, A.S. Motorcycle Emission Profiles in Bandung City, Indonesia. Available online: https://www.sae.org/publications/technical-papers/content/2017-32-0076/ (accessed on 27 October 2020).
- BPS Badan Pusat Statistik. Available online: https://www.bps.go.id/indicator/17/57/1/jumlah-kendaraan-bermotor.html (accessed on 29 October 2020).
- Garcia, E.; Berhane, K.T.; Islam, T.; McConnell, R.; Urman, R.; Chen, Z.; Gilliland, F.D. Association of Changes in Air Quality with Incident Asthma in Children in California, 1993–2014. JAMA 2019, 321, 1906–1915. [Google Scholar] [CrossRef] [PubMed] [Green Version]
- Cai, J.; Zhao, A.; Zhao, J.; Chen, R.; Wang, W.; Ha, S.; Xu, X.; Kan, H. Acute effects of air pollution on asthma hospitalization in Shanghai, China. Environ. Pollut. 2014, 191, 139–144. [Google Scholar] [CrossRef] [PubMed]
- Bowatte, G.; Lodge, C.; Lowe, A.; Erbas, B.; Perret, J.; Abramson, M.J.; Matheson, M.; Dharmage, S. The influence of childhood traffic-related air pollution exposure on asthma, allergy and sensitization: A systematic review and a meta-analysis of birth cohort studies. Allergy 2015, 70, 245–256. [Google Scholar] [CrossRef]
- Hystad, P.W.; Demers, P.A.; Johnson, K.C.; Carpiano, R.M.; Brauer, M. Long-term Residential Exposure to Air Pollution and Lung Cancer Risk. Epidemiology 2013, 24, 762–772. [Google Scholar] [CrossRef] [PubMed]
- Cohen, A.J.; Samet, J.M.; Straif, K. International Agency for Research on Cancer. Air Pollution and Cancer; International Agency for Research on Cancer: Lyon, France, 2013; ISBN 978-92-832-2161-6. [Google Scholar]
- Liu, C.; Chen, R.; Zhao, Y.; Ma, Z.; Bi, J.; Liu, Y.; Meng, X.; Wang, Y.; Chen, X.; Li, W.; et al. Associations between ambient fine particulate air pollution and hypertension: A nationwide cross-sectional study in China. Sci. Total. Environ. 2017, 869–874. [Google Scholar] [CrossRef] [PubMed]
- Zhang, H.; Wang, Q.; He, S.; Wu, K.; Ren, M.; Dong, H.; Di, J.; Yu, Z.; Huang, C. Ambient air pollution and gestational diabetes mellitus: A review of evidence from biological mechanisms to population epidemiology. Sci. Total. Environ. 2020, 719, 137349. [Google Scholar] [CrossRef]
- Howell, N.A.; Tu, J.V.; Moineddin, R.; Chen, H.; Chu, A.; Hystad, P.; Booth, G.L. Interaction between neighborhood walkability and traffic-related air pollution on hypertension and diabetes: The CANHEART cohort. Environ. Int. 2019, 132, 104799. [Google Scholar] [CrossRef]
- Lee, K.K.; Miller, M.R.; Shah, A.S.V. Air Pollution and Stroke. J. Stroke 2018, 20, 2–11. [Google Scholar] [CrossRef] [Green Version]
- Kettunen, J.; Lanki, T.; Tiittanen, P.; Aalto, P.P.; Koskentalo, T.; Kulmala, M.; Salomaa, V.; Pekkanen, J. Associations of Fine and Ultrafine Particulate Air Pollution with Stroke Mortality in an Area of Low Air Pollution Levels. Stroke 2007, 38, 918–922. [Google Scholar] [CrossRef] [Green Version]
- Kementrian, P.P.N.; Bapenas. Rancangan Teknokratik Rencana Pembangunan Jangka Menengah Nasional 2020-2024; Bapenas: Jakarta, Indonesia, 2019. [Google Scholar]
- Kunii, O.; Kanagawa, S.; Yajima, I.; Hisamatsu, Y.; Yamamura, S.; Amagai, T.; Ismail, I.T.S. The 1997 Haze Disaster in Indonesia: Its Air Quality and Health Effects. Arch. Environ. Health Int. J. 2002, 57, 16–22. [Google Scholar] [CrossRef]
- Duki, M.I.Z.; Sudarmadi, S.; Suzuki, S.; Kawada, T.; Tri-Tugaswatl, A. Effect of Air Pollution on Respiratory Health in Indonesia and Its Economic Cost. Arch. Environ. Health Int. J. 2003, 58, 135–143. [Google Scholar] [CrossRef] [PubMed]
- Hayasaka, H.; Noguchi, I.; Putra, E.I.; Yulianti, N.; Vadrevu, K. Peat-fire-related air pollution in Central Kalimantan, Indonesia. Environ. Pollut. 2014, 195, 257–266. [Google Scholar] [CrossRef] [PubMed]
- Santoso, M.; Lestiani, D.D.; Mukhtar, R.; Hamonangan, E.; Syafrul, H.; Markwitz, A.; Hopke, P.K. Preliminary study of the sources of ambient air pollution in Serpong, Indonesia. Atmos. Pollut. Res. 2011, 2, 190–196. [Google Scholar] [CrossRef] [Green Version]
- Nurrohman, R.; Harahap, F.; Taufik, F.F.; Susanto, A.D. Respiratory Symptoms and Lung Function in Worker Exposed to Carbon Black Dust in Ink Factory. J. Respir. Indo. 2014, 34, 158–166. [Google Scholar]
- Viet, N.N.; Yunus, F.; Phuong, A.N.T.; Bich, V.D.; Damayanti, T.; Wiyono, W.H.; Billot, L.; Jakes, R.W.; Kwon, N. The prevalence and patient characteristics of chronic obstructive pulmonary disease in non-smokers in Vietnam and Indonesia: An observational survey. Respirology 2015, 20, 602–611. [Google Scholar] [CrossRef]
- Rofiman, R.; Yunus, F.; Taufik, F.F. Pulmonary Function Test of Traffic Policeman in Tangerang. J. Respir. Indones. 2017, 37, 1–7. [Google Scholar]
- Amalia, M.; Resosudarmo, B.; Bennett, J.; Director, I. The Consequences of Urban Air Pollution for Child Health: What does Self Reporting Data in the Jakarta Metropolitan Area Reveal? Masy. Indones. 2017, 39, 527–549. [Google Scholar]
- Eeftens, M.; Beelen, R.; De Hoogh, K.; Bellander, T.; Cesaroni, G.; Cirach, M.; Declercq, C.; Dėdelė, A.; Dons, E.; De Nazelle, A.; et al. Development of Land Use Regression Models for PM2.5, PM2.5 Absorbance, PM10 and PMcoarse in 20 European Study Areas; Results of the ESCAPE Project. Environ. Sci. Technol. 2012, 46, 11195–11205. [Google Scholar] [CrossRef]
- Beelen, R.; Hoek, G.; Vienneau, D.; Eeftens, M.; Dimakopoulou, K.; Pedeli, X.; Tsai, M.-Y.; Künzli, N.; Schikowski, T.; Marcon, A.; et al. Development of NO2 and NOx land use regression models for estimating air pollution exposure in 36 study areas in Europe—The ESCAPE project. Atmos. Environ. 2013, 72, 10–23. [Google Scholar] [CrossRef]
- RAND Indonesian Family Life Survey (IFLS)|RAND. Available online: https://www.rand.org/well-being/social-and-behavioral-policy/data/FLS/IFLS.html (accessed on 26 October 2020).
- Hussain, M.A.; Huxley, R.R.; Mamun, A.A. Multimorbidity prevalence and pattern in Indonesian adults: An exploratory study using national survey data. BMJ Open 2015, 5, e009810. [Google Scholar] [CrossRef] [Green Version]
- Sohn, K. A note on the effects of education on youth smoking in a developing country. J. Asia Pac. Econ. 2013, 19, 66–73. [Google Scholar] [CrossRef]
- Christiani, Y.; Byles, J.E.; Tavener, M.; Dugdale, P. Do women in major cities experience better health? A comparison of chronic conditions and their risk factors between women living in major cities and other cities in Indonesia. Glob. Health Action 2015, 8, 28540. [Google Scholar] [CrossRef] [PubMed]
- Jayachandran, S. Air Quality and Early-Life Mortality: Evidence from Indonesia’s Wildfires. J. Hum. Resour. 2009, 44, 916–954. [Google Scholar] [CrossRef] [Green Version]
- Frankenberg, E.; McKee, D.; Thomas, D. Health Consequences of Forest Fires in Indonesia. Demography 2004, 42, 109–129. [Google Scholar] [CrossRef] [Green Version]
- Kim, Y.; Knowles, S.; Manley, J.; Radoias, V. Long-run health consequences of air pollution: Evidence from Indonesia’s forest fires of 1997. Econ. Hum. Biol. 2017, 26, 186–198. [Google Scholar] [CrossRef] [Green Version]
- Kim, Y.; Manley, J.; Radoias, V. Air Pollution and Long-Term Mental Health; Social Science Research Network: Rochester, NY, USA, 2017. [Google Scholar]
- Kim, Y.; Manley, J.; Radoias, V. Medium- and long-term consequences of pollution on labor supply: Evidence from Indonesia. IZA J. Labor Econ. 2017, 6, 1010. [Google Scholar] [CrossRef] [Green Version]
- Rosales-Rueda, M.; Triyana, M. The Persistent Effects of Early-Life Exposure to Air Pollution: Evidence from the Indonesian Forest Fires. J. Hum. Resour. 2018, 54, 1037–1080. [Google Scholar] [CrossRef]
- Ross, Z.; Jerrett, M.; Ito, K.; Tempalski, B.; Thurston, G. A land use regression for predicting fine particulate matter concentrations in the New York City region. Atmos. Environ. 2007, 41, 2255–2269. [Google Scholar] [CrossRef]
- Aguilera, I.; Sunyer, J.; Fernández-Patier, R.; Hoek, G.; Aguirre-Alfaro, A.; Meliefste, K.; Bomboi-Mingarro, M.T.; Nieuwenhuijsen, M.J.; Herce-Garraleta, D.; Brunekreef, B. Estimation of Outdoor NOx, NO2, and BTEX Exposure in a Cohort of Pregnant Women Using Land Use Regression Modeling. Environ. Sci. Technol. 2008, 42, 815–821. [Google Scholar] [CrossRef]
- Cyrys, J.; Eeftens, M.; Heinrich, J.; Ampe, C.; Armengaud, A.; Beelen, R.; Bellander, T.; Beregszaszi, T.; Birk, M.; Cesaroni, G.; et al. Variation of NO2 and NOx concentrations between and within 36 European study areas: Results from the ESCAPE study. Atmos. Environ. 2012, 62, 374–390. [Google Scholar] [CrossRef]
- Campos, V.P.; Cruz, L.P.; Godoi, R.H.; Godoi, A.F.L.; Tavares, T.M. Development and validation of passive samplers for atmospheric monitoring of SO2, NO2, O3 and H2S in tropical areas. Microchem. J. 2010, 96, 132–138. [Google Scholar] [CrossRef]
- De Santis, F.; Döğeroğlu, T.; Menichelli, S.; Vazzana, C.; Allegrini, I. The Use of a New Passive Sampler for Ozone and Nitrogen Oxides Monitoring in Ecological Effects Research. Sci. World J. 2001, 1, 475–482. [Google Scholar] [CrossRef] [PubMed] [Green Version]
- Pope, F.D.; Gatari, M.; Ng’Ang’A, D.; Poynter, A.; Blake, R. Airborne particulate matter monitoring in Kenya using calibrated low-cost sensors. Atmos. Chem. Phys. Discuss. 2018, 18, 15403–15418. [Google Scholar] [CrossRef] [Green Version]
- Sawyer, S.M.; Azzopardi, P.S.; Wickremarathne, D.; Patton, G.C. The age of adolescence. Lancet Child Adolesc. Health 2018, 2, 223–228. [Google Scholar] [CrossRef]
- Woodruff, T.J.; Parker, J.D.; Kyle, A.D.; Schoendorf, K.C. Disparities in exposure to air pollution during pregnancy. Environ. Health Perspect. 2003, 111, 942–946. [Google Scholar] [CrossRef] [PubMed] [Green Version]
- Tatum, A.J.; Shapiro, G.G. The effects of outdoor air pollution and tobacco smoke on asthma. Immunol. Allergy Clin. N. Am. 2005, 25, 15–30. [Google Scholar] [CrossRef]
- Lim, C.C.; Hayes, R.B.; Ahn, J.; Shao, Y.; Silverman, D.T.; Jones, R.R.; Thurston, G.D. Mediterranean Diet and the Association Between Air Pollution and Cardiovascular Disease Mortality Risk. Circulation 2019, 139, 1766–1775. [Google Scholar] [CrossRef]
- Litbang Kemkes. Riset Kesehatan Dasar (RISKESDAS) 2013; Litbangkes: Jakarta, Indonesia, 2013; ISBN 978-602-8937-24-5. [Google Scholar]
- Mahendradata, Y.; Trisnantoro, L.; Listyadewi, S.; Soewondo, P.; Marthias, T.; Harimurti, P.; Prawira, J. The Republic of Indonesia Health System Review; Health systems in transition, Vol-7, Number-1; World Health Organization, South East Asia Regional Office (SEARO): New Delhi, India, 2017. [Google Scholar]
- Silwal, A.R.; McKay, A. The Impact of Cooking with Firewood on Respiratory Health: Evidence from Indonesia; Working Paper Series; Department of Economics, University of Sussex Business School: Brighton, UK, 2014. [Google Scholar]
- Van Tongeren, M.; Carder, M.; Agustian, D.; Driejana, D. The Indonesian Family Life Survey (IFLS) and proxy measures for traffic related air pollution. Environ. Epidemiol. 2019, 3, 408. [Google Scholar] [CrossRef]


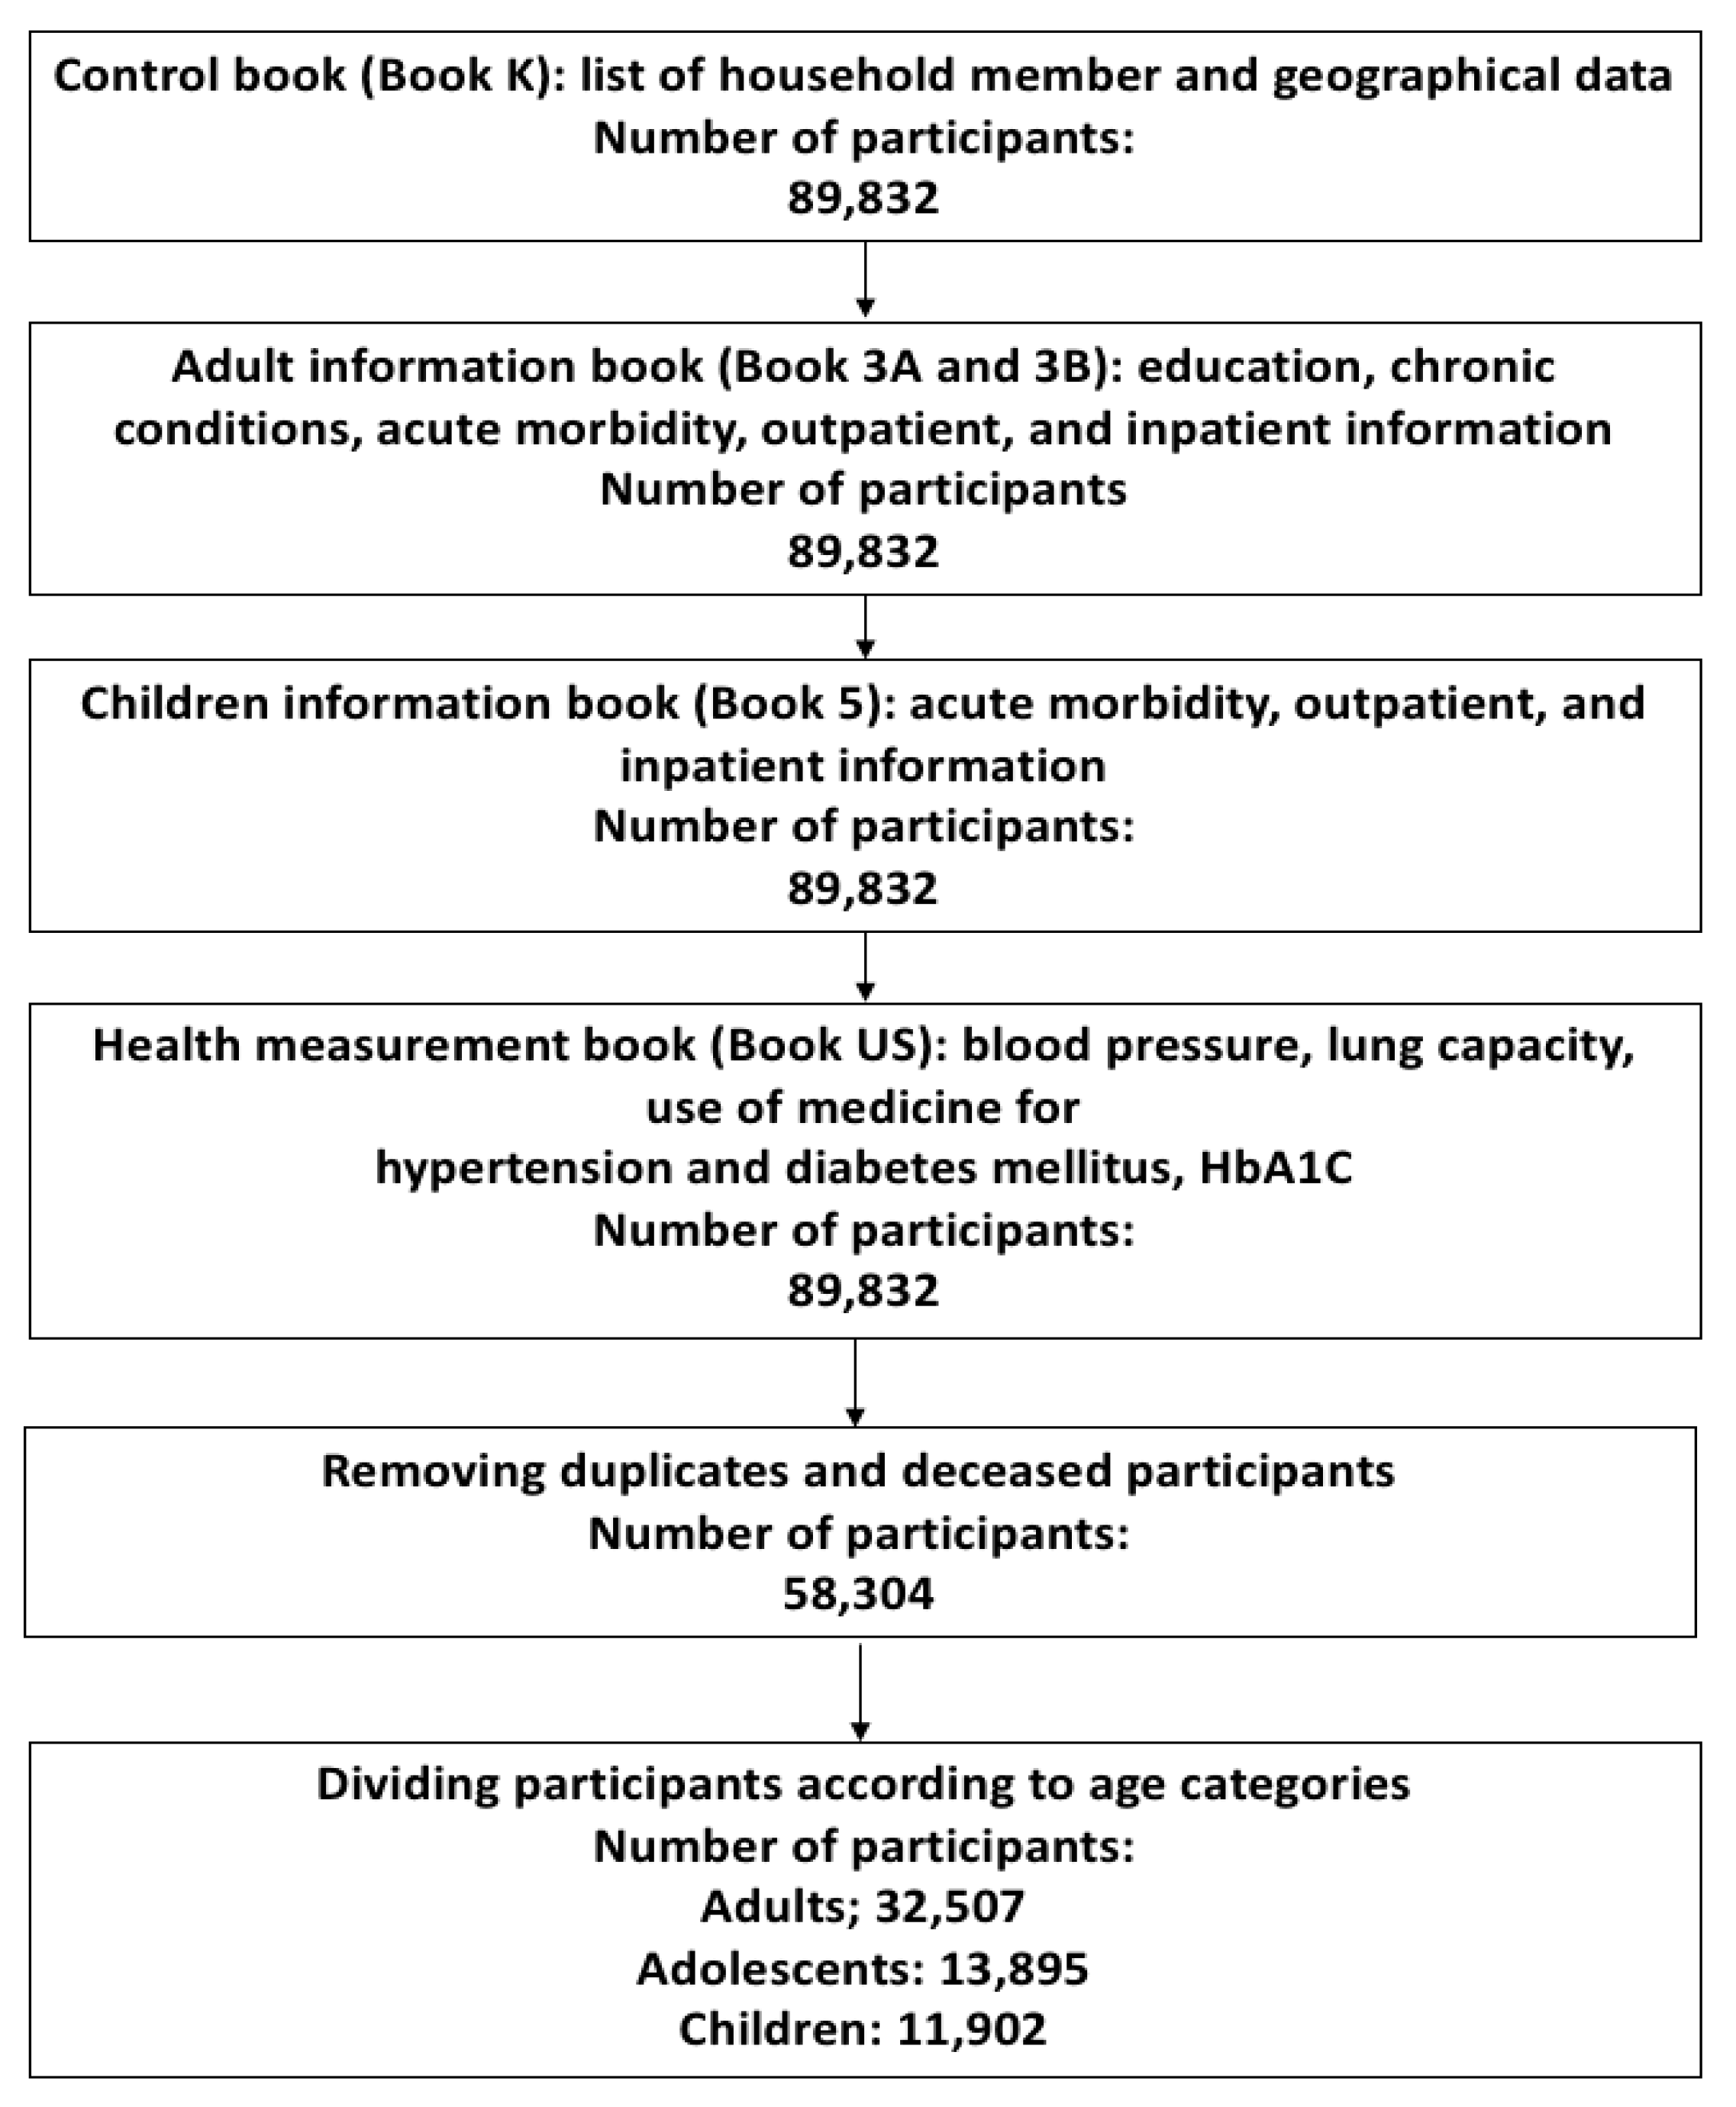
| Characteristics | Wave 5 n = 58,304 (%) | |
|---|---|---|
| Sex Female | 29,719 (50.97) | |
| Age Group | ||
| Children (<10 years) | 11,902 (20.4) | |
| Adolescent (10–24.9 years) | 13,895 (23.8) | |
| Adult (≥25 years) | 32,507 (55.8) | |
| Province | Total | Average number of Subject Per district |
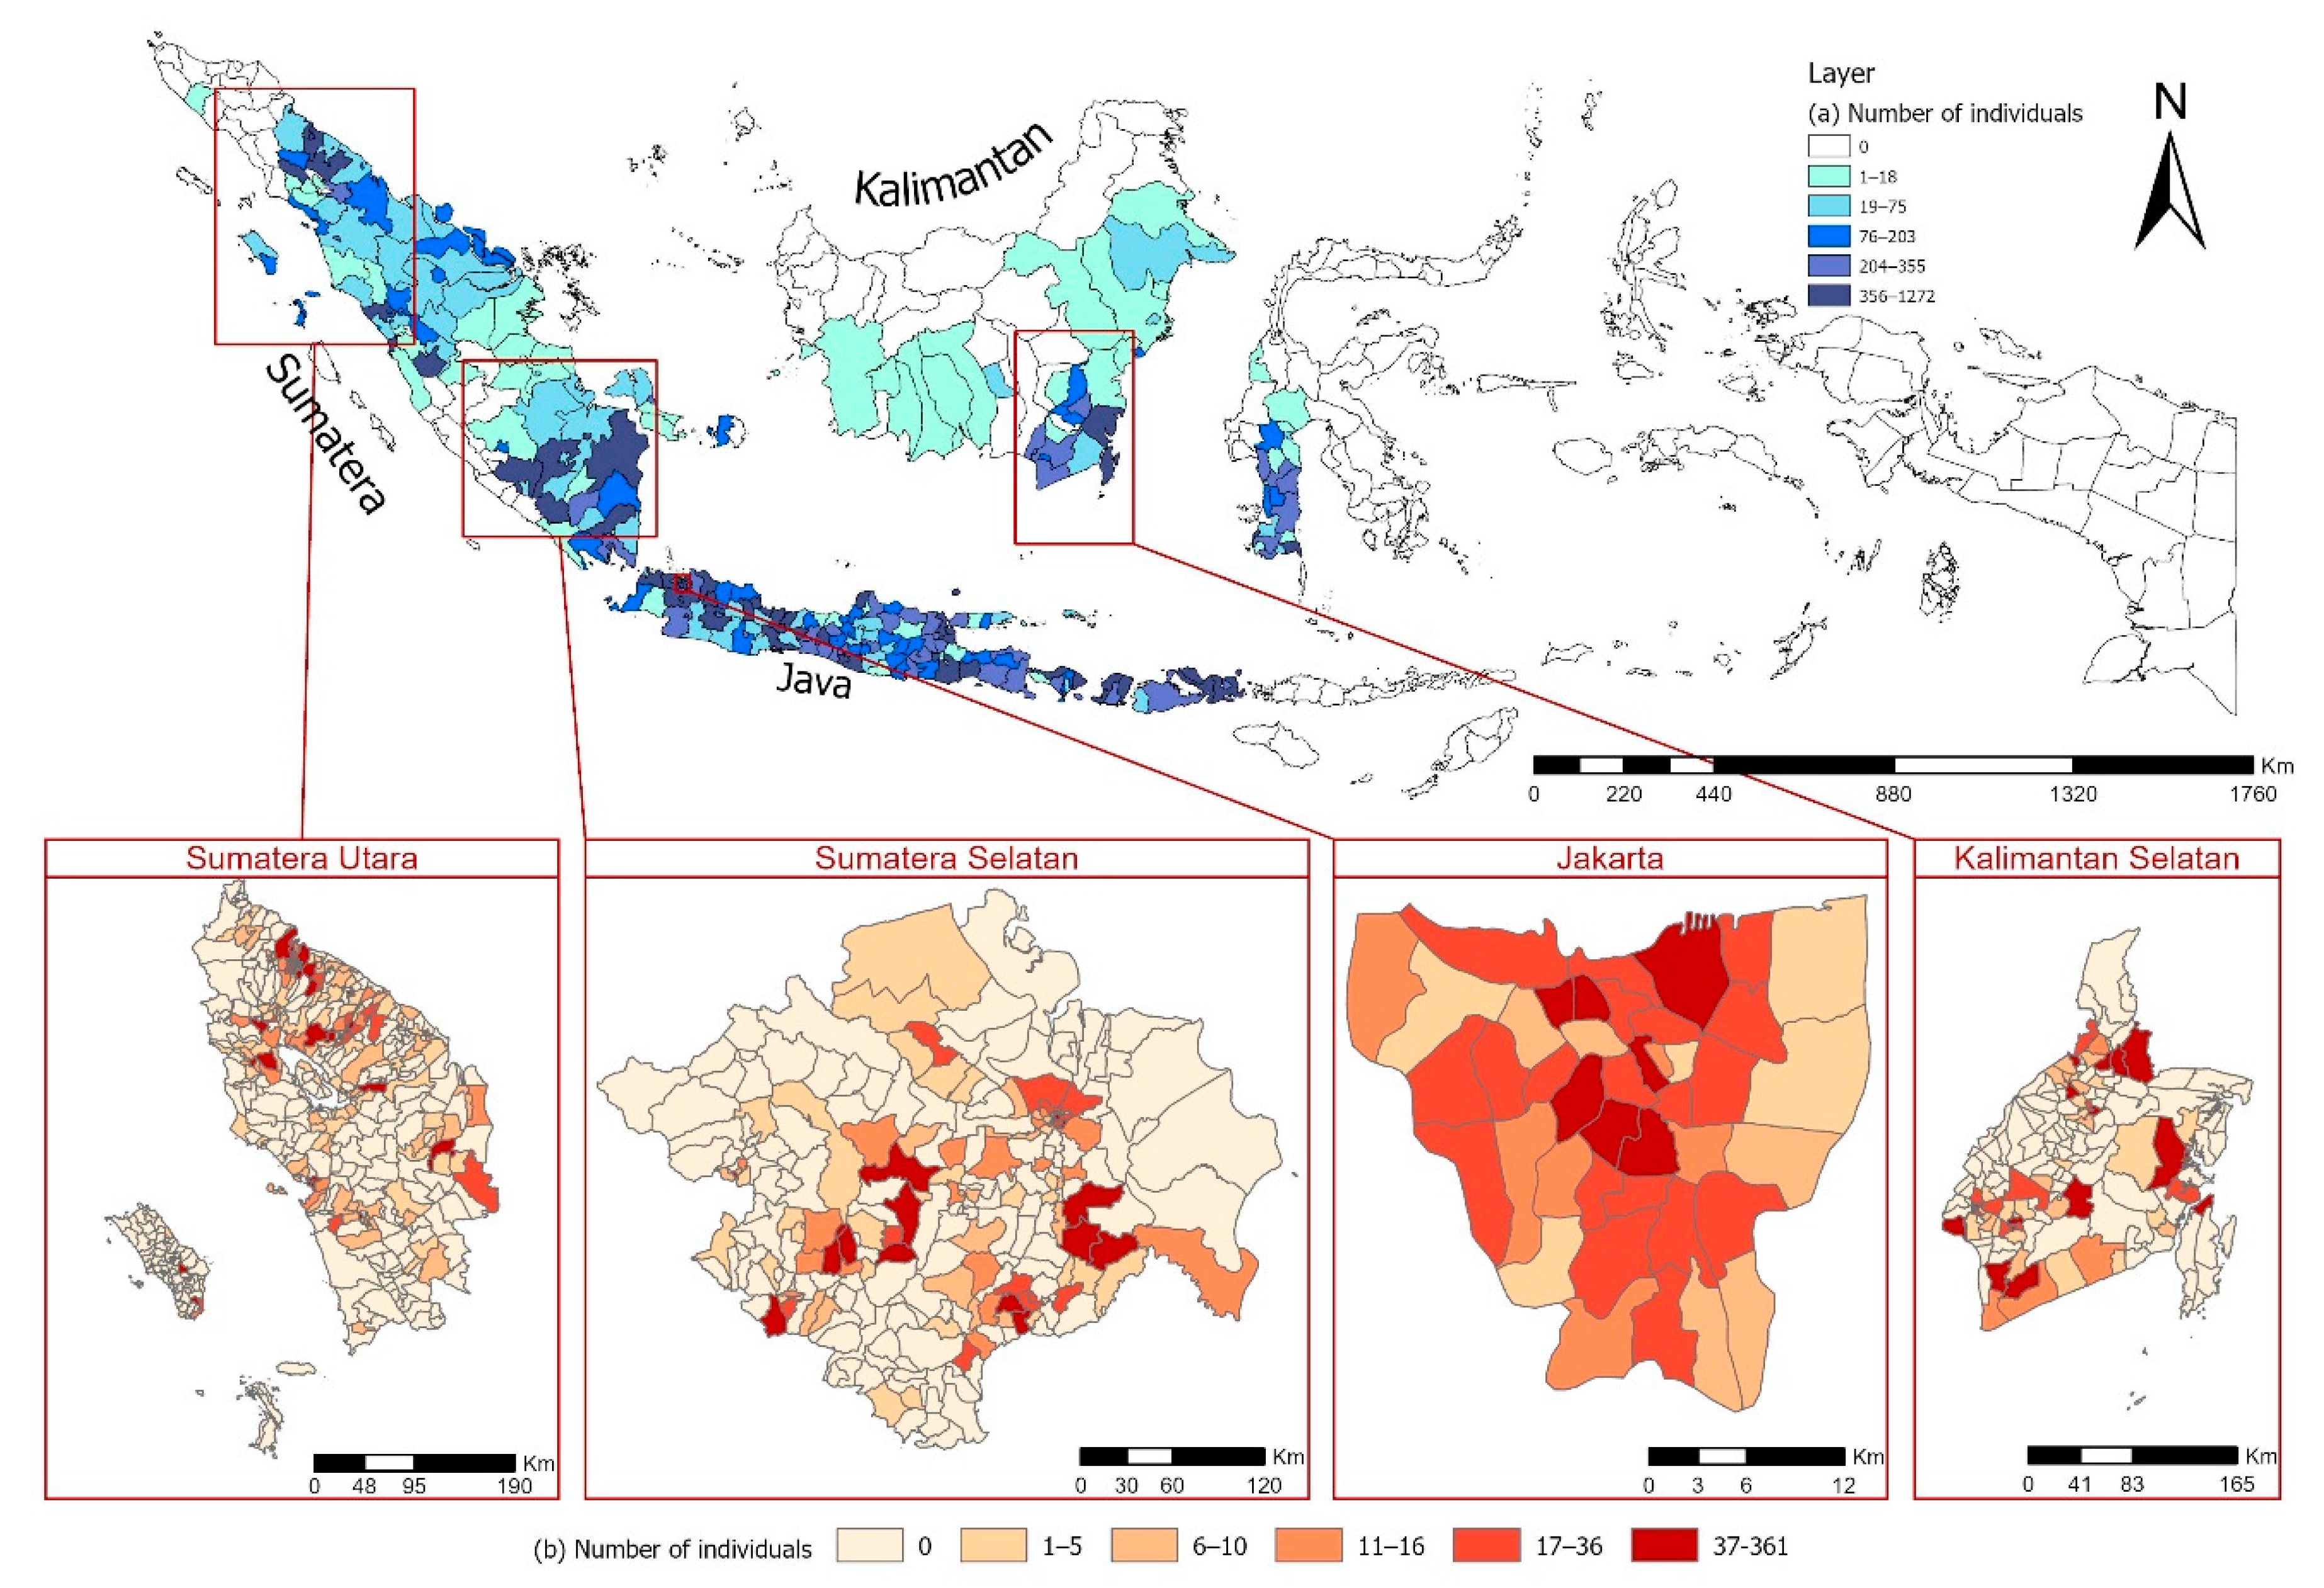
| Sumatera Utara (29 districts) | 4593 (7.88) | 158.4 |
| Sumatera Selatan (16 districts) | 2942 (5.05) | 183.9 |
| Jakarta (5 districts) | 3752 (6.44) | 750.4 |
| Kalimantan Selatan (12 districts) | 2538 (4.35) | 211.5 |
| Others | 44,479 (76.29) |
| Variables | Total IFLS5 | Jakarta | Sumatera Utara | Sumatera Selatan | Kalimantan Selatan |
|---|---|---|---|---|---|
| Children | N = 11,902 | N = 747 | N = 1103 | N = 673 | N = 527 |
| Breathing Difficulty | 10,922 (91.8) | 660 (88.4) | 1018 (92.3) | 617 (91.7) | 475 (90.1) |
| * Wheezing | 340 (100.0) | 21 (100) | 25 (100) | 18 (100) | 22 (100) |
| * Fast Breathing | 340 (100.0) | 21 (100) | 25 (100) | 18 (100) | 22 (100) |
| Cough | 10,922 (91.8) | 660 (88.4) | 1018 (92.3) | 617 (91.7) | 475 (90.1) |
| Hospitalization | 10,921 (91.8) | 660 (88.4) | 1018 (92.3) | 617 (91.7) | 475 (90.1) |
| Outpatient Visit | 10,622 (89.3) | 660 (88.4) | 1018 (92.3) | 617 (91.7) | 475 (90.1) |
| Peak Expiratory Flow | 7934 (66.7) | 222 (29.7) | 7 (0.63) | 16 (2.38) | 527 (100.00) |
| Adolescent | N = 13,895 | N = 889 | N = 1167 | N = 710 | N = 637 |
| Breathing Difficulty | 12,061 (86.9) | 753 (84.8) | 1010 (86.6) | 598 (84.3) | 557 (87.5) |
| * Wheezing | 643 (100.0) | 56 (100.0) | 52 (100.0) | 37 (100.0) | 25 (100.0) |
| * Fast Breathing | 643 (100.0) | 56 (100.0) | 52 (100.0) | 37 (100.0) | 25 (100.0) |
| Cough | 12,061 (86.9) | 753 (84.8) | 1010 (86.6) | 598 (84.3) | 557 (87.5) |
| Hospitalization | 12,059 (86.8) | 752 (84.6) | 1011 (86.7) | 598 (84.3) | 567 (89.1) |
| Outpatient Visit | 12,059 (86.8) | 752 (84.6) | 1011 (86.7) | 598 (84.3) | 557 (87.5) |
| Peak Expiratory Flow | 9561 (68.8) | 260 (29.2) | 10 (0.9) | 16 (2.3) | 635 (99.7) |
| Adult | N = 32,507 | N = 2116 | N = 2323 | N = 1559 | N = 1374 |
| Hypertension | 26,998 (83.1) | 1680 (79.4) | 1983 (85.4) | 1284 (82.4) | 1172 (85.3) |
| Stroke | 26,998 (83.1) | 1680 (79.4) | 1983 (85.4) | 1284 (82.4) | 1172 (85.3) |
| Heart Problem | 26,998 (83.1) | 1680 (79.4) | 1983 (85.4) | 1284 (82.4) | 1172 (85.3) |
| Asthma | 26,998 (83.1) | 1680 (79.4) | 1983 (85.4) | 1284 (82.4) | 1172 (85.3) |
| Breathing Difficulty | 26,987 (83.1) | 1680 (79.4) | 1983 (85.4) | 1283 (82.3) | 1172 (85.3) |
| * Wheezing | 2118 (100.0) | 163 (100.0) | 163 (100.0) | 103 (100.0) | 100 (100.0) |
| * Fast Breathing | 2118 (100.0) | 163 (100.0) | 163 (100.0) | 103 (100.0) | 100 (100.0) |
| Cough | 26,987 (83.0) | 1680 (79.4) | 1983 (85.4) | 1283 (82.3) | 1172 (85.3) |
| Hospitalization | 26,972 (83.0) | 1679 (79.3) | 1983 (85.4) | 1283 (82.3) | 1171 (85.2) |
| Outpatient Visit | 26,971 (83.0) | 1677 (79.2) | 1983 (85.4) | 1282 (82.2) | 1171 (85.2) |
| Blood Pressure | 25,699 (79.1) | 1559 (73.7) | 1864 (80.2) | 1244 (78.5) | 1136 (82.7) |
| HbA1c level | 5521 (17.0) | 245 (11.6) | 268 (11.5) | 256 (16.4) | 256 (18.6) |
| Peak Expiratory Flow | 22,917 (70.5) | 594 (28.1) | 23 (1.0) | 40 (2.6) | 635 (46.2) |
| Self-Reporting Variables | Total IFLS5 | Jakarta | Sumatera Utara | Sumatera Selatan | Kalimantan Selatan |
|---|---|---|---|---|---|
| Children | N = 11,902 | N = 747 | N = 1103 | N = 673 | N = 527 |
| Breathing Difficulty | 340 (3.2) | 21 (3.2) | 25 (2.5) | 18 (3.0) | 22 (4.7) |
| * Wheezing | 217 (63.9) | 10 (47.7) | 14 (56.0) | 11 (61.2) | 15 (68.2) |
| * Fast Breathing | 249 (73.3) | 15 (71.5) | 19 (76.0) | 13 (72.3) | 17 (77.3) |
| Cough | 5595 (51.3) | 382 (57.9) | 514 (50.5) | 313 (50.8) | 232 (48.9) |
| Hospitalization | 525 (4.9) | 31 (4.7) | 37 (3.7) | 25 (4.1) | 13 (2.8) |
| Outpatient Visit | 2557 (24.1) | 178 (27.0) | 241 (23.7) | 129 (21.0) | 69 (14.6) |
| Adolescent | N = 13,895 | N = 889 | N = 1167 | N = 710 | N = 637 |
| Breathing Difficulty | 643 (5.4) | 56 (7.5) | 52 (5.2) | 37 (6.2) | 25 (4.5) |
| * Wheezing | 195 (30.4) | 14 (25.0) | 13 (25.0) | 8 (21.7) | 10 (40.0) |
| * Fast Breathing | 583 (83.7) | 42 (75.0) | 40 (77.0) | 31 (83.8) | 24 (96.0) |
| Cough | 4828 (40.1) | 321 (42.7) | 419 (41.5) | 215 (36.0) | 208 (37.4) |
| Hospitalization | 455 (3.8) | 33 (4.4) | 28 (2.8) | 21 (3.6) | 15 (2.7) |
| Outpatient Visit | 1579 (13.1) | 91 (12.2) | 133 (13.2) | 75 (12.6) | 40 (7.2) |
| Adult | N = 32,507 | N = 2116 | N = 2323 | N = 1559 | N = 1374 |
| Hypertension | 3989 (14.8) | 298 (17.8) | 283 (14.3) | 194 (15.2) | 231 (19.8) |
| Stroke | 307 (1.2) | 25 (1.5) | 20 (1.1) | 13 (1.1) | 18 (1.6) |
| Heart Problem | 523 (2.0) | 50 (3.0) | 46 (2.4) | 16 (1.3) | 14 (1.2) |
| Asthma | 761 (2.9) | 69 (4.2) | 41 (2.1) | 42 (3.3) | 50 (4.3) |
| Breathing Difficulty | 2118 (7.9) | 163 (9.8) | 163 (8.3) | 103 (8.1) | 100 (8.6) |
| * Wheezing | 749 (35.4) | 34 (20.9) | 57 (35.0) | 34 (33.1) | 44 (44.0) |
| * Fast Breathing | 1663 (78.6) | 113 (69.4) | 115 (70.6) | 76 (73.8) | 72 (72.0) |
| Cough | 10,607 (39.4) | 729 (43.4) | 878 (44.3) | 481 (37.5) | 527 (45.0) |
| Hospitalization | 1325 (5.0) | 75 (4.5) | 109 (5.5) | 53 (4.2) | 46 (4.0) |
| Outpatient Visit | 5154 (19.2) | 307 (18.4) | 392 (19.8) | 220 (17.2) | 181 (15.5) |
| Measurement variables—Blood Pressure | N = 25,699 | N = 1559 | N = 1864 | N = 1244 | N = 1136 |
| Hypertension Systolic | 6453 (25.11) | 402 (25.79) | 414 (22.21) | 291 (23.29) | 350 (30.81) |
| Hypertension Diastolic | 4615(17.96) | 307 (19.69) | 319 (17.11) | 197 (15.84) | 277 (24.38) |
| Measurement variable—Blood HbA1c level | N = 5521 | N = 245 | N = 268 | N = 256 | N = 256 |
| Diabetes Mellitus | 544 (9.85) | 37 (15.10) | 25 (9.33) | 18 (7.03) | 26 (11.16) |
| Between Two Self-Reported Data | |||
|---|---|---|---|
| Question 1 | Question 2 | Wave 5 | |
| Agreement (%) | n Total | ||
| Hypertension | |||
| Are you now taking the following treatment to treat hypertension and its complication? | Have a doctor/paramedic/nurse/midwife ever told you that you had hypertension? | 89.66 (89.32–89.99) | 32,126 |
| Diabetes Mellitus (DM) | |||
| Are you taking medicine for diabetes? | Have a doctor/paramedic/nurse/midwife ever told you that you had diabetes or high blood sugar? | 98.57 (98.44–98.7) | 32,124 |
| Asthma | |||
| Did you ever experience wheezing in the last 4 weeks? | Have a doctor/paramedic/nurse/midwife ever told you that you had asthma? | 70.32 (68.45–72.13) | 2379 |
| Cholesterol | |||
| Are you taking medicine for cholesterol? | Have a doctor/paramedic/nurse/midwife ever told you that you had high cholesterol | 96.22 (96.01–96.43) | 32,122 |
| Between Self-Reported and Objective Measurements | |||
|---|---|---|---|
| Question | Objective Measurements | Wave 5 | |
| Agreement (%) | n Total | ||
| Hypertension | |||
| Are you taking medicine for High Blood Pressure? | Systolic blood pressure ≥ 140 mmHg | 42.37 (41.82–42.91) | 31,675 |
| Are you taking medicine for High Blood Pressure? | Diastolic blood pressure ≥ 90 mmHg | 61.16 (60.62–61.69) | 31,651 |
| Have a doctor/paramedic/nurse/midwife ever told you that you had hypertension? | Systolic blood pressure | 52.37 (51.79–52.95) | 28,212 |
| Have a doctor/paramedic/nurse/midwife ever told you that you had hypertension? | Diastolic blood pressure | 64.55 (64.03–65.08) | 31,646 |
| Diabetes Mellitus | |||
| Have a doctor/paramedic/nurse/midwife ever told you that you had diabetes | DBS;HbA1c > 6.5 | 69.98 (68.82–71.72) | 6120 |
| Alpha | ||
|---|---|---|
| Power | 0.05 | 0.1 |
| (1–ß) | n | n |
| 0.6 | 5075 | 3318 |
| 0.65 | 5804 | 3912 |
| 0.70 | 6626 | 4592 |
| 0.75 | 7574 | 5386 |
| 0.80 | 8703 | 6345 |
| 0.85 | 10,119 | 7562 |
| 0.90 | 12,052 | 9244 |
| Age Category | Variable | Level a | Total IFLS |
|---|---|---|---|
| Children (0–9.9 years) N = 11,901 | Height | I | 10,497 (88.2%) |
| Weight | I | 10,579 (88.9%) | |
| Ethnicity | I | 11,886 (99.9%) | |
| Ever attend school b | I | 5293 (91.2%) | |
| Highest level of education c | I | 3784 (99.9%) | |
| Type of food eaten d | I | 10,404 (87.4%) | |
| Frequency food type eaten d | I | 10,374 (87.2%) | |
| Income (previous year) | HH | 11,552 (97.1%) | |
| Weekly expenditure on tobacco | HH | 11,425 (96.0%) | |
| Weekly expenditure on alcohol | HH | 11,483 (96.5%) | |
| Type of cooking stove | HH | 11,525 (96.8%) | |
| Adolescents (10–24.9 years) N = 13,895 | Height | I | 11,693 (84.2%) |
| Weight | I | 11,680 (84.1%) | |
| Ethnicity | I | 13,883 (99.9%) | |
| Marital status | I | 13,892 (99.9%) | |
| Ever attend school | I | 12,097 (87.1%) | |
| Type of food eaten d | I | 11,722 (84.4%) | |
| Frequency food type eaten d | I | 11,719 (84.3%) | |
| Ever smoker e | I | 7256 (52.2%) | |
| Current smoker e | I | 7256 (52.2%) | |
| Age start smoking f | I | 1793 (98.6%) | |
| Tobacco consumption f,h | I | 1801 (99.0%) | |
| Duration of current employment i | I | 3598 (99.9%) | |
| Normal hours worked per week i | I | 3559 (98.8%) | |
| Total weeks worked per year i | I | 3568 (99.0%) | |
| Income (previous year) | HH | 13,007 (93.6%) | |
| Weekly expenditure on tobacco | HH | 13,196 (95.0%) | |
| Weekly expenditure on alcohol | HH | 13,268 (95.5%) | |
| Type of cooking stove | HH | 13,320 (95.9%) | |
| Adults (≥25 years) N = 32,477 | Height | I | 25,661 (79.0%) |
| Weight | I | 25,644 (79.0%) | |
| Ethnicity | I | 32,444 (99.9%) | |
| Ever attend school | I | 27,132 (83.5%) | |
| Highest level of education c | I | 25,425 (99.9%) | |
| Type of food eaten d | I | 24,504 (75.5%) | |
| Frequency food type eaten d | I | 24,502 (75.4%) | |
| Ever smoker | I | 27,009 (83.2%) | |
| Current smoker | I | 27,009 (83.2%) | |
| Age start smoking f | I | 10,136 (94.1%) | |
| Age stop smoking g | I | 1507 (97.6%) | |
| Tobacco consumption f,h | I | 10,681 (99.2%) | |
| Primary occupation i | I | 20,869 (99.9%) | |
| Duration of current employment i | I | 20,782 (99.5%) | |
| Normal hours worked per week i | I | 20,675 (99.0%) | |
| Total weeks worked per year i | I | 20,690 (99.1%) | |
| Income (previous year) | HH | 31,330 (96.5%) | |
| Weekly expenditure on tobacco | HH | 30,551 (94.1%) | |
| Weekly expenditure on alcohol | HH | 30,726 (94.6%) | |
| Type of cooking stove | HH | 30,866 (95.0%) | |
| Total number of individuals | 58,304 | ||
Publisher’s Note: MDPI stays neutral with regard to jurisdictional claims in published maps and institutional affiliations. |
© 2020 by the authors. Licensee MDPI, Basel, Switzerland. This article is an open access article distributed under the terms and conditions of the Creative Commons Attribution (CC BY) license (http://creativecommons.org/licenses/by/4.0/).
Share and Cite
Agustian, D.; Rachmi, C.N.; Indraswari, N.; Molter, A.; Carder, M.; Rinawan, F.R.; van Tongeren, M.; Driejana, D. Feasibility of Indonesia Family Life Survey Wave 5 (IFLS5) Data for Air Pollution Exposure–Response Study in Indonesia. Int. J. Environ. Res. Public Health 2020, 17, 9508. https://0-doi-org.brum.beds.ac.uk/10.3390/ijerph17249508
Agustian D, Rachmi CN, Indraswari N, Molter A, Carder M, Rinawan FR, van Tongeren M, Driejana D. Feasibility of Indonesia Family Life Survey Wave 5 (IFLS5) Data for Air Pollution Exposure–Response Study in Indonesia. International Journal of Environmental Research and Public Health. 2020; 17(24):9508. https://0-doi-org.brum.beds.ac.uk/10.3390/ijerph17249508
Chicago/Turabian StyleAgustian, Dwi, Cut Novianti Rachmi, Noormarina Indraswari, Anna Molter, Melanie Carder, Fedri Ruluwedrata Rinawan, Martie van Tongeren, and Driejana Driejana. 2020. "Feasibility of Indonesia Family Life Survey Wave 5 (IFLS5) Data for Air Pollution Exposure–Response Study in Indonesia" International Journal of Environmental Research and Public Health 17, no. 24: 9508. https://0-doi-org.brum.beds.ac.uk/10.3390/ijerph17249508