Systematic Review on International Salt Reduction Policy in Restaurants

 ,
,
Abstract
:1. Introduction
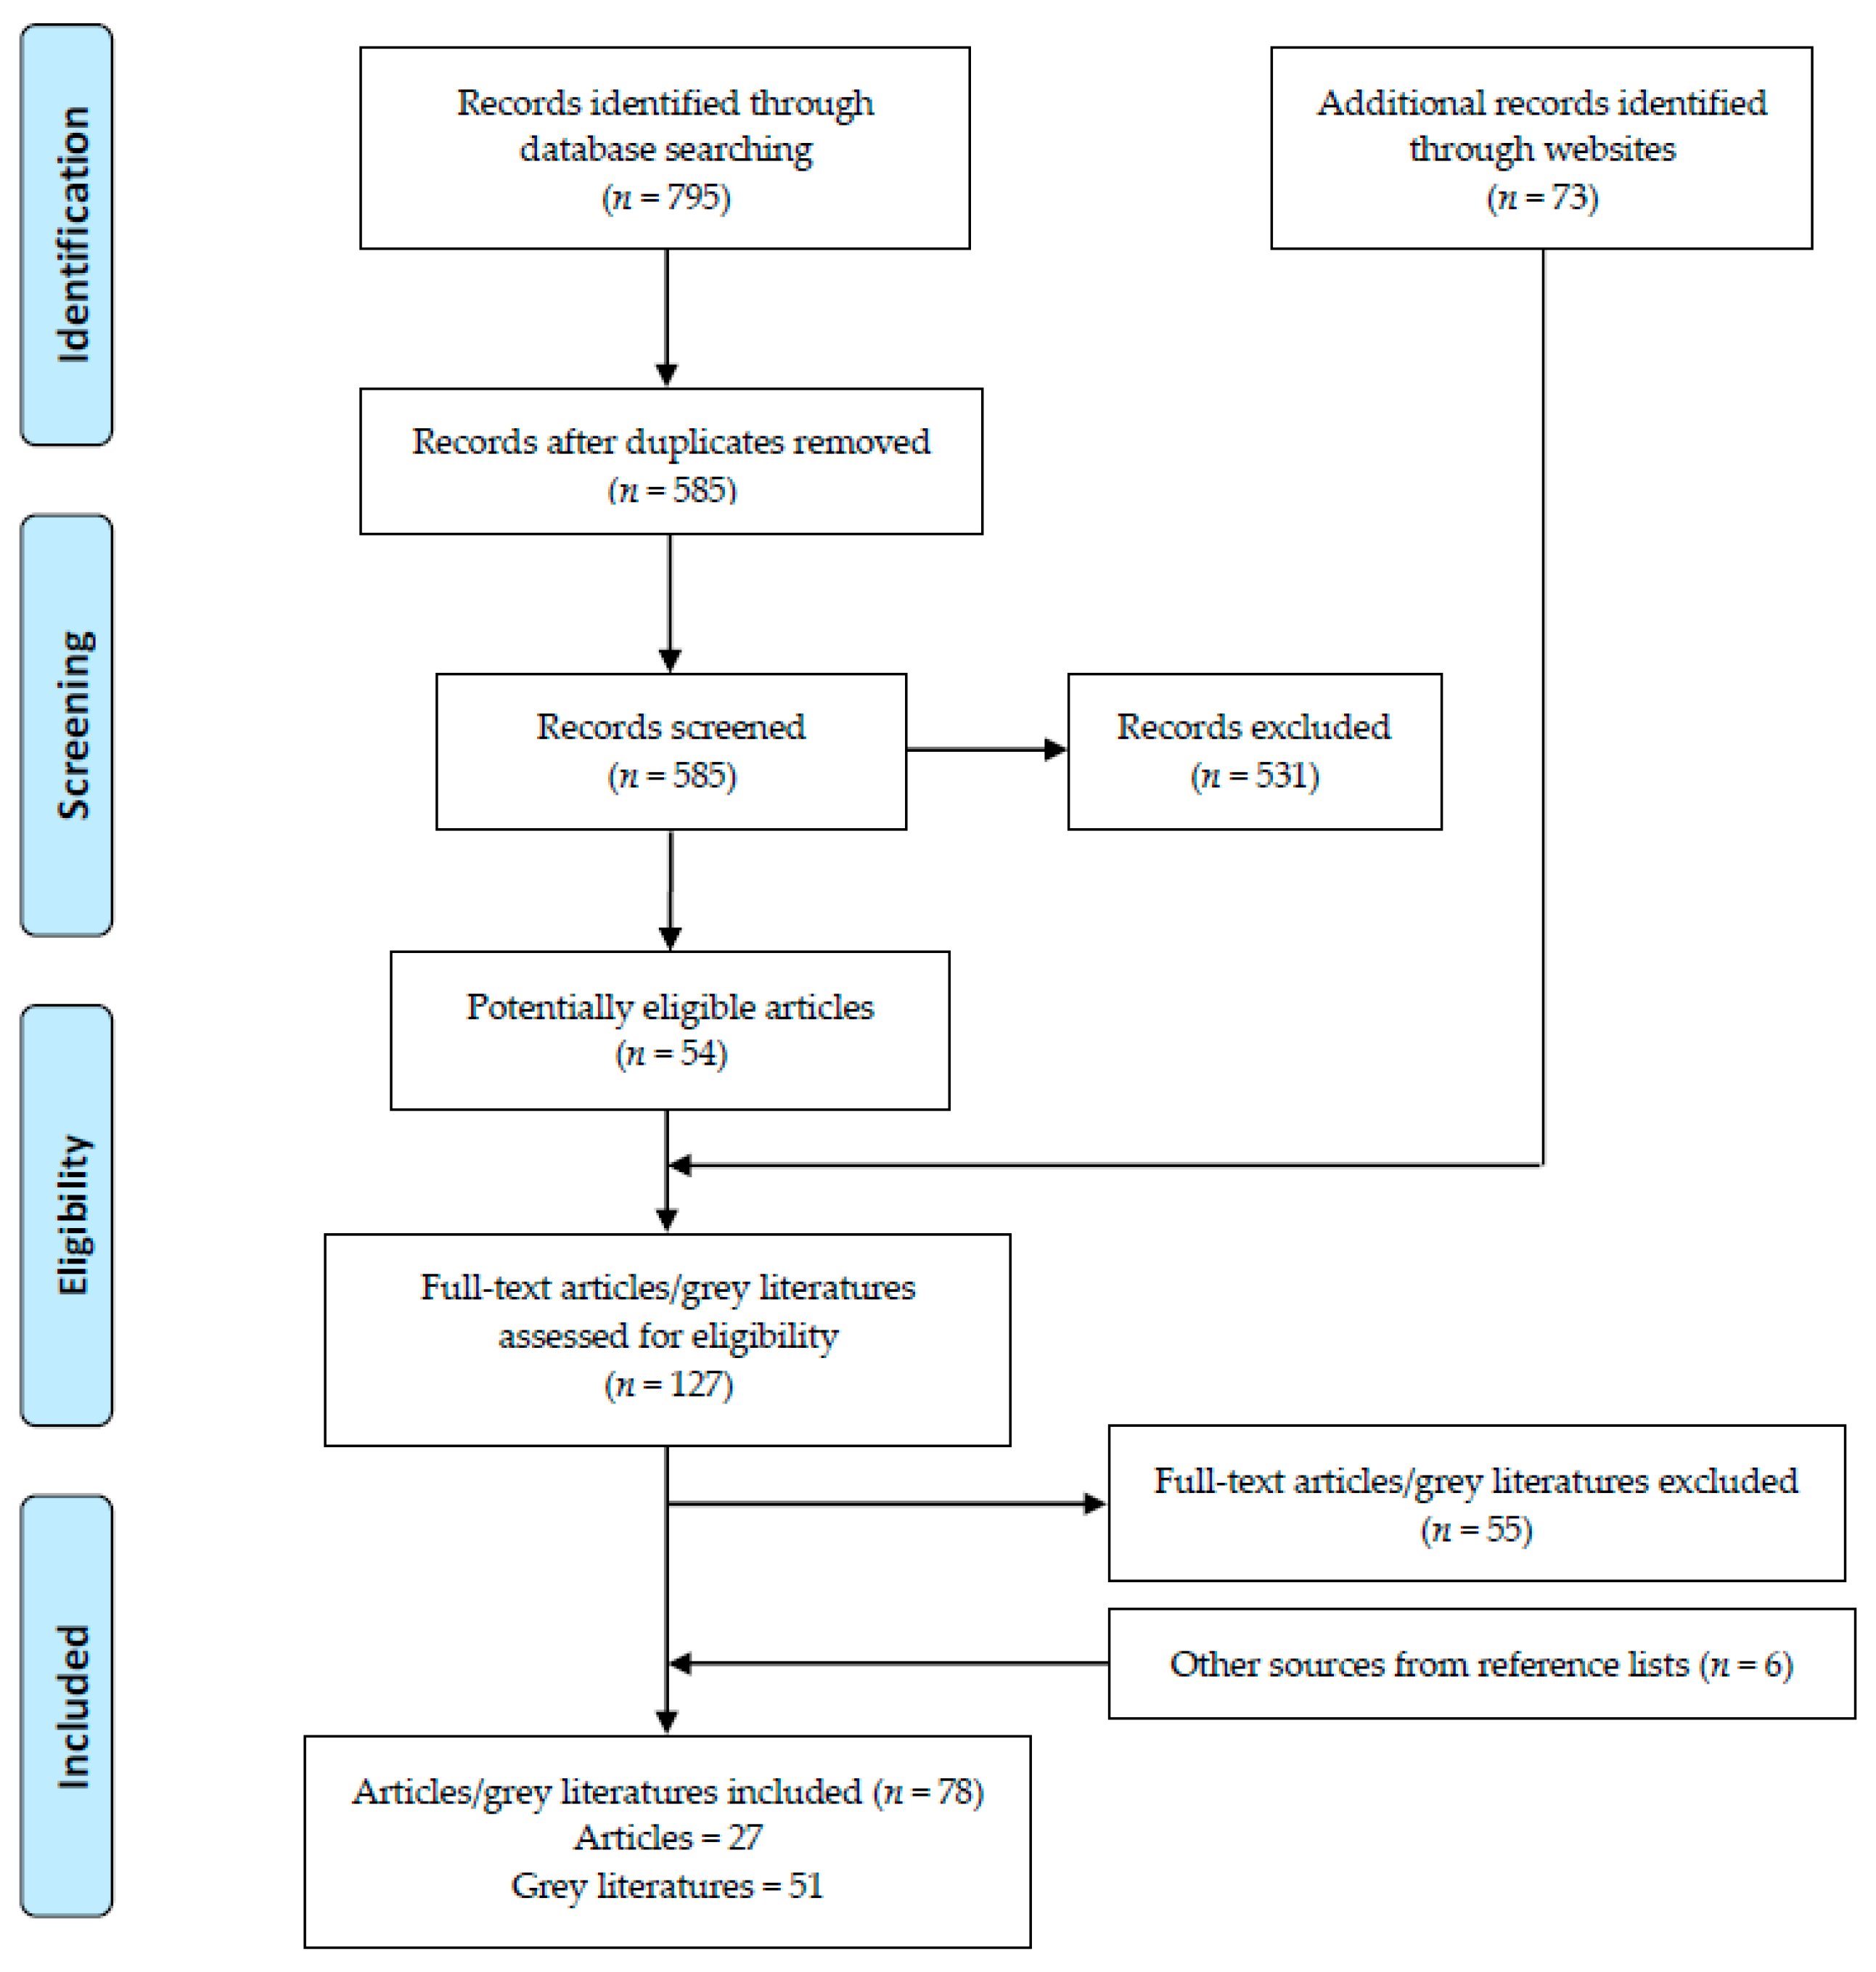
2. Methods
2.1. Search Strategy
2.2. Inclusion and Exclusion Criteria
2.3. Data Extraction
3. Results
3.1. Menu Labeling
3.2. Target Setting and Reformulation
3.3. Other Strategies
3.4. Effectiveness of Policies
4. Discussion
4.1. Buyer-Driven Policies
4.2. Seller-Driven Policies
4.3. Applicability of Policies
4.4. Evaluation of Policies
4.5. Strength and Limitations
5. Conclusions
Author Contributions
Funding
Acknowledgments
Conflicts of Interest
References
- Strazzullo, P.; D’Elia, L.; Kandala, N.B.; Cappuccio, F.P. Salt intake, stroke, and cardiovascular disease: Meta-analysis of prospective studies. BMJ 2009, 339, b4567. [Google Scholar] [CrossRef] [PubMed] [Green Version]
- Aburto, N.J.; Ziolkovska, A.; Hooper, L.; Elliott, P.; Cappuccio, F.P.; Meerpohl, J.J. Effect of lower sodium intake on health: Systematic review and meta-analyses. BMJ 2013, 346, f1326. [Google Scholar] [CrossRef] [Green Version]
- Schorling, E.; Niebuhr, D.; Kroke, A. Cost-effectiveness of salt reduction to prevent hypertension and CVD: A systematic review. Public Health Nutr. 2017, 20, 1993–2003. [Google Scholar] [CrossRef] [PubMed] [Green Version]
- Lee, C.; Kim, D.-I.; Hong, J.; Koh, E.; Kang, B.-W.; Kim, J.W.; Park, H.-K.; Kim, C.-I. Cost-benefit analysis of sodium intake reduction policy in Korea. Korean J. Community Nutr. 2012, 17, 341–352. [Google Scholar] [CrossRef]
- World Health Organization. A Comprehensive Global Monitoring Framework Including Indicators and A Set of Voluntary Global Targets for the Prevention and Control of Non-Communicable Diseases. Available online: https://www.who.int/nmh/events/2012/discussion_paper2_20120322.pdf (accessed on 25 March 2020).
- State Council. “Healthy China in 2030” Program Outline. Available online: http://www.gov.cn/zhengce/2016-10/25/content_5124174.htm (accessed on 14 December 2020).
- Havas, S.; Dickinson, B.D.; Wilson, M. The urgent need to reduce sodium consumption. JAMA 2007, 298, 1439–1441. [Google Scholar] [CrossRef]
- Food Standards Agency. New Salt Reduction Targets Published. Available online: http://webarchive.nationalarchives.gov.uk/20120206100416/http://food.gov.uk/news/newsarchive/2006/mar/salttargets (accessed on 18 November 2020).
- Office of Foods and Veterinary Medicine, Center for Food Safety and Applied Nutrition. Draft Guidance for Industry: Target Mean and Upper Bound Concentrations for Sodium in Commercially Processed, Packaged, and Prepared Foods for Voluntary Sodium Reduction Goals. Available online: https://www.fda.gov/Food/GuidanceRegulation/GuidanceDocumentsRegulatoryInformation/ucm494732.htm (accessed on 31 January 2020).
- US Department of Agriculture, Economic Research Service. Food Expenditure Series. Available online: https://www.ers.usda.gov/data-products/food-expenditure-series/ (accessed on 2 February 2020).
- Department for Environment Food & Rural Affairs. Food Statistics in Your Pocket 2017: Food Chain. Available online: https://www.gov.uk/government/publications/food-statistics-pocketbook-2017/food-statistics-in-your-pocket-2017-food-chain#uk-consumer-expenditure-on-food-drink-and-catering (accessed on 4 February 2020).
- Wiggers, D.; Vanderlee, L.; White, C.; Reid, J.; Minaker, L.; Hammond, D. Food sources among young people in five major Canadian cities. Can. J. Public Health 2018, 109, 506–515. [Google Scholar] [CrossRef] [PubMed]
- Chang, J.; Wang, Y. Nutrition and Health Monitoring of Chinese Residents in 2010–2012; Peking University Medical Press: Beijing, China, 2016. [Google Scholar]
- Statista Research Department. India: How Often Do You Eat Fast Food (Any Quick Service Restaurant) in Any Given Week (on Average)? Available online: https://0-www-statista-com.brum.beds.ac.uk/statistics/561263/india-average-fast-food-consumption-per-week/ (accessed on 5 February 2020).
- Quader, Z.S.; Zhao, L.X.; Gillespie, C.; Cogswell, M.E.; Terry, A.L.; Moshfegh, A.; Rhodes, D. Sodium intake among persons aged ≥2 Years—United States, 2013–2014. Morb. Mortal. Wkly. Rep. 2017, 66, 324–328. [Google Scholar] [CrossRef] [Green Version]
- World Health Organization. GLOBAL HEALTH RISKS Mortality and Burden of Disease Attributable to Selected Major Risks. Available online: https://www.who.int/healthinfo/global_burden_disease/GlobalHealthRisks_report_full.pdf (accessed on 5 February 2020).
- He, F.J.; MacGregor, G.A. A comprehensive review on salt and health and current experience of worldwide salt reduction programmes. J. Hum. Hypertens. 2009, 23, 363–384. [Google Scholar] [CrossRef]
- Webster, J.; Trieu, K.; Dunford, E.; Hawkes, C. Target salt 2025: A global overview of national programs to encourage the food industry to reduce salt in foods. Nutrients 2014, 6, 3274–3287. [Google Scholar] [CrossRef] [Green Version]
- Afshin, A.; Penalvo, J.; Del Gobbo, L.; Kashaf, M.; Micha, R.; Morrish, K.; Pearson-Stuttard, J.; Rehm, C.; Shangguan, S.; Smith, J.D.; et al. CVD prevention through policy: A review of mass media, food/menu labeling, taxation/subsidies, built environment, school procurement, worksite wellness, and marketing standards to improve diet. Curr. Cardiol. Rep. 2015, 17, 98. [Google Scholar] [CrossRef] [Green Version]
- Henney, J.E.; Taylor, C.L.; Boon, C.S. National salt reduction initiative coordinated by the New York city health department. In Strategies to Reduce Sodium Intake in the United States; The National Academies Press: Washington, DC, USA, 2010; pp. 443–451. [Google Scholar]
- Action on Salt. Consensus Action on Salt and Health. Available online: http://www.actiononsalt.org.uk/ (accessed on 9 February 2020).
- World Action On Salt and Health. Available online: http://www.worldactiononsalt.com/ (accessed on 9 February 2020).
- Moher, D.; Liberati, A.; Tetzlaff, J.; Altman, D.G.; Group, P. Preferred reporting items for systematic reviews and meta-analyses: The PRISMA statement. Ann. Intern. Med. 2009, 151, 264–269. [Google Scholar] [CrossRef] [PubMed] [Green Version]
- Goodman, S.; Vanderlee, L.; White, C.M.; Hammond, D. A quasi-experimental study of a mandatory calorie-labelling policy in restaurants: Impact on use of nutrition information among youth and young adults in Canada. Prev. Med. 2018, 116, 166–172. [Google Scholar] [CrossRef] [Green Version]
- Fitzpatrick, L.; Arcand, J.; L’Abbe, M.; Deng, M.Y.; Duhaney, T.; Campbell, N. Accuracy of Canadian food labels for sodium content of food. Nutrients 2014, 6, 3326–3335. [Google Scholar] [CrossRef] [PubMed]
- Wu, H.W.; Sturm, R. Changes in the energy and sodium content of main entrees in US chain restaurants from 2010 to 2011. J. Acad. Nutr. Diet. 2014, 114, 209–219. [Google Scholar] [CrossRef] [PubMed]
- Auchincloss, A.H.; Mallya, G.G.; Leonberg, B.L.; Ricchezza, A.; Glanz, K.; Schwarz, D.F. Customer responses to mandatory menu labeling at full-service restaurants. Am. J. Prev. Med. 2013, 45, 710–719. [Google Scholar] [CrossRef] [PubMed]
- Jones, A.; Magnusson, R.; Swinburn, B.; Webster, J.; Wood, A.; Sacks, G.; Neal, B. Designing a healthy food partnership: Lessons from the australian food and health dialogue. BMC Public Health 2016, 16, 651. [Google Scholar] [CrossRef] [Green Version]
- Bruemmer, B.; Krieger, J.; Saelens, B.E.; Chan, N. Energy, saturated fat, and sodium were lower in entrees at chain restaurants at 18 months compared with 6 months following the implementation of mandatory menu labeling regulation in King County, Washington. J. Acad. Nutr. Diet. 2012, 112, 1169–1176. [Google Scholar] [CrossRef]
- Ma, G.X.; Shive, S.E.; Zhang, G.; Aquilante, J.; Tan, Y.; Pharis, M.; Bettigole, C.; Lawman, H.; Wagner, A.; Zhu, L.; et al. Evaluation of a healthy Chinese take-out sodium-reduction initiative in philadelphia low-income communities and neighborhoods. Public Health Rep. 2018, 133, 472–480. [Google Scholar] [CrossRef]
- Pulos, E.; Leng, K. Evaluation of a voluntary menu-labeling program in full-service restaurants. Am. J. Public Health 2010, 100, 1035–1039. [Google Scholar] [CrossRef]
- Choi, S.E.; Brandeau, M.L.; Basu, S. Expansion of the national salt reduction initiative: A mathematical model of benefits and risks of population-level sodium reduction. Med. Decis. Mak. 2016, 36, 72–85. [Google Scholar] [CrossRef] [Green Version]
- Namba, A.; Auchincloss, A.; Leonberg, B.L.; Wootan, M.G. Exploratory analysis of fast-food chain restaurant menus before and after implementation of local calorie-labeling policies, 2005–2011. Prev. Chronic Dis. 2013, 10, 8. [Google Scholar] [CrossRef] [PubMed] [Green Version]
- Britt, J.W.; Frandsen, K.; Leng, K.; Evans, D.; Pulos, E. Feasibility of voluntary menu labeling among locally owned restaurants. Health Promot. Pract. 2011, 12, 18–24. [Google Scholar] [CrossRef] [PubMed]
- Levings, J.L.; Gunn, J.P. From menu to mouth: Opportunities for sodium reduction in restaurants. Prev. Chronic Dis. 2014, 11, 130237. [Google Scholar] [CrossRef] [PubMed] [Green Version]
- Knai, C.; Petticrew, M.; Durand, M.A.; Eastmure, E.; James, L.; Mehrotra, A.; Scott, C.; Mays, N. Has a public–private partnership resulted in action on healthier diets in England? An analysis of the Public Health Responsibility Deal food pledges. Food Policy 2015, 54, 1–10. [Google Scholar] [CrossRef]
- Otten, J.J.; Saelens, B.E.; Kapphahn, K.I.; Hekler, E.B.; Buman, M.P.; Goldstein, B.A.; Krukowski, R.A.; O’Donohue, L.S.; Gardner, C.D.; King, A.C. Impact of San Francisco’s toy ordinance on restaurants and children’s food purchases, 2011–2012. Prev. Chronic Dis. 2014, 11, E122. [Google Scholar] [CrossRef]
- Auchincloss, A.H.; Leonberg, B.L.; Glanz, K.; Bellitz, S.; Ricchezza, A.; Jervis, A. Nutritional value of meals at full-service restaurant chains. J. Nutr. Educ. Behav. 2014, 46, 75–81. [Google Scholar] [CrossRef]
- Wyness, L.A.; Butriss, J.L.; Stanner, S.A. Reducing the population’s sodium intake: The UK Food Standards Agency’s salt reduction programme. Public Health Nutr. 2012, 15, 254–261. [Google Scholar] [CrossRef] [Green Version]
- He, F.J.; Brinsden, H.C.; MacGregor, G.A. Salt reduction in the United Kingdom: A successful experiment in public health. J. Hum. Hypertens. 2014, 28, 345–352. [Google Scholar] [CrossRef]
- Ahuja, J.K.; Pehrsson, P.R.; Haytowitz, D.B.; Wasswa-Kintu, S.; Nickle, M.; Showell, B.; Thomas, R.; Roseland, J.; Williams, J.; Khan, M.; et al. Sodium monitoring in commercially processed and restaurant foods. Am. J. Clin. Nutr. 2015, 101, 622–631. [Google Scholar] [CrossRef] [Green Version]
- Holden, J.M.; Pehrsson, P.R.; Nickle, M.; Haytowitz, D.B.; Exler, J.; Showell, B.; Williams, J.; Thomas, R.G.; Ahuja, J.K.C.; Patterson, K.Y.; et al. USDA monitors levels of added sodium in commercial packaged and restaurant foods. In Proceedings of the 36th National Nutrient Databank Conference, Huston, TX, USA, 25–28 March 2012; Stumbo, P., McNutt, S., Eds.; Elsevier Science BV: Amsterdam, The Netherlands, 2013; Volume 2, pp. 60–67. [Google Scholar]
- Finkelstein, E.A.; Strombotne, K.L.; Chan, N.L.; Krieger, J. Mandatory menu labeling in one fast-food chain in King County, Washington. Am. J. Prev. Med. 2011, 40, 122–127. [Google Scholar] [CrossRef]
- Mozaffarian, D.; Afshin, A.; Benowitz, N.L.; Bittner, V.; Daniels, S.R.; Franch, H.A.; Jacobs, D.R., Jr.; Kraus, W.E.; Kris-Etherton, P.M.; Krummel, D.A.; et al. Population approaches to improve diet, physical activity, and smoking habits: A scientific statement from the American Heart Association. Circulation 2012, 126, 1514–1563. [Google Scholar] [CrossRef] [PubMed]
- McGuire, S. Institute of medicine. 2009. school meals: Building blocks for healthy children. Washington, DC: The National Academies Press. Adv. Nutr 2011, 2, 64–65. [Google Scholar] [CrossRef] [PubMed]
- Ahuja, J.K.; Wasswa-Kintu, S.; Haytowitz, D.B.; Daniel, M.; Thomas, R.; Showell, B.; Nickle, M.; Roseland, J.M.; Gunn, J.; Cogswell, M.; et al. Sodium content of popular commercially processed and restaurant foods in the United States. Prev. Med. Rep. 2015, 2, 962–967. [Google Scholar] [CrossRef] [PubMed] [Green Version]
- Byrd, K.; Almanza, B.; Ghiselli, R.F.; Behnke, C.; Eicher-Miller, H.A. Adding sodium information to casual dining restaurant menus: Beneficial or detrimental for consumers? Appetite 2018, 125, 474–485. [Google Scholar] [CrossRef] [PubMed]
- Nordstrom, J.; Thunstrom, L. The impact of price reductions on individuals’ choice of healthy meals away from home. Appetite 2015, 89, 103–111. [Google Scholar] [CrossRef] [Green Version]
- Scourboutakos, M.J.; L’Abbe, M.R. Changes in sodium levels in chain restaurant foods in Canada (2010–2013): A longitudinal study. CMAJ Open 2014, 2, E343–E351. [Google Scholar] [CrossRef] [Green Version]
- California Legislative Information. SB-1420 Food Facilities: Nutritional Information. Available online: http://leginfo.legislature.ca.gov/faces/billNavClient.xhtml?bill_id=200720080SB1420 (accessed on 29 January 2020).
- Los Angeles Times. Appeals Court OKs New York City Salt-Warning Rule for Some Restaurants. Available online: https://www.latimes.com/nation/nationnow/la-na-new-york-salt-20170210-story.html (accessed on 29 January 2020).
- Kevin, B.O. Appeals Court OKs Salt-shaker Sodium Warnings at Chain Restaurants. Available online: https://www.ama-assn.org/delivering-care/hypertension/appeals-court-oks-salt-shaker-sodium-warnings-chain-restaurants (accessed on 29 January 2020).
- Department of Health EatSmart Restaurant Star+ Campaign. Embrace the Trend of Healthy Eating. Available online: https://restaurant.eatsmart.gov.hk/eng/content.aspx?content_id=4 (accessed on 20 December 2020).
- Pan American Health Organization. DROPPING THE SALT—Practical Steps Countries are Taking to Prevent Chronic Non-communicable Diseases through Population-wide Dietary Salt Reduction. Available online: New.paho.org/hq/dmdocuments/2009/DroppingthesaltEN.pdf (accessed on 31 January 2020).
- Office of Foods and Veterinary Medicine, Center for Food Safety and Applied Nutrition. Guidance for Industry: A Labeling Guide for Restaurants and Retail Establishments Selling Away-From-Home Foods—Part, I. Available online: https://www.fda.gov/regulatory-information/search-fda-guidance-documents/guidance-industry-labeling-guide-restaurants-and-retail-establishments-selling-away-home-foods-part (accessed on 31 January 2020).
- Office of Foods and Veterinary Medicine, Center for Food Safety and Applied Nutrition. Small Entity Compliance Guide: Nutrition Labeling of Standard Menu Items in Restaurants and Similar Retail Food Establishments. Available online: https://www.fda.gov/regulatory-information/search-fda-guidance-documents/small-entity-compliance-guide-nutrition-labeling-standard-menu-items-restaurants-and-similar-retail (accessed on 31 January 2020).
- New York City Health Department. Health Department Announces 5 Year Results of National Salt Reduction Initiative. Available online: https://www1.nyc.gov/site/doh/about/press/pr2016/pr066-16.page (accessed on 20 May 2019).
- New York City Health Department. Health Department Launches New Sodium Warning Label Campaign, “Look Before You Eat”. Available online: https://www1.nyc.gov/site/doh/about/press/pr2016/pr100-16.page (accessed on 20 May 2019).
- Healthy Families BC. Informed Dining. 2012. Available online: https://www.healthyfamiliesBC.ca/home/informed-dining (accessed on 20 May 2019).
- Healthy Families BC. Informed Dining Program Participation Guide. 2012. Available online: https://www.healthyfamiliesbc.ca/sites/hfbcprox-prod.health.gov.bc.ca/files/documents/participation-guide.pdf (accessed on 20 May 2019).
- Healthy Families BC. Informed Dining/Food Service Establishments. 2012. Available online: https://www.healthyfamiliesbc.ca/home/informed-dining-food-service-establishments (accessed on 20 May 2019).
- Directorate-General Health and Consumers, European Commission. Implementation of the EU Salt Reduction Framework. Available online: https://ec.europa.eu/health/sites/health/files/nutrition_physical_activity/docs/salt_report1_en.pdf (accessed on 20 December 2020).
- Center for Science in the Public Interest. International Action on Sodium. Available online: https://cspinet.org/sites/default/files/attachment/CSPI%202016%20International%20Action%20On%20Sodium%20Fact%20Sheet%20Final.pdf (accessed on 31 January 2020).
- World Health Organization. Mapping Salt Reduction Initiatives in the WHO European Region. Available online: http://www.euro.who.int/__data/assets/pdf_file/0009/186462/Mapping-salt-reduction-initiatives-in-the-WHO-European-Region.pdf (accessed on 31 January 2020).
- Department of Public Health, Office of the Mayor. Mayor Kenney Signs Chain Restaurant Sodium Menu Labeling Bill into Law. Available online: https://www.phila.gov/2018-09-14-mayor-kenney-signs-chain-restaurant-sodium-menu-labeling-bill-into-law/ (accessed on 31 January 2020).
- World Health Organization. Meeting of the WHO Action Network on Salt Reduction in the Population in the European Region (ESAN). Available online: http://www.euro.who.int/__data/assets/pdf_file/0009/361989/meeting-report-esan-2017.pdf (accessed on 31 January 2020).
- U.S. Food and Drug Administration. Menu Labeling Rule Key Facts for Industry. Available online: https://www.fda.gov/media/116000/download (accessed on 31 January 2020).
- European Commission. National Salt Initiatives—Implementing the EU Framework for Salt Reduction Initiatives. Available online: https://ec.europa.eu/health/archive/ph_determinants/life_style/nutrition/documents/national_salt_en.pdf (accessed on 31 January 2020).
- King County Board of Health. Nutrition Labeling Requirements for King County Chain Food Establishments. Available online: https://www.kingcounty.gov/depts/health/environmental-health/food-safety/food-business-permit/menu-labeling.aspx (accessed on 31 January 2020).
- Department of Health and Human Services, Food and Drug Administration Draft Guidance for Industry: Questions and Answers Regarding Implementation of the Menu Labeling Provisions of Section 4205 of the Patient Protection and Affordable Care Act of 2010. Available online: https://www.govinfo.gov/content/pkg/FR-2010-08-25/pdf/2010-21065.pdf (accessed on 31 January 2020).
- Susan, J.M. Philadelphia Petitions FDA for Exemption from Menu Labeling. Available online: http://www.fdalawblog.net/2011/10/philadelphia-petitions-fda-for-exemption-from-menu-labeling/ (accessed on 31 January 2020).
- Pan American Health Organization. Policy Statement: Preventing Cardiovascular Disease in the Americas by Reducing Dietary Salt Intake Population-Wide. Available online: https://www.paho.org/hq/dmdocuments/2014/Salt-policy-statement-eng.pdf (accessed on 31 January 2020).
- Pan American Health Organization. Report for the Technical Meeting on Setting Targets and Timelines to Reduce the Salt Content of Food. Available online: https://www.paho.org/hq/dmdocuments/2013/salt-content-mexico-dec-2013-meeting-report.pdf (accessed on 31 January 2020).
- Local Government Association. Restaurant and Pub Chains Urged to Sign up to Salt Reduction Targets to Combat Heart Attack and Stroke. Available online: https://webarchive.nationalarchives.gov.uk/20140807110427tf_/http://www.local.gov.uk/web/guest/media-releases/-/journal_content/56/10180/6389402/NEWS (accessed on 31 January 2020).
- World Health Organization. Review of Salt and Health: Situation in South-East Asia Region. Available online: http://www.searo.who.int/entity/noncommunicable_diseases/events/ncd_twg_bangkok_technical_paper_review_of_salt_and_health.pdf (accessed on 21 May 2019).
- Public Health England. Salt Reduction Targets for 2017. Available online: https://assets.publishing.service.gov.uk/government/uploads/system/uploads/attachment_data/file/604338/Salt_reduction_targets_for_2017.pdf (accessed on 31 January 2020).
- CNN Wire Staff. Salt Shakers Disappear from Buenos Aires Tables. Available online: http://edition.cnn.com/2011/WORLD/americas/06/11/argentina.salt/index.html (accessed on 31 January 2020).
- US Department of Agriculture. Scientific Report of the 2015 Dietary Guidelines Advisory Committee. Available online: https://ods.od.nih.gov/pubs/2015_DGAC_Scientific_Report.pdf (accessed on 31 January 2020).
- Sodium Working Group. Sodium Reduction Strategy for Canada. Available online: https://www.hc-sc.gc.ca/fn-an/alt_formats/pdf/nutrition/sodium/strateg/reduct-strat-eng.pdf (accessed on 31 January 2020).
- CSPI President Dr. Peter, G. Lurie. Philadelphia Menu Sodium Warning Bill Makes Sense, Says CSPI. Available online: https://cspinet.org/news/philadelphia-menu-sodium-warning-bill-makes-sense-says-cspi-20180125 (accessed on 31 January 2020).
- National Association of Country and City Health Officials. STATEMENT OF POLICY Salt Reduction. Available online: https://www.naccho.org/uploads/downloadable-resources/Programs/Community-Health/14-12-Salt-reduction.pdf (accessed on 31 January 2020).
- Million Hearts in Action. The Healthy Chinese Take-Out Initiative. Available online: https://www.heart.org/-/media/files/professional/million-hearts/success-stories/healthy-chinese-takeout-initiative-ucm_479858.pdf (accessed on 31 January 2020).
- New York City Department of Health and Mental Hygiene. National Salt Reduction Initiative. Available online: https://www1.nyc.gov/site/doh/health/health-topics/national-salt-reduction-initiative.page (accessed on 31 January 2020).
- New York City Department of Health and Mental Hygiene. National Salt Reduction Initiative Restaurant Food Categories and Targets. Available online: https://www1.nyc.gov/assets/doh/downloads/pdf/cardio/cardio-salt-nsri-restaurant.pdf (accessed on 31 January 2020).
- Healthy Shasta. Healthy Kids Choice. Available online: https://healthyshasta.org/eat-healthy/healthy-kids-choice/ (accessed on 31 January 2020).
- Colorado Department of Public Health and Environment. Smart Meal™ Seal program. Available online: http://www.centertrt.org/content/docs/Intervention_Documents/Intervention_Templates/Smart_Meal_Seal_Template.pdf (accessed on 31 January 2020).
- City of San Antonio. San Antonio’s Healthy Menu Initiative. Available online: https://www.sanantonio.gov/Health/HealthyEating/HealthyDining (accessed on 20 December 2020).
- North Carolina Prevention Partners. Eating Healthy should Be Easy. Available online: http://www.ncpreventionpartners.org/dnn/WhatWeDo/Programs/WinnersCircle/tabid/76/Default.aspx (accessed on 21 May 2019).
- American Heart Association. Heart-Check Meal Certification Program. Available online: https://www.heart.org/en/healthy-living/company-collaboration/heart-check-certification (accessed on 31 January 2020).
- Healthy Dining Finder. Healthy Dining Finder Nutrition Criteria. Available online: http://www.healthydiningfinder.com/sodium-savvy/SS-criteria (accessed on 21 May 2019).
- Healthy Shasta. Restaurant Guide: Cut the Sodium but Keep the Flavor. Available online: http://www.restaurantnutrition.com/Images/HDF_2012_SodiumToolkit.aspx (accessed on 21 May 2019).
- Schenectady County Public Health Services. Become Sodium Savvy. Available online: http://www.schenectadycounty.com/FullStory.aspx?m=855&amid=9804 (accessed on 21 May 2019).
- Erie County Department of Health. Healthy Choices Program. Available online: http://www2.erie.gov/health/index.php?q=healthy-choices (accessed on 21 May 2019).
- Healthy Howard. Healthy Restaurants. Available online: https://healthyhowardmd.org/program/healthy-restaurants/ (accessed on 31 January 2020).
- Restaurant Operators Cooperative. What‘s in It for me? Available online: http://www.albanyroc.com/phone/why-join-roc.html (accessed on 20 December 2020).
- Michael Martinez, CNN. San Francisco Overrides Mayoral Veto, Bans Happy Meals with Toys. Available online: http://edition.cnn.com/2010/US/11/23/california.happy.meals.ban/ (accessed on 31 January 2020).
- Public Health Responsibility Deal. Available online: https://webarchive.nationalarchives.gov.uk/20130104155639/http://responsibilitydeal.dh.gov.uk/ (accessed on 4 January 2013).
- Department of Business. Salt Reduction Programme (Food Standards Agency, 2004): Case Study. Available online: https://www.gov.uk/government/publications/salt-reduction-programme-food-standards-agency-2004-case-study (accessed on 21 December 2020).
- Chinese Center for Disease Control and Prevention. Guidance Plan for Health Supporting Environment Construction of National Healthy Lifestyle Action. Available online: http://www.jiankang121.cn/TxtDetail.aspx?id=768 (accessed on 29 July 2020).
- Henney, J.E.; Taylor, C.L.; Boon, C.S. Strategies to Reduce Sodium Intake in the United States; The National Academies Press: Washington, DC, USA, 2010. [Google Scholar]
- Livsmedelsverket. The Keyhole. Available online: https://www.livsmedelsverket.se/en/food-and-content/labelling/nyckelhalet?AspxAutoDetectCookieSupport=1 (accessed on 14 February 2020).
- McGuire, S. Institute of Medicine. 2012. front-of-package nutrition rating systems and symbols: Promoting healthier choices. Washington, DC: The National Academies Press. Adv. Nutr. 2012, 3, 332–333. [Google Scholar] [CrossRef]
- Pietinen, P.; Valsta, L.M.; Hirvonen, T.; Sinkko, H. Labelling the salt content in foods: A useful tool in reducing sodium intake in Finland. Public Health Nutr. 2008, 11, 335–340. [Google Scholar] [CrossRef] [Green Version]
- Long, M.W.; Tobias, D.K.; Cradock, A.L.; Batchelder, H.; Gortmaker, S.L. Systematic review and meta-analysis of the impact of restaurant menu calorie labeling. Am. J. Public Health 2015, 105, e11–e24. [Google Scholar] [CrossRef]
- Sinclair, S.E.; Cooper, M.; Mansfield, E.D. The influence of menu labeling on calories selected or consumed: A systematic review and meta-analysis. J. Acad. Nutr. Diet. 2014, 114, 1375–1388.e15. [Google Scholar] [CrossRef]
- Malam, S.; Clegg, S.; Kirwan, S.; McGinigal, S. Comprehension and Use of UK Nutrition Signpost Labelling Schemes; Food Standards Agency: London, UK, 2009.
- Food Standards Agency. Front of Pack Nutritional Signpost Labelling Technical Guidance. Available online: https://www.foodwatch.org/fileadmin/Themen/Ampelkennzeichnung/guidance_ampel_issue_1_januar_2007.pdf (accessed on 21 December 2020).
- Shrivastava, S.R.; Shrivastava, P.S.; Ramasamy, J. Adoption of the Nutri-score system in France to reduce the incidence of noncommunicable diseases. J. Res. Med. Sci. 2017, 22, 111. [Google Scholar] [CrossRef] [PubMed]
- Burton, S.; Creyer, E.H.; Kees, J.; Huggins, K. Attacking the obesity epidemic: The potential health benefits of providing nutrition information in restaurants. Am. J. Public Health 2006, 96, 1669–1675. [Google Scholar] [CrossRef] [PubMed]
- Wu, H.W.; Sturm, R. What’s on the menu? A review of the energy and nutritional content of US chain restaurant menus. Public Health Nutr. 2013, 16, 87–96. [Google Scholar] [CrossRef] [PubMed] [Green Version]
- Auchincloss, A.H.; Young, C.; Davis, A.L.; Wasson, S.; Chilton, M.; Karamanian, V. Barriers and facilitators of consumer use of nutrition labels at sit-down restaurant chains. Public Health Nutr. 2013, 16, 2138–2145. [Google Scholar] [CrossRef] [Green Version]
- Sutherland, L.A.; Kaley, L.A.; Fischer, L. Guiding stars: The effect of a nutrition navigation program on consumer purchases at the supermarket. Am. J. Clin. Nutr. 2010, 91, 1090S–1094S. [Google Scholar] [CrossRef]
- World Cancer Research Fund International. NOURISHING Database. Available online: https://www.wcrf.org/int/policy/nourishing-database (accessed on 9 February 2020).
- United States Department of Agriculture. Dietary Guidelines for Americans. Available online: https://www.dietaryguidelines.gov/ (accessed on 18 February 2020).
- Glanz, K.; Resnicow, K.; Seymour, J.; Hoy, K.; Stewart, H.; Lyons, M.; Goldberg, J. How major restaurant chains plan their menus: The role of profit, demand, and health. Am. J. Prev. Med. 2007, 32, 383–388. [Google Scholar] [CrossRef]
- Health Canada. Guidance for the Food Industry on Reducing Sodium in Processed Foods. Available online: https://www.canada.ca/en/health-canada/services/food-nutrition/legislation-guidelines/guidance-documents/guidance-food-industry-reducing-sodium-processed-foods-2012.html (accessed on 18 February 2020).
- Thomas, R.G.; Ahuja, J.K.C.; Daniel, M.G. Nationwide variation of sodium levels and portion sizes of Chinese restaurant menu items. Procedia Food Sci. 2015, 4, 138–147. [Google Scholar] [CrossRef] [Green Version]
- IMARC Group. Online Food Delivery Market: Global Industry Trends, Share, Size, Growth, Opportunity and Forecast 2020–2025. Available online: https://www.imarcgroup.com/online-food-delivery-market (accessed on 16 December 2020).
- Gómez, M.I.; Ricketts, K.D. Food value chain transformations in developing countries: Selected hypotheses on nutritional implications. Food Policy 2013, 42, 139–150. [Google Scholar] [CrossRef] [Green Version]
- Pilz, M.; Uma, G.; Venkatram, R. Skills development in the informal sector in India: The case of street food vendors. Int. Rev. Educ. 2015, 61, 191–209. [Google Scholar] [CrossRef]
- World Health Organization. Basic Steps to Improve Safety of Street-vended Food. Available online: https://www.who.int/foodsafety/fs_management/No_03_StreetFood_Jun10_en.pdf (accessed on 17 December 2020).


| Country | Policy | Scope of Implementation | Effective Year | Strategies Adopted | Applicability | Restaurant Type and Size | Effect |
|---|---|---|---|---|---|---|---|
| Argentina | Less Salt, More Life [63] | Nationwide | 2011 | Menu labeling, target setting | Mandatory | Unspecified | Unknown |
| Argentina | An agreement removes salt shakers [77] | Buenos Aires | 2011 | Table salt removal | Mandatory | Hotel and restaurant | Unknown |
| Australia | Healthy Food Partnership (a successor to “Food and Health Dialogue”) [28] | Nationwide | 2015 | Target setting, reformulation, consumer education | Voluntary | Quick service restaurants | Unknown |
| Belgium | Unspecific [63] | Nationwide | 2009 | Target setting, reformulation | Voluntary | Unspecified | Unknown |
| Belgium | EU Salt Reduction Framework * [62,64] | Involved in the EU Framework | 2010 | Target setting, reformulation | Voluntary | Unspecified | Unknown |
| Bulgaria | EU Salt Reduction Framework * [62,64] | Involved in the EU Framework | 2010 | Target setting, reformulation | Voluntary | Unspecified | Unknown |
| Canada | Health Canada’s Healthy Eating Strategy [25] | Nationwide | 2003 | Menu labeling | Voluntary | Restaurants and food services establishments | A study compared laboratory values with Nutrition Facts table (NFt) values of foods from supermarkets, bakeries, and restaurants showed:
|
| Canada | Sodium Reduction Strategy for Canada [49,79] | Nationwide | 2010 | Menu labeling, target setting | Voluntary | Restaurants and food services establishments with a high degree of standardization |
|
| Canada | Informed Dining program (IDP) [24,59,60,61] | Province of British Columbia | 2012 | Menu labeling | Voluntary | Range from small independent cafes to national restaurant chains | Little or no impact |
| China | Healthy Restaurant (in National Healthy Lifestyle Action) [99] | Nationwide | 2013 | Menu labeling, reformulation, consumer education, chef training | Voluntary | Unspecified | Unknown |
| China | “EatSmart Restaurant Star+” Campaign [53] | Hong Kong | Unknown | Menu labeling | Voluntary | Unspecified | Unknown |
| Costa Rica | Unspecific [73] | Nationwide | Unknown | Table salt removal | Voluntary | Unspecified | Unknown |
| Finland | Reducing salt intake in populations ** [54] | Nationwide | 2006 | Menu labeling, consumer education, government assistance, toolkits delivery | Voluntary | Caterers, restaurants and others involved in commercial meal preparation | Unknown |
| Finland | EU Salt Reduction Framework * [62,64] | Involved in the EU Framework | 2010 | Target setting, reformulation | Voluntary | Unspecified | Unknown |
| Finland | Unspecific [63,64] | Nationwide | 2011 | Target setting | Mandatory | University restaurants (main meals and all meal components) | Unknown |
| France | Reducing salt intake in populations ** [54] | Nationwide | 2006 | Menu labeling, consumer education, government assistance, toolkits delivery | Voluntary | Caterers, restaurants and others involved in commercial meal preparation | Unknown |
| France | Unspecific [63] | Nationwide | Unspecific | Table salt removal | Voluntary | Unspecified | Unknown |
| Greece | EU Salt Reduction Framework * [62,64] | Involved in the EU Framework | 2010 | Target setting, reformulation | Voluntary | Unspecified | Unknown |
| Hungary | EU Salt Reduction Framework * [62,64] | Involved in the EU Framework | 2010 | Target setting, reformulation | Voluntary | Unspecified | Unknown |
| Ireland | Reducing salt intake in populations ** [54] | Nationwide | 2006 | Menu labeling, consumer education, government assistance, toolkits delivery | Voluntary | Caterers, restaurants, and others involved in commercial meal preparation | Major high-street restaurant chains all reported a greater reduction in salt from products. |
| Latvia | EU Salt Reduction Framework * [62,64] | Involved in the EU Framework | 2010 | Target setting, reformulation | Voluntary | Unspecified | Unknown |
| Lithuania | EU Salt Reduction Framework * [62,64] | Involved in the EU Framework | 2010 | Target setting, reformulation | Voluntary | Unspecified | Unknown |
| Mexico | − Sal + Salud [73] | Mexico City | Unknown | Table salt removal, media campaign | Voluntary | Unspecified | Unknown |
| Netherlands | EU Salt Reduction Framework * [62,64] | Involved in the EU Framework | 2010 | Target setting, reformulation | Voluntary | Unspecified | Unknown |
| Portugal | EU Salt Reduction Framework * [62,64] | Involved in the EU Framework | 2010 | Target setting, reformulation | Voluntary | Unspecified | Unknown |
| Romania | EU Salt Reduction Framework * [62,64] | Involved in the EU Framework | 2010 | Target setting, reformulation | Voluntary | Unspecified | Unknown |
| Slovak Republic | EU Salt Reduction Framework * [62,64] | Involved in the EU Framework | 2010 | Target setting, reformulation | Voluntary | Unspecified | Unknown |
| Slovenia | EU Salt Reduction Framework * [62,64] | Involved in the EU Framework | 2010 | Target setting, reformulation | Voluntary | Unspecified | Unknown |
| Spain | Reducing salt intake in populations ** [54] | Nationwide | 2006 | Menu labeling, consumer education, government assistance, toolkits delivery | Voluntary | Caterers, restaurants, and others involved in commercial meal preparation | Unknown |
| Sri Lanka | Unspecific [75] | Nationwide | Unknown | Reformulation | Unspecified | Food outlets and restaurants | Unknown |
| Sweden | Keyhole label [48] | Nationwide | 2009 | Menu labeling | Voluntary | Unspecified | The Keyhole symbol is widely recognized by Swedish consumers and has been promoted to restaurants |
| Thailand | Thai Food, Good Heart [63] | Nationwide | 2004 | Reformulation, chef training | Voluntary | Thai Food restaurants (10 famous Thai dishes) | Unknown |
| UK | UK Food Standards Agency’s (FSA) salt reduction programme [39,40,98] | Nationwide | 2003 | Target setting, reformulation | Voluntary | Catering sector, quick-service restaurants, workplace caterers, pub and high-street restaurant chains, and coffee and sandwich shops | Overall salt reduction effects: population’s average daily salt intake was reduced from 9.5 g in 2000–2001 to 8.6 g in 2008. Some foods reduced salt levels by up to 70%. |
| UK | Reducing salt intake in populations ** [54] | Nationwide | 2006 | Menu labeling, consumer education, government assistance, toolkits delivery | Voluntary | Caterers, restaurants, and others involved in commercial meal preparation | Unknown |
| UK | New Department of Health (DoH) voluntary targets [74] | Nationwide | 2014 | Target setting | Voluntary | Unspecified | Unknown |
| UK | The Public Health Responsibility Deal (RD) in England [36,44,76] | England | 2017 | Target setting, reformulation | Voluntary | Unspecified | Unknown |
| UK | EU Salt Reduction Framework * [62,64] | Wales (involved in the EU Framework) | 2010 | Target setting, reformulation | Voluntary | Unspecified | Unknown |
| Uruguay | Unspecific [63] | Nationwide | Unknown | Menu labeling, reformulation, table salt removal | Mandatory | Unspecified | Unknown |
| USA | Strategies to Reduce Sodium Intake in the United States [100] | Nationwide | 2008 | Menu labeling, target setting | Mandatory | Large, multiunit chain restaurant/foodservice operations | Unknown |
| USA | Menu Labeling Provisions (of Section 4205 of the Patient Protection and Affordable Care Act) [19,20,26] | Nationwide | 2010 | Menu labeling | Mandatory | Chain restaurants and similar retail food establishments with 20 or more locations |
|
| USA | Statement of Policy Salt Reduction [81] | Nationwide | 2014 | Menu labeling, target setting | Voluntary | Unspecified | Unknown |
| USA | Nutrition Labeling of Standard Menu Items in Restaurants and Similar Retail Food Establishments [55,56] | Nationwide | 2015 | Menu labeling | Mandatory | Chain restaurant with 20 or more locations offering for sale substantially the same menu items |
|
| USA | Unspecific [78] | Nationwide | 2015 | Reformulation | Voluntary | Unspecified | A study assessing children’s menus reported that the sodium target was the least frequently met healthy criteria |
| USA | Voluntary Sodium Reduction Goals [70] | Nationwide | 2016 | Target setting | Voluntary | Unspecified | Unknown |
| USA | Heart Check [35] | Nationwide | Unknown | Menu labeling, target setting, | Voluntary | Unspecified | Unknown |
| USA | New US healthcare reform law [44] | Nationwide | Unknown | Menu labeling | Mandatory | Retail food establishments with 20 locations | Unknown |
| USA | National Salt Reduction Initiative (NSRI) [20,32,33,83,84] | New York with 100 city and state health authorities and national health organizations | 2010 | Target setting, reformulation | Voluntary | Unspecified |
|
| USA | SB-1420 Food facilities: nutritional information [50] | California | 2009 | Menu labeling, target setting | Mandatory (fines imposed) | Chain restaurants with 20 or more outlets in California | Unknown |
| USA | Smart Meal [35,86] | Colorado | Unknown | Menu labeling, target setting | Voluntary | Local restaurants | Unknown |
| USA | Strategies to Reduce Sodium Intake in the United States (bill) [100] | Delaware | 2010 | Menu labeling, consumer education | Mandatory | Foodservice establishment with 10 or more outlets in Delaware or nationwide | Unknown |
| USA | Strategies to Reduce Sodium Intake in the United States [100] | District of Columbia | 2010 | Menu labeling | Mandatory | Chain restaurants with 10 or more outlets nationwide | Unknown |
| USA | Healthy Choices [35,93] | Erie County | Unknown | Menu labeling | Voluntary | Local restaurants | Unknown |
| USA | Strategies to Reduce Sodium Intake in the United States [100] | Florida | 2010 | Menu labeling | Mandatory | Chain restaurants with 19 or more outlets in Florida | Unknown |
| USA | Strategies to Reduce Sodium Intake in the United States [100] | Indiana | 2009 | Menu labeling | Mandatory | Chain restaurants of 20 or more outlets in Indiana | Unknown |
| USA | Strategies to Reduce Sodium Intake in the United States [100] | Kentucky | 2009 | Menu labeling | Mandatory | Chain restaurants with 10 or more locations in Kentucky | Unknown |
| USA | The King County Board of Health’s nutrition labeling regulation [29,43,69] | King County | 2010 | Menu labeling | Mandatory (fines imposed, was voluntary between 2008–2010) | Chain restaurant meets all criteria: has 15 or more locations in King County or nationwide; has operating permits; total gross annual revenues of $1 million or more; has standardized menu items that use standard recipes |
|
| USA | Strategies to Reduce Sodium Intake in the United States [100] | Maryland | 2010 | Menu labeling | Mandatory | Chain restaurants with 15 or more outlets nationwide | Unknown |
| USA | Healthy Howard Columbia [94] | Maryland | Unknown | Government assistance | Voluntary | Local restaurants | Unknown |
| USA | The menu labeling requirement [100] | Montgomery County | 2010 | Menu labeling | Mandatory | Chain restaurants with 20 or more outlets nationwide | Unknown |
| USA | New York City salt warning rule [47,51,52] | New York | 2015 | Menu labeling, target setting, media campaign, consumer education | Mandatory | Chain restaurant with 15 outlets | The effect of adding numeric sodium menu nutrition information depends on consumers’ taste intuition |
| USA | Capitol Region Restaurant Operators Cooperative [35,95] | New York | Unknown | Government assistance | Voluntary | Local restaurants | Unknown |
| USA | Winner’s Circle [35,88] | North Carolina | Unknown | Menu labeling, target setting | Unspecified | Local restaurants | Unknown |
| USA | Strategies to Reduce Sodium Intake in the United States [100] | Oklahoma | 2010 | Menu labeling | Mandatory | Restaurants with 10 or more outlets in the state | Unknown |
| USA | State legislation [100] | Oregon | 2010 | Menu labeling | Mandatory | Chain restaurants with 15 or more outlets nationwide | Unknown |
| USA | Strategies to Reduce Sodium Intake in the United States [100] | Pennsylvania | 2009 | Menu labeling | Mandatory | Chain restaurants with an average of at least $500,000 in food sales over the past 3 years | Unknown |
| USA | Philadelphia Menu Labeling Ordinance [27] | Philadelphia | 2010 | Menu labeling | Mandatory | Restaurants with 15 or more outlets nationwide |
|
| USA | Healthy Chinese Take-Out Initiative (HCTI) [30] | Philadelphia | 2012 | Reformulation, chef training, toolkits delivery, media campaign | Voluntary | Chinese take-out restaurants in low-income urban communities | 13–34% reduction in sodium content of 3 popular dishes 36 months after low-sodium cooking training |
| USA | Sodium menu labeling legislation [65] | Philadelphia | 2019 | Menu labeling | Mandatory (fines imposed) | Any chain retail food establishment | Unknown |
| USA | SmartMenu [31,34] | Pierce County | 2007 | Menu labeling | Voluntary | Locally owned full-service restaurants |
|
| USA | ¡Por Vida! [35,87] | San Antonio | Unknown | Menu labeling, target setting | Unspecified | Local restaurants | Unknown |
| USA | Healthy Food Incentives Ordinance [37,45,96] | San Francisco | 2011 | Target setting (for children’s meals) | Mandatory | Local restaurants | Two restaurants investigated did not change recipes to meet the nutrition criteria (only selling toys separately from children’s meals as response to the ordinance) |
| USA | Sodium Savvy [35,90] | Schenectady County | Unknown | Menu labeling, target setting, consumer education | Unspecified | Local restaurants | Unknown |
| USA | Healthy Kids Choice [35,85] | Shasta County | Unknown | Menu labeling, target setting | Unspecified | Local restaurants | Unknown |
| USA | Cut the Sodium but Keep the Flavor [35,91] | Shasta County | Unknown | Chef training | Voluntary | Local restaurants | Unknown |
| USA | Strategies to Reduce Sodium Intake in the United States [100] | Tennessee | 2009 | Menu labeling | Mandatory | Chain restaurants with 20 or more outlets nationwide | Unknown |
| USA | Strategies to Reduce Sodium Intake in the United States [100] | Texas | 2010 | Menu labeling | Mandatory | Chain restaurants with 19 or more locations in Texas | Unknown |
| USA | Strategies to Reduce Sodium Intake in the United States [100] | Vermont | 2010 | Menu labeling | Mandatory | Restaurants with 10 or more outlets nationwide | Unknown |
| Americas 1 | Preventing Cardiovascular Disease in the Americas by Reducing Dietary Salt Intake Population-Wide [72] | Countries in Americas | 2014 | Target setting, reformulation | Voluntary | Unspecified | Unknown |
| Country and Region | Target/Limit | Food Manufacturer Involved * |
|---|---|---|
| Americas | Gradual and sustained schedules | Yes |
| Argentina | Unspecified | No |
| Australia | Unspecified | Yes |
| Belgium | 10% salt reduction by 2012 | No |
| Canada | Unspecified (specific target only for the food industry) | Yes |
| China | Unspecified | Yes |
| EU (Belgium, Bulgaria, Finland, Greece, Hungary, Latvia, Lithuania, Netherlands, Portugal, Romania, Slovak Republic, Slovenia, and UK: Wales) | 16% salt reduction over 4 years | Yes |
| Finland | Unspecified | No |
| Thailand | Unspecified (for 10 famous Thai dishes) | Yes |
| UK | Specific target for 11 restaurant food categories (24 subcategories) within 2 years | Yes |
| USA | Specific target for 10 restaurant food categories (25 subcategories) in 2012 and 2014 | Yes |
| California, USA | Stating 2300 mg of sodium limits for daily diet | No |
| Colorado, USA | ≤1500 mg sodium per meal and ≤650 mg sodium per side dish | No |
| New York, USA | Menu items containing 2300 mg sodium or more are required to add Salt Shaker icon | No |
| North Carolina, USA | ≤1000 mg sodium per meal and ≤480 mg sodium per side item | No |
| San Antonio, USA | ≤750 mg sodium per meal | No |
| San Francisco, USA | ≤640 mg sodium for children’s meal | No |
| Schenectady County, USA | ≤750 mg sodium per meal; ≤250 mg sodium for appetizers, side dishes, and desserts | No |
| Shasta County, USA | ≤770 mg sodium for children’s meal | No |
Publisher’s Note: MDPI stays neutral with regard to jurisdictional claims in published maps and institutional affiliations. |
© 2020 by the authors. Licensee MDPI, Basel, Switzerland. This article is an open access article distributed under the terms and conditions of the Creative Commons Attribution (CC BY) license (http://creativecommons.org/licenses/by/4.0/).
Share and Cite
Ding, J.; Sun, Y.; Li, Y.; He, J.; Sinclair, H.; Du, W.; Wang, H.; Zhang, P. Systematic Review on International Salt Reduction Policy in Restaurants. Int. J. Environ. Res. Public Health 2020, 17, 9570. https://0-doi-org.brum.beds.ac.uk/10.3390/ijerph17249570
Ding J, Sun Y, Li Y, He J, Sinclair H, Du W, Wang H, Zhang P. Systematic Review on International Salt Reduction Policy in Restaurants. International Journal of Environmental Research and Public Health. 2020; 17(24):9570. https://0-doi-org.brum.beds.ac.uk/10.3390/ijerph17249570
Chicago/Turabian StyleDing, Jingmin, Yuewen Sun, Yuan Li, Jing He, Harriet Sinclair, Wenwen Du, Huijun Wang, and Puhong Zhang. 2020. "Systematic Review on International Salt Reduction Policy in Restaurants" International Journal of Environmental Research and Public Health 17, no. 24: 9570. https://0-doi-org.brum.beds.ac.uk/10.3390/ijerph17249570