Using Smart Sensors to Monitor Physical Activity and Technical–Tactical Actions in Junior Tennis Players

 , , and
Abstract
:1. Introduction
2. Materials and Methods
2.1. Design and Subjects
2.2. Technology Tools
2.3. Procedure
2.4. Variables and Data Notation
2.5. Statistical Analysis
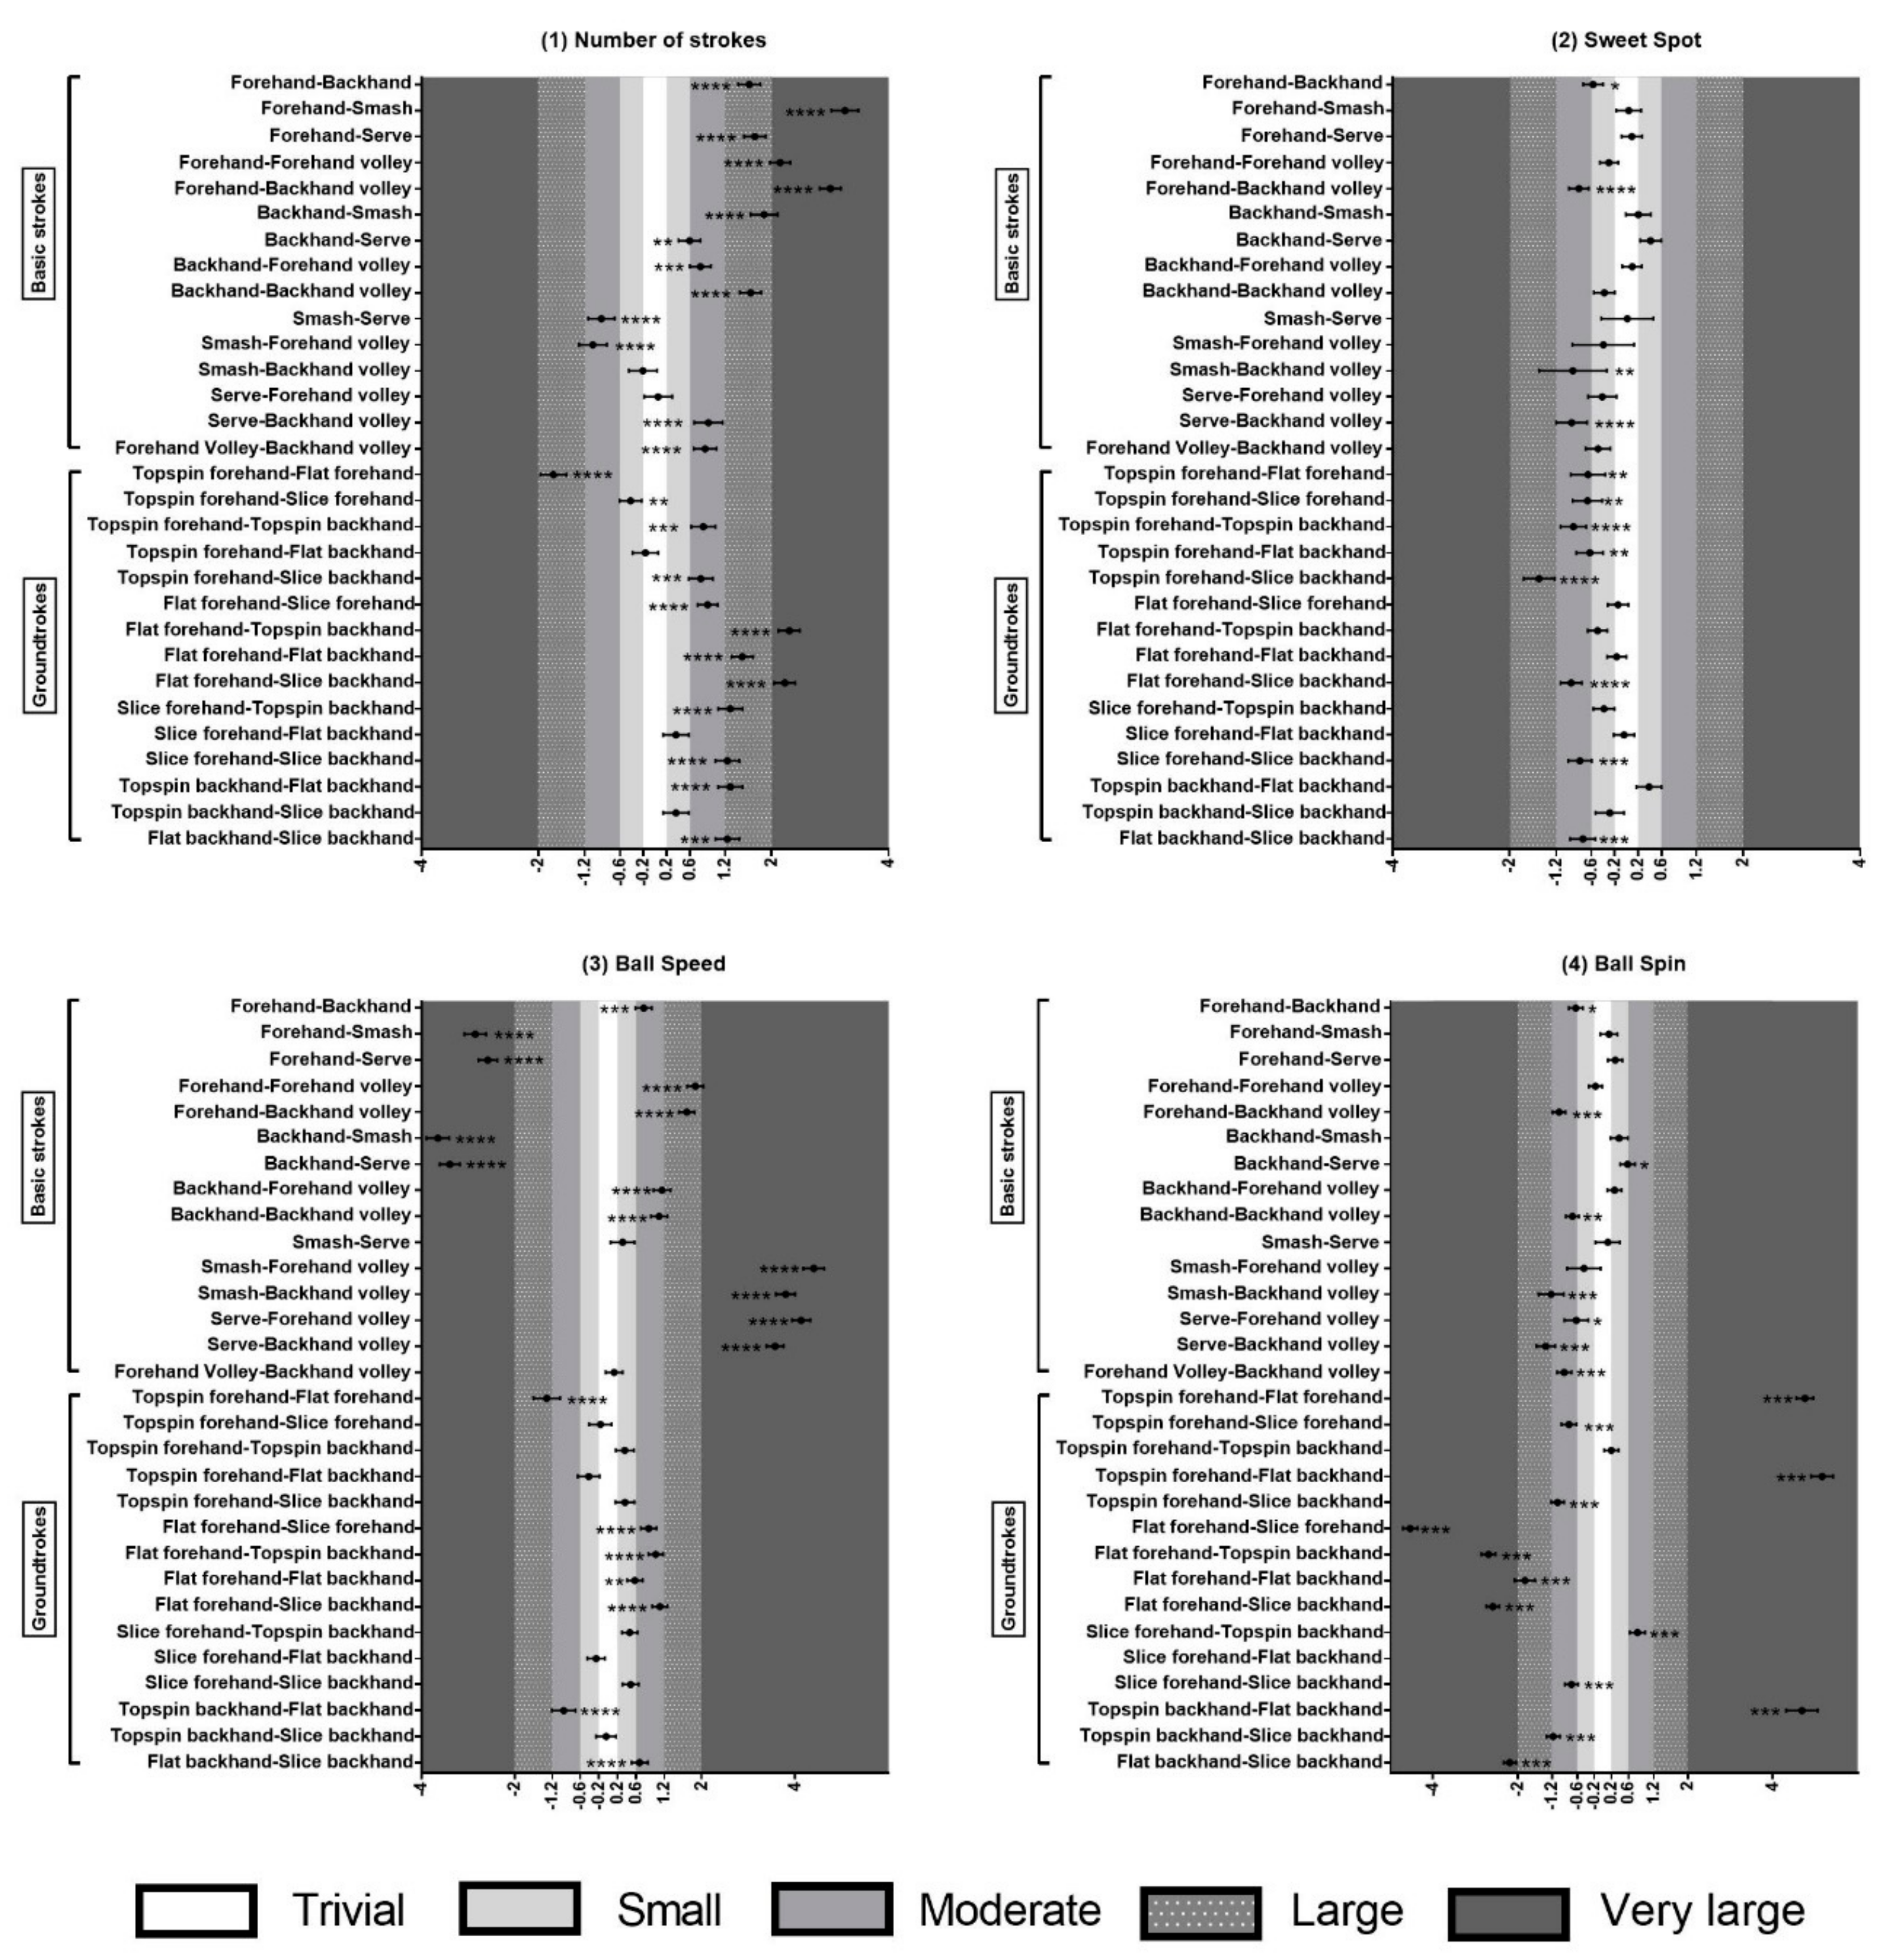
3. Results
4. Discussion
5. Conclusions
6. Practical Applications
Author Contributions
Funding
Acknowledgments
Conflicts of Interest
References
- Fister, I.; Fister, I.; Fister, D. Design and Implementation of an Artificial Sports Trainer. In Computational Intelligence in Sports. Adaptation, Learning, and Optimization; Springer: Cham, Switzerland, 2019; Volume 22, pp. 121–135. [Google Scholar] [CrossRef]
- Larson, A.; Smith, A. Sensors and Data Retention in Grand Slam Tennis. In Proceedings of the 2018 IEEE Sensors Applications Symposium (SAS), Seoul, Korea, 12–14 March 2018. [Google Scholar] [CrossRef]
- Whiteside, D.; Cant, O.; Connolly, M.; Reid, M. Monitoring Hitting Load in Tennis Using Inertial Sensors and Machine Learning. Orig. Investig. Int. J. Sport Physiol. Perform. 2017, 12, 1212–1217. [Google Scholar] [CrossRef]
- Over, S.; O´Donoghue, P. Análisis de La Estrategia y La Táctica En El Tenis. ITF Coach. Sport Sci. Rev. 2010, 50, 15–16. [Google Scholar]
- Büthe, L.; Blanke, U.; Capkevics, H.; Tröster, G. A Wearable Sensing System for Timing Analysis in Tennis; IEEE: San Franciso, CA, USA, 2016. [Google Scholar] [CrossRef]
- Hunt, D.P.L.; Tudor, D. The Role of Classification in the Development of Wearable Coaching Devices. In The 13th Australasian Conference on Mathematics and Computers in Sport; Trove: Melbourne, Australia, 2016; pp. 45–49. [Google Scholar]
- Shanley, E.; Myers, N.L. Mechanics, Pathomechanics and Injury in the Overhead Athlete. Mech. Pathomechanics Inj. Overhead Athl. 2019. [Google Scholar] [CrossRef]
- Memmert, D.; Lemmink, K.A.P.M.; Sampaio, J. Current Approaches to Tactical Performance Analyses in Soccer Using Position Data. Sports Med. 2017, 47, 1–10. [Google Scholar] [CrossRef] [PubMed]
- Sanz, D.; Terroba, A. Aplicación de Las Nuevas Tecnologías Al Análisis de La Táctica En El Tenis. Coach Sport Sci. Rev. ITF. 2012, 20, 23–25. [Google Scholar]
- Fernández-García, A.; Torres-Luque, G. Intelligent Devices for Tennis Rackets. ITF Coach. Sport Sci. Rev. 2018, 26, 5–7. [Google Scholar]
- Nicolella, D.P.; Torres-Ronda, L.; Saylor, K.J.; Schelling, X. Validity and Reliability of an Accelerometer-Based Player Tracking Device. PLoS ONE 2018, 13, e0191823. [Google Scholar] [CrossRef]
- Coutts, A.J. Working Fast and Working Slow: The Benefits of Embedding Research in High-Performance Sport. Int. J. Sports Physiol. Perform. 2016, 11, 1–2. [Google Scholar] [CrossRef] [Green Version]
- Keaney, E.M.; Reid, M. Quantifying Hitting Activity in Tennis with Racket Sensors: New Dawn or False Dawn? Sport. Biomech. 2018, 1–9. [Google Scholar] [CrossRef]
- Quinlan, G. El Uso de Las Aplicaciones Para Mejorar El Entrenamiento: La Aplicación Técnica de Tenis Australia. Coach Sport Sci. Rev. ITF 2013, 59, 22–24. [Google Scholar]
- Duffield, R.; Reid, M.; Baker, J.; Spratford, W. Accuracy and Reliability of GPS Devices for Measurement of Movement Patterns in Confined Spaces for Court-Based Sports. J. Sci. Med. Sport 2010, 13, 523–525. [Google Scholar] [CrossRef] [PubMed]
- Cust, E.E.; Sweeting, A.J.; Ball, K.; Robertson, S. Machine and Deep Learning for Sport-Specific Movement Recognition: A Systematic Review of Model Development and Performance. J. Sports Sci. 2019, 37, 568–600. [Google Scholar] [CrossRef] [PubMed]
- Tierney, P.; Clarke, N. A Comparison of a Smartphone App with Other GPS Tracking Type Devices Employed in Football. Sport Perform. Sci. Rep. 2018, 3, 39–42. [Google Scholar] [CrossRef] [Green Version]
- Reche-Soto, P.; Nieto, D.C.; Pino Ortega, J. Tactical Demands of Small-Sided in Football: Influence of Tracking Technology Demands. Revista Internacional de Medicina y Ciencias de la Actividad Física y del Deporte 2019, 19, 729. [Google Scholar] [CrossRef] [Green Version]
- Murray, A.; Buttfield, A.; Simpkin, A.; Sproule, J.; Turner, A.P. Variability of Within-Step Acceleration and Daily Wellness Monitoring in Collegiate American Football. J. Sci. Med. Sport 2018, 22, 488–493. [Google Scholar] [CrossRef]
- Pino-Ortega, J.; Rojas-Valverde, D.; Gómez-Carmona, C.D.; Bastida-Castillo, A.; Hernández-Belmonte, A.; García-Rubio, J.; Nakamura, F.Y.; Ibáñez, S.J. Impact of Contextual Factors on External Load During a Congested-Fixture Tournament in Elite U’18 Basketball Players. Front. Psychol. 2019, 10, 1100. [Google Scholar] [CrossRef] [Green Version]
- Howe, S.T.; Aughey, R.J.; Hopkins, W.G.; Stewart, A.M.; Cavanagh, B.P. Quantifying Important Differences in Athlete Movement during Collision-Based Team Sports: Accelerometers Outperform Global Positioning Systems. In International Symposium on Inertial Sensors and Systems (INERTIAL); IEEE: Kauai, HI, USA, 2017. [Google Scholar] [CrossRef]
- Hulin, B.; Johnston, R.D. Wearable Microtechnology Can Accurately Identify Collision Events during Professional Rugby League Match-Play. J. Sci. Med. Sport 2016, 20, 638–642. [Google Scholar] [CrossRef] [Green Version]
- Kos, M.; Ženko, J.; Vlaj, D.; Kramberger, I. Tennis Stroke Detection and Classification Using Miniature Wearable IMU Device. Int. Conf. Syst. Signals Image Process. 2016. [Google Scholar] [CrossRef]
- Ortega-Toro, E.; García-Angulo, A.; Giménez-Egido, J.M.; García-Angulo, F.J.; Palao, J. Effect of Modifications in Rules in Competition on Participation of Male Youth Goalkeepers in Soccer. Int. J. Sport. Sci. Coach. 2018, 13. [Google Scholar] [CrossRef]
- Buszard, T.; Reid, M.; Masters, R.; Farrow, D. Scaling the Equipment and Play Area in Children’s Sport to Improve Motor Skill Acquisition: A Systematic Review. Sport Med. 2016, 46, 829–843. [Google Scholar] [CrossRef] [Green Version]
- Chow Yi, J. Nonlinear Learning Underpinning Pedagogy: Evidence, Challenges, and Implications. Quest 2013, 65, 469–484. [Google Scholar] [CrossRef]
- Renshaw, I.; Araújo, D.; Button, C.; Chow, J.Y.; Davids, K.; Moy, B. Why the Constraints-Led Approach Is Not Teaching Games for Understanding: A Clarification. Phys. Educ. Sport Pedagog. 2016, 21, 459–480. [Google Scholar] [CrossRef] [Green Version]
- Hastie, P.A.; Ward, J.K.; Brock, S.J. Effect of Graded Competition on Student Opportunities for Participation and Success Rates during a Season of Sport Education. Phys. Educ. Sport Pedagog. 2017, 22, 316–327. [Google Scholar] [CrossRef]
- Davids, K.; Araújo, D.; Hristovski, R.; Passos, P.; Chow, J.Y. Ecological Dynamics and Motor Learning Design in Sport. In Skill acquisition in Sport: Research, theory and practice; Routledge: New York, NY, USA, 2012; pp. 112–130. [Google Scholar] [CrossRef]
- Correia, V.; Carvalho, J.; Araújo, D.; Pereira, E.; Davids, K. Principles of Nonlinear Pedagogy in Sport Practice. Phys. Educ. Sport Pedagog. 2019, 24, 117–132. [Google Scholar] [CrossRef]
- Gonçalves, G.H.T.; Klering, R.T.; Aires, H.; Balbinotti, C.A.A. Contribuições Da Competição de Tênis Na Educação e Formação de Crianças. J. Phys. Educ. 2016, 27, 2738. [Google Scholar] [CrossRef] [Green Version]
- García-Angulo, A.; Giménez-Egido, J.M.; García-Angulo, F.J.; Ortega-Toro, E. Revisión de Los Reglamentos de Balonmano En Categorías de Formación En España. J. Sport Sci. 2019, 15, 9–22. [Google Scholar]
- Hills, A.P.; Andersen, L.B.; Byrne, N.M. Physical Activity and Obesity in Children. Br. J. Sports Med. 2011, 866–870. [Google Scholar] [CrossRef] [Green Version]
- García-Angulo, A.; García-Angulo, F.J.; Torres-Luque, G.; Ortega-Toro, E. Applying the New Teaching Methodologies in Youth Football Players: Toward a Healthier Sport. Front. Physiol. 2019, 10, 121. [Google Scholar] [CrossRef] [PubMed] [Green Version]
- Praça, G.M.; Bredt, S.G.T.; Torres, J.O.; Custódio, I.J.O.; Andrade, A.G.P.; Morales, J.C.P.; Chagas, M.H.; Greco, P.J. Influence of Numerical Superiority and Players’ Tactical Knowledge on Perceived Exertion and Physical and Physiological Demands in Soccer Small-Sided Games. Rev. Psicol. Deport. 2018, 27, 31–38. [Google Scholar]
- Limpens, V.; Buszard, T.; Shoemaker, E.; Savelsbergh, G.J.P.; Reid, M. Scaling Constraints in Junior Tennis: The Influence of Net Height on Skilled Players’ Match-Play Performance. Res. Q. Exerc. Sport 2018, 89, 1–10. [Google Scholar] [CrossRef]
- Bayer, D.; Ebert, M.; Leser, R. A Comparison of the Playing Structure in Elite Kids Tennis on Two Different Scaled Courts. Int. J. Perform. Anal. Sport 2017, 17, 34–43. [Google Scholar] [CrossRef] [Green Version]
- Hunt, D.P.L.; Parry, D.T.; Schliebs, S. Exploring the Applicability of Reservoir Methods for Classifying Punctual Sports Activities Using On-Body Sensors. In Thirty-Seventh Australasian Computer Science Conference; Australian Computer Society: Darlinghurst, Australia, 2014. [Google Scholar]
- Thomas, J.R.; Nelson, J.K. Meétodos de Investigacioén En Actividad Fiésica; Editorial Paidotribo: Barcelona, Spain, 2007. [Google Scholar]
- Otzen, T.; Manterola, C. Técnicas de Muestreo Sobre Una Población a Estudio Sampling Techniques on a Population Study. Int. J. Morphol. 2017, 35, 227–232. [Google Scholar] [CrossRef] [Green Version]
- Thomas, J.R.; Nelson, J.K.; Silverman, S.J. Research Methods in Physical Activity; Human Kinetics: Leeds, UK, 2015. [Google Scholar]
- Myers, N.L.; Kibler, W.B.; Axtell, A.H.; Uhl, T.L. The Sony Smart Tennis Sensor Accurately Measures External Workload in Junior Tennis Players. Int. J. Sport. Sci. Coach. 2019, 14, 24–31. [Google Scholar] [CrossRef]
- Field, A. Discovering Statistics Using IBM SPSS Statistics; Seaman, J., Turpie, S., Smith, N., Anticliff, I., Eds.; Sage: London, UK, 2018. [Google Scholar]
- Pardo, A.; Ruiz, M.A. Análisis de Varianza de Un Factor: El Procedimiento ANOVA de Un Factor. In SPSS 11: Guia Para el Analisis de Datos; McGraw-Hill: Madrid, Spain, 2002; pp. 251–256. [Google Scholar]
- Batterham, A.M.; Hopkins, W.G. Making Meaningful Inferences About Magnitudes. Int. J. Sports Physiol. Perform. 2006, 1, 50–57. [Google Scholar] [CrossRef]
- Vázquez-Guerrero, J.; Fernández-Valdés, B.; Gonçalves, B.; Sampaio, J.E. Changes in Locomotor Ratio During Basketball Game Quarters From Elite Under-18 Teams. Front. Psychol. 2019, 10. [Google Scholar] [CrossRef]
- Hopkins, W.G.; Marshall, S.W.; Batterham, A.M.; Hanin, J. Progressive Statistics for Studies in Sports Medicine and Exercise Science. Med. Sci. Sports Exerc. 2009, 41, 3–12. [Google Scholar] [CrossRef] [Green Version]
- Giménez, J.V.; Leicht, A.S.; Gomez, M.A. Physical Performance Differences between Starter and Non-starter Players during Professional Soccer Friendly Matches. J. Hum. Kinet. 2019, 69, 283–291. [Google Scholar] [CrossRef] [Green Version]
- Hopkins, W.G. A Spreadsheet to Compare Means of Two Groups. Sportscience 2007, 11, 22–24. [Google Scholar]
- Reid, M.; Morgan, S.; Whiteside, D. Matchplay Characteristics of Grand Slam Tennis: Implications for Training and Conditioning. J. Sports Sci. 2016, 34, 1791–1798. [Google Scholar] [CrossRef]
- Fitzpatrick, A.; Davids, K.; Stone, J.A. Effects of Lawn Tennis Association Mini Tennis as Task Constraints on Children’s Match-Play Characteristics. J. Sports Sci. 2017, 35, 2204–2210. [Google Scholar] [CrossRef]
- Blanca-Torres, J.C.; Fernández-García, Á.I.; Torres-Luque, G. Influencia de La Categoría y El Genero En Variables Temporales En El Tenis Individual de Élite. J. Sport Health Res. 2019, 11, 69–78. [Google Scholar]
- Chow, J.Y.; Davids, K.; Button, C.; Renshaw, I. Nonlinear Pedagogy in Skill Acquisition; Routledge: New York, NY, USA, 2016. [Google Scholar] [CrossRef]
- McCarthy, J.; Bergholz, L.; Bartlett, M. Re-Designing Youth Sport: Change the Game; Routledge: New York, NY, USA, 2016. [Google Scholar]
- Kachel, K.; Buszard, T.; Reid, M. The Effect of Ball Compression on the Match-Play Characteristics of Elite Junior Tennis Players. J. Sports Sci. 2015, 33, 320–326. [Google Scholar] [CrossRef]
- World Health Organization. Global Action Plan on Physical Activity 2018-2030: More Active People for a Healthier World; World Health Organization: Geneva, Switzerland, 2019. [Google Scholar]
- Vaughan, J.; Mallett, C.J.; Davids, K.; Potrac, P.; López-Felip, M.A. Developing Creativity to Enhance Human Potential in Sport: A Wicked Transdisciplinary Challenge. Front. Psychol. 2019, 10, 2090. [Google Scholar] [CrossRef]
- Gimenez-Egido, J.M.; Ortega-Toro, E.; Palao, J.M.; Verdú-Conesa, I.; Torres-Luque, G. Effect of Modification Rules in Competition on Technical–Tactical Action in Young Tennis Players (Under-10). Front. Psychol. 2020, 10, 2789. [Google Scholar] [CrossRef] [Green Version]
- Grambow, R.; O’Shannessy, C.; Born, P.; Meffert, D.; Vogt, T. Serve Efficiency Development at Wimbledon between 2002 and 2015: A Longitudinal Approach to Impact Tomorrow’s Tennis Practice. Hum. Mov. 2020, 21, 65–72. [Google Scholar] [CrossRef] [Green Version]
- Raymond, C.J.; Madar, T.J.; Montoye, A.H.K. Accuracy of the Babolat Pop Sensor for Assessment of Tennis Stokes in Structured and Match Play Settings. J. Sport Hum. Perf. 2019, 2, 1–11. [Google Scholar]


| Variables (Description) | Categories | Sub-Categories | Sub-Categories (Description) |
|---|---|---|---|
| 1. Number of strokes (total number of strokes per match) 2. Percentage of ball impact in the sweet spot (percentage of hits located in the sweet spot) 3. Ball Speed (average speed measures in kilometers per hour) 4. Ball Spin (spin measures in revolutions per minute) | Basic strokes | Forehand | Groundstroke on the dominant side per match |
| Backhand | Groundstroke on the non-dominant side per match | ||
| Smash | Stroke above the hitters’ head with a serve-like motion | ||
| Service | Stroke to start the point. Normally is served overhead | ||
| Forehand Volley | Shot on the dominant-side in which the ball is hit before it bounces on the ground (not smash) | ||
| Backhand Volley | Shot on the not-dominant-side in which the ball is struck before it bounces on the ground (not smash) | ||
| Groundstrokes | Topspin Forehand | Topspin shot on the dominant side | |
| Flat Forehand | Flat shot on the dominant side | ||
| Slice Forehand | Slice shot on the dominant side | ||
| Topspin Backhand | Topspin shot on the non-dominant side | ||
| Flat Backhand | Flat shot on the non-dominant side | ||
| Slice Backhand | Slice shot on the non-dominant side | ||
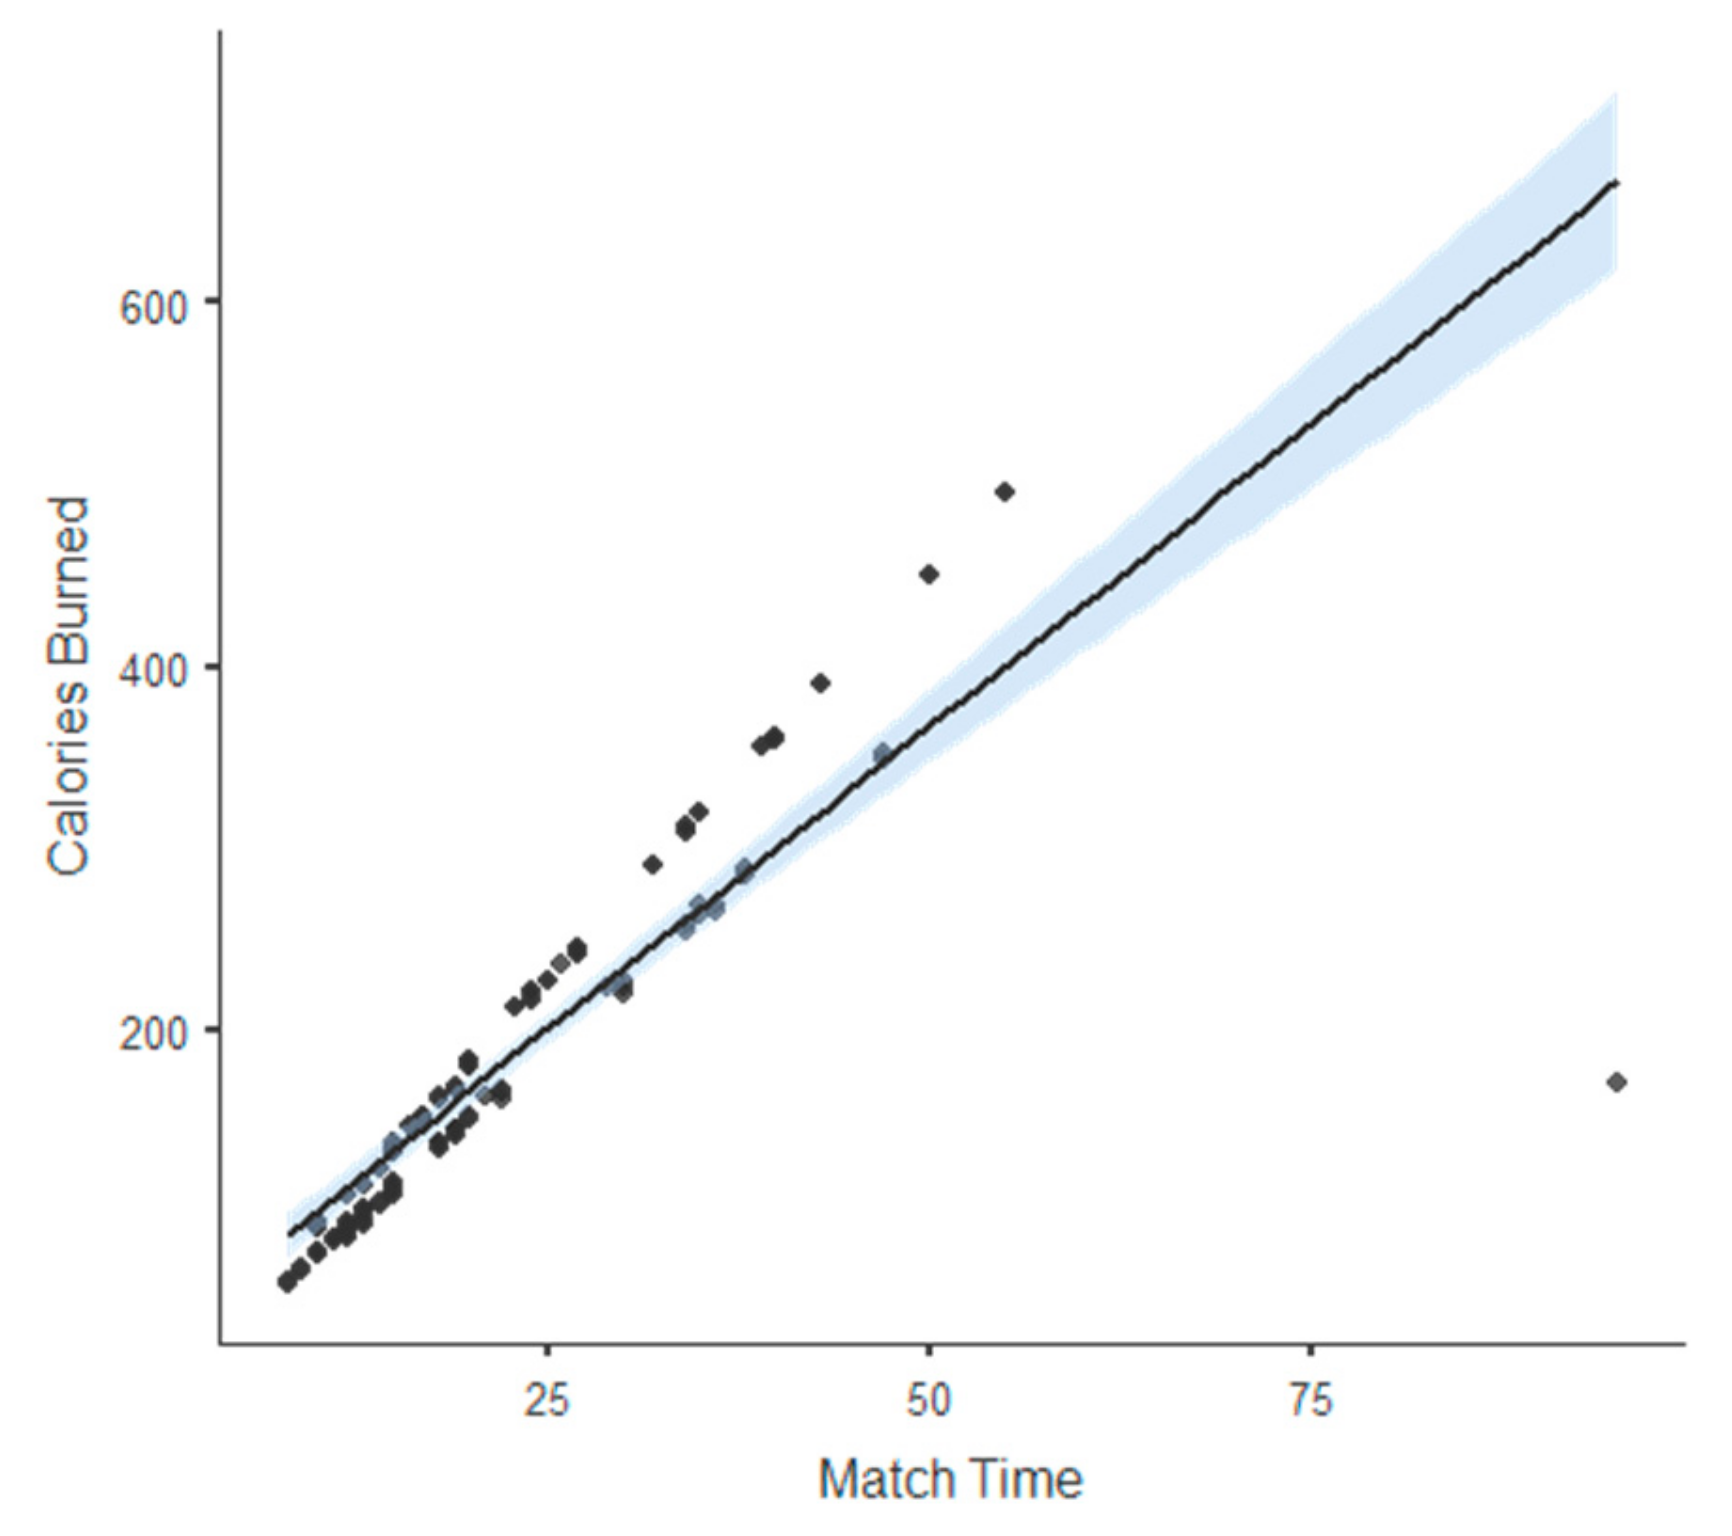
| 5. Calories burned | - | - | Kilocalories burned per match |
| 6. Match time | - | - | Play time in minutes |
| NUMBER OF STROKES | SWEET SPOT | BALL SPEED | BALL SPIN | |||||
|---|---|---|---|---|---|---|---|---|
| Var | Mean ± SD | post-hoc | Mean ± SD | post-hoc | Mean ± SD | post-hoc | Mean ± SD | post-hoc |
| Fh | 88.70±61.95 | Fh>(Bh, Sm, Se, FhV, BhV) | 68.00±10.20 | Bh >Fh>(FhV, BhV) | 79.50±6.16 | Bh<Fh<(Sm, Se, FhV, BhV) | 1224.00±152.00 | (Bh, BhV)>Fh |
| Bh | 24.10±16.83 | Fh>Bh<(Sm, FhV, BhV) | 76.20±15.40 | Bh>(Fh, Se, Sm) | 74.40±6.35 | Bh<(Fh, Sm, Se, FhV, BhV) | 1367.00±234.00 | BhV>Bh |
| Sm | 2.27±1.59 | (Fh, Bh, FhV, BhV)>Sm | 64.30±35.00 | (Bh, BhV, FhV)>Sm | 99.20±14.50 | Sm>(Fh, Bh, FhV, BhV) | 1223.00±420.00 | BhV>Sm |
| Ser | 16.79±7.12 | Fh>Se | 67.30±23.10 | (Bh, FhV, BhV)>Se | 98.20±7.96 | Se>(Fh, Bh, FhV, BhV) | 1158.00±370.00 | Bh, FhV, BhV>Se |
| FhV | 12.67±8.85 | (Fh,Bh)>FhV> (Sm, BhV) | 74.30±21.40 | FhV>(Fh, Sm, Se) | 66.90±6.22 | (Fh, Bh, Sm, Se)>FhV | 1297.00±269.00 | BhV>FhV |
| BhV | 5.33±3.72 | (Fh, Bh, FhV)>BhV>Sm | 81.60±25.10 | BhV>(Fh, Sm, Se) | 66.10±7.19 | (Fh, Bh, Sm, Se)>BhV | 1818.00±662.00 | (Fh, Bh, Sm, Se, FhV)>BhV |
| TsFh | 13.70±9.57 | (FFh,SFh)>TsFh> (TsBh, SBh) | 58.50±24.20 | (FFh, SFh, TsBh, FBh, SBh)>TsFh | 74.40±9.97 | FFh>TsFh>(TsBh, SBh) | 1494.00±166.00 | (FFh, FBh<TsFh< SFh, SBh) |
| FFh | 49.30±34.43 | FFh>(TsFh, SFh, TsBh, FBh, SBh) | 68.50±11.50 | TsFh<FFh<(TsBh, SBh) | 81.60±6.05 | FFh>(TsFh, SFh, TsBh, FBh, SBh) | 931.00±91.50 | (TsFh, SFh, TsBh, FBh, SBh)>FFh |
| SFh | 25.60±17.88 | (TsFh, FFh)> SFh>(TsBh, FBh, SBh) | 71.80±16.30 | TsFh<SFh>SBh | 75.30±7.07 | (FFh>SFh>TsBh, SBh) | 1656.00±217.00 | SBh>SFh>(TsFh, FFh, TsBh, FBh) |
| TsBh | 5.73±4.00 | (TsFh, FFh, TsBh,FBh)>TsBh | 78.50±26.70 | TsBh>(TsFh, FFh) | 70.70±10.50 | (TsFh, FFh, SFh, FBh)>TsBh | 1458.00±265.00 | (SFh,SBh)>TsBh>(FFh, FBh) |
| FBh | 13.90±9.71 | (FFh,SFh)>FBh>(TsBh, SBh) | 73.20±18.40 | TsFh<FBh<SBh | 77.20±7.62 | FFh>FBh>(TsBh, SBh) | 1050.00±71.60 | (TsFh, SFh, TsBh, SBh>FBh)>FFh |
| SBh | 6.48±4.53 | (TSF, FFh, SFh, FBh)>SBh | 83.70±22.10 | SBh>(TsFh, FFh, SFh, FBh)( | 71.00±8.98 | (TsFh, FFh, SFh, FBh)>SBh | 2163.00±656.00 | SBh>(TsFh, FFh, SFh, TsBh, FBh) |
© 2020 by the authors. Licensee MDPI, Basel, Switzerland. This article is an open access article distributed under the terms and conditions of the Creative Commons Attribution (CC BY) license (http://creativecommons.org/licenses/by/4.0/).
Share and Cite
Giménez-Egido, J.M.; Ortega, E.; Verdu-Conesa, I.; Cejudo, A.; Torres-Luque, G. Using Smart Sensors to Monitor Physical Activity and Technical–Tactical Actions in Junior Tennis Players. Int. J. Environ. Res. Public Health 2020, 17, 1068. https://0-doi-org.brum.beds.ac.uk/10.3390/ijerph17031068
Giménez-Egido JM, Ortega E, Verdu-Conesa I, Cejudo A, Torres-Luque G. Using Smart Sensors to Monitor Physical Activity and Technical–Tactical Actions in Junior Tennis Players. International Journal of Environmental Research and Public Health. 2020; 17(3):1068. https://0-doi-org.brum.beds.ac.uk/10.3390/ijerph17031068
Chicago/Turabian StyleGiménez-Egido, José María, Enrique Ortega, Isidro Verdu-Conesa, Antonio Cejudo, and Gema Torres-Luque. 2020. "Using Smart Sensors to Monitor Physical Activity and Technical–Tactical Actions in Junior Tennis Players" International Journal of Environmental Research and Public Health 17, no. 3: 1068. https://0-doi-org.brum.beds.ac.uk/10.3390/ijerph17031068