High Intensity Interval Training Does Not Have Compensatory Effects on Physical Activity Levels in Older Adults

 , , ,
, , ,
Abstract
:1. Introduction
2. Materials and Methods
2.1. Subjects
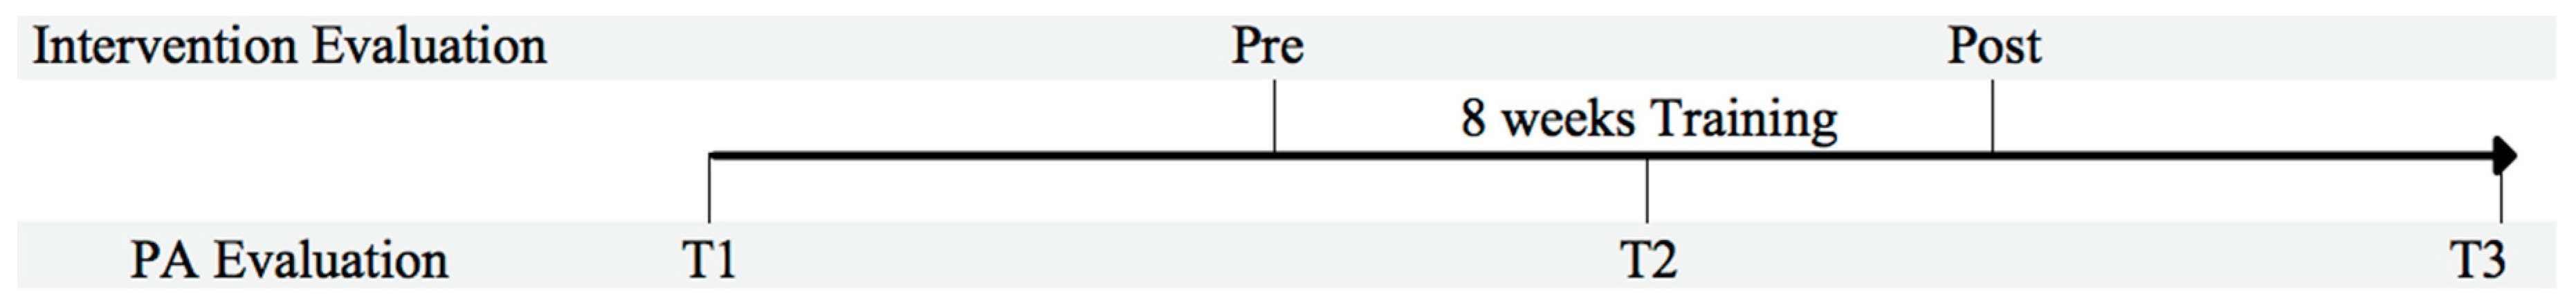
2.2. Study Design
2.3. Anthropometry and Body Composition Assessment
2.4. Cardiorespiratory Fitness Assessment
2.5. Physical Activity and Energy Expenditure Assessment
2.6. Exercise Training Protocols
2.7. Statistics
3. Results
3.1. Anthropometric and Physiological Variables Before and After Training (PRE vs. POST)
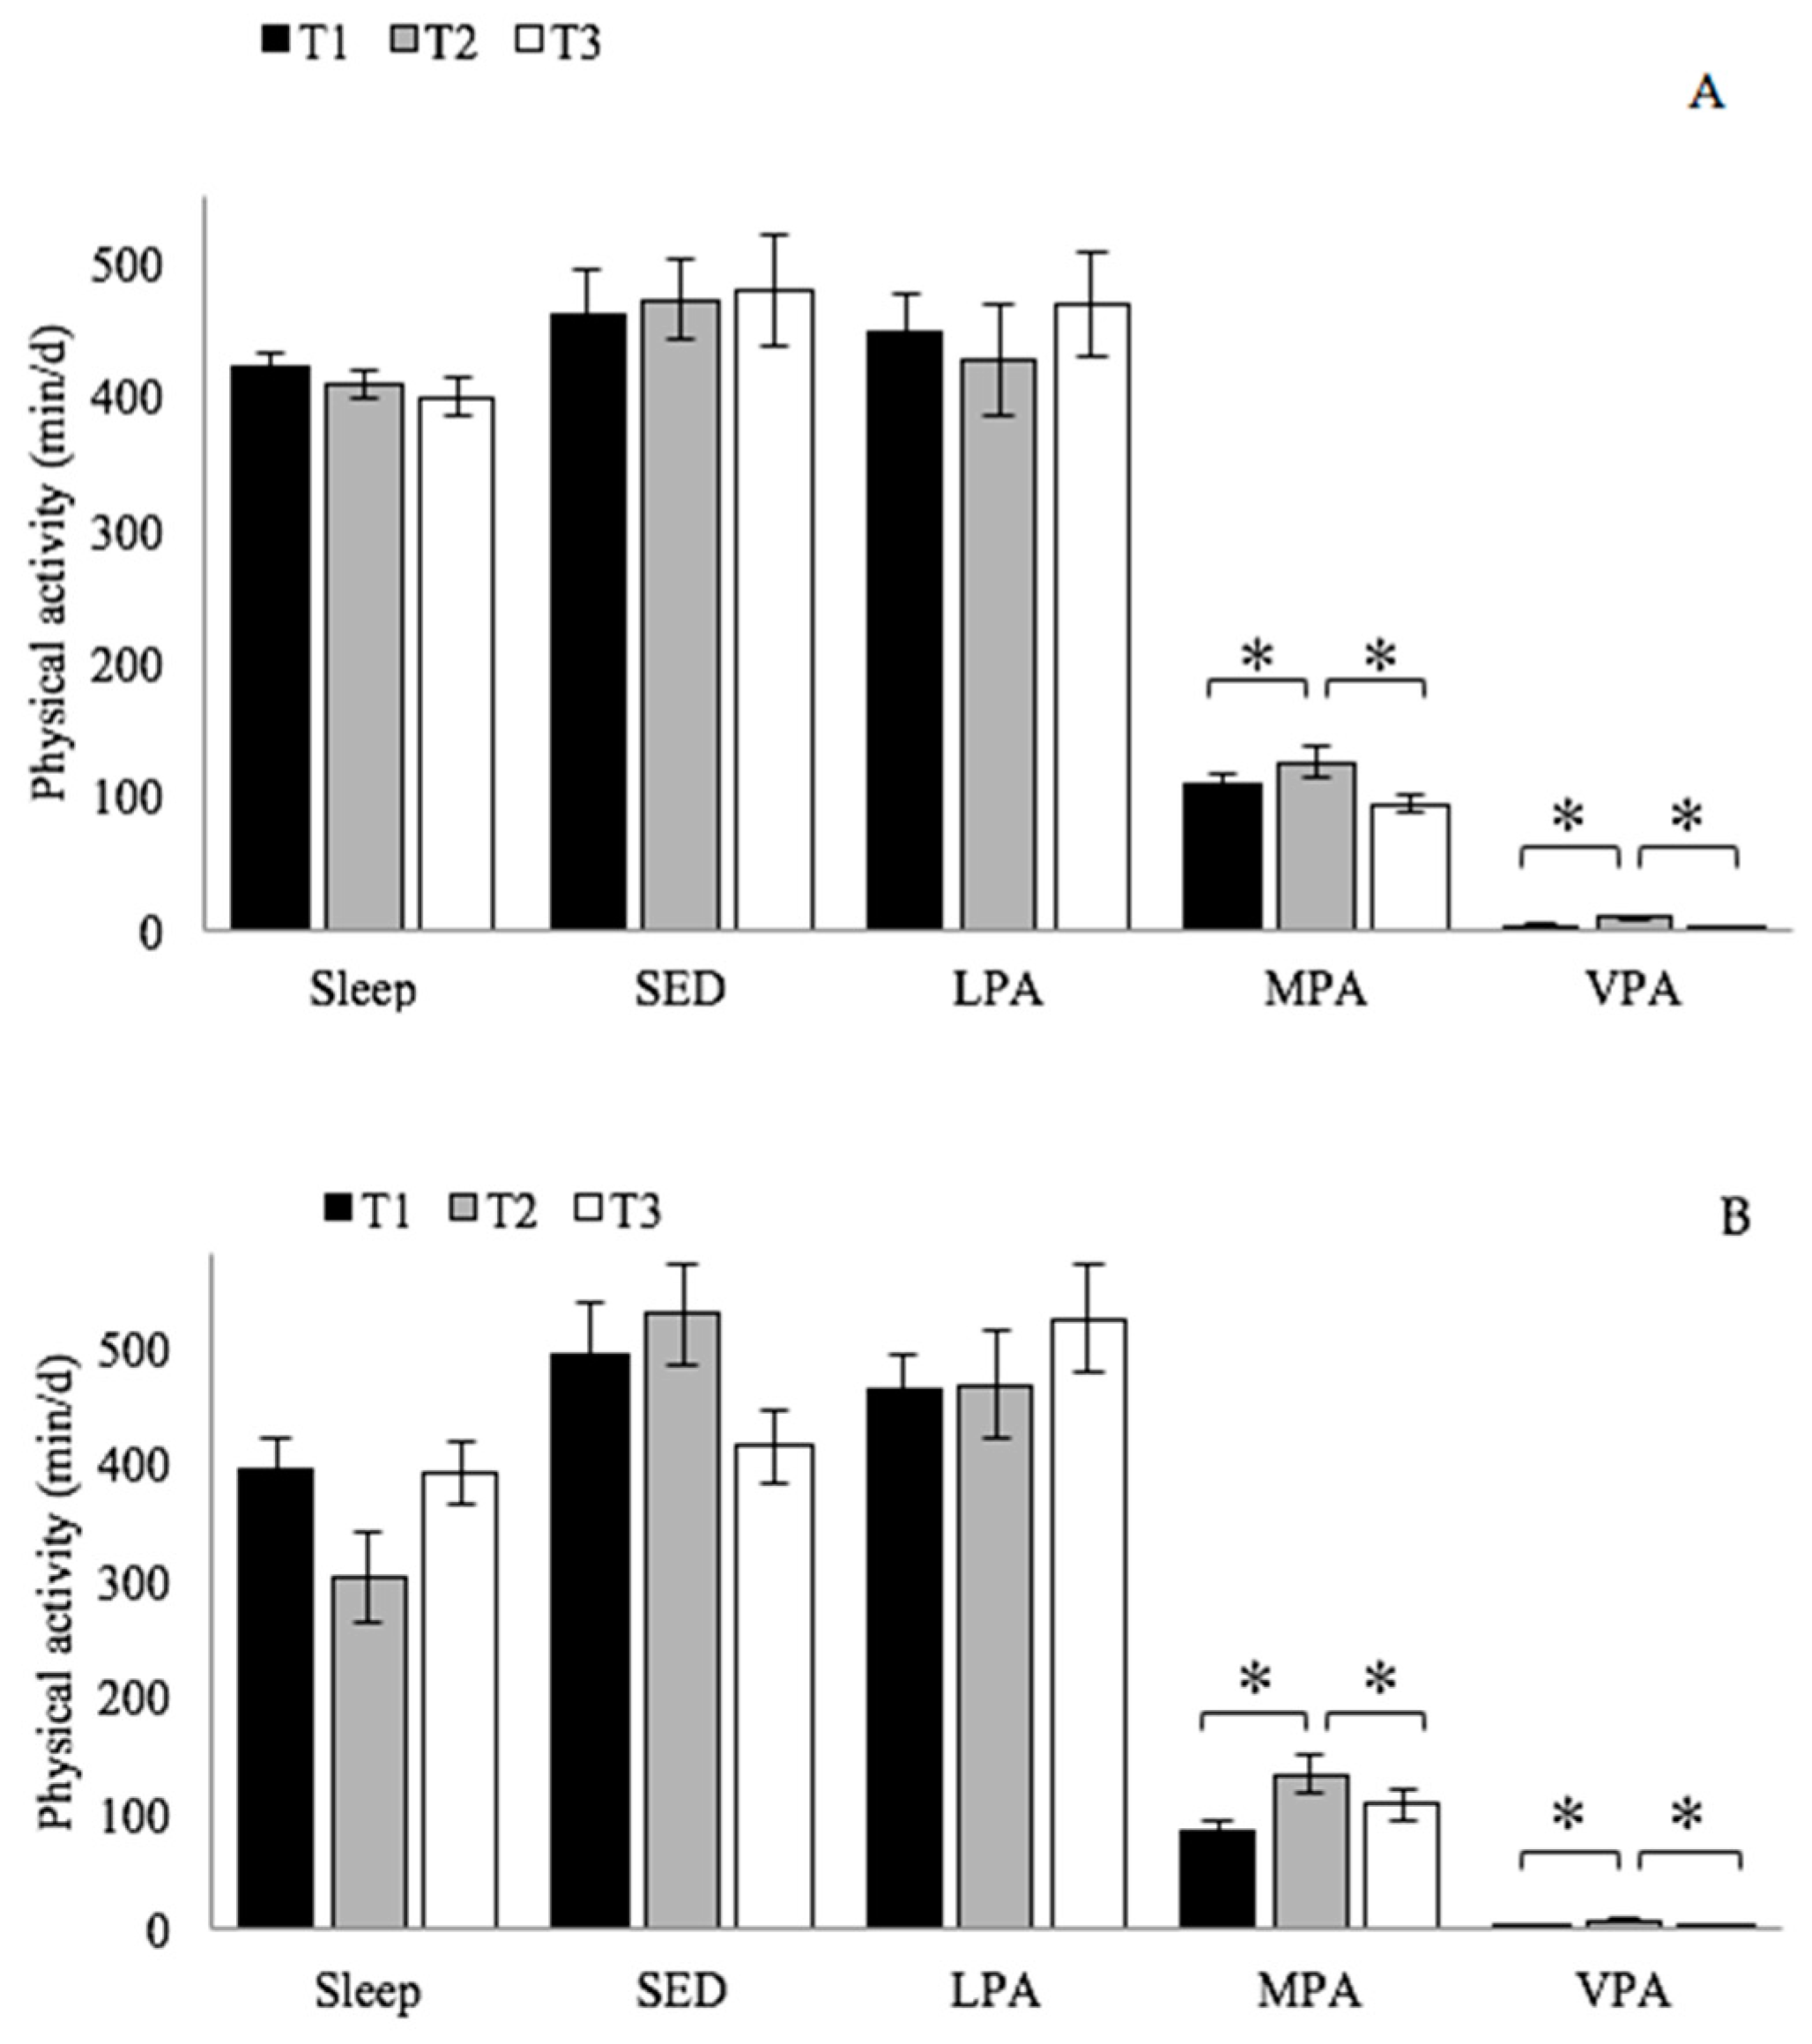
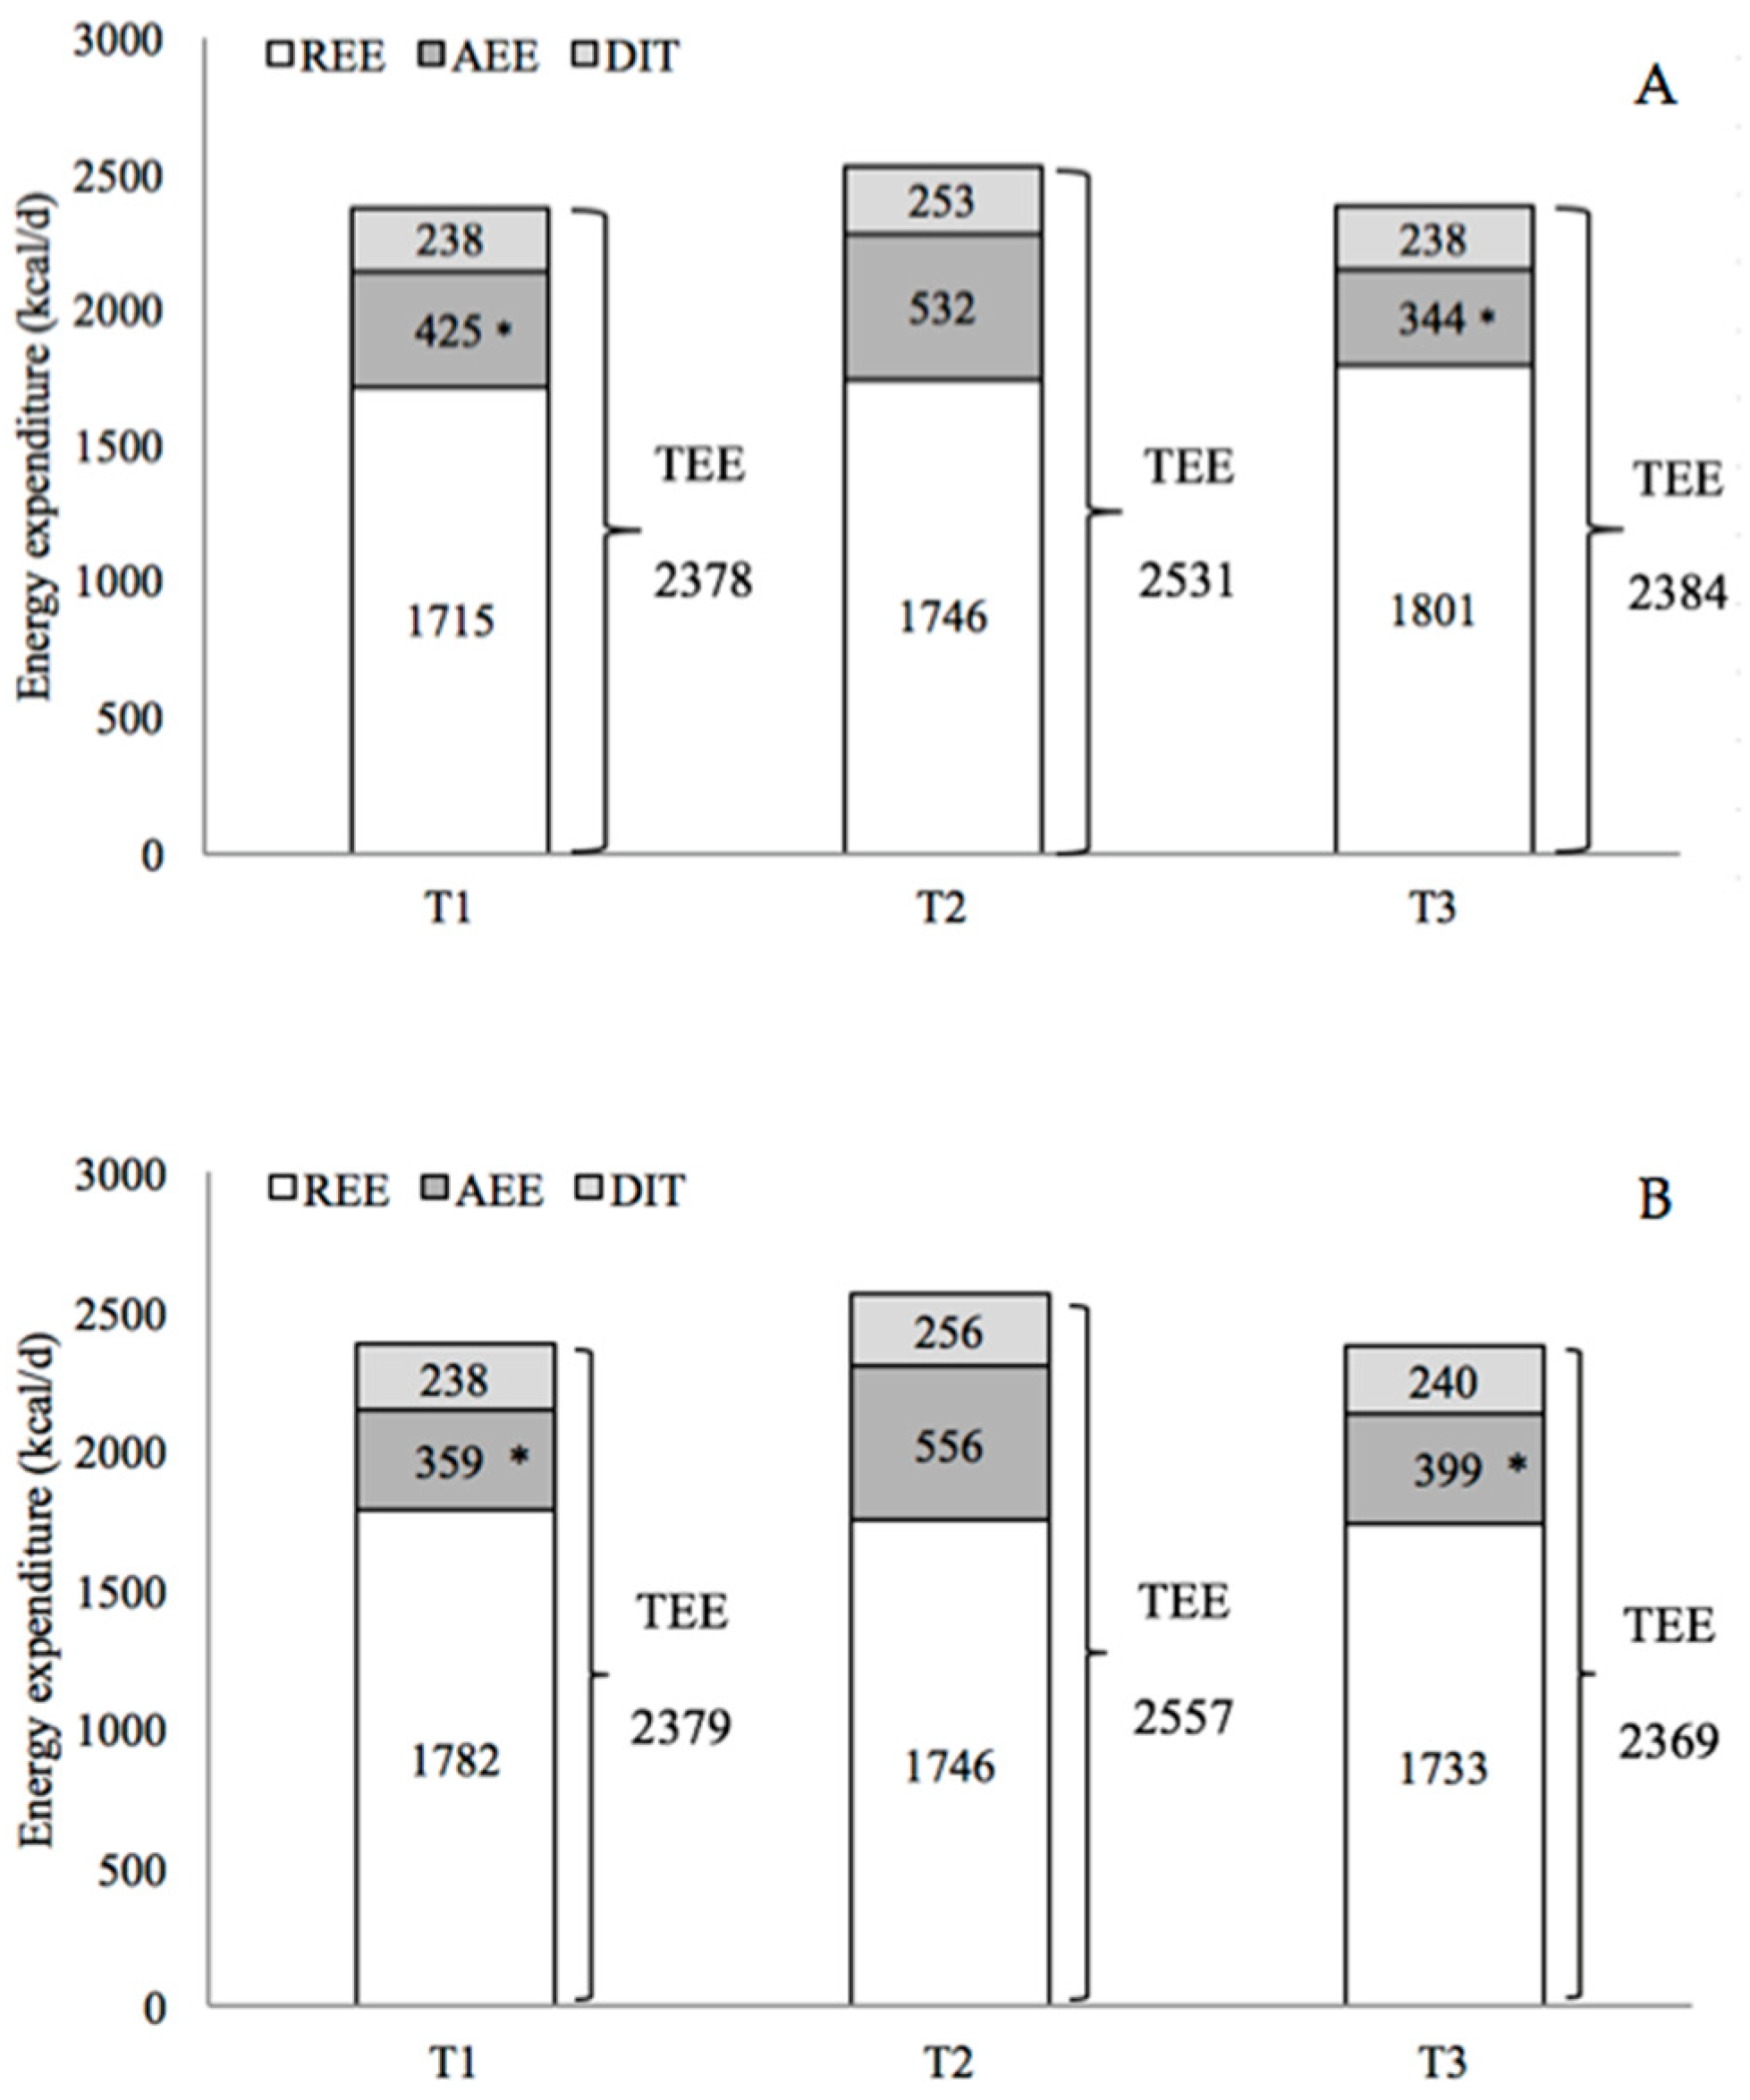
3.2. Changes in Physical Activity and Energy Expenditure Between the Three Time Points (T1 vs. T2 vs. T3)
3.3. Compensatory Effects Analysis (T1 vs. T2)
3.4. Between-Group Differences
4. Discussion
5. Conclusions
Author Contributions
Funding
Acknowledgments
Conflicts of Interest
References
- Fahlman, M.; Morgan, A.; McNevin, N.; Topp, R.; Boardley, D. Combination training and resistance training as effective interventions to improve functioning in elders. J. Aging Phys. Act. 2007, 15, 195–205. [Google Scholar] [CrossRef] [PubMed]
- Taylor, D. Physical activity is medicine for older adults. Postgrad. Med. J. 2014, 90, 26–32. [Google Scholar] [CrossRef] [PubMed] [Green Version]
- Piercy, K.L.; Troiano, R.P.; Ballard, R.M.; Carlson, S.A.; Fulton, J.E.; Galuska, D.A.; George, S.M.; Olson, R.D. The Physical Activity Guidelines for Americans. JAMA 2018, 320, 2020–2028. [Google Scholar] [CrossRef] [PubMed]
- Nocon, M.; Hiemann, T.; Müller-Riemenschneider, F.; Thalau, F.; Roll, S.; Willich, S.N. Association of physical activity with all-cause and cardiovascular mortality: A systematic review and meta-analysis. Eur. J. Cardiovasc. Prev. Rehabil. 2008, 15, 239–246. [Google Scholar] [CrossRef]
- Westerterp, K.R.; Meijer, E.P. Physical activity and parameters of aging: A physiological perspective. J. Gerontol. A Biol. Sci. Med. Sci. 2001, 56, 7–12. [Google Scholar] [CrossRef] [Green Version]
- Lunt, H.; Draper, N.; Marshall, H.C.; Logan, F.J.; Hamlin, M.J.; Shearman, J.P.; Cotter, J.D.; Kimber, N.E.; Blackwell, G.; Frampton, C.M. High intensity interval training in a real world setting: A randomized controlled feasibility study in overweight inactive adults, measuring change in maximal oxygen uptake. PLoS ONE 2014, 9, e83256. [Google Scholar] [CrossRef] [Green Version]
- Wisløff, U.; Nilsen, T.I.; Drøyvold, W.B.; Mørkved, S.; Slørdahl, S.A.; Vatten, L.J. A single weekly bout of exercise may reduce cardiovascular mortality: How little pain for cardiac gain? ‘The HUNT study, Norway’. Eur. J. Cardiovasc. Prev. Rehabil. 2006, 13, 798–804. [Google Scholar] [CrossRef]
- Wisløff, U.; Ellingsen, Ø.; Kemi, O.J. High-intensity interval training to maximize cardiac benefits of exercise training? Exerc. Sport. Sci. Rev. 2009, 37, 139–146. [Google Scholar] [CrossRef]
- Weston, K.S.; Wisløff, U.; Coombes, J. High-intensity interval training in patients with lifestyle-induced cardiometabolic disease: A systematic review and meta-analysis. Br. J. Sport Med. 2014, 48, 1227–1234. [Google Scholar] [CrossRef]
- Bruseghini, P.; Calabria, E.; Tam, E.; Milanese, C.; Oliboni, E.; Pezzato, A.; Pogliaghi, S.; Salvagno, G.L.; Schena, F.; Pozzi Mucelli, R.; et al. Effects of eight weeks of aerobic interval training and of isoinertial resistance training on risk factors of cardiometabolic diseases and exercise capacity in healthy elderly subjects. Oncotarget 2015, 6, 16998–17015. [Google Scholar] [CrossRef] [Green Version]
- Helgerud, J.; Høydal, K.; Wang, E.; Karlsen, T.; Berg, P.; Bjerkaas, M.; Simonsen, T.; Helgesen, C.; Hjorth, N.; Bach, R.; et al. Aerobic high-intensity intervals improve VO2max more than moderate training. Med. Sci. Sports Exerc. 2007, 39, 665–671. [Google Scholar] [CrossRef] [PubMed] [Green Version]
- Nemoto, K.; Gen-no, H.; Masuki, S.; Okazaki, K.; Nose, H. Effects of high-intensity interval walking training on physical fitness and blood pressure in middle-aged and older people. Mayo Clin. Proc. 2007, 82, 803–811. [Google Scholar] [CrossRef] [PubMed]
- Winett, R.A.; Ogletree, A.M. Evidence-Based, High-Intensity Exercise and Physical Activity for Compressing Morbidity in Older Adults: A Narrative Review. Innov. Aging 2019, 3, igz020. [Google Scholar] [CrossRef] [PubMed]
- Vella, C.A.; Taylor, K.; Drummer, D. High-intensity interval and moderate-intensity continuous training elicit similar enjoyment and adherence levels in overweight and obese adults. Eur. J. Sport Sci. 2017, 17, 1203–1211. [Google Scholar] [CrossRef] [PubMed]
- Coetsee, C.; Terblanche, E. The effect of three different exercise training modalities on cognitive and physical function in a healthy older population. Eur. Rev. Aging Phys. Act. 2017, 14, 13. [Google Scholar] [CrossRef] [PubMed]
- Batacan, R.B., Jr.; Duncan, M.J.; Dalbo, V.J.; Tucker, P.S.; Fenning, A.S. Effects of high-intensity interval training on cardiometabolic health: A systematic review and meta-analysis of intervention studies. Br. J. Sports Med. 2017, 51, 494–503. [Google Scholar] [CrossRef]
- Sculthorpe, N.F.; Herbert, P.; Grace, F. One session of high intensity interval training (HIIT) every 5 days, improves muscle power but not static balance in lifelong sedentary ageing men: A randomized controlled trial. Medicine 2017, 96, e6040. [Google Scholar] [CrossRef]
- Karlsen, T.; Aamot, I.L.; Haykowsky, M.; Rognmo, O. High intensity interval training for maximizing health outcomes. Prog. Cardiovasc. Dis. 2017, 60, 67–77. [Google Scholar] [CrossRef] [Green Version]
- Gillen, J.B.; Gibala, M.J. Is high-intensity interval training a time-efficient exercise strategy to improve health and fitness? Appl. Physiol. Nutr. Metab. 2014, 39, 409–412. [Google Scholar] [CrossRef]
- King, N.A.; Caudwell, P.; Hopkins, M.; Byrne, N.M.; Colley, R.; Hills, A.P.; Stubbs, J.R.; Blundell, J.E. Metabolic and behavioral compensatory responses to exercise interventions: Barriers to weight loss. Obesity 2007, 15, 1373–1383. [Google Scholar] [CrossRef]
- King, N.A.; Hopkins, M.; Caudwell, P.; Stubbs, R.J.; Blundell, J.E. Individual variability following 12 weeks of supervised exercise: Identification and characterization of compensation for exercise-induced weight loss. Int. J. Obes. 2008, 32, 177–184. [Google Scholar] [CrossRef] [PubMed] [Green Version]
- Levine, J.A. Non-exercise activity thermogenesis (NEAT). Nut. Rev. 2004, 62, S82–S97. [Google Scholar] [CrossRef] [PubMed]
- Goran, M.I.; Poehlman, E.T. Endurance training does not enhance total energy expenditure in healthy elderly persons. Am. J. Physiol. 1992, 263, E950–E957. [Google Scholar] [CrossRef] [PubMed] [Green Version]
- Wasenius, N.; Venojärvi, M.; Manderoos, S.; Surakka, J.; Lindholm, H.; Heinonen, O.J.; Aunola, S.; Eriksson, J.G.; Mälkiä, E. The effect of structured exercise intervention on intensity and volume of total physical activity. J. Sports Sci. Med. 2014, 13, 829–835. [Google Scholar] [PubMed]
- Wasenius, N.; Venojärvi, M.; Manderoos, S.; Surakka, J.; Lindholm, H.; Heinonen, O.J.; Eriksson, J.G.; Mälkiä, E.; Aunola, S. Unfavorable influence of structured exercise program on total leisure-time physical activity. Scand. J. Med. Sci. Sports 2014, 24, 404–413. [Google Scholar] [CrossRef]
- Meijer, E.P.; Westerterp, K.R.; Verstappen, F.T. Effect of exercise training on total daily physical activity in elderly humans. Eur. J. Appl. Physiol. Occup. Physiol. 1999, 80, 16–21. [Google Scholar] [CrossRef]
- Meijer, E.P.; Goris, A.H.; Wouters, L.; Westerterp, K.R. Physical inactivity as a determinant of the physical activity level in the elderly. Int. J. Obes. Relat. Metab. Disord. 2001, 25, 935–939. [Google Scholar] [CrossRef] [Green Version]
- de Moura, B.P.; Marins, J.C.; Franceschini Sdo, C.; Reis, J.S.; Amorim, P.R. Aerobic exercise did not have compensatory effects on physical activity levels in type 2 diabetes patients. J. Sports Sci. 2015, 33, 545–551. [Google Scholar] [CrossRef] [Green Version]
- Washburn, R.A.; Ficker, J.L. Does participation in a structured high-intensity exercise program influence daily physical activity patterns in older adults? Res. Q. Exerc. Sport 1999, 70, 201–205. [Google Scholar] [CrossRef]
- Hunter, G.R.; Wetzstein, C.J.; Fields, D.A.; Brown, A.; Bamman, M.M. Resistance training increases total energy expenditure and free-living physical activity in older adults. J. Appl. Physiol. 2000, 89, 977–984. [Google Scholar] [CrossRef] [Green Version]
- Mackey, D.C.; Manini, T.M.; Schoeller, D.A.; Koster, A.; Glynn, N.W.; Goodpaster, B.H.; Satterfield, S.; Newman, A.B.; Harris, T.B.; Cummings, S.R. Validation of an armband to measure daily energy expenditure in older adults. J. Gerontol. A Biol. Sci. Med. Sci. 2011, 66, 1108–1113. [Google Scholar] [CrossRef] [PubMed]
- Scheers, T.; Philippaerts, R.; Lefevre, J. Variability in physical activity patterns as measured by the SenseWear Armband:how many days are needed? Eur. J. Appl. Physiol. 2012, 112, 1653–1662. [Google Scholar] [CrossRef] [PubMed]
- Welk, G.J.; Kim, Y.; Stanfill, B.; Osthus, D.A.; Calabro, M.A.; Nusser, S.M.; Carriquiry, A. Validity of 24-h physical activity recall: Physical activity measurement survey. Med. Sci. Sports Exerc. 2014, 46, 2014–2024. [Google Scholar] [CrossRef] [PubMed] [Green Version]
- Poole, D.C.; Wilkerson, D.P.; Jones, A.M. Validity of criteria for establishing maximal O2 uptake during ramp exercise tests. Eur. J. Appl. Physiol. 2008, 102, 403–410. [Google Scholar] [CrossRef] [PubMed]
- Alsaadi, S.M.; McAuley, J.H.; Hush, J.M.; Bartlett, D.J.; McKeough, Z.M.; Grunstein, R.R.; Dungan, G.C., II; Maher, C.G. Assessing sleep disturbance in low back pain: The validity of portable instruments. PLoS ONE 2014, 24, e95824. [Google Scholar] [CrossRef] [PubMed] [Green Version]
- Colbert, L.H.; Matthews, C.E.; Havighurst, T.C.; Kim, K.; Schoeller, D.A. Comparative validity of physical activity measures in older adults. Med. Sci. Sports Exerc. 2011, 43, 867–876. [Google Scholar] [CrossRef] [Green Version]
- Johannsen, D.L.; Calabro, M.A.; Stewart, J.; Franke, W.; Rood, J.C.; Welk, G.J. Accuracy of armband monitors for measuring daily energy expenditure in healthy adults. Med. Sci. Sports Exerc. 2010, 42, 2134–2140. [Google Scholar] [CrossRef]
- Ainsworth, B.E.; Haskell, W.L.; Herrmann, S.D.; Meckes, N.; Bassett, D.R., Jr.; Tudor-Locke, C.; Greer, J.L.; Vezina, J.; Whitt-Glover, M.C.; Leon, A.S. Compendium of Physical Activities: A second update of codes and MET values. Med. Sci. Sports Exerc. 2011, 43, 1575–1581. [Google Scholar] [CrossRef] [Green Version]
- Pate, R.R.; O’Neill, J.R.; Lobelo, F. The evolving definition of “sedentary”. Exerc. Sport Sci. Rev. 2008, 36, 173–178. [Google Scholar] [CrossRef]
- Mendelson, M.; Borowik, A.; Michallet, A.S.; Perrin, C.; Monneret, D.; Faure, P.; Levy, P.; Pépin, J.L.; Wuyam, B.; Flore, P. Sleep quality, sleep duration and physical activity in obese adolescents: Effects of exercise training. Pediatr. Obes. 2016, 11, 26–32. [Google Scholar] [CrossRef]
- Pogliaghi, S.; Terziotti, P.; Cevese, A.; Balestreri, F.; Schena, F. Adaptations to endurance training in the healthy elderly: Arm cranking versus leg cycling. Eur. J. Appl. Physiol. 2006, 97, 723–771. [Google Scholar] [CrossRef] [PubMed]
- Cohen, J. Statistical Power Analysis for the Behavioral Sciences, 2nd ed.; Lawrence Erlbaum Associates: Hillsdale, NJ, USA, 1988. [Google Scholar]
- Ewald, B.; Duke, J.; Thakkinstian, A.; Attia, J.; Smith, W. Physical activity of older Australians measured by pedometry. Australas. J. Ageing 2009, 28, 127–133. [Google Scholar] [CrossRef] [PubMed]
- Dogra, S.; Stathokostas, L. Sedentary behavior and physical activity are independent predictors of successful aging in middle-aged and older adults. J. Aging Res. 2012, 2012, 190654. [Google Scholar] [CrossRef] [PubMed] [Green Version]
- Hobbs, N.; Godfrey, A.; Lara, J.; Errington, L.; Meyer, T.D.; Rochester, L.; White, M.; Mathers, J.C.; Sniehotta, F.F. Are behavioral interventions effective in increasing physical activity at 12 to 36 months in adults aged 55 to 70 years? A systematic review and meta-analysis. BMC Med. 2013, 11, 75. [Google Scholar] [CrossRef] [Green Version]
- Riebe, D.; Ehrman, J.K.; Liguori, G.; Magal, M. ACSM’s Guidelines for Exercise Testing and Prescription, 9th ed.; Wolters Kluwer/Lippincott Williams & Wilkins Health and American College of Sports Medicine: Philadelphia, PA, USA, 2018. [Google Scholar]
- Bruseghini, P.; Capelli, C.; Calabria, E.; Rossi, A.P.; Tam, E. Effects of High-Intensity Interval Training and Isoinertial Training on Leg Extensors Muscle Function, Structure, and Intermuscular Adipose Tissue in Older Adults. Front. Physiol. 2019, 10, 1260. [Google Scholar] [CrossRef]
- Calabria, E.; Mazza, E.M.; Dyar, K.A.; Pogliaghi, S.; Bruseghini, P.; Morandi, C.; Salvagno, G.L.; Gelati, M.; Guidi, G.C.; Bicciato, S.; et al. Aging: A portrait from gene expression profile in blood cells. Aging 2016, 8, 1802–1821. [Google Scholar] [CrossRef] [Green Version]
- Tam, E.; Bruseghini, P.; Capelli, C.; Oliboni, E.; Pezzato, A.; Pogliaghi, S.; Pozzi Mucelli, R.; Schena, F.; Calabria, E. Effect of Endurance and Strength Training on the Slow Component of O2 Kinetics in Elderly Humans. Front. Physiol. 2018, 9, 1353. [Google Scholar] [CrossRef]
- Gibala, M.J.; Little, J.P.; Macdonald, M.J.; Hawley, J.A. Physiological adaptations to low-volume, high-intensity interval training in health and disease. J. Physiol. 2012, 590, 1077–1084. [Google Scholar] [CrossRef]


| EXP | CTRL | |
|---|---|---|
| Age (years) | 69.4 ± 4.3 | 69.67 ± 4.1 |
| Height (cm) | 171.2 ± 5.3 | 171 ± 7.2 |
| Weight (kg) | 77.8 ± 10.4 | 78.3 ± 8.9 |
| BMI (kg/m2) | 26.5 ± 2.8 | 26.8 ± 2.9 |
| PRE EXP | POST EXP | VAR % | PRE CTRL | POST CTRL | Var % | |
|---|---|---|---|---|---|---|
| WC (cm) | 95.2 ± 9.7 | 93.9 ± 9.2 | −1.4 | 98.2 ± 8.5 | 98.3 ± 8.1 | 0.1 |
| WHR | 0.92 ± 0.07 | 0.92 ± 0.06 | 0.0 | 0.95 ± 0.05 | 0.95 ± 0.05 | 0.0 |
| WHtR | 0.56 ± 0.05 | 0.55 ± 0.05 | −1.8 | 0.58 ± 0.06 | 0.58 ± 0.05 | 0.0 |
| WB fat (%) | 26.4 ± 5.9 | 25.2 ± 6.2 | −4.5 | 25.5 ± 4.3 | 25.6 ± 5.3 | 0.4 |
| O2max (mL/min) | 2310 ± 343 | 2485 ± 384 * | 7.6 | 2186 ± 326 | 2352 ± 338 * | 7.6 |
| O2max (mL/kg/min) | 29.9 ± 4.3 | 32.7 ± 6.0 * | 9.2 | 28.3 ± 6 | 30.8 ± 6.1 * | 8.8 |
| T1 | T2 | ||||||
|---|---|---|---|---|---|---|---|
| WE | WD | WE | WD | WD, TD | WD, NTD | ||
| EXP | SED (min/d) | 423 ± 116 | 472 ± 140 | 410 ± 110 | 458 ± 109 | 561 ± 140 | 500 ± 122 |
| LPA (min/d) | 488 ± 115 | 434 ± 132 | 513 ± 150 | 429 ± 144 | 426 ± 148 | 522 ± 147 | |
| MPA (min/d) | 114 ± 46 | 105 ± 31 | 100 ± 48 | 137 ± 53 * | 161 ± 66 $ | 114 ± 55 | |
| VPA (min/d) | 2 ± 2 | 3 ± 2 | 4 ± 6 # | 11 ± 6 *, † | 15 ± 12 $ | 6 ± 6 | |
| MVPA (min/d) | 116 ± 47 | 108 ± 32 | 104 ± 51 | 149 ± 55 *,† | 176 ± 70 $ | 120 ± 59 | |
| Sleep (min/d) | 431 ± 44 | 427 ± 43 | 413 ± 71 | 405 ± 44 | 277 ± 134 | 298 ± 115 | |
| Av. daily METs (MET) | 1.44 ± 0.16 | 1.41 ± 0.12 | 1.42 ± 0.17 | 1.57 ± 0.21* | 1.7 ± 0.28 $ | 1.55 ± 0.25 | |
| AEE (kcal/d) | 421 ± 148 | 427 ± 130 | 383 ± 149 | 606 ± 210 * | 741 ± 299 $ | 467 ± 221 | |
| TEE (kcal/d) | 2373 ± 229 | 2379 ± 285 | 2365 ± 240 | 2613 ± 332 * | 2763 ± 442 $ | 2457 ± 341 | |
| PAL | 1.38 ± 0.11 | 1.38 ± 0.07 | 1.36 ± 0.10 | 1.50 ± 0.13 † | 1.58 ± 0.17 $ | 1.41 ± 0.14 | |
| CTRL | SED (min/d) | 459 ± 138 | 457 ± 112 | 483 ± 119 | 468 ± 133 | 455 ± 105 | 465 ± 106 |
| LPA (min/d) | 459 ± 145 | 439 ± 138 | 509 ± 165 | 461 ± 161 | 432 ± 145 | 430 ± 93 | |
| MPA (min/d) | 102 ± 40 | 115 ± 41 | 119 ± 56 | 92 ± 45 | 133 ± 61 $ | 107 ± 25 | |
| VPA (min/d) | 2 ± 1 | 5 ± 5 | 7 ± 8 # | 4 ± 2 | 9 ± 6 $ | 3 ± 3 | |
| MVPA (min/d) | 104 ± 40, | 120 ± 45 | 127 ± 62 | 94 ± 47 | 142 ± 64 $ | 111 ± 27 | |
| Sleep (min/d) | 418 ± 46 | 425 ± 54 | 321 ± 128 | 418 ± 85 | 411 ± 53 | 434 ± 41 | |
| Av. daily METs (MET) | 1.43 ± 0.13 | 1.51 ± 0.16 | 1.52 ± 0.22 | 1.42 ± 0.17 * | 1.58 ± 0.22 $ | 1.41 ± 0.15 | |
| AEE (kcal/d) | 522 ± 199 | 441 ± 145 | 391 ± 186 | 458 ± 175 | 602 ± 198 $ | 445 ± 104 | |
| TEE (kcal/d) | 2513 ± 228 | 2453 ± 159 | 2361 ± 197 | 2382 ± 233 | 2594 ± 315 $ | 2371 ± 270 | |
| PAL | 1.46 ± 0.16 | 1.40 ± 0.12 | 1.37 ± 0.13 | 1.42 ± 0.14 | 1.50 ± 0.12 $ | 1.41 ± 0.07 | |
© 2020 by the authors. Licensee MDPI, Basel, Switzerland. This article is an open access article distributed under the terms and conditions of the Creative Commons Attribution (CC BY) license (http://creativecommons.org/licenses/by/4.0/).
Share and Cite
Bruseghini, P.; Tam, E.; Calabria, E.; Milanese, C.; Capelli, C.; Galvani, C. High Intensity Interval Training Does Not Have Compensatory Effects on Physical Activity Levels in Older Adults. Int. J. Environ. Res. Public Health 2020, 17, 1083. https://0-doi-org.brum.beds.ac.uk/10.3390/ijerph17031083
Bruseghini P, Tam E, Calabria E, Milanese C, Capelli C, Galvani C. High Intensity Interval Training Does Not Have Compensatory Effects on Physical Activity Levels in Older Adults. International Journal of Environmental Research and Public Health. 2020; 17(3):1083. https://0-doi-org.brum.beds.ac.uk/10.3390/ijerph17031083
Chicago/Turabian StyleBruseghini, Paolo, Enrico Tam, Elisa Calabria, Chiara Milanese, Carlo Capelli, and Christel Galvani. 2020. "High Intensity Interval Training Does Not Have Compensatory Effects on Physical Activity Levels in Older Adults" International Journal of Environmental Research and Public Health 17, no. 3: 1083. https://0-doi-org.brum.beds.ac.uk/10.3390/ijerph17031083