Effects of A Personalized Intervention Program on the Biochemical and Hematological Profile in Community Dwelling Old Adults—The AGA@4life Intervention Model

 , , , and
Abstract
:1. Introduction
2. Material and Methods
2.1. Design and Population
2.2. Statistics
2.3. Ethics
3. Results
4. Discussion
5. Conclusions
Author Contributions
Funding
Acknowledgments
Conflicts of Interest
References
- Bron, D.; Ades, L.; Fulop, T.; Goede, V.; Stauder, R. Elderly Task Force in Hematology, E.S. Aging and blood disorders: New perspectives, new challenges. Haematologica 2015, 100, 415–417. [Google Scholar] [CrossRef] [PubMed] [Green Version]
- Longo, M.; Bellastella, G.; Maiorino, M.I.; Meier, J.J.; Esposito, K.; Giugliano, D. Diabetes and Aging: From Treatment Goals to Pharmacologic Therapy. Front. Endocrinol. 2019, 10, 45. [Google Scholar] [CrossRef] [PubMed]
- Angeloni, S. An ageing world and the challenges for a model of sustainable social change. J. Manag. Dev. 2016, 35, 464–485. [Google Scholar] [CrossRef]
- Barzilai, N.; Cuervo, AM.; Austad, S. Aging as a biological target for prevention and therapy. JAMA 2018, 320, 1321–1322. [Google Scholar] [CrossRef]
- Muller, L.; Di Benedetto, S.; Pawelec, G. The Immune System and Its Dysregulation with Aging. Sub-Cell. Biochem. 2019, 91, 21–43. [Google Scholar]
- Salas-Perez, F.; Ramos-Lopez, O.; Mansego, M.L.; Milagro, F.I.; Santos, J.L.; Riezu-Boj, J.I.; Martinez, J.A. DNA methylation in genes of longevity-regulating pathways: Association with obesity and metabolic complications. Aging 2019, 11, 1874–1899. [Google Scholar] [CrossRef]
- Tchkonia, T.; Kirkland, J.L. Aging, Cell Senescence, and Chronic Disease: Emerging Therapeutic Strategies. JAMA 2018, 320, 1319–1320. [Google Scholar] [CrossRef]
- Conte, M.; Martucci, M.; Sandri, M.; Franceschi, C.; Salvioli, S. The Dual Role of the Pervasive “Fattish” Tissue Remodeling with Age. Front. Endocrinol. 2019, 10, 114. [Google Scholar] [CrossRef] [Green Version]
- Mancuso, P.; Bouchard, B. The Impact of Aging on Adipose Function and Adipokine Synthesis. Front. Endocrinol. 2019, 10, 137. [Google Scholar] [CrossRef] [Green Version]
- St-Onge, M.P.; Gallagher, D. Body composition changes with aging:the cause or the result of alterations in metabolic rate andmacronutrient oxidation? Nutrition 2010, 26, 152–155. [Google Scholar] [CrossRef] [Green Version]
- Tchkonia, T.; Morbeck, D.E.; Von Zglinicki, T.; Van Deursen, J.; Lustgarten, J.; Scrable, H.; Khosla, S.; Jensen, M.D.; Kirkland, J.L. Fat tissue, aging, and cellular senescence. Aging Cell 2010, 9, 667–684. [Google Scholar] [CrossRef] [PubMed]
- Nehlin, J.O.; Jafari, A.; Tencerova, M.; Kassem, M. Aging and lineage allocation changes of bone marrow skeletal (stromal) stem cells. Bone 2019. [Google Scholar] [CrossRef] [PubMed] [Green Version]
- Bishop, M.L.; Fody, E.P.; Schoeff, L.E. Clinical Chemistry: Techniques, Principles, Correlations, 6th ed.; Lippincott Williams & Wilkins: Baltimore, MD, USA, 2010. [Google Scholar]
- Felix-Redondo, F.J.; Grau, M.; Fernandez-Berges, D. Cholesterol and cardiovascular disease in the elderly. Facts and gaps. Aging Dis. 2013, 4, 154–169. [Google Scholar] [PubMed]
- Alencar, Y.M.; de Carvalho Filho, E.T.; Paschoal, S.M.; Curiati, J.A.; Ping, W.C.; Litvoc, J. Risk factors for atherosclerosis in an elderly outpatient population in the city of Sao Paulo. Arq. Bras. Cardiol. 2000, 74, 181–196. [Google Scholar] [CrossRef] [PubMed] [Green Version]
- Kaushansky, K.; Lichtman, M.; Prchal, J.; Levi, M.; Press, O.; Burns, L.; Caligiuri, M. Williams Hematology, 9th ed.; McGraw-Hill Education LLC.: New York, NY, USA, 2016. [Google Scholar]
- Ellis, G.; Gardner, M.; Tsiachristas, A.; Langhorne, P.; Burke, O.; Harwood, R.H.; Conroy, S.P.; Kircher, T.; Somme, D.; Saltvedt, I.; et al. Comprehensive geriatric assessment for older adults admitted to hospital. Cochrane Database Syst. Rev. 2017, 9, CD006211. [Google Scholar] [CrossRef] [PubMed] [Green Version]
- Ward, K.; Reuben, D. Comprehensive Geriatric Assessment. UptoDate: 2016; pp. 1–14. Available online: http://www.uptodate.com/contents/comprehensive-geriatric-assessment (accessed on 22 January 2020).
- Devons, C.A. Comprehensive geriatric assessment: Making the most of the aging years. Curr. Opin. Clin. Nutr. Metab. Care 2002, 5, 19–24. [Google Scholar] [CrossRef]
- Elsawy, B.; Higgins, K.E. The geriatric assessment. Am. Fam. Physician 2011, 83, 48–56. [Google Scholar]
- Osterweil, D.; Brummel-Smith, K.; Beck, J.C. Comprehensive Geriatric Assessment; McGraw-Hill, Medical Pub. Division: New York, NY, USA, 2001; pp. 787–799. [Google Scholar]
- Pereira, T.; Cipriano, I.; Costa, T.; Saraiva, M.; Martins, A.; Consortium, A.G.L. Exercise, ageing and cognitive function—Effects of a personalized physical exercise program in the cognitive function of older adults. Physiol. Behav. 2019, 202, 8–13. [Google Scholar] [CrossRef]
- Pereira, T. Abordagem Geriátrica Ampla Na Promoção de Um Envelhecimento Ativo e Saudável; Instituto Politécnico de Coimbra: Coimbra, Portugal, 2019; Volume 17, pp. 13–22. [Google Scholar]
- Lopes, C.; Fernandes, P.V.; Cabral, S.; Barros, H. Questionários de frequência alimentar: Efeitos da extensão da listas de alimentos na classificação dos inquiridos. Arq Med. 1994, 8, 291–294. [Google Scholar]
- Loureiro, M.H. Validação do Mini Nutritional Assessment em Idosos Portugueses. Master’s Thesis, Tese de Mestrado, Universidade de Coimbra, Coimbra, Portugal, 2008. [Google Scholar]
- Dong, M.H.; Bettencourt, R.; Barrett-Connor, E.; Loomba, R. Alanine aminotransferase decreases with age: The Rancho Bernardo Study. PLoS ONE 2010, 5, e14254. [Google Scholar] [CrossRef] [Green Version]
- Bain, B.J.; Bates, I.; Laffan, M. Dacie and Lewis Practical Haematology, 12th ed.; Elsevier: Philadelphia, PA, USA, 2016; p. 600. [Google Scholar]
- Christensen, K.; Doblhammer, G.; Rau, R.; Vaupel, J.W. Ageing populations: The challenges ahead. Lancet 2009, 374, 1196–1208. [Google Scholar] [CrossRef] [Green Version]
- McDaniel, S.A.; Zimmer, Z. Global Ageing in the Twenty-First Century: Challenges, Opportunities and Implications; Ashgate: Farnham, UK; Burlington, VT, USA, 2013. [Google Scholar]
- Fried, L.P.; Ferrucci, L.; Darer, J.; Williamson, J.D.; Anderson, G. Untangling the concepts of disability, frailty, and comorbidity: Implications for improved targeting and care. J. Gerontol. Ser. A Biol. Sci. Med. Sci. 2004, 59, 255–263. [Google Scholar] [CrossRef] [PubMed] [Green Version]
- Marengoni, A.; Angleman, S.; Meinow, B.; Santoni, G.; Mangialasche, F.; Rizzuto, D.; Fastbom, J.; Melis, R.; Parker, M.; Johnell, K.; et al. Coexisting chronic conditions in the older population: Variation by health indicators. Eur. J. Intern. Med. 2016, 31, 29–34. [Google Scholar] [CrossRef] [PubMed]
- Garasto, S.; Fusco, S.; Corica, F.; Rosignuolo, M.; Marino, A.; Montesanto, A.; De Rango, F.; Maggio, M.; Mari, V.; Corsonello, A.; et al. Estimating glomerular filtration rate in older people. BioMed Res. Int. 2014, 2014, 916542. [Google Scholar] [CrossRef] [PubMed] [Green Version]
- Joy, M.S.; Matzke, G.R. Nephrology pharmacy: Historical reflections and future challenges. Ann. Pharmacother. 2007, 41, 1884–1886. [Google Scholar] [CrossRef]
- Klein, S. The myth of serum albumin as a measure of nutritional status. Gastroenterology 1990, 99, 1845–1846. [Google Scholar] [CrossRef]
- Mann, S.; Beedie, C.; Jimenez, A. Differential effects of aerobic exercise, resistance training and combined exercise modalities on cholesterol and the lipid profile: Review, synthesis and recommendations. Sports Med. 2014, 44, 211–221. [Google Scholar] [CrossRef] [Green Version]
- Guyton, A.C.; John, E.; Hall, A.C.G. Tratado de Fisiologia Medica; Elsevier: Rio de Janeiro, Brasil, 2006. [Google Scholar]
- Malik, S.U.F.; Mahmud, Z.; Alam, J.; Islam, M.S.; Azad, A.K. Relationship among obesity, blood lipids and insulin resistance in Bangladeshi adults. Diabetes Metab. Syndr. 2019, 13, 444–449. [Google Scholar] [CrossRef]
- Hernandez-Lepe, M.A.; Lopez-Diaz, J.A.; Rosa, L.A.; Hernandez-Torres, R.P.; Wall-Medrano, A.; Juarez-Oropeza, M.A.; Pedraza-Chaverri, J.; Urquidez-Romero, R.; Ramos-Jimenez, A. Double-blind randomised controlled trial of the independent and synergistic effect of Spirulina maxima with exercise (ISESE) on general fitness, lipid profile and redox status in overweight and obese subjects: Study protocol. BMJ Open 2017, 7, e013744. [Google Scholar] [CrossRef]
- Branco, B.H.M.; Valladares, D.; de Oliveira, F.M.; Carvalho, I.Z.; Marques, D.C.; Coelho, A.A.; de Oliveira, L.P.; Bertolini, S. Effects of the Order of Physical Exercises on Body Composition, Physical Fitness, and Cardiometabolic Risk in Adolescents Participating in an Interdisciplinary Program Focusing on the Treatment of Obesity. Front. Physiol. 2019, 10, 1013. [Google Scholar] [CrossRef] [Green Version]
- Baran, J.; Weres, A.; Czenczek-Lewandowska, E.; Wyszynska, J.; Luszczki, E.; Deren, K.; Sobek, G.; Wiech, P. Blood lipid profile and body composition in a pediatric population with different levels of physical activity. Lipids Health Dis. 2018, 17, 171. [Google Scholar] [CrossRef] [PubMed] [Green Version]
- Rego, M.L.; Cabral, D.A.; Costa, E.C.; Fontes, E.B. Physical Exercise for Individuals with Hypertension: It Is Time to Emphasize Its Benefits on the Brain and Cognition. Clin. Med. Insights Cardiol. 2019, 13, 1179546819839411. [Google Scholar] [CrossRef] [PubMed]
- Achi, N.K.; Ohaeri, O.C.; Ijeh, I.I.; Eleazu, C. Modulation of the lipid profile and insulin levels of streptozotocin induced diabetic rats by ethanol extract of Cnidoscolus aconitifolius leaves and some fractions: Effect on the oral glucose tolerance of normoglycemic rats. Biomed. Pharmacother. Biomed. Pharmacother. 2017, 86, 562–569. [Google Scholar] [CrossRef] [PubMed]
- Takehara, K.; Ganchimeg, T.; Kikuchi, A.; Gundegmaa, L.; Altantsetseg, L.; Aoki, A.; Fukuie, T.; Suwabe, K.; Bat-Erdene, S.; Mikami, M.; et al. The effectiveness of exercise intervention for academic achievement, cognitive function, and physical health among children in Mongolia: A cluster RCT study protocol. BMC Public Health 2019, 19, 697. [Google Scholar] [CrossRef] [PubMed] [Green Version]
- Chan, J.S.Y.; Liu, G.; Liang, D.; Deng, K.; Wu, J.; Yan, J.H. Special Issue—Therapeutic Benefits of Physical Activity for Mood: A Systematic Review on the Effects of Exercise Intensity, Duration, and Modality. J. Psychol. 2019, 153, 102–125. [Google Scholar] [CrossRef] [PubMed]
- Desideri, G.; Castaldo, G.; Lombardi, A.; Mussap, M.; Testa, A.; Pontremoli, R.; Punzi, L.; Borghi, C. Is it time to revise the normal range of serum uric acid levels? Eur. Rev. Med. Pharmacol. Sci. 2014, 18, 1295–1306. [Google Scholar]
- Musch, W.; Verfaillie, L.; Decaux, G. Age-related increase in plasma urea level and decrease in fractional urea excretion: Clinical application in the syndrome of inappropriate secretion of antidiuretic hormone. Clin. J. Am. Soc. Nephrol. 2006, 1, 909–914. [Google Scholar] [CrossRef] [Green Version]
- Verma, M.; Khadapkar, R.; Sahu, P.S.; Das, B.R. Comparing age-wise reference intervals for serum creatinine concentration in a “Reality check” of the recommended cut-off. Indian J. Clin. Biochem. 2006, 21, 90–94. [Google Scholar] [CrossRef] [Green Version]
- Boland, B.S.; Dong, M.H.; Bettencourt, R.; Barrett-Connor, E.; Loomba, R. Association of serum bilirubin with aging and mortality. J. Clin. Exp. Hepatol. 2014, 4, 1–7. [Google Scholar] [CrossRef]
- Assuncao, L.G.; Eloi-Santos, S.M.; Peixoto, S.V. High sensitivity C-reactive protein distribution in the elderly: The Bambui Cohort Study, Brazil. Braz. J. Med. Biol. Res. 2012, 45, 1284–1286. [Google Scholar] [CrossRef]
- Mahlknecht, U.; Kaiser, S. Age-related changes in peripheral blood counts in humans. Exp. Ther. Med. 2010, 1, 1019–1025. [Google Scholar] [CrossRef] [PubMed] [Green Version]
- Pritz, T.; Weinberger, B.; Grubeck-Loebenstein, B. The aging bone marrow and its impact on immune responses in old age. Immunol. Lett. 2014, 162, 310–315. [Google Scholar] [CrossRef] [PubMed]


| Parameters | Units | CG (n = 7) | IG (n = 11) | Reference Values | |||||
|---|---|---|---|---|---|---|---|---|---|
| T0 | T1 | p | T0 | T1 | p | Male | Female | ||
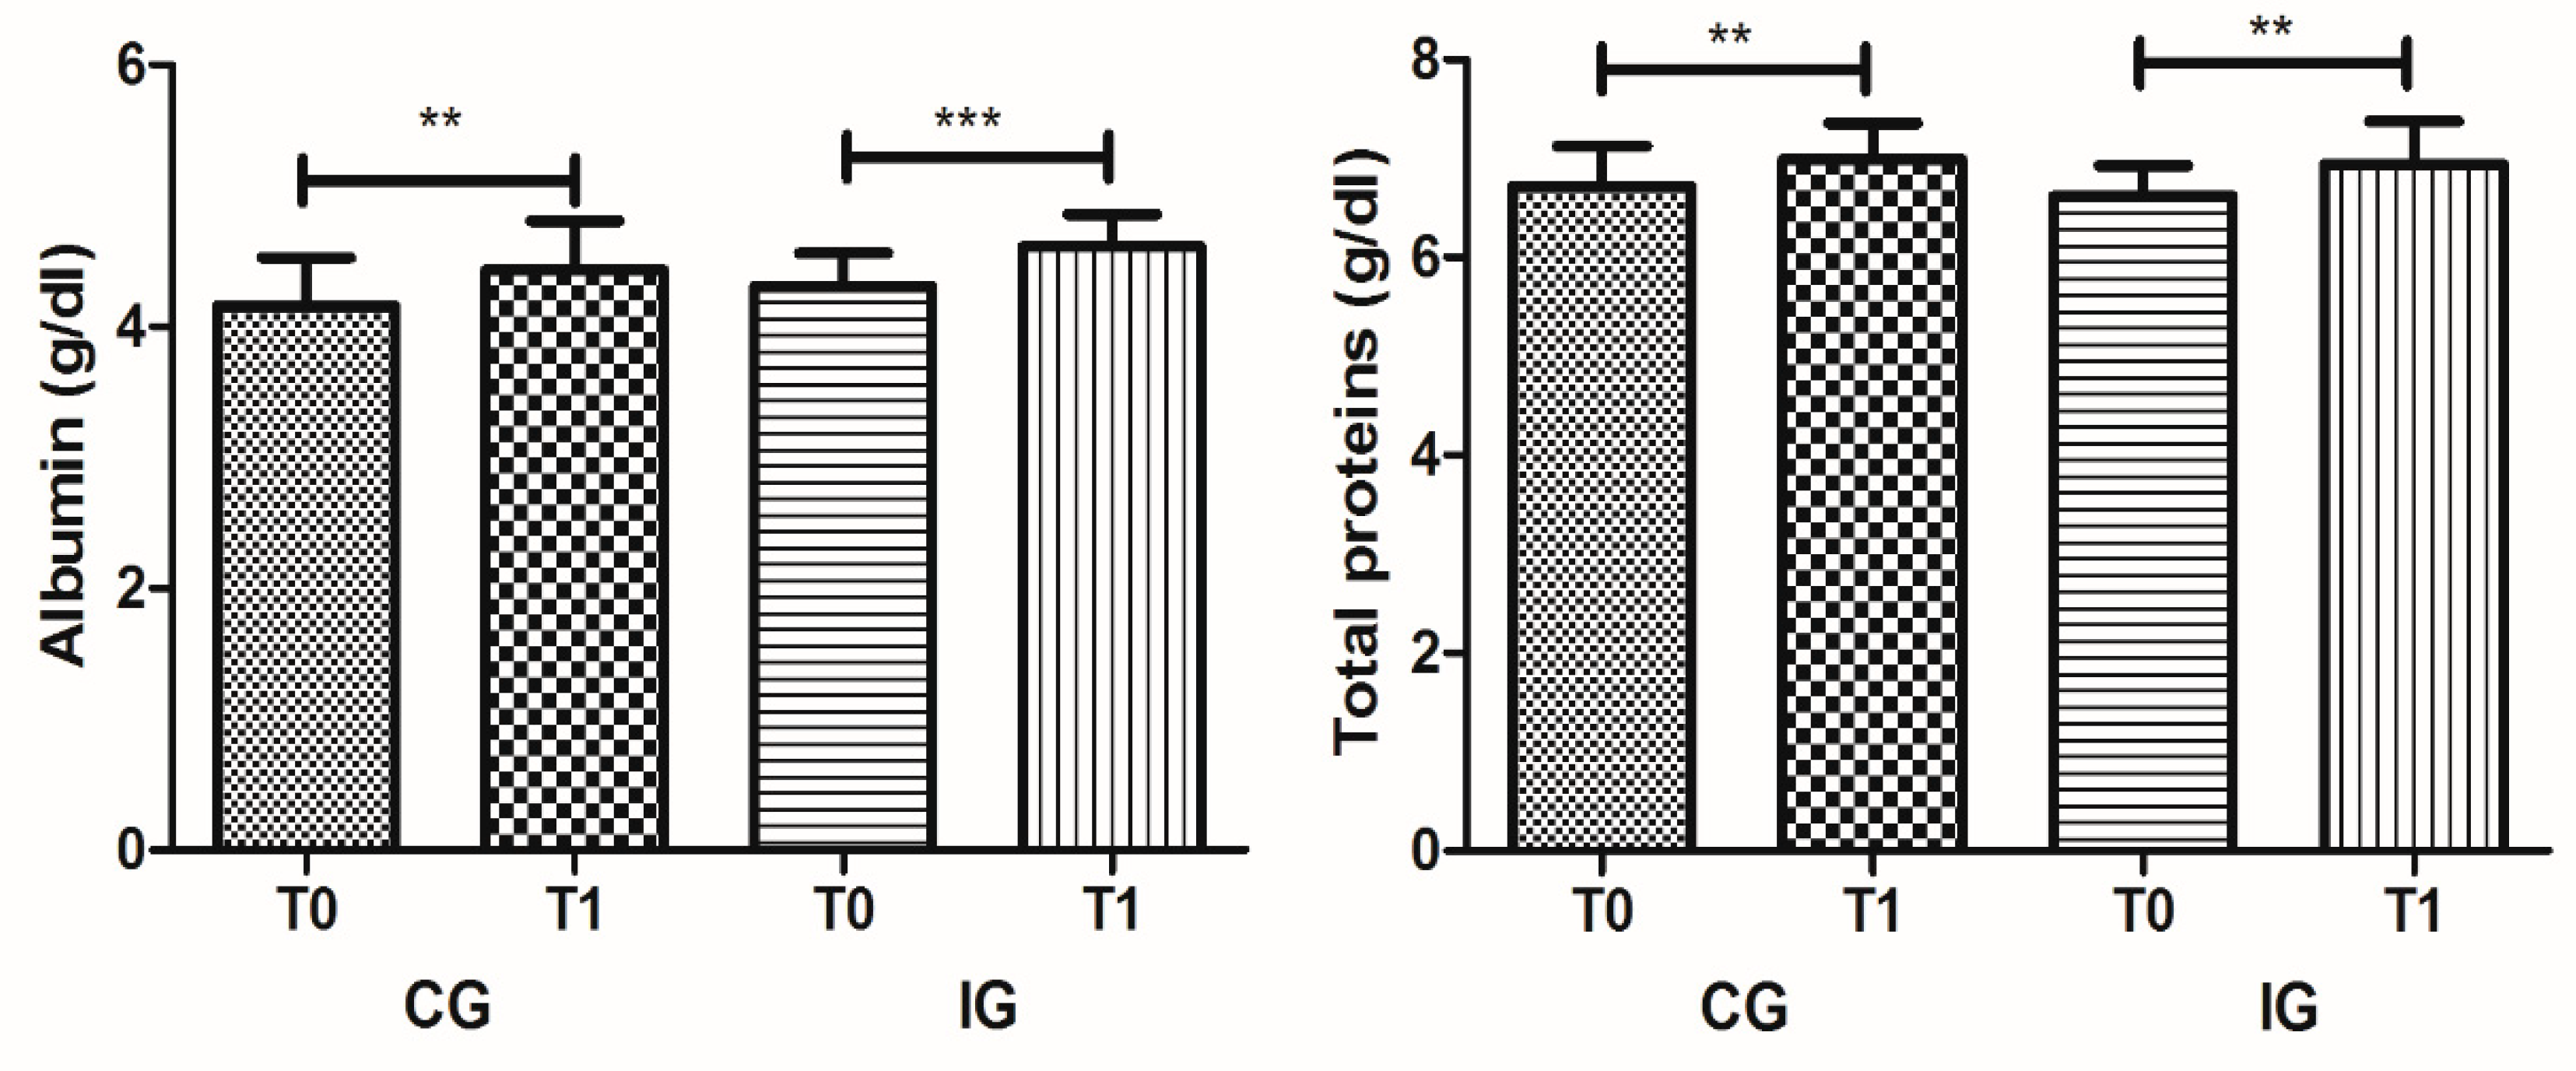
| Albumin | g/dL | 4.16 ± 0.37 | 4.43 ± 0.37 | 0.002 | 4.31 ± 0.25 | 4.61 ± 0.25 | <0.001 | 3.0–5.0 | 3.0–5.0 |
| Total proteins | g/dL | 6.71 ± 0.41 | 6.99 ± 0.36 | 0.003 | 6.62 ± 0.31 | 6.93 ± 0.44 | 0.004 | 6.0–8.0 | 6.0–8.0 |
| Total bilirubin | g/dL | 0.51 ± 0.15 | 0.54 ± 0.14 | n.s | 0.60 ± 0.30 | 0.56 ± 0.18 | n.s | 0.3–1.2 | 0.3–1.2 |
| Total cholesterol | mg/dL | 178.90 ± 55.62 | 177.89 ± 33.97 | n.s | 180.23 ± 35.18 | 181.69 ± 33.98 | n.s | <200 | <200 |
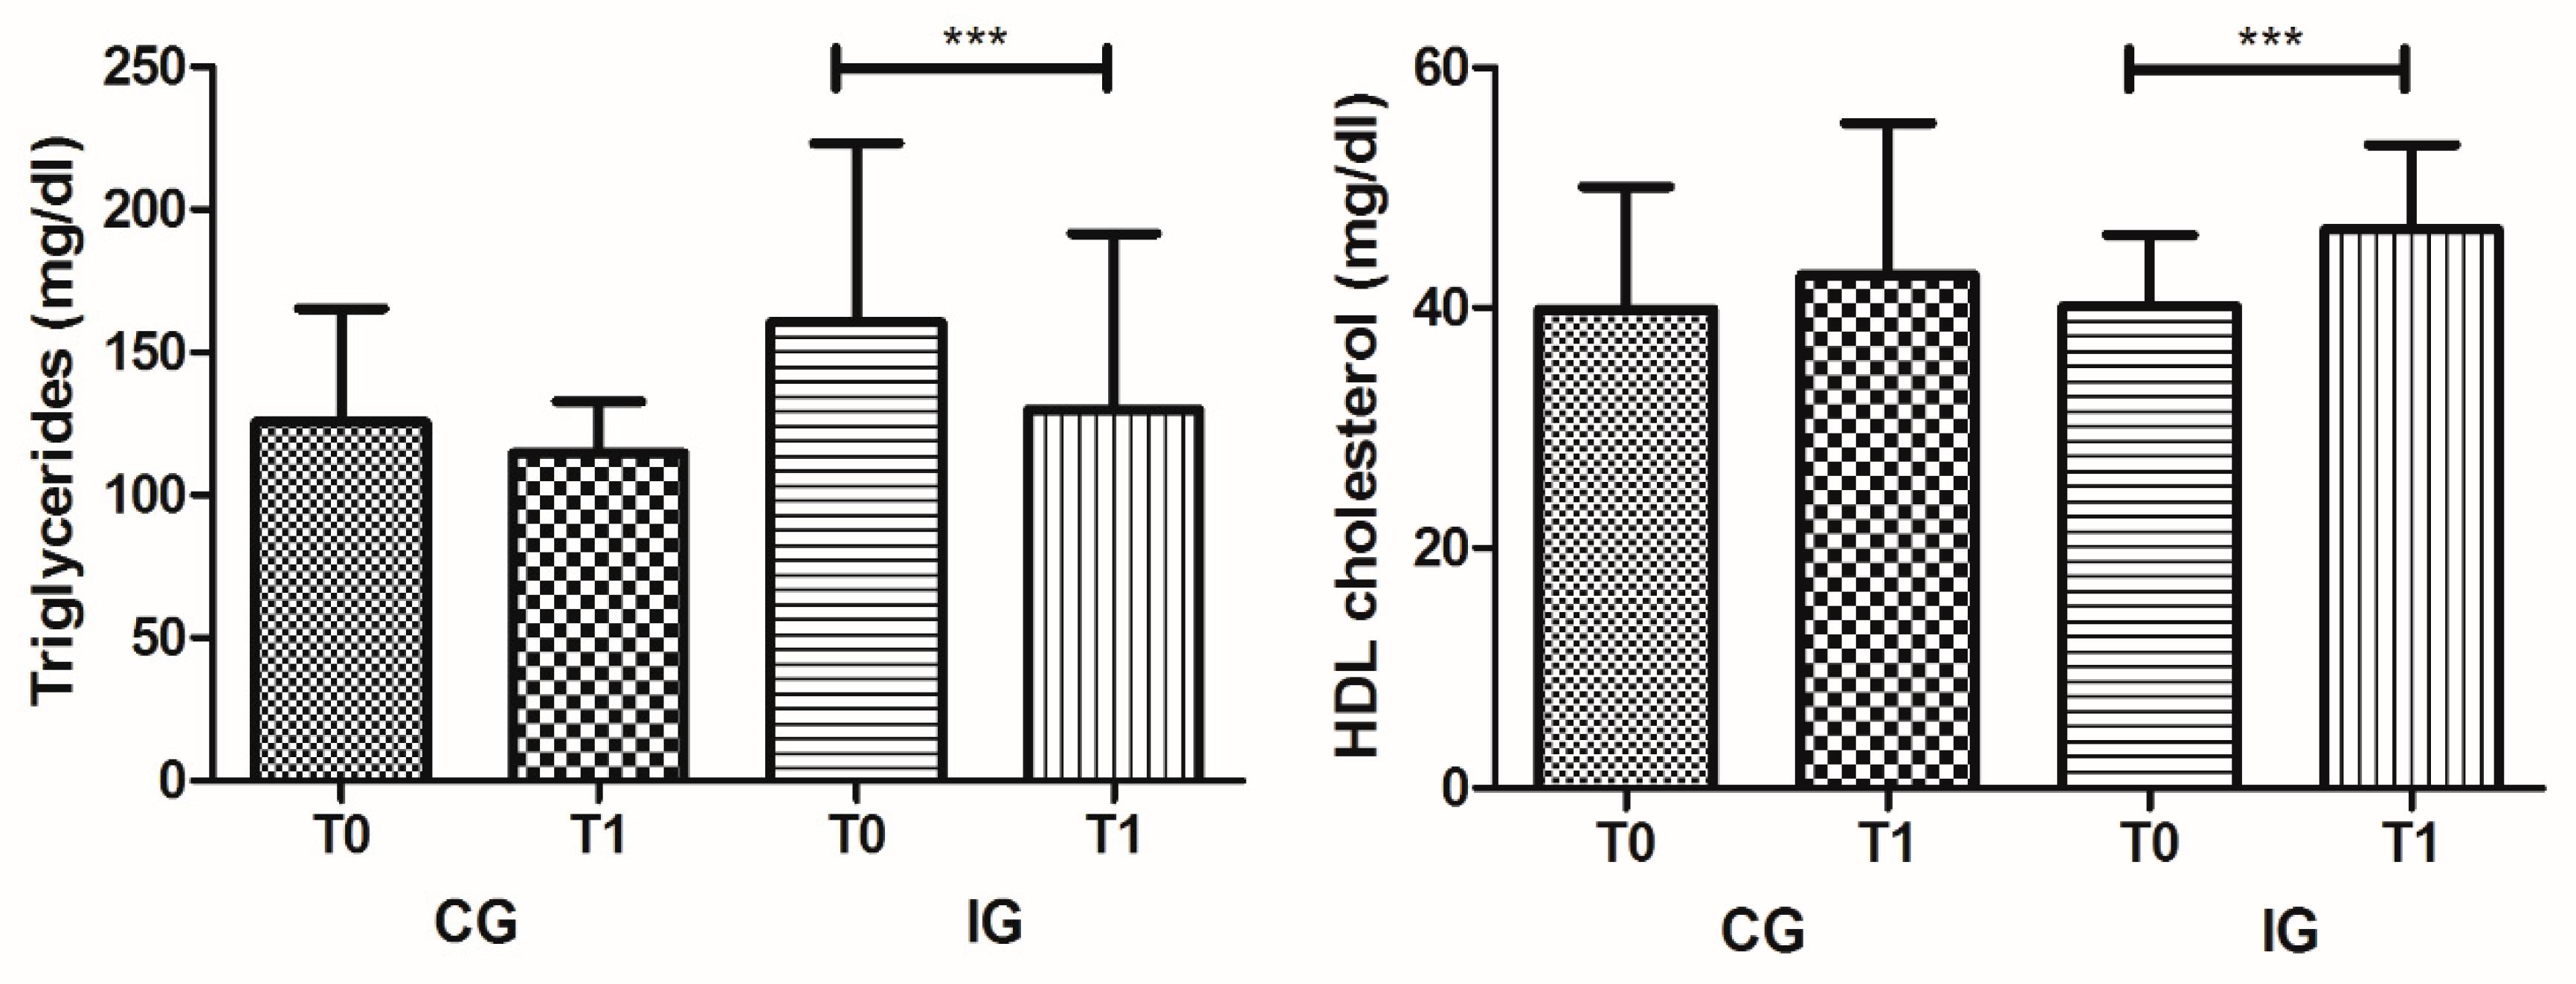
| HDL cholesterol | mg/dL | 39.86 ± 10.21 | 42.70 ± 12.67 | n.s | 40.11 ± 5.98 | 46.54 ± 7.03 | <0.001 | >55 | >60 |
| LDL cholesterol | mg/dL | 130.69 ± 48.87 | 125.22 ± 27.14 | n.s | 128.95 ± 33.65 | 123.83 ± 33.33 | n.s | <100 | <100 |
| Glucose | mg/dL | 107.81 ± 39.85 | 106.37 ± 29.35 | n.s | 126.91 ± 91.63 | 121.77 ± 61.56 | n.s | 74–106 | 74–106 |
| Creatinine | mg/dL | 0.72 ± 0.12 | 0.77 ± 0.21 | n.s | 0.77 ± 0.16 | 0.73 ± 0.12 | n.s | 0.7–1.3 | 0.6–1.1 |
| Uric acid | mg/dL | 5.79 ± 1.31 | 6.00 ± 1.48 | n.s | 5.47 ± 1.76 | 4.94 ± 1.58 | 0.022 | 3.6–7.7 | 2.5–6.8 |
| Urea | mg/dL | 41.77 ± 16.10 | 49.84 ± 24.59 | n.s | 55.84 ± 14.30 | 56.64 ± 12.45 | n.s | <50 | <50 |
| Triglycerides | mg/dL | 125.60 ± 39.75 | 114.77 ± 18.12 | n.s | 160.49 ± 62.78 | 129.99 ± 61.62 | 0.001 | <200 | <200 |
| Alanine aminotransferase | IU/L | 23.06 ± 15.70 | 23.19 ± 13.71 | n.s | 19.33 ± 5.54 | 19.51 ± 7.32 | n.s | <42 | <32 |
| Aspartate aminotransferase | IU/L | 22.40 ± 12.37 | 22.43 ± 10.12 | n.s | 20.78 ± 6.14 | 19.73 ± 4.93 | n.s | <37 | <31 |
| Amylase | IU/L | 53.59 ± 14.03 | 58.55 ± 17.74 | n.s | 48.04 ± 25.75 | 70.01 ± 35.99 | n.s | 28–100 | 28–100 |
| Lactate dehydrogenase | IU/L | 377.47 ± 115.74 | 373.96 ± 120.01 | n.s | 361.29 ± 64.70 | 374.38 ± 52.97 | n.s | 225–450 | 225–450 |
| Alkaline phosphatase | IU/L | 116.71 ± 78.85 | 105.71 ± 58.63 | n.s | 65.55 ± 30.03 | 66.55 ± 21.54 | n.s | 56–119 | 53–141 |
| γ-glutamyl transferase | IU/L | 34.50 ± 24.72 | 32.66 ± 19.42 | n.s | 35.41 ± 35.12 | 31.43 ± 31.24 | n.s | <55 | <40 |
| Creatine kinase | IU/L | 86.29 ± 47.32 | 100.97 ± 45.75 | n.s | 87.62 ± 43.87 | 69.62 ± 29.47 | n.s | <190 | <167 |
| Calcium | mg/dL | 8.80 ± 0.36 | 8.49 ± 0.41 | 0.020 | 8.53 ± 0.38 | 8.36 ± 0.40 | n.s | 8–11 | 8–11 |
| C-reactive protein | mg/L | 1.05 ± 1.05 | 1.19 ± 2.01 | n.s | 0.25 ± 0.19 | 0.49 ± 0.83 | n.s | <5 | <5 |
| Parameters | Units | CG (n = 7) | IG (n = 11) | Reference Values [27] | |||||
|---|---|---|---|---|---|---|---|---|---|
| T0 | T1 | p | T0 | T1 | p | Male | Female | ||
| WBC | × 109/L | 9.17 ± 1.82 | 9.04 ± 1.84 | n.s | 5.94 ± 1.01 | 6.27 ± 1.71 | n.s | 4–10 | 4–10 |
| NEU | × 109/L | 5.61 ± 1.84 | 5.35 ± 1.99 | 0.016 | 3.58 ± 0.64 | 4.00 ± 1.29 | n.s | 2–7 | 2–7 |
| LYM | × 109/L | 2.28 ± 0.84 | 2.48 ± 1.00 | n.s | 1.75 ± 0.70 | 1.63 ± 0.54 | n.s | 1.0–3.0 | 1.0–3.0 |
| MON | × 109/L | 0.71 ± 0.32 | 0.67 ± 0.24 | n.s | 0.43 ± 0.12 | 0.48 ± 0.17 | n.s | 0.2–1.0 | 0.2–1.0 |
| EOS | × 109/L | 0.49 ± 0.41 | 0.49 ± 0.47 | n.s | 0.13 ± 0.06 | 0.11 ± 0.06 | n.s | 0.02–0.5 | 0.02–0.5 |
| BAS | × 109/L | 0.07 ± 0.04 | 0.06 ± 0.03 | n.s | 0.05 ± 0.03 | 0.05 ± 0.03 | n.s | 0.02–0.1 | 0.02–0.1 |
| RBCi | × 1012/L | 4.41 ± 0.41 | 4.76 ± 0.52 | 0.005 | 3.97 ± 0.52 | 4.31 ± 0.56 | 0.012 | 4.5–5.5 | 3.8–4.8 |
| RBCo | × 1012/L | 4.40 ± 0.38 | 4.70 ± 0.47 | 0.007 | 3.98 ± 0.48 | 4.29 ± 0.54 | 0.013 | 4.5–5.5 | 3.8–4.8 |
| HGB | g/L | 127.3 ± 20.1 | 134.4 ± 22.8 | 0.040 | 127.0 ± 18.1 | 135.6 ± 17.4 | 0.031 | 130–170 | 120–150 |
| MCV | fL | 89.67 ± 7.70 | 87.47 ± 8.76 | n.s | 95.75 ± 4.94 | 94.99 ± 4.69 | n.s | 80–100 | 80–100 |
| RDW | % | 12.76 ± 1.44 | 14.23 ± 3.08 | n.s | 12.20 ± 0.71 | 12.24 ± 0.91 | n.s | 11.6–14 | 11.6–14 |
| MCH | pg | 28.79 ± 3.16 | 28.23 ± 3.38 | n.s | 31.98 ± 1.96 | 31.53 ± 1.68 | n.s | 27–32 | 27–32 |
| MCHC | g/L | 320,7 ± 10,00 | 322,3 ± 10.05 | n.s | 334.5 ± 10.64 | 331.9 ± 10.38 | n.s | 320–350 | 320–350 |
| HCT | L/L | 0.3963 ± 0.0548 | 0.4166 ± 0.0655 | n.s | 0.3797 ± 0.0533 | 0.4096 ± 0.06.0 | 0.025 | 0.40–0.50 | 0.36–0.46 |
| PLT | × 109/L | 281.50 ± 110.54 | 274.04 ± 68.23 | n.s | 202.49 ± 53.01 | 216.31 ± 47.53 | n.s | 150–400 | 150–400 |
| MPV | fL | 8.07 ± 0.45 | 8.92 ± 1.17 | n.s | 8.26 ± 0.86 | 8.43 ± 0.95 | n.s | 8.17–9.65 | 8.17–9.65 |
| PCT | % | 0.22 ± 0.08 | 0.24 ± 0.06 | n.s | 0.17 ± 0.04 | 0.18 ± 0.04 | n.s | 0.17–0.29 | 0.17–0.29 |
| PDW | GSD | 15.89 ± 0.46 | 16.23 ± 0.56 | n.s | 16.23 ± 0.59 | 16.51 ± 0.60 | n.s | 14.7–17.4 | 14.7–17.4 |
© 2020 by the authors. Licensee MDPI, Basel, Switzerland. This article is an open access article distributed under the terms and conditions of the Creative Commons Attribution (CC BY) license (http://creativecommons.org/licenses/by/4.0/).
Share and Cite
Caseiro, A.; Rocha, C.; Silva, A.M.; Ferreira, C.; Silva, I.; Clemente, M.; Cipriano, I.; Saraiva, M.; Barreira, R.; Azenha, J.; et al. Effects of A Personalized Intervention Program on the Biochemical and Hematological Profile in Community Dwelling Old Adults—The AGA@4life Intervention Model. Int. J. Environ. Res. Public Health 2020, 17, 718. https://0-doi-org.brum.beds.ac.uk/10.3390/ijerph17030718
Caseiro A, Rocha C, Silva AM, Ferreira C, Silva I, Clemente M, Cipriano I, Saraiva M, Barreira R, Azenha J, et al. Effects of A Personalized Intervention Program on the Biochemical and Hematological Profile in Community Dwelling Old Adults—The AGA@4life Intervention Model. International Journal of Environmental Research and Public Health. 2020; 17(3):718. https://0-doi-org.brum.beds.ac.uk/10.3390/ijerph17030718
Chicago/Turabian StyleCaseiro, Armando, Clara Rocha, Ana Margarida Silva, Carla Ferreira, Isabel Silva, Mariana Clemente, Inês Cipriano, Marina Saraiva, Rogério Barreira, Joana Azenha, and et al. 2020. "Effects of A Personalized Intervention Program on the Biochemical and Hematological Profile in Community Dwelling Old Adults—The AGA@4life Intervention Model" International Journal of Environmental Research and Public Health 17, no. 3: 718. https://0-doi-org.brum.beds.ac.uk/10.3390/ijerph17030718