Article

Spatial Variation and Source of Dissolved Heavy Metals in the Lancangjiang River, Southwest China

Institute of Earth Sciences, China University of Geosciences (Beijing), Beijing 100083, China
*
Author to whom correspondence should be addressed.
Int. J. Environ. Res. Public Health 2020, 17(3), 732; https://0-doi-org.brum.beds.ac.uk/10.3390/ijerph17030732
Submission received: 19 December 2019 / Revised: 18 January 2020 / Accepted: 21 January 2020 / Published: 23 January 2020
(This article belongs to the Special Issue Water and Health)

Abstract

:
Dissolved heavy metals are not only the essential micronutrients, but also the toxic elements for human bodies. To investigate the heavy metal sources and assess the water quality of the Lancangjiang River, dissolved Cr, Ni, Cu, Zn, Mo, and Pb were detected in this study. The results show that dissolved Ni and Mo, Cr and Pb, and Cu and Zn were similarly distributed within the drainage basin. The correlation analysis exhibited that dissolved Ni and Mo had correlation with water parameter, and dissolved Cu was weakly correlated with Ni, indicating that they might be affected by natural processes. The principal component analysis explained 68.342% of the total variance for three principal components, of which dissolved Ni, Mo, and Cu were controlled by natural inputs; dissolved Cu and Cr were affected by anthropogenic activities; and dissolved Zn was influenced by agricultural activities in the downstream. The water quality showed that the water in upstream was worse than in midstream and downstream, and the whole drainage basin had water of excellent quality. Water within the drainage basin poses no risks to human bodies via daily diets and dermal routes. Dissolved Zn, Cu, and Mo occupied the major proportion of heavy metals transporting into the Mekong River. The agricultural inputs of dissolved Zn might pose potential risks to the Mekong River.

1. Introduction

Rivers play an important role in environmental cycles by dissolving and transporting heavy metals on Earth’s surface [1,2,3,4]. Annually, global rivers import 1 × 10⁹ tons of dissolved heavy metals into the ocean [1,5]. As is known, many heavy metals, such as Cr, Ni, Cu, Zn, Mo, Pb, etc., are also the essential elements in human bodies and cause severe diseases [6,7,8,9,10]. However, dissolved heavy metals would threaten human health if the concentrations were exorbitant [11,12,13,14,15]. For people living by rivers, the river water is the direct source of domestic water [16,17,18,19,20,21]. Therefore, it is significant to evaluate the environmental risks of dissolved heavy metals in river water.
The Lancangjiang River is the upper reach of the Mekong River (MR, the world’s seventh longest river) and originates from the Qinghai-Tibet Plateau (QTP) in southwest China [22,23]. Natural processes and anthropogenic activities largely release heavy metals into rivers [11,24]. Since the uplift of QTP, global weathering has accelerated under the Asian monsoon climate [25,26,27,28,29,30,31,32], and may result in the increase of dissolved heavy metals in river water. In addition, with the development of the Lancangjiang River basin in recent years, human activities have increased greatly [33,34,35]. Based on the current situations of the Lancangjiang River, the amount of heavy metals in river water may have much more possibilities to threaten the environment. However, it is hard to constrain the sources of dissolved heavy metals in river water due to the complicated geological environment and human activities. Multivariate statistical methods, including correlation analysis and principal component analysis (PCA), are some of the most effective ways to identify the sources of heavy metals in river water [36,37,38,39], because they can better explain the water quality and possible sources affecting the study area by identifying hidden relations between variables and reducing complex chemical datasets to a small number of factors without much information loss [8,11].
In this study, six dissolved heavy metals (Cr, Ni, Cu, Zn, Mo, and Pb) in the Lancangjiang River water were measured to investigate the spatial distribution of dissolved heavy metals, identify their sources, and assess the water quality of the Lancangjiang River water. Moreover, this study also evaluated the dissolved heavy metal fluxes, aiming to assess the environmental impact on the Mekong River. The study was applied to enhance water management efficiency and prevent hazardous metal contamination to human health.

2. Materials and Methods
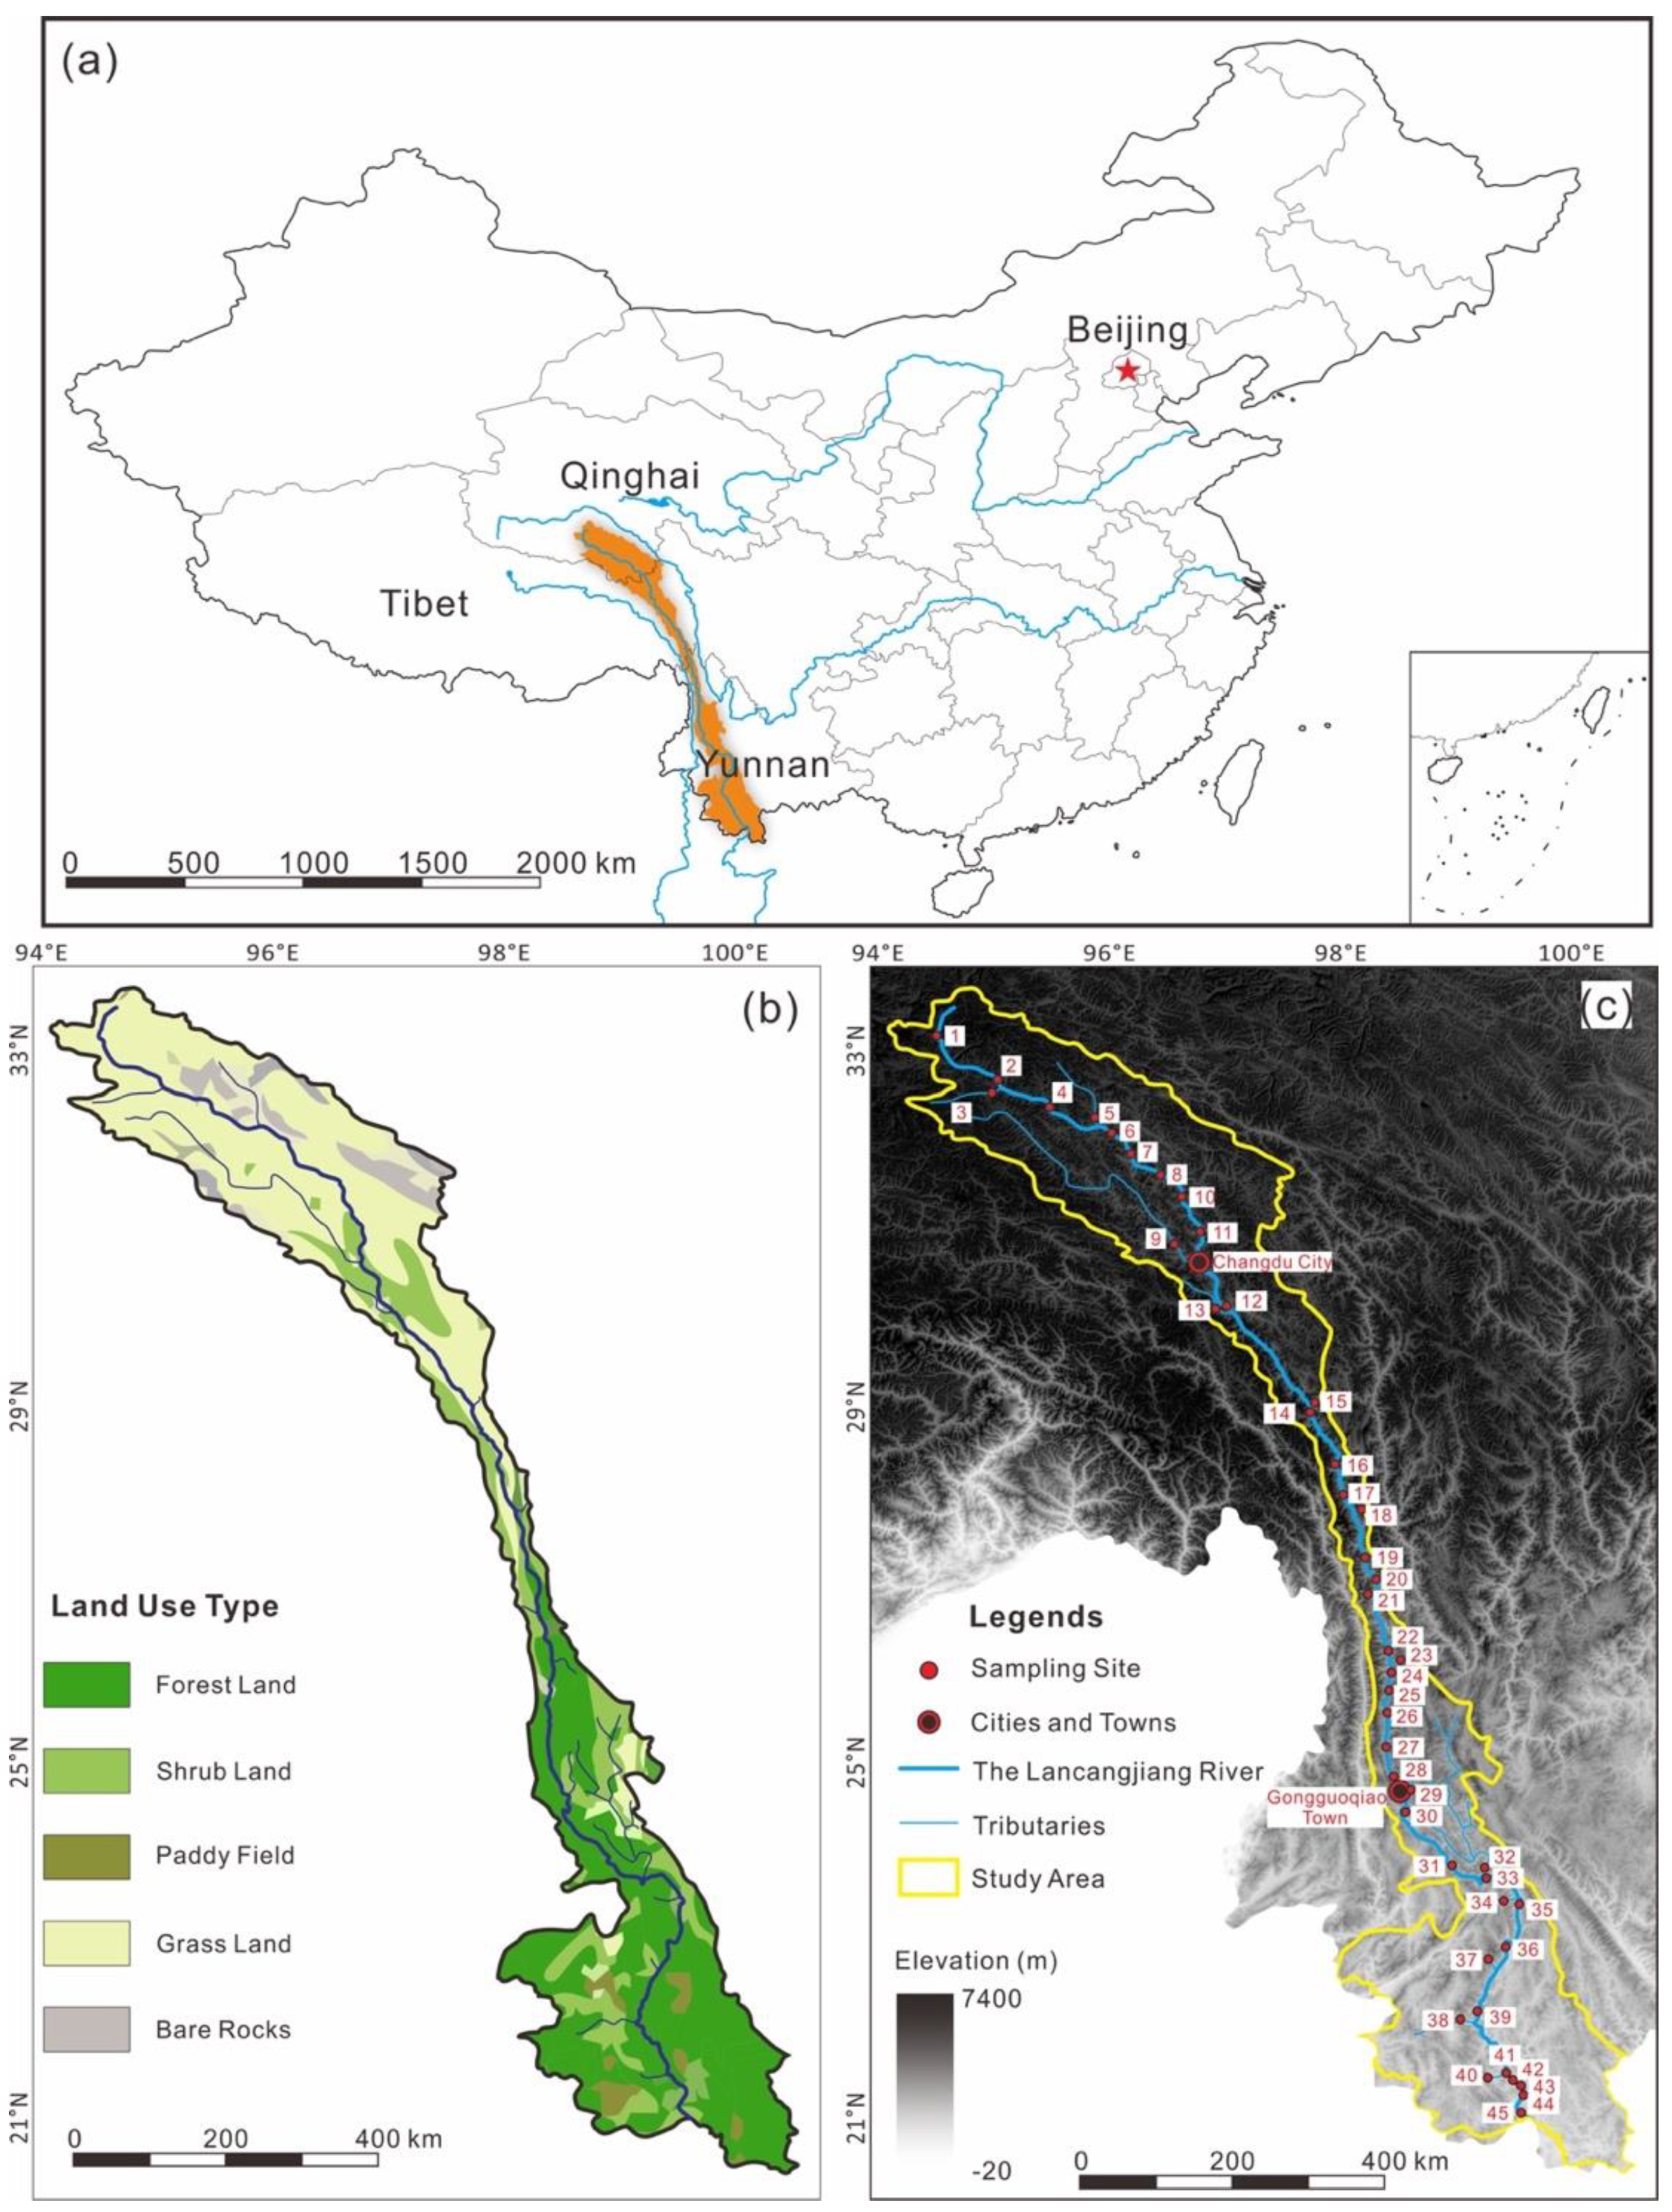
2.1. Study Area

The Lancangjiang River locates within the latitude of 21°75′–33°81′ N and the longitude of 94°40′–101°15′ E, with a total length of 2160 km, an elevation difference of 4583 m, and an area about 168,000 km2 of the whole drainage basin [22,25]. The Lancangjiang River flows through Qinghai Province, Tibet Autonomous Region, and Yunnan Province in southwest China (Figure 1a). The Lancangjiang River is divided into three parts: (i) the upstream: from the source to Changdu City (Figure 1c), with an average elevation of more than 4000 m [40]; (ii) the midstream: from Changdu City to Gongguoqiao Town in Yunnan Province, characterized by large altitude differences, rapid water flows, and small population; and (iii) the downstream: from Gongguoqiao Town to Vietnam (Figure 1c), with less change of terrains and increase of tributaries and population [25].
The Lancangjiang River covers six climatic zones from north to south: frigid zone, cold temperate zone, temperate zone, warm temperate zone, subtropical zone, and tropical zone [33,34]. The average annual precipitation in the Lancangjiang River basin is more than 1200 mm, with <800 mm in the upstream, 800–1100 mm in the midstream, and >1100 mm in the downstream [34,41]. From the land-use map (Figure 1b), grassland and bared rocks are distributed in the north, while forest land and a little proportion of paddy land are distributed in the south, and shrub land spreads within the whole drainage basin. The land used by human activities are focused in the downstream [40].

2.2. Sampling

Samples were collected from downstream to upstream from 18 July to 7 August 2019. All sampling instruments were cleaned indoor and rinsed three times with river water in the field. Water samples were collected using a sampler, then filtered through a 0.22-µm filter membrane, stored in pre-cleaned high-density polyethylene (HDPE) plastic bottles, and labeled LCJ-1–45, where LCJ-1–11 belong to the upstream, LCJ-12–28 locate within the midstream, and LCJ-29–45 are from the downstream (Figure 1c). The Sampling coordinates are given in Table 1. For subsequent elemental measurement, the filtrate was acidified to pH < 2 using ultra-pure concentrated nitric acid. The collected samples were stored at 4 °C before analysis. Water temperature, pH, total dissolved solid (TDS), and dissolved oxygen (DO) were measured in situ using a YSI water quality monitoring meter (Xylem Inc., Yellow Spring, OH, USA).

2.3. Measurement of Dissolved Heavy Metals

The concentrations of heavy metals (Cr, Ni, Cu, Zn, Mo, and Pb) were determined by a high resolution inductively coupled plasma mass spectrometer (ICP-MS, Element 2XR, Thermo Fisher Scientific, Waltham, MA, USA) at State Key Laboratory of Geological Processes and Mineral Resources, China University of Geosciences (Beijing), coupled with an Elemental Scientific PFA nebulizer with a flow rate of 100 µL/min. Before analysis, 0.8 μg/L indium (In) was added into water solutions as the internal standard to monitor the signal shift. The Eppendorf pipettes (Eppendorf Corp., Hamburg, Germany) were calibrated in advance for accurately transferring water samples and standard solution, and the volume error was ±2%. The instrumental precision was tested by measuring a digested solution of the external standard BCR-2 (United States Geological Survey, Denver, CO, USA) between every 10 samples, and the analytical error was within ±5%. Method precision was also controlled by determining replicate samples between every 10 samples, and the relative standard deviations (RSDs) were ±4.3%.

2.4. Statistical Methods and Water Quality Assessment

The statistical analysis for correlation analysis and PCA was processed by SPSS 25.0 (IBM Corporation, Armonk, NY, USA). The Pearson correlation matrix was exported to explain the relations and interactions between each pair of dissolved heavy metals in the Lancangjiang River. The principal components (PCs) were investigated to explore the possible sources of dissolved heavy metals by a dimensionality reduction technique. Before conducting PCA, the concentrations of dissolved heavy metals were standardized by z-scale transformation and the adequacy and suitability of dataset was examined by the Kaiser–Meyer–Olkin (KMO) and Bartlett’s sphericity test in order to avoid numerical ranges of the original variables.

2.5. Water Quality Index

The water quality index (WQI) is one of the most comprehensive tools to present the quality of river water. It is calculated as follows:
WQI = Σ [Wi × (Ci/Si)] × 100,
where Wi represents the weight of each dissolved heavy metals and is obtained from the eigenvalues for each PC result; Ci represents the concentrations of dissolved heavy metals at each sampling site; and Si is the drinking water guidelines recommended by the China GB 5749-2006 [42]. The water quality is categorized into five classes: (i) excellent water quality (0 ≤ WQI < 50); (ii) good water quality (50 ≤ WQI < 100); (iii) poor water quality (100 ≤ WQI < 200); (iv) very poor water quality (200 ≤ WQI < 300); and (v) water unsuitable for drinking (WQI ≥ 300) [9,11].

2.6. Hazard Index and Hazard Quotient

The hazard index (HI) and hazard quotient (HQ) are parameters to assess the toxicity of dissolved heavy metals in water. The HQ is the ratio between exposure via individual pathways and reference dose and the HI is the sum of the His from both pathways. When HI is smaller than 1, there is no deleterious effects on human health; however, when HI is larger than 1, non-carcinogenic risks or adverse effects on human health exist. The HQ and HI are calculated as follows:
ADDingestion = (Cw × IR × EF × ED)/(BW × AT),
ADDdermal = (Cw × SA × Kp × ET × EF × ED × 10−3)/(BW × AT),
HQ = ADD/RfD,
RfDdermal = RfD × ABSGI,
HI = ΣHQs,
where ADDingestion and ADDdermal represent the average daily dose via ingestion and dermal routes, respectively (μg/kg/day); Cw represents the mean concentration of each dissolved heavy metal in water (μg/L); BW is the average weight of human (70 kg for adults and 15 kg for children); IR is the ingestion volume per day (2 L/day for adults and 0.64 L/day for children); EF represents the exposure frequency (350 days/year); ED is the exposure period (30 years for adults and 6 years for children); AT is the average time (=ED × 365 days/year); SA defines the exposed skin area (18,000 cm2 for adults and 6600 cm2 for children); ET is the exposure time (0.58 h/day for adults and 1 h/day for children); Kp represents dermal permeability coefficient in water (cm/h); RfD is the reference dose (μg/kg/day); and ABSGI is the gastrointestinal absorption factor. The reference values were obtained from the United States Environmental Protection Agency [43].

2.7. Dissolved Heavy Metal Fluxes

The Lancangjiang River flows southwards into the Mekong river. The fluxes of dissolved heavy metals into the Mekong River were estimated on the basis of the discharge data. The flux of each dissolved heavy metals was calculated using the following equation:
flux (tons/year) = QA × CA,
where QA is average annual water discharge (2180 m3/s) [40] and CA is the average concentration of dissolved heavy metals in downstream, where the terrain is relatively plain, the sampling sites are more dense, the variations of element concentration are small, and the Lancangjiang River connects the Mekong River.

3. Results

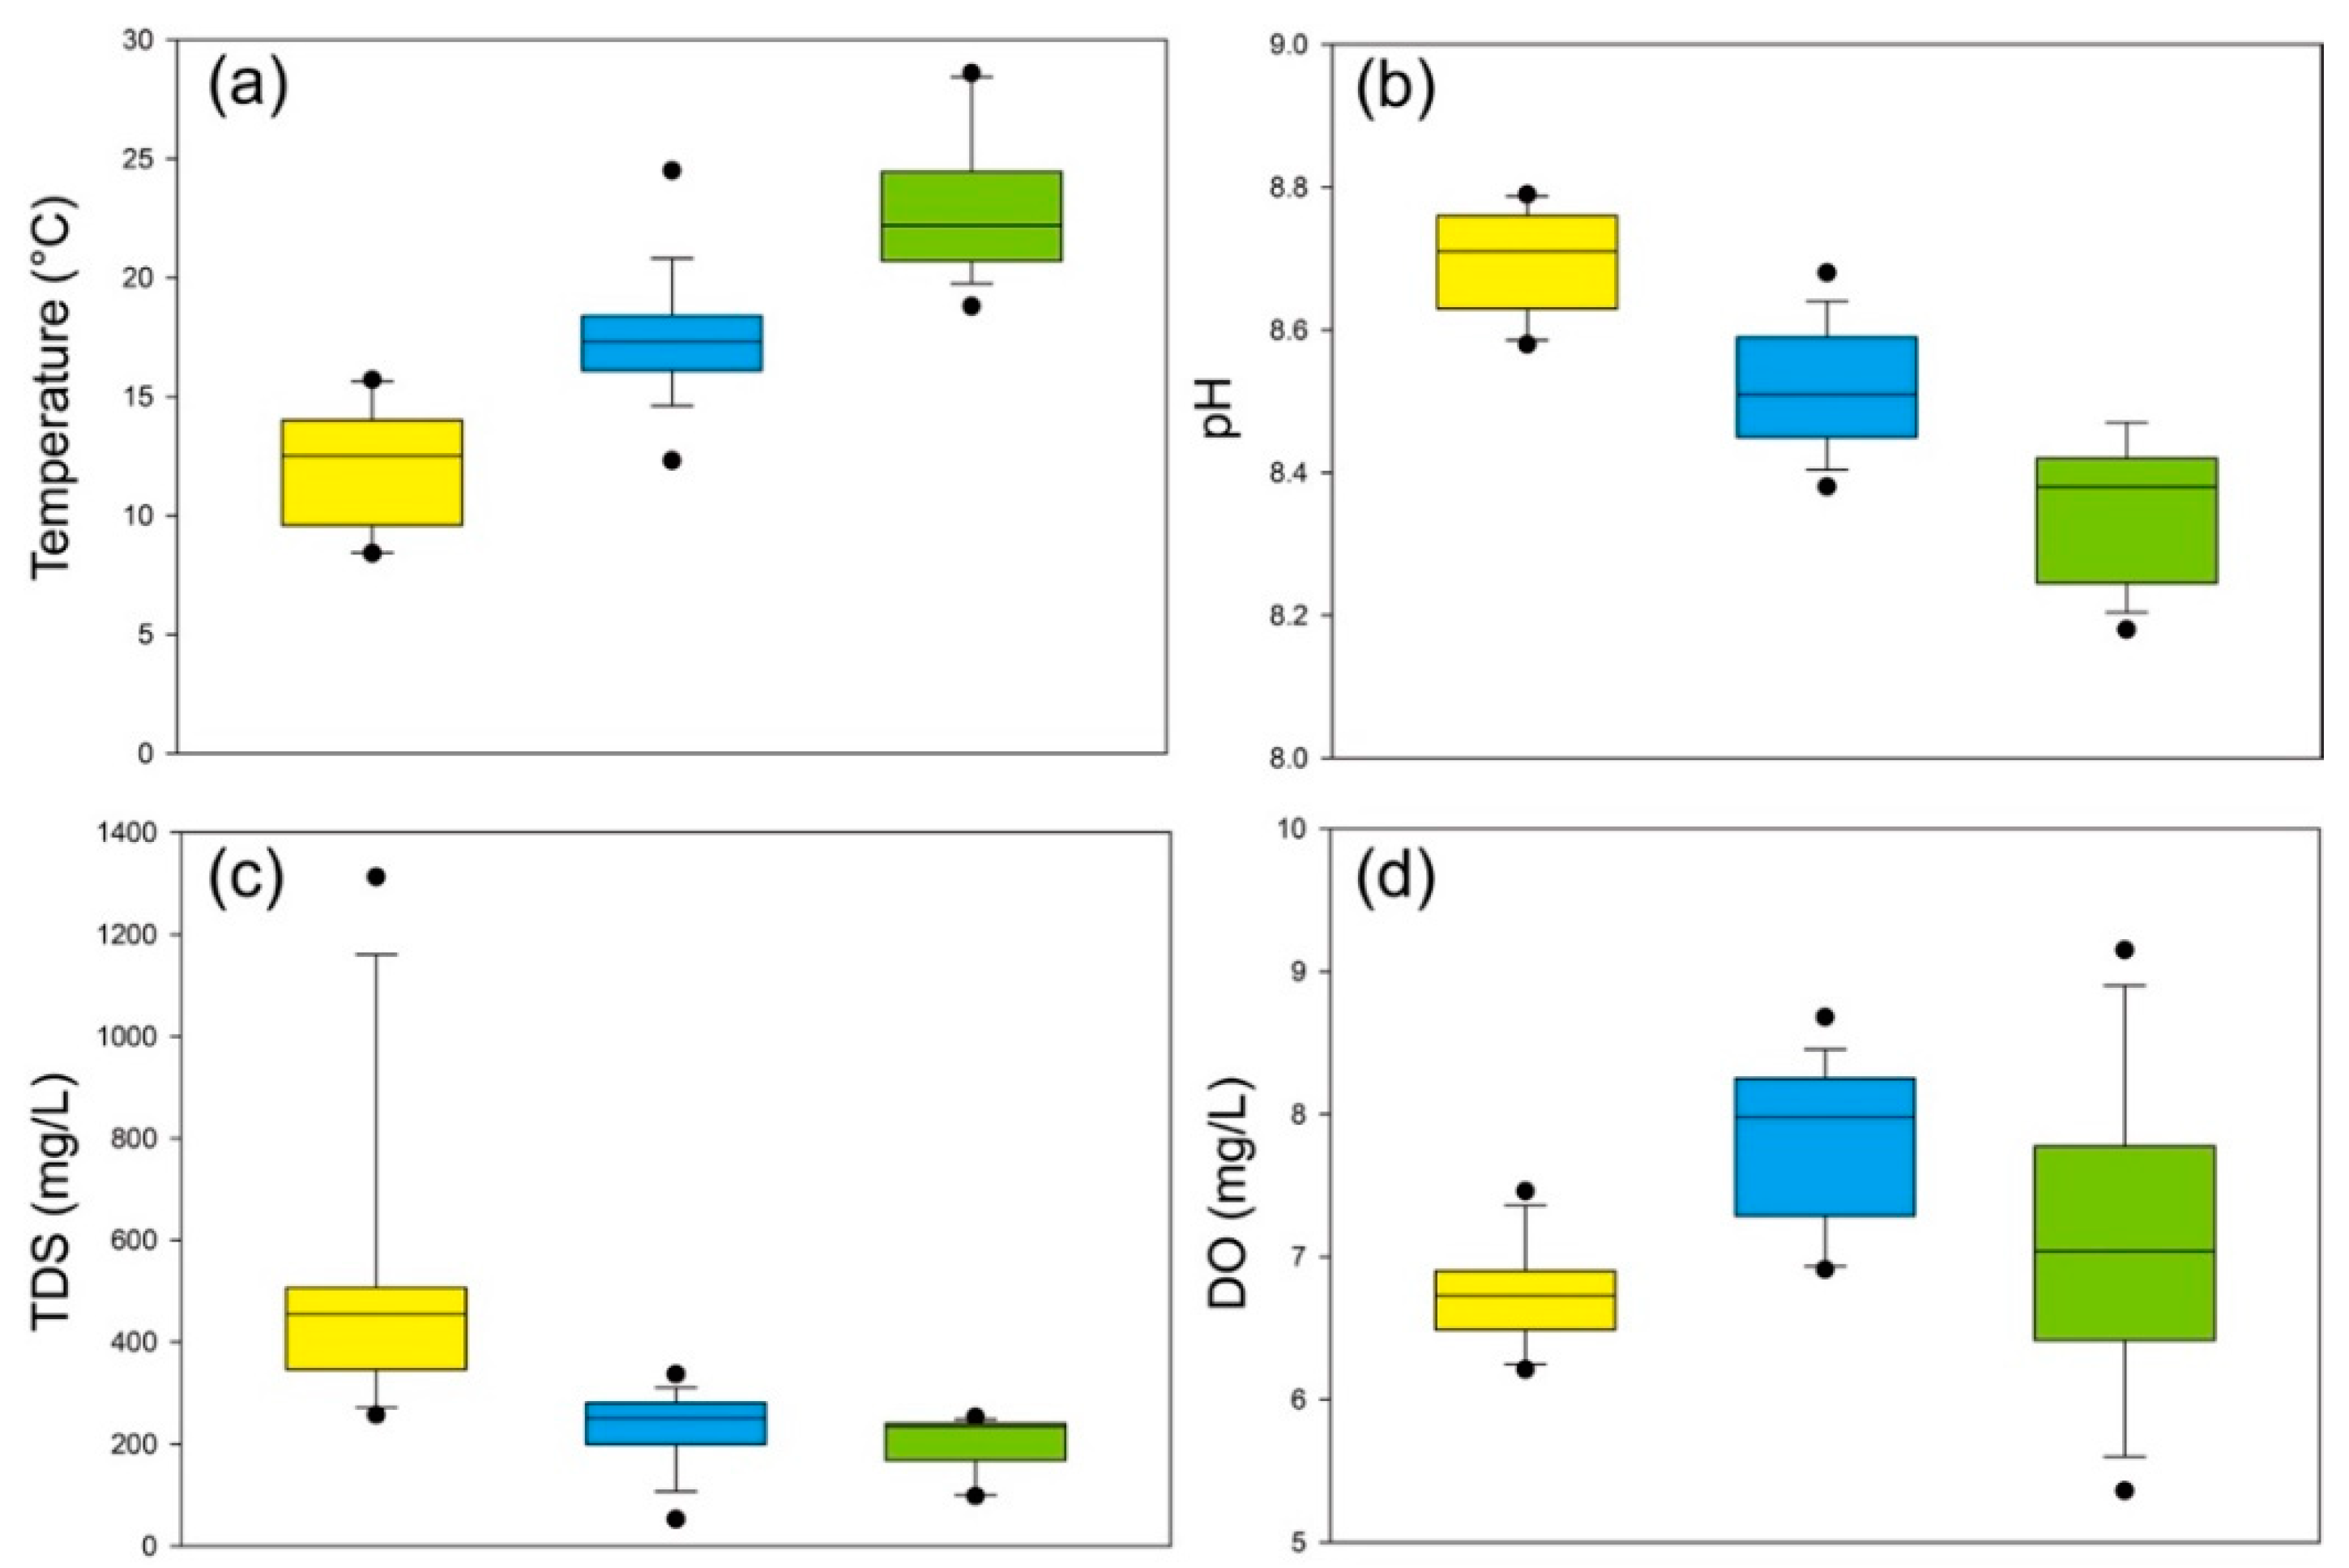
3.1. Physicochemical Parameters

The water parameters are listed in Table 1 and their boxplots are displayed in Figure 2. The water temperature of the whole river has a large variation from 8.4 to 28.6 °C (Figure 2a). The river water exhibits alkaline with the pH values ranging from 8.2 to 8.8 with decreasing trend from upstream to downstream (Figure 2b), and alkaline river water may be conducive to the absorption and oxidization of dissolved heavy metals [44]. The TDS varies largely with the values of 52.7–1313.0 mg/L, with the peak values in the upstream (Figure 2c). Except for LCJ-3, the Lancangjiang River water is categorized as basically fresh water (TDS < 1000 mg/L). The DO ranges from 5.4 to 9.2 mg/L with relatively high values in the midstream (Figure 2d).

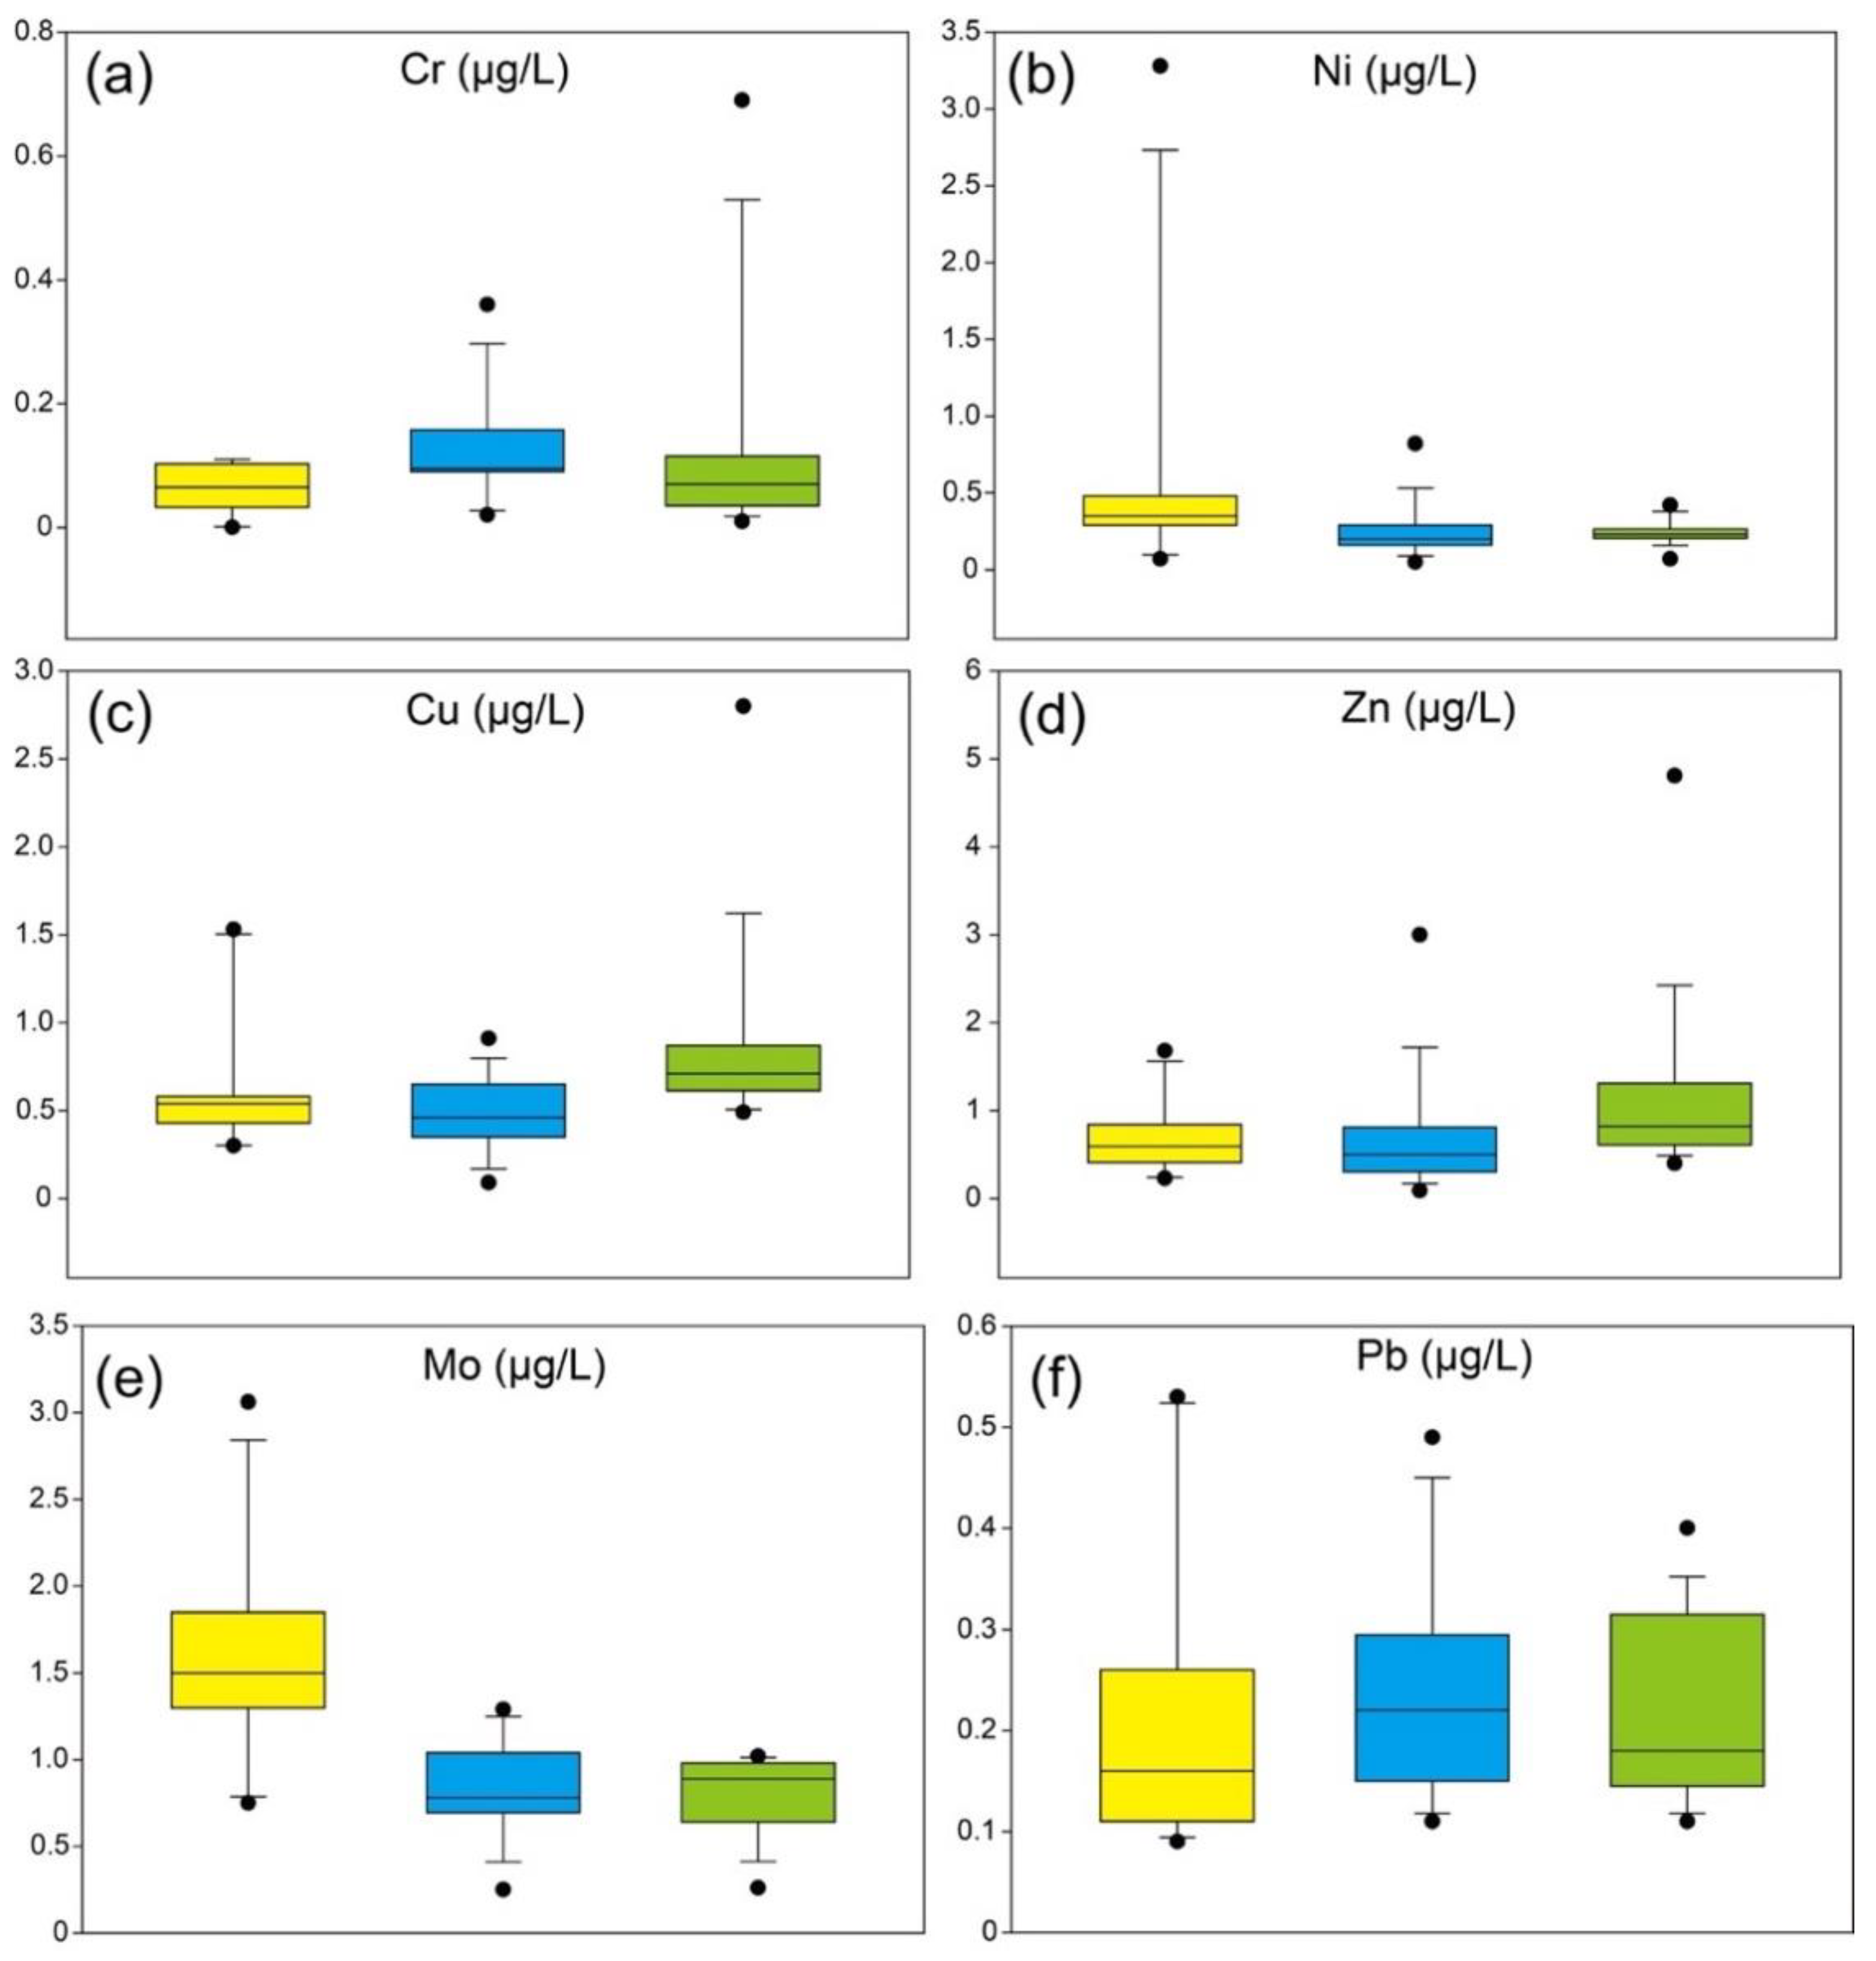
3.2. Concentrations of Dissolved Heavy Metals

The concentrations of dissolved heavy metals are reported in Table 2. The selected dissolved heavy metals are low concentrated in the Lancangjiang River. Dissolved Mo was the most abundant heavy metal in the river water, with the mean value >1 µg/L (0.25–3.06 µg/L). The other elements are less abundant with the mean values under 1 µg/L, and dissolved Cr, Ni, Cu, Zn, and Pb have the values of 0–0.69 µg/L, 0.05–3.28 µg/L, 0.05–2.80 µg/L, 0.09–4.81 µg/L, and 0.09–0.53 µg/L, respectively.
The boxplots of dissolved heavy metals are displayed in Figure 3. Dissolved Ni and Mo are similar in spatial distribution, with the highest values in the upstream and lowest values in the midstream. The similarity was also shown in the distribution of dissolved Cr and Pb, with the highest mean values in the midstream and lowest values in the upstream. Dissolved Cu and Zn are abundant in the downstream and depleted in the upstream.
Compared with the mean concentrations of dissolved heavy metals in world’s major rivers (Table 2), dissolved Mo has a similar value compared with the upper Mississippi River (1.11 µg/L), dissolved Ni is similar to the values in two Chinese major rivers, with the values of 0.2 µg/L in the Yangtze River and 0.30–0.59 µg/L in the Yellow River, implying dissolved Ni might be affected by natural factors. Dissolved Cr and Cu are lower than those in the Yangtze River, Yellow River, and upper Mississippi River. Dissolved Zn is higher than the Zn concentration in the Amazon River. Dissolved Pb is higher than world’s rivers, and higher concentration of dissolved Pb may be affected by the Pb ore in the midstream, the largest Pb ore deposit in Asia [45].

4. Discussion

4.1. Correlation Analysis

To investigate the relationships between the physicochemical parameters and dissolved heavy metals and the interrelationships between each pair of dissolved heavy metals, the Pearson correlation matrix are displayed in Table 3. Among the metals, dissolved Mo and Ni were affected by water parameters at different degrees (Mo, p < 0.01; Ni, p < 0.05), indicating the influence of natural processes; dissolved Cu was weakly correlated with Ni (p < 0.05)); dissolved Zn was negatively correlated with pH (p < 0.05), indicating that Zn is more likely to be dissolved under weak acidic conditions; and the other elements had no significant correlations with each other and were weakly correlated with the water parameters, indicating that they had large chance to be from various anthropogenic activities, such as the discharge of industrial and domestic sewage, mining activities, construction of hydropower plants, etc. [8].

4.2. Concentrations of Dissolved Heavy Metals

The sources of dissolved heavy metals were identified using the PCA method, and the results are shown in Table 4. The results of KMO and Bartlett’s test were 0.390 and 39.962 (df = 15, p < 0.01), respectively, and the significance of the test is <0.001, indicating that PCA was effective in reducing dimensionality. Three principal components (PCs) were extracted using a varimax rotation method by being Kaiser-normalized, with the eigenvalues exceeding 1, and explaining 68.342% of the total variance. The PC loadings were classified into three groups: strong, moderate, and weak, with the loading values of >0.75, 0.75–0.50, and 0.50–0.30, respectively [46].
PC1, explaining 31.342% of the total variance, had strong loadings of Ni (0.880) and Mo (0.855) and a weak loading of Cu (0.478). Based on the correlation analysis, dissolved Mo and Ni were similarly correlated with temperature and pH, and dissolved Cu was also weakly correlated with Ni, indicating these elements were affected by natural processes. In addition, dissolved Mo was also strong correlated with TDS, and the concentrations of dissolved Mo and Ni increased with the pH and decreased with the temperature, suggesting dissolved heavy metals of PC1 might originated from the upstream of the Lancangjiang River, based on the distribution of water parameters (Figure 2). PC2 explained 20.277% of the total variance and had a moderate loading of Cr (0.634) and a weak loading of Cu (0.458). Dissolved Cr and Cu were reported to be affected by anthropogenic activities, such as industrial discharges and domestic wastes [47]. Additionally, they showed no significant correlation with water parameters, suggesting that PC2 was controlled by anthropogenic sources. PC3 was affected by the enrichment of dissolved Zn, with 16.723% of the total variance. The concentration of dissolved Zn had a negative correlation with pH values, and had no relationship with other parameters, implying that the anthropogenic inputs was more than natural inputs. Zn is one of the most common micronutrients in fertilizers and pesticides and has higher values (Figure 3d) in the downstream where agricultural activities increase (Figure 2b), and, thus, PC3 was attributed to agricultural inputs.

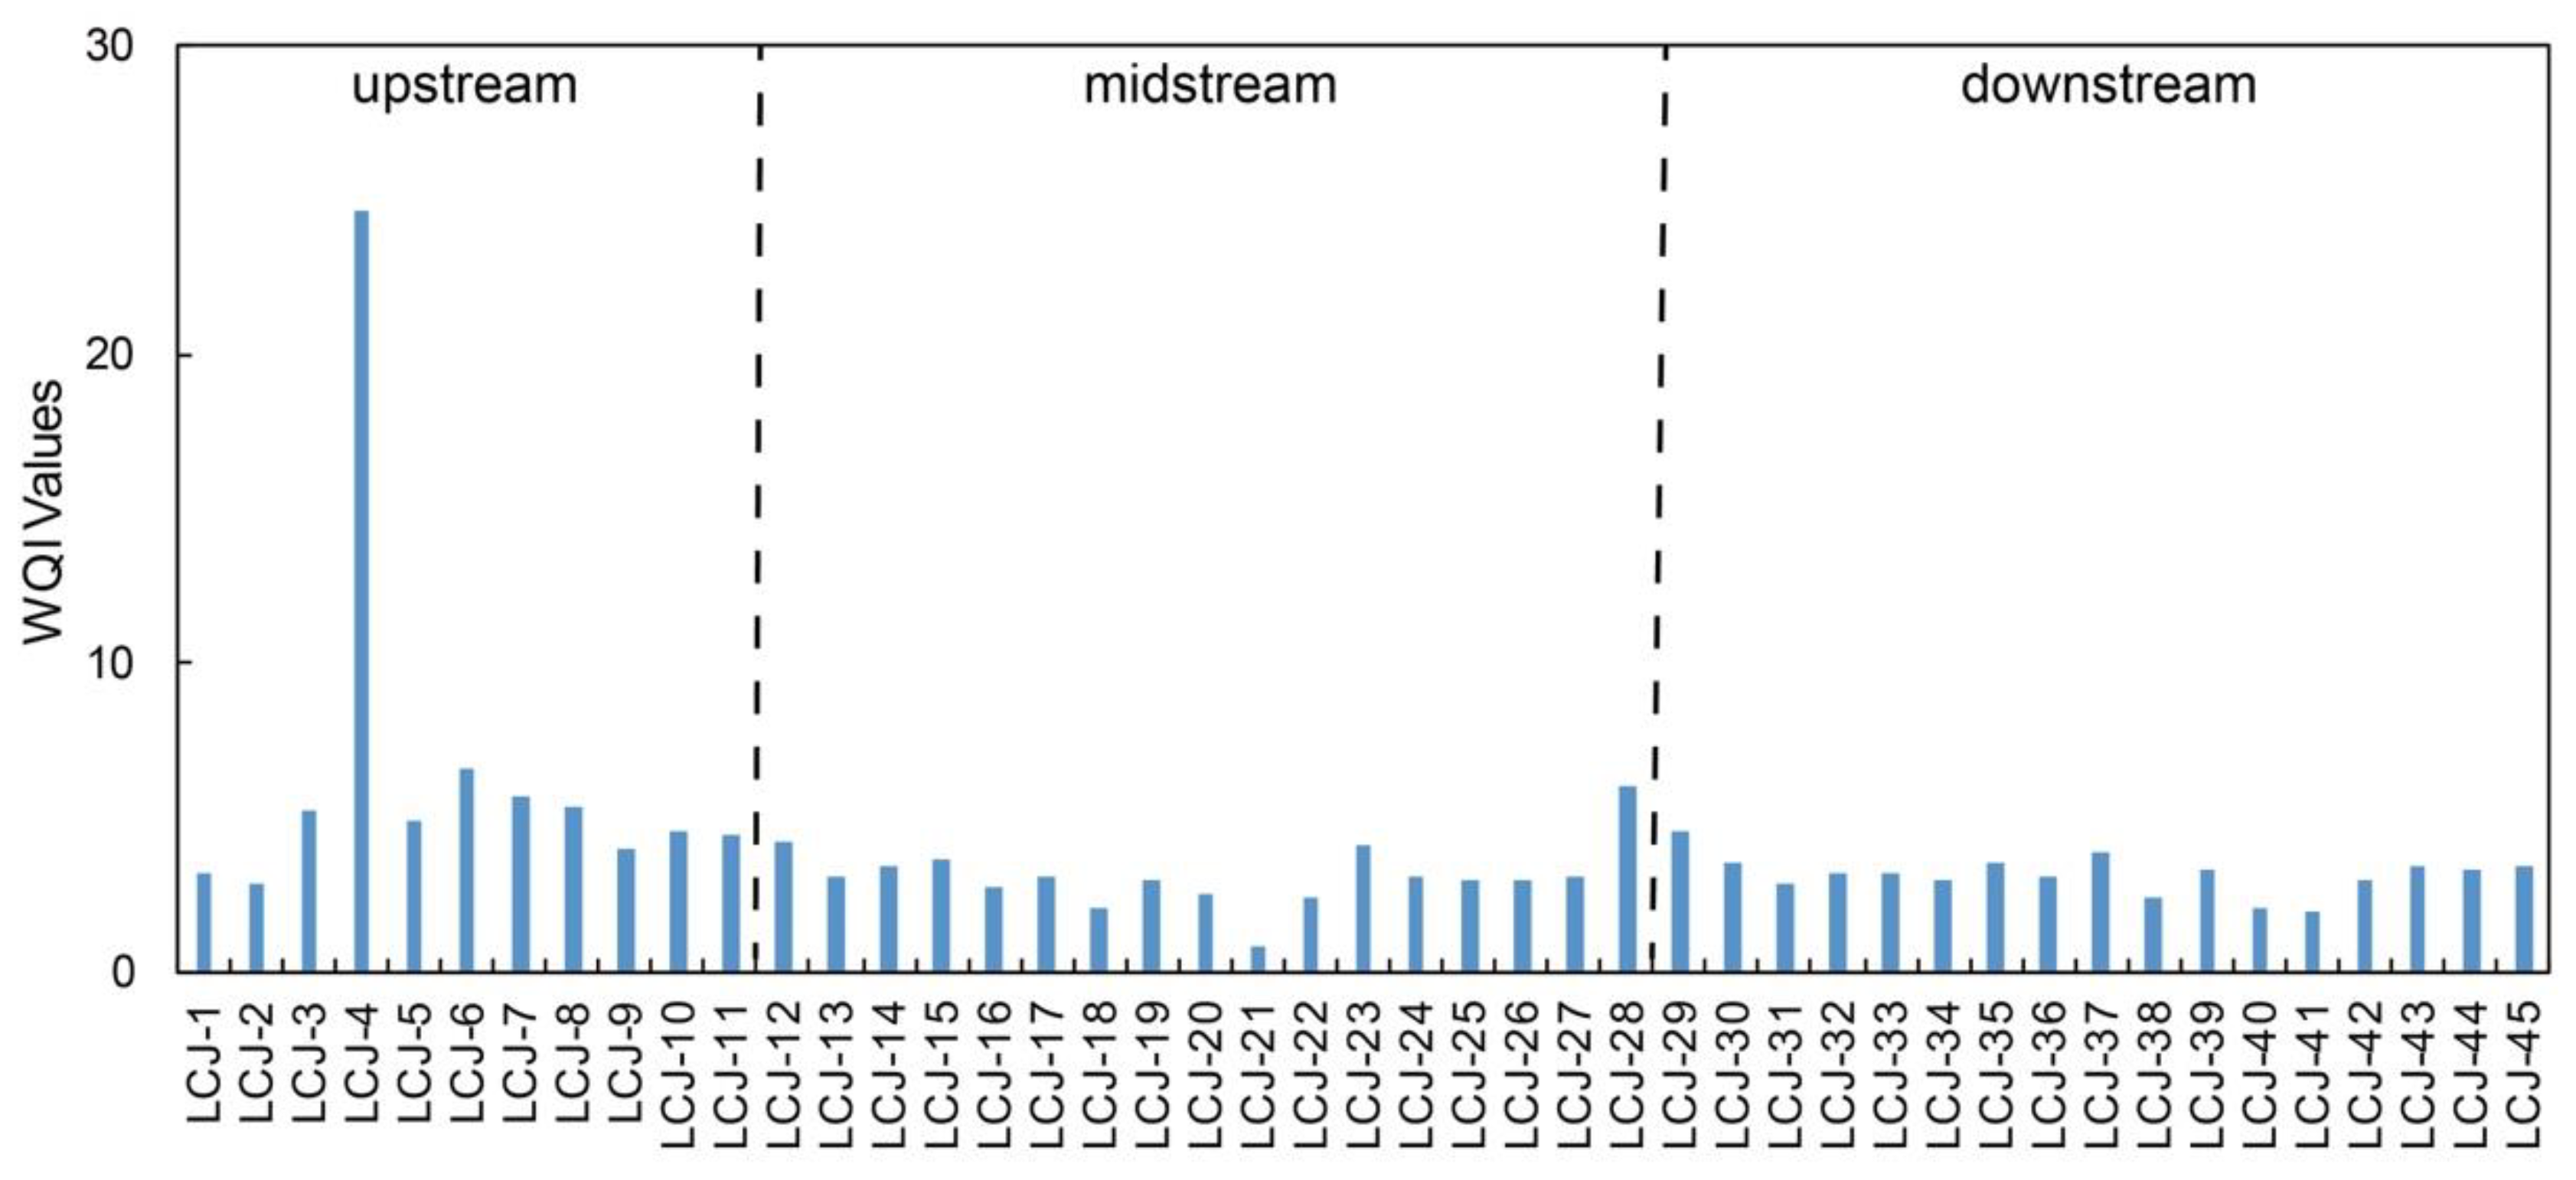
4.3. Water Quality Assessment

The water quality was assessed using WQI values calculating based on the weights of dissolved Cr, Ni, Cu, Zn, Mo, and Pb (Table 5), but the weight of dissolved Pb was unavailable because there are no loadings of Pb for any PCs. The results of WQI are shown in Figure 4. Water samples within the drainage basin had an excellent quality with WQI values under 50, indicating these dissolved heavy metals posed no health risks to human health. However, the water quality in the upstream was worse than in midstream and downstream, which may be attributed to the lack of water management due to the sparse population [33,34,40]. The high WQI value at site LCJ-4 might be affected by largely natural inputs due to the high concentration of dissolved Ni and Mo.

4.4. Health Risk Assessment

The calculation for HQ and HI values is given in the Supplementary Materials (Table S1), and their values are also illustrated in Figure 5. In general, HQingestion and HQdermal for both adults and children were smaller than 1, suggesting that no health effects and carcinogenic concern via daily intake and dermal absorption exist for human health. The HI values also exhibited that all dissolved heavy metals posed non-carcinogenic risks to human bodies. Meanwhile, dissolved Cu, Ni, and Pb had greater influence on adults than on children, and dissolved Cr preferred to be absorbed through dermal routes. Although all the dissolved heavy metals were within the values of no health risks, the discharge of dissolved Cr, Mo, and Pb had higher HI values and should be given more attention in the case of unnecessary health risks.

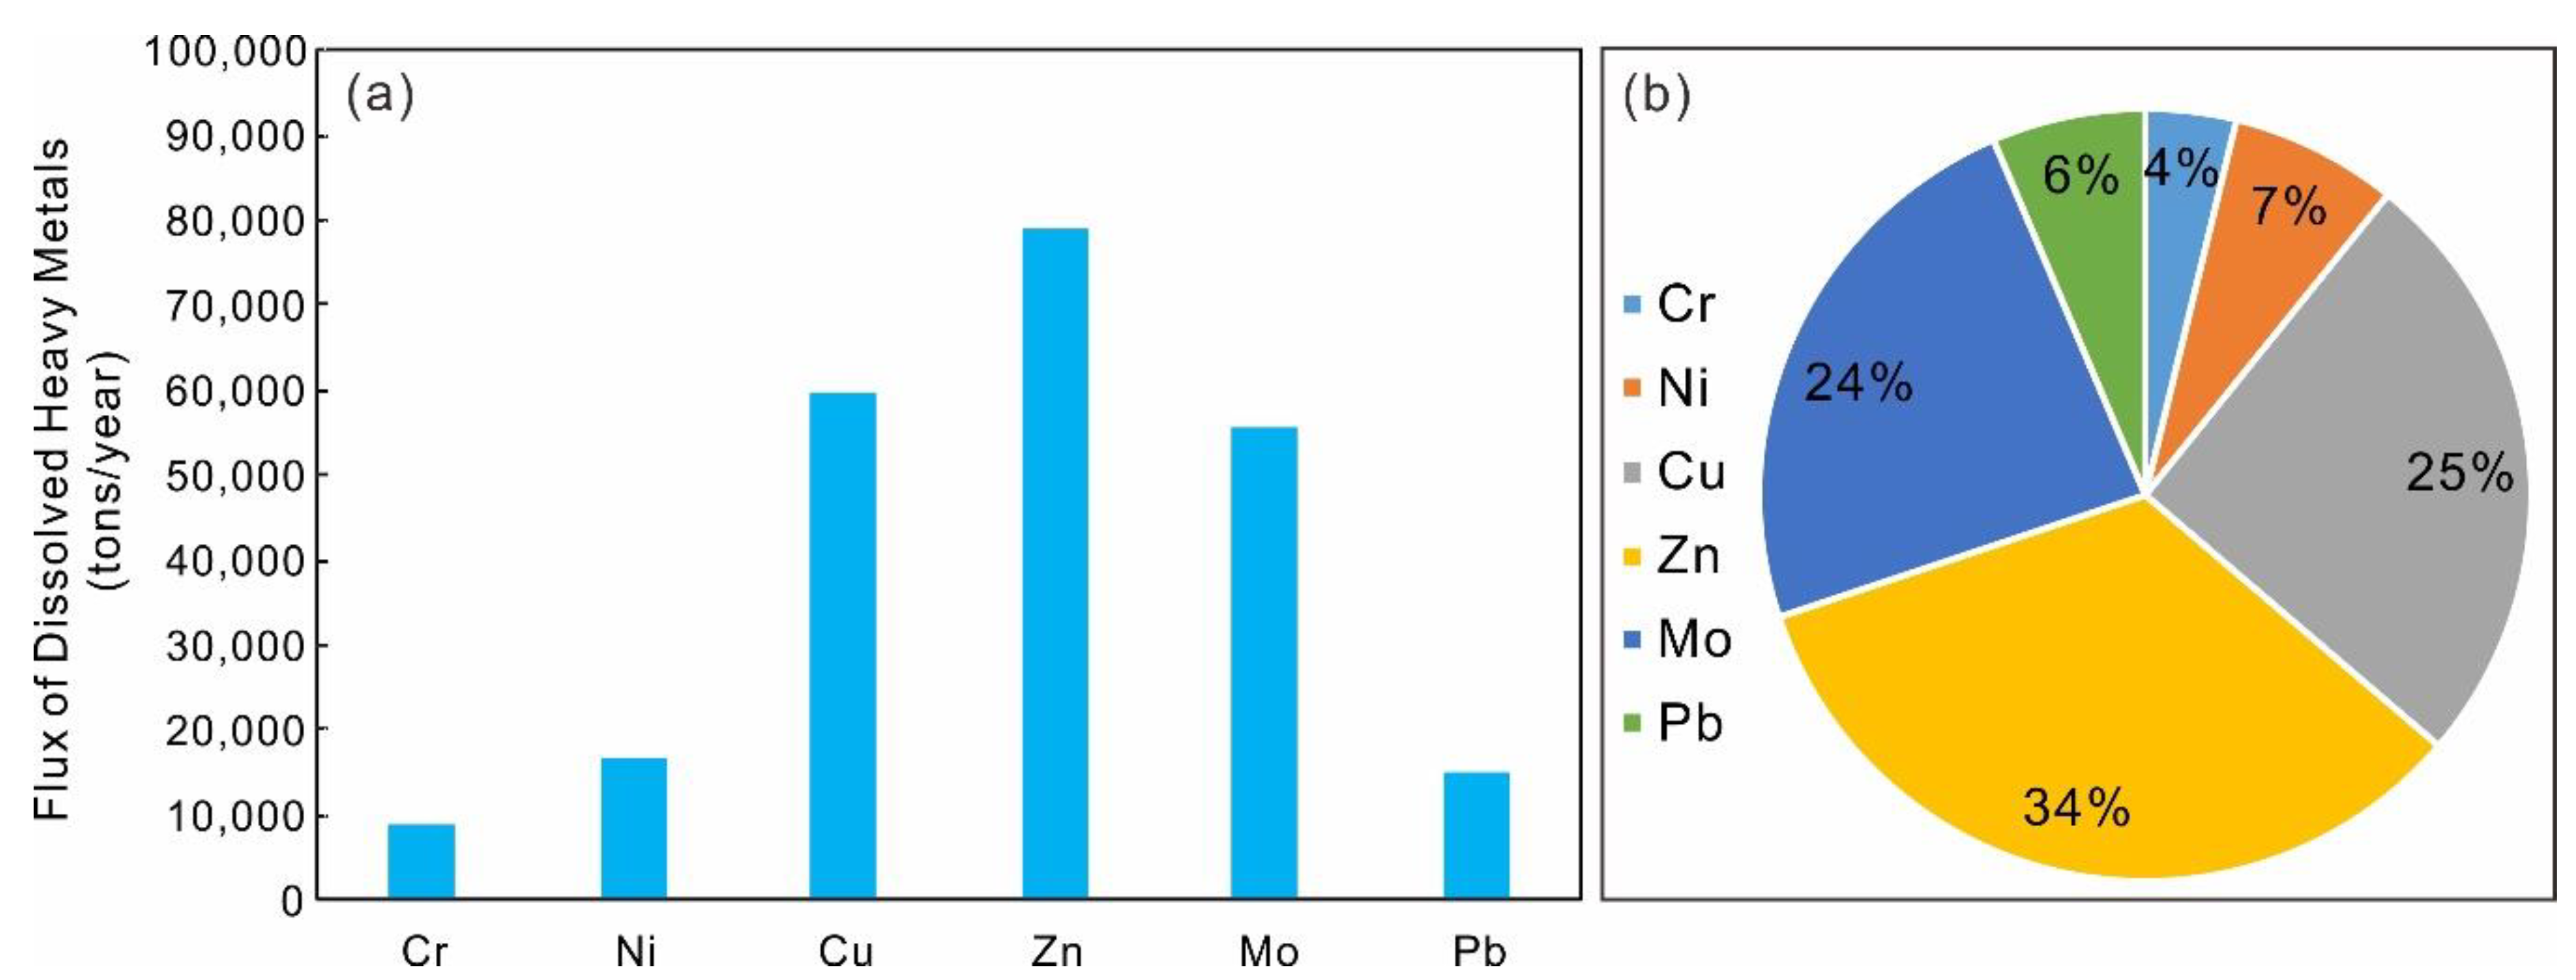
4.5. Elemental Fluxes to the Mekong River

Based on the average discharge data of the Lancangjiang River, the flux of each dissolved heavy metal is shown in Figure 6. Annually, the Lancangjiang River transported dissolved Cr, Ni, Cu, Zn, Mo, and Pb into the Mekong River, with the amounts of 8.93 × 10³, 1.65 × 10⁴, 5.98 × 10⁴, 7.91 × 10⁴, 5.57 × 10⁴, and 1.51 × 10⁴ tons/year, respectively (Figure 6a). Among the dissolved heavy metals, dissolved Zn, Cu, and Mo occupied the main proportion, with the percentage of 34%, 25%, and 24%, respectively (Figure 6b). Considering that Zn from agricultural activities were concentrated in the downstream, it might contribute to the Mekong River, pose potential risks, and needs more attention.

5. Conclusions

Based on data of water physicochemical parameters and dissolved heavy metals in the Lancangjiang River water, and multivariate statistical analysis, such as correlation analysis and PCA, the following conclusions were drawn regarding the sources of dissolved heavy metals and water quality of the Lancangjiang River:
(1) Dissolved Ni and Mo were similar in spatial distribution, the distribution of dissolved Cr and Pb were also similar, and dissolved Cu, and Zn are abundant in the downstream and depleted in the upstream.
(2) The correlation matrix showed that dissolved Ni and Mo had correlation with water parameter, and dissolved Cu were weakly correlated with Ni, indicating that they might be affected by natural processes.
(3) The PCA results explain that dissolved Ni, Mo, and Cu were controlled by natural inputs, dissolved Cu and Cr were affected by anthropogenic activities, and dissolved Zn was influenced by agricultural activities in the downstream.
(4) The water quality of the drainage basin is excellent, but the water in upstream was worse than in midstream and downstream. The water within the drainage basin poses no risks to human health based on the HI and HQ values.
(5) Dissolved Zn, Cu, and Mo were the main heavy metals transporting into the Mekong River. Dissolved Zn from agricultural activities contributed a large amount to the Mekong River and poses potential risks, needing more attention.

Supplementary Materials

The following are available online at https://0-www-mdpi-com.brum.beds.ac.uk/1660-4601/17/3/732/s1, Table S1. Hazard quotient and hazard index for dissolved heavy metals in the Lancangjiang River.

Author Contributions

Conceptualization, B.L. and G.H.; methodology, B.L. and G.H.; software, B.L.; validation, G.H.; investigation, B.L., J.Z., R.Q., M.L., and J.L.; resources, G.H.; data curation, G.H. and B.L.; writing—original draft preparation, B.L.; writing—review and editing, B.L. and G.H.; supervision, G.H.; project administration, G.H.; and funding acquisition, G.H. All authors have read and agreed to the published version of the manuscript.

Funding

This work was supported jointly by the National Natural Science Foundation of China (Nos. 41661144029 and 41325010).

Acknowledgments

The authors gratefully acknowledge Jialiang Li from China University of Geosciences (Beijing) for their assistance with the measurement of dissolved heavy metals.

Conflicts of Interest

The authors declare no conflict of interest.

References

  1. Gaillardet, J.; Viers, J.; Dupré, B. Trace Elements in River Waters. In Treatise on Geochemistry; Elsevier: Amsterdam, The Netherlands, 2014; pp. 195–235. ISBN 978-0-08-098300-4. [Google Scholar]
  2. Han, G.; Liu, C.-Q. Water geochemistry controlled by carbonate dissolution: A study of the river waters draining karst-dominated terrain, Guizhou Province, China. Chem. Geol. 2004, 204, 1–21. [Google Scholar] [CrossRef]
  3. Maharana, C.; Srivastava, D.; Tripathi, J.K. Geochemistry of sediments of the Peninsular Rivers of the Ganga basin and its implication to weathering, sedimentary processes and provenance. Chem. Geol. 2018, 483, 1–20. [Google Scholar] [CrossRef]
  4. Dürr, H.H.; Meybeck, M.; Dürr, S.H. Lithologic composition of the Earth’s continental surfaces derived from a new digital map emphasizing riverine material transfer. Glob. Biogeochem. Cycles 2005, 19. [Google Scholar] [CrossRef]
  5. Gaillardet, J.; Dupré, B.; Louvat, P.; Allègre, C.J. Global silicate weathering and CO2 consumption rates deduced from the chemistry of large rivers. Chem. Geol. 1999, 159, 3–30. [Google Scholar] [CrossRef]
  6. Han, G.; Tang, Y.; Xu, Z. Fluvial geochemistry of rivers draining karst terrain in Southwest China. J. Asian Earth Sci. 2010, 38, 65–75. [Google Scholar] [CrossRef]
  7. Han, G.; Song, Z.; Tang, Y.; Wu, Q.; Wang, Z. Ca and Sr isotope compositions of rainwater from Guiyang city, Southwest China: Implication for the sources of atmospheric aerosols and their seasonal variations. Atmos. Environ. 2019, 214, 116854. [Google Scholar] [CrossRef]
  8. Liang, B.; Han, G.; Liu, M.; Yang, K.; Li, X.; Liu, J. Distribution, Sources, and Water Quality Assessment of Dissolved Heavy Metals in the Jiulongjiang River Water, Southeast China. Int. J. Environ. Res. Public Health 2018, 15, 2752. [Google Scholar] [CrossRef] [PubMed] [Green Version]
  9. Liang, B.; Han, G.; Liu, M.; Li, X.; Song, C.; Zhang, Q.; Yang, K. Spatial and Temporal Variation of Dissolved Heavy Metals in the Mun River, Northeast Thailand. Water 2019, 11, 380. [Google Scholar] [CrossRef] [Green Version]
  10. Tang, Y.; Han, G. Characteristics of major elements and heavy metals in atmospheric dust in Beijing, China. J. Geochem. Explor. 2017, 176, 114–119. [Google Scholar] [CrossRef]
  11. Wang, J.; Liu, G.; Liu, H.; Lam, P.K.S. Multivariate statistical evaluation of dissolved trace elements and a water quality assessment in the middle reaches of Huaihe River, Anhui, China. Sci. Total Environ. 2017, 583, 421–431. [Google Scholar] [CrossRef] [PubMed]
  12. Bu, H.; Song, X.; Guo, F. Dissolved trace elements in a nitrogen-polluted river near to the Liaodong Bay in Northeast China. Mar. Pollut. Bull. 2017, 114, 547–554. [Google Scholar] [CrossRef] [PubMed]
  13. Bu, H.; Wang, W.; Song, X.; Zhang, Q. Characteristics and source identification of dissolved trace elements in the Jinshui River of the South Qinling Mts., China. Environ. Sci. Pollut. Res. 2015, 22, 14248–14257. [Google Scholar] [CrossRef] [PubMed]
  14. Ho, P.; Shim, M.J.; Howden, S.D.; Shiller, A.M. Temporal and spatial distributions of nutrients and trace elements (Ba, Cs, Cr, Fe, Mn, Mo, U, V and Re) in Mississippi coastal waters: Influence of hypoxia, submarine groundwater discharge, and episodic events. Cont. Shelf Res. 2019, 175, 53–69. [Google Scholar] [CrossRef]
  15. Franco-Uría, A.; López-Mateo, C.; Roca, E.; Fernández-Marcos, M.L. Source identification of heavy metals in pastureland by multivariate analysis in NW Spain. J. Hazard. Mater. 2009, 165, 1008–1015. [Google Scholar] [CrossRef]
  16. Mao, G.; Zhao, Y.; Zhang, F.; Liu, J.; Huang, X. Spatiotemporal variability of heavy metals and identification of potential source tracers in the surface water of the Lhasa River basin. Environ. Sci. Pollut. Res. 2019, 26, 7442–7452. [Google Scholar] [CrossRef]
  17. Topalián, M.L.; Castañé, P.M. Principal Component Analysis of Dissolved Heavy Metals in Water of the Reconquista River (Buenos Aires, Argentina). Bull. Environ. Contam. Toxicol. 1999, 63, 484–490. [Google Scholar] [CrossRef]
  18. Islam, M.S.; Ahmed, M.K.; Raknuzzaman, M.; Habibullah-Al-Mamun, M.; Islam, M.K. Heavy metal pollution in surface water and sediment: A preliminary assessment of an urban river in a developing country. Ecol. Indic. 2015, 48, 282–291. [Google Scholar] [CrossRef]
  19. Zuzolo, D.; Cicchella, D.; Catani, V.; Giaccio, L.; Guagliardi, I.; Esposito, L.; De Vivo, B. Assessment of potentially harmful elements pollution in the Calore River basin (Southern Italy). Environ. Geochem. Health 2017, 39, 531–548. [Google Scholar] [CrossRef]
  20. Liu, M.; Han, G.; Zhang, Q. Effects of agricultural abandonment on soil aggregation, soil organic carbon storage and stabilization: Results from observation in a small karst catchment, Southwest China. Agric. Ecosyst. Environ. 2020, 288, 106719. [Google Scholar] [CrossRef]
  21. Zeng, J.; Han, G.; Wu, Q.; Tang, Y. Effects of agricultural alkaline substances on reducing the rainwater acidification: Insight from chemical compositions and calcium isotopes in a karst forests area. Agric. Ecosyst. Environ. 2020, 290, 106782. [Google Scholar] [CrossRef]
  22. Liu, J.; Han, G.; Liu, M.; Zeng, J.; Liang, B.; Qu, R. Distribution, Sources and Water Quality Evaluation of the Riverine Solutes: A Case Study in the Lancangjiang River Basin, Tibetan Plateau. Int. J. Environ. Res. Public Health 2019, 16, 4670. [Google Scholar] [CrossRef] [PubMed] [Green Version]
  23. Yang, K.; Han, G.; Zeng, J.; Liang, B.; Qu, R.; Liu, J.; Liu, M. Spatial Variation and Controlling Factors of H and O Isotopes in Lancang River Water, Southwest China. Int. J. Environ. Res. Public Health 2019, 16, 4932. [Google Scholar] [CrossRef] [PubMed] [Green Version]
  24. Kumar, M.; Goswami, R.; Awasthi, N.; Das, R. Provenance and fate of trace and rare earth elements in the sediment-aquifers systems of Majuli River Island, India. Chemosphere 2019, 237, 124477. [Google Scholar] [CrossRef] [PubMed]
  25. Wu, W.; Xu, S.; Yang, J.; Yin, H. Silicate weathering and CO2 consumption deduced from the seven Chinese rivers originating in the Qinghai-Tibet Plateau. Chem. Geol. 2008, 249, 307–320. [Google Scholar] [CrossRef]
  26. Deng, J.; Wang, Q.; Li, G.; Santosh, M. Cenozoic tectono-magmatic and metallogenic processes in the Sanjiang region, southwestern China. Earth-Sci. Rev. 2014, 138, 268–299. [Google Scholar] [CrossRef]
  27. Kang, H.; Li, D.; Chen, Y.; Song, L.; Xue, G.; Geng, J.; Xu, B.; Niu, B. Micro-continental blocks in Gondwana assembly: Geological and geochemical evidence of the Indochina block, SE Tibetan Plateau. Lithos 2019, 326–327, 460–475. [Google Scholar] [CrossRef]
  28. Noh, H.; Huh, Y.; Qin, J.; Ellis, A. Chemical weathering in the Three Rivers region of Eastern Tibet. Geochim. Cosmochim. Acta 2009, 73, 1857–1877. [Google Scholar] [CrossRef]
  29. Lupker, M.; France-Lanord, C.; Galy, V.; Lavé, J.; Gaillardet, J.; Gajurel, A.P.; Guilmette, C.; Rahman, M.; Singh, S.K.; Sinha, R. Predominant floodplain over mountain weathering of Himalayan sediments (Ganga basin). Geochim. Cosmochim. Acta 2012, 84, 410–432. [Google Scholar] [CrossRef] [Green Version]
  30. Raymo, M.E.; Ruddiman, W.F.; Froelich, P.N. Influence of late Cenozoic mountain building on ocean geochemical cycles. Geology 1988, 16, 649–653. [Google Scholar] [CrossRef]
  31. Raymo, M.E.; Ruddiman, W.F. Tectonic forcing of late Cenozoic climate. Nature 1992, 359, 117–122. [Google Scholar] [CrossRef]
  32. Ruddiman, W.F. Forcing of Late Cenozoic Northern Hemisphere Climate by Plateau Uplift in Southern Asia and the American West. J. Geophys. Res. Atmos. 1989, 94, 18409–18427. [Google Scholar] [CrossRef]
  33. Xu, P.; Tang, Y.; Zhang, S.; Liu, D.; Yang, Z.; Ma, Y. An Analysis of Different Water Source in Lancang River Basin Based on Hydrogen-oxygen Stable Isotope. China Rural Water Hydropower 2019, 1, 44–50. [Google Scholar]
  34. Chen, S.; Li, L.; Li, J.; Liu, J. Analysis of the Temporal and Spatial Variation Characteristics of Precipitation in the Lancang River Basin over the Past 55 Years. J. Geo-Inf. Sci. 2017, 19, 365–373. [Google Scholar]
  35. Zhong, R.; Zhao, T.; He, Y.; Chen, X. Hydropower change of the water tower of Asia in 21st century: A case of the Lancang River hydropower base, upper Mekong. Energy 2019, 179, 685–696. [Google Scholar] [CrossRef]
  36. An, Q.; Wu, Y.; Wang, J.; Li, Z. Assessment of dissolved heavy metal in the Yangtze River estuary and its adjacent sea, China. Environ. Monit. Assess 2010, 164, 173–187. [Google Scholar] [CrossRef]
  37. Zhang, T.; Xu, W.; Lin, X.; Yan, H.; Ma, M.; He, Z. Assessment of heavy metals pollution of soybean grains in North Anhui of China. Sci. Total Environ. 2019, 646, 914–922. [Google Scholar] [CrossRef]
  38. Meng, Q.; Zhang, J.; Zhang, Z.; Wu, T. Geochemistry of dissolved trace elements and heavy metals in the Dan River Drainage (China): Distribution, sources, and water quality assessment. Environ. Sci. Pollut. Res. 2016, 23, 8091–8103. [Google Scholar] [CrossRef]
  39. Wang, C.; Wang, X. Spatial distribution of dissolved Pb, Hg, Cd, Cu and as in the Bohai Sea. J. Environ. Sci. 2007, 19, 1061–1066. [Google Scholar] [CrossRef]
  40. Li, L.; Li, J. Study on Water Resources and Water Environment in the Lancang River Basin; Standard Press of China: Beijing, China, 2016; ISBN 978-7-03-045783-7. [Google Scholar]
  41. Wang, Z. Analysis of water resources and utilization in Lancang River basin in 2003~2017. Yangtze River 2018, 49, 40–44. [Google Scholar]
  42. China GB 5749-2006 Environmental Quality. In Standard for Drinking Water Quality; Standard Press of China: Beijing, China, 2006.
  43. United States Environmental Protection Agency. Risk Assessment Guidance for Superfund Volume I: Human Health Evaluation Manual (Part E, Supplemental Guidance for Dermal Risk Assessment); Office of Superfund Remediation and Technology Innovation: Washington, DC, USA, 2004. [Google Scholar]
  44. Shiller, A.M.; Boyle, E. Dissolved zinc in rivers. Nature 1985, 317, 49–52. [Google Scholar] [CrossRef]
  45. He, L.; Song, Y.; Chen, K.; Hou, Z.; Yu, F.; Yang, Z.; Wei, J.; Li, Z.; Liu, Y. Thrust-controlled, sediment-hosted, Himalayan Zn–Pb–Cu–Ag deposits in the Lanping foreland fold belt, eastern margin of Tibetan Plateau. Ore Geol. Rev. 2009, 36, 106–132. [Google Scholar] [CrossRef]
  46. Gao, L.; Wang, Z.; Shan, J.; Chen, J.; Tang, C.; Yi, M.; Zhao, X. Distribution characteristics and sources of trace metals in sediment cores from a trans-boundary watercourse: An example from the Shima River, Pearl River Delta. Ecotoxicol. Environ. Saf. 2016, 134, 186–195. [Google Scholar] [CrossRef] [PubMed]
  47. Simeonov, V.; Stratis, J.A.; Samara, C.; Zachariadis, G.; Voutsa, D.; Anthemidis, A.; Sofoniou, M.; Kouimtzis, T. Assessment of the surface water quality in Northern Greece. Water Res. 2003, 37, 4119–4124. [Google Scholar] [CrossRef]
Figure 1. Map of study area: (a) location of the Lancang River; (b) sampling sites in the Lancang River, where Digital Elevation Model (DEM) data are from Resource and Environment Data Cloud Platform (http:/resdc.cn/data.aspx?DATAID=284); and (c) land use map of the Lancangjiang River basin, where land use data are from OSGeo (http:/osgeo.cn/map/m0409).
Ijerph 17 00732 g001
Figure 2. Boxplots of the chemical parameters of the Lancangjiang River: (a) temperature; (b) pH; (c) total dissolved solid (TDS); (d) dissolved oxygen (DO).
Ijerph 17 00732 g002
Figure 3. Boxplots of dissolved heavy metals in the Lancangjiang River: (a) Cr; (b) Ni; (c) Cu; (d) Zn; (e) Mo; (f) Pb.
Ijerph 17 00732 g003
Figure 4. The water quality index for the water samples in the Lancangjiang River.
Ijerph 17 00732 g004
Figure 5. The hazard index values for the water samples in the Lancangjiang River.
Ijerph 17 00732 g005
Figure 6. The flux of dissolved heavy metals in the Lancangjiang River: (a) the flux of dissolved heavy metals; (b) the proportion of each dissolved heavy metal flux.
Ijerph 17 00732 g006
Table 1. The sampling coordinates and water parameters obtained from field works.
LongitudeLatitudeTemperaturepHTDSDO
(°E)(°N)°C mg/Lmg/L
LCJ-194.40299133.45605711.58.71346.56.21
LCJ-294.59506533.2154378.68.74257.46.90
LCJ-394.59130433.2115878.48.721313.06.87
LCJ-495.09190332.9751739.68.76487.56.97
LCJ-595.54543232.85894313.48.67455.06.40
LCJ-695.54991232.84476112.58.63552.56.76
LCJ-796.15095332.56282612.28.79507.06.72
LCJ-896.56211632.14081113.88.68455.06.73
LCJ-997.12027931.16379914.08.78330.96.49
LCJ-1097.07022931.71212115.78.58360.16.53
LCJ-1197.21749731.37126415.48.61353.67.46
LCJ-1297.38318730.72174616.08.53337.46.91
LCJ-1397.35367030.73458415.28.55194.46.94
LCJ-1498.35012729.63987816.68.63304.27.75
LCJ-1598.36769029.65987516.28.38204.87.11
LCJ-1698.60913029.08815817.98.44297.77.98
LCJ-1798.78847928.55306917.98.56293.87.32
LCJ-1898.91770928.47368512.38.49137.87.73
LCJ-1998.92100928.07874716.98.49267.88.68
LCJ-2099.04724127.70925617.28.51254.88.40
LCJ-2199.00029527.65375515.98.6252.78.31
LCJ-2299.08879127.35546817.38.62250.38.17
LCJ-2399.13012627.34898519.98.68120.97.26
LCJ-2499.17080727.10408619.78.46257.48.11
LCJ-2599.18890026.86832724.58.44251.67.83
LCJ-2699.14785426.47663018.18.53258.17.98
LCJ-2799.12657626.08578418.48.47241.88.38
LCJ-2899.23658525.75274918.48.41232.18.19
LCJ-2999.37322325.63084222.78.40202.27.18
LCJ-3099.30871325.42356118.88.47233.48.84
LCJ-3199.86650124.78377223.28.35234.09.15
LCJ-32100.15740124.82696924.18.40238.68.09
LCJ-33100.09994024.66768420.08.24247.77.68
LCJ-34100.48616324.52861925.18.3998.26.71
LCJ-35100.49748124.53386220.78.38252.97.39
LCJ-36100.38025923.99153021.68.40245.77.03
LCJ-37100.10317923.97399922.08.46129.46.93
LCJ-38100.18068923.54490228.68.27156.07.04
LCJ-39100.17125323.55985322.48.18239.97.15
LCJ-40100.11836722.62647024.88.47100.87.02
LCJ-41100.39629622.66739128.48.44181.47.87
LCJ-42100.46745522.59189720.68.21237.35.66
LCJ-43100.58079522.49748520.78.24241.25.36
LCJ-44100.80206222.01584922.18.25224.76.12
LCJ-45100.92270421.85174022.28.38236.05.92
Table 2. Concentrations and statistics of dissolved heavy metals in the Lancangjiang River and world’s major rivers.
CrNiCuZnMoPb
μg/Lμg/Lμg/Lμg/Lμg/Lμg/L
Upstream
LCJ-10.000.211.400.280.930.11
LCJ-2nd10.070.440.471.380.16
LCJ-30.110.480.571.091.300.21
LCJ-40.063.281.530.843.060.21
LCJ-50.040.290.300.661.810.12
LCJ-60.010.540.580.661.970.16
LCJ-70.110.430.540.531.750.11
LCJ-80.040.350.560.591.850.26
LCJ-90.070.440.310.410.750.50
LCJ-100.100.300.431.681.500.53
LCJ-110.080.290.520.231.490.09
minnd0.070.300.230.750.09
max0.113.281.531.683.060.53
mean0.050.610.650.681.620.22
SD0.040.900.420.410.610.15
MidstreamCrNiCuZnMoPb
μg/Lμg/Lμg/Lμg/Lμg/Lμg/L
LCJ-120.090.330.530.501.240.30
LCJ-130.170.360.290.190.450.12
LCJ-140.110.200.430.361.210.17
LCJ-150.360.150.770.241.290.11
LCJ-160.020.150.410.371.060.49
LCJ-170.090.200.420.711.020.16
LCJ-180.160.100.193.000.710.14
LCJ-190.090.190.461.400.940.21
LCJ-200.110.170.450.900.780.22
LCJ-210.030.050.260.830.250.35
LCJ-220.060.180.530.250.680.26
LCJ-230.270.460.910.790.510.13
LCJ-240.100.240.580.730.850.26
LCJ-250.090.250.680.390.770.44
LCJ-260.090.240.620.380.760.25
LCJ-270.150.210.680.510.890.20
LCJ-28nd0.820.090.090.750.29
minnd0.050.090.090.250.11
max0.360.820.913.001.290.49
mean0.120.250.490.690.830.24
SD0.090.170.210.680.280.11
DownstreamCrNiCuZnMoPb
μg/Lμg/Lμg/Lμg/Lμg/Lμg/L
LCJ-290.070.422.800.880.740.21
LCJ-300.060.300.900.660.830.18
LCJ-310.030.180.840.710.890.14
LCJ-320.010.230.801.210.970.18
LCJ-330.020.250.791.410.860.15
LCJ-340.490.230.831.060.520.14
LCJ-350.070.280.710.720.950.11
LCJ-360.110.190.620.540.970.40
LCJ-370.690.370.610.820.540.25
LCJ-380.080.221.010.560.450.30
LCJ-390.080.230.704.810.970.33
LCJ-400.260.220.491.830.260.15
LCJ-410.030.070.690.510.800.32
LCJ-420.040.190.530.400.990.17
LCJ-430.040.221.331.531.020.12
LCJ-440.120.230.661.201.010.31
LCJ-450.070.250.510.761.000.34
min0.010.070.490.400.260.11
max0.690.422.804.811.020.40
mean0.130.240.871.150.810.22
SD0.180.080.541.020.230.09
Lancangjiang River River0.110.330.670.861.020.23
Yangtze River 2nd0.21.70.1nd0.1
Amazon River 2ndndnd0.8ndnd
Yellow River 2nd0.30–0.590.96–1.60.07–0.32nd0.01–4.1
Upper Mississippi 2nd1.661.850.121.110.01
World Average 20.700.801.480.040.420.08
1 nd: no data; 2 Dissolved trace element concentrations in the Yangtze, Amazon, Yellow, upper Mississippi River, and world average values were collected by Gaillardet et al. (2014) [1].
Table 3. Pearson correlation matrix of water parameters and dissolved heavy metals in the Lancangjiang River.
T (°C)pHTDSDOCrNiCuZnMoPb
T1
pH−0.750 **1
TDS−0.576 **0.446 **1
DO0.136−0.012−0.1931
Cr0.184−0.058−0.249−0.1021
Ni−0.312 *0.300 *0.262−0.098−0.0371
Cu0.205−0.162−0.035−0.144−0.0630.296 *1
Zn0.123−0.350 *−0.070−0.0540.040−0.0530.0171
Mo−0.574 **0.412 **0.552 **−0.269−0.2820.637 **0.097−0.0761
Pb0.181−0.059−0.0360.025−0.146−0.027−0.1900.046−0.1001
* strong correlation coefficients at 0.05 level (two-tailed), ** strong correlation coefficients at 0.01 level (two-tailed). Number of samples: n = 45.
Table 4. Varimax rotated component matrix for the dissolved heavy metals in the Lancangjiang River.
PC123
Eigenvalues1.8811.2171.003
Variance (%)31.34220.27716.723
Cumulative (%)31.34251.61968.342
Ni0.8800.0890.039
Mo0.855−0.177−0.117
Cu0.4780.4580.062
Pb−0.128−0.7530.173
Cr−0.3330.6340.161
Zn−0.013−0.0300.973
Extraction method: Principal component analysis. Rotation method: Varimax with Kaiser normalization. Rotation converges after five iterations. Number of samples: n = 45.
Table 5. Weights for the dissolved heavy metals in the Lancangjiang River.
Eigenvalue (%)Relative Eigenvalue 1VariableLoading ValueRelative Loading Value 2Wi 3Guidelines 4 (μg/L)
PC11.881 0.459 Ni0.880 0.398 1.153 20
Mo0.855 0.386 1.187 70
Cu0.478 0.216 2.124 1000
Total2.213 1.000 0.459
PC21.217 0.297 Cu0.458 0.419 0.708 1000
Cr0.634 0.581 0.511 50
Total1.092 1.000 0.297
PC31.003 0.245 Zn0.973 1.000 0.245 1000
Total0.973 1.000 0.245
Total4.101
1 Relative eigenvalues = Eigenvalues of each PC/Total Eigenvalues; 2 Relative loading values = Loading values of each variable/Total loading values of each PC; 3 Wi = Relative eigenvalues/Relative loading values; 4 guidelines were obtained from China GB 5749-2006 [42]. number of samples: n = 45.

