Exploring Factors Influencing Injury Severity of Vehicle At-Fault Accidents: A Comparative Analysis of Passenger and Freight Vehicles


Abstract
:1. Introduction
2. Literature Review
3. Data and Methods
3.1. Data
- (1)
- Accident attributes: type of motor vehicle (X1), frontal collision (X2), side collision (X3), rear-end collision (X4), accident liability (X5);
- (2)
- Driver attributes: gender (X6), age (X7), driving years (X8), illegal act in driving (X9), owning a qualified driver’s license (X10), hit-and-run (X11);
- (3)
- Time attributes: weekday or weekend (X12), season (X13), time interval (X14), rush hour (X15);
- (4)
- Spatial attributes: administrative division (X16), location of road cross section (X17), physical isolation of road (X18), pavement condition (X19);
- (5)
- Environmental attribute: weather (X20);
3.2. Methods
4. Results
4.1. Passenger Vehicle Accidents
4.2. Freight Vehicle Accidents
5. Discussion
5.1. Common Points of Passenger and Freight Vehicle Accidents
5.2. Differences of Passenger and Freight Vehicle Accidents
5.2.1. Factors Only Influencing Injury Severity in Passenger Vehicle Accidents
5.2.2. Factors Presenting Different Results on Passenger and Freight Vehicle Accidents
6. Conclusions
Author Contributions
Funding
Acknowledgments
Conflicts of Interest
References
- Global Status Report on Road Safety 2018. Available online: https://www.who.int/violence_injury_prevention/road_safety_status/2018/en/ (accessed on 20 December 2019).
- China Statistical Year Book 2018. Available online: http://www.stats.gov.cn/tjsj/ndsj/2018/indexch.htm (accessed on 20 December 2019).
- Ting, C.; Tan, N.; Hashim, H.; Ho, C.; Shabadin, A. Malaysian Road Accident Severity: Variables and Predictive Models. In Computational Science and Technology; Springer: Singapore, 2020; pp. 699–708. [Google Scholar]
- Pei, Y.; Ding, J.; Meng, X.; Luo, J. An Initial Research into Traffic Accidents in the Cold Region. In Traffic Congestion & Traffic Safety in Century: Challenges, Innovations, and Opportunities; ASCE: Reston, VA, USA, 1997. [Google Scholar]
- Shenyang National Economic and Social Development Statistical Bulletin 2018. Available online: http://www.shenyang.gov.cn/html/SY/154700103578095/154700103578095/156047245207515/0357809542058494.html (accessed on 20 December 2019).
- Kockelman, K.; Kweon, Y. Driver injury severity: An application of ordered probit models. Accid. Anal. Prev. 2002, 34, 313–321. [Google Scholar] [CrossRef] [Green Version]
- Ma, C.; Hao, W.; Xiang, W.; Yan, W. The Impact of Aggressive Driving Behavior on Driver-Injury Severity at Highway-Rail Grade Crossings Accidents. J. Adv. Transp. 2018, 2018, 9841498. [Google Scholar] [CrossRef] [Green Version]
- Miškinis, P.; Valuntaite, V. Mathematical simulation of the correlation between the frequency of road traffic accidents and driving experience. Transport 2010, 25, 237–243. [Google Scholar] [CrossRef] [Green Version]
- Khattak, A.; Pawlovich, M.; Souleyrette, R.; Hallmark, S. Factors related to more severe older driver traffic crash injuries. J. Transp. Eng. 2002, 128, 243–249. [Google Scholar] [CrossRef]
- Chang, L.; Wang, H. Analysis of traffic injury severity: An application of non-parametric classification tree techniques. Accid. Anal. Prev. 2006, 38, 1019–1027. [Google Scholar] [CrossRef]
- Osman, M.; Paleti, R.; Mishra, S.; Golias, M.M. Analysis of injury severity of large truck crashes in work zones. Accid. Anal. Prev. 2016, 97, 261–273. [Google Scholar] [CrossRef]
- Ma, C.; Hao, W.; Pan, F.; Xiang, W. Road screening and distribution route multi-objective robust optimization for hazardous materials based on neural network and genetic algorithm. PLoS ONE 2018, 13, e0198931. [Google Scholar] [CrossRef]
- Eboli, L.; Forciniti, C. The Severity of Traffic Crashes in Italy: An Explorative Analysis among Different Driving Circumstances. Sustainability 2020, 12, 856. [Google Scholar] [CrossRef] [Green Version]
- George, Y.; Athanasios, T.; George, P. Investigation of road accident severity per vehicle type. Transp. Res. Procedia 2017, 25, 2076–2083. [Google Scholar] [CrossRef]
- Kaplan, S.; Prato, C. Risk factors associated with bus accident severity in the United States: A generalized logit model. J. Saf. Res. 2012, 43, 171–180. [Google Scholar] [CrossRef]
- Kong, C.; Yang, J. Logistic regression analysis of pedestrian casualty risk in passenger vehicle collisions in China. Accid. Anal. Prev. 2010, 42, 987–993. [Google Scholar] [CrossRef] [PubMed]
- Islam, S.; Jones, S.; Dye, D. Comprehensive analysis of single- and multi-vehicle large truck at-fault crashes on rural and urban roadways in Alabama. Accid. Anal. Prev. 2014, 67, 148–158. [Google Scholar] [CrossRef] [PubMed]
- Torregroza-Vargas, N.; Bocarejo, J.; Ramos-Bonilla, J. Fatigue and crashes: The case of freight transport in Colombia. Accid. Anal. Prev. 2014, 72, 440–448. [Google Scholar] [CrossRef] [PubMed]
- Wu, L.; Cheng, G.; Qin, L.; Zhai, L. Urban Road Traffic Conflict and Accident Prediction during the period of Ice and Snow in Cold Region. J. Transp. Syst. Eng. Inf. Technol. 2016, 16, 216–219. [Google Scholar]
- Garrido, R.; Bastos, A.; de Almeida, A.; Elvas, J.P. Prediction of Road Accident Severity Using the Ordered Probit Model. Transp. Res. Procedia 2014, 3, 214–223. [Google Scholar] [CrossRef] [Green Version]
- Theofilatos, A.; Graham, D.J.; Yannis, G. Factors Affecting Accident Severity Inside and Outside Urban Areas in Greece. Traffic Inj. Prev. 2012, 13, 458–467. [Google Scholar] [CrossRef]
- Milton, J.; Shankar, V.; Mannering, F. Highway accident severities and the mixed logit model: An exploratory empirical analysis. Accid. Anal. Prev. 2008, 40, 260–266. [Google Scholar] [CrossRef]
- Vorkojovic, A.; Kern, J.; Biloglav, Z. Risk Factors in Urban Road Traffic Accidents. J. Saf. Res. 2006, 37, 93–98. [Google Scholar] [CrossRef] [Green Version]
- Weng, J.; Meng, Q. Effects of environment, vehicle and driver characteristics on risky driving behavior at work zones. Saf. Sci. 2012, 50, 1034–1042. [Google Scholar] [CrossRef]
- Aidoo, E.; Amoh-Gyimah, R.; Ackaah, W. The effect of road and environmental characteristics on pedestrian hit-and-run accidents in Ghana. Accid. Anal. Prev. 2013, 53, 23–27. [Google Scholar] [CrossRef]
- Roshandeh, A.; Zhou, B.; Behnood, A. Comparison of contributing factors in hit-and-run crashes with distracted and non-distracted drivers. Transp. Res. Part F: Traffic Psychol. Behav. 2016, 38, 22–28. [Google Scholar] [CrossRef]
- Decision of the Ministry of Transport of the People’s Republic of China on Amending the Provisions on the Administration of Road Transport Practitioners. Available online: http://xxgk.mot.gov.cn/jigou/fgs/201907/t20190708_3222402.html (accessed on 1 February 2020).
- Zhai, X.; Huang, H.; Sze, N.; Song, Z.; Hon, K.K. Diagnostic analysis of the effects of weather condition on pedestrian crash severity. Accid. Anal. Prev. 2019, 122, 318–324. [Google Scholar] [CrossRef]
- Klop, J.; Khattak, A. Factors influencing bicycle crash severity on two-lane, undivided roadways in North Carolina. Transp. Res. Rec. 1999, 167, 78–85. [Google Scholar] [CrossRef]
- Sun, Z.; Wang, J.; Chen, Y.; Lu, H. Influence factors on injury severity of traffic accidents and differences in urban functional zones: The empirical analysis of Beijing. Int. J. Environ. Res. Public Health 2018, 15, 2722. [Google Scholar] [CrossRef] [PubMed] [Green Version]


| Interpreted Variable (Y) | Definition |
|---|---|
| Injury severity (Y) | 0 = No death; 1 = Death accident |
| Explanatory variables (X) | |
| Accident attributes | |
| Type of motor vehicle (X1) | 1 = Small-sized passenger or freight vehicles; |
| 2 = Medium-sized passenger or freight vehicles; | |
| 3 = Large-sized passenger or freight vehicles | |
| Frontal collision (X2) | 1 = Yes; 2 = No |
| Side collision (X3) | 1 = Yes; 2 = No |
| Rear-end collision (X4) | 1 = Yes; 2 = No |
| Accident liability (X5) | 1 = Full responsibility; 2 = Main responsibility |
| Driver attributes | |
| Gender (X6) | 1 = Man driver; 2 = Woman driver |
| Age (X7) | Continuous variable showing the age |
| Driving years (X8) | Continuous variable showing driving years |
| Illegal act in driving (X9) | 1 = Yes; 2 = No, irregular act only |
| Owning a qualified driver’s license (X10) | 1 = Yes; 2 = No |
| Hit-and-run * (X11) | 1 = Yes; 2 = No |
| Time attributes | |
| Weekday or weekend (X12) | 1 = Weekday; 2 = Weekend |
| Season (X13) | 1 = Spring (April, May); |
| 2 = Summer (June, July, August); | |
| 3 = Autumn (September, October); | |
| 4 = Winter (November, December, January, February, March) | |
| Time Interval (X14) | 1 = 0:00–6:00; 2 = 6:00–12:00; 3 = 12:00–18:00; 4 = 18:00–24:00 |
| Rush hour (X15) | 1 = Yes (7:00–9:00, 17:00–19:00); 2 = No (Other time periods) |
| Spatial attributes | |
| Administrative division (X16) | 1 = Main urban area; 2 = Suburban area; 3 = Outer suburbs; 4 = City highway |
| Location of road cross section (X17) | 1= Motor vehicle lane; 2 = Mixed lane of motor vehicles and non-motor vehicles; 3= Non-motor vehicle lane; 4 = Others |
| Physical isolation of road (X18) | 1 = Isolation between motor and non-motor vehicle; 2 = No isolation; 3= Central isolation; 4 = Central isolation and isolation between motor and non-motor vehicle |
| Pavement condition (X19) | 1 = Good; 2 = Others |
| Environmental attributes | |
| Weather (X20) | 1 = Sunny; 2 = Others |
| Interpreted Variable (Y) | Value | Percentage of Passenger Vehicle Accidents (%) | Percentage of Freight Vehicle Accidents (%) |
|---|---|---|---|
| Injury severity (Y) | 0 | 62.5 | 41.6 |
| 1 | 37.5 | 58.4 | |
| Explanatory variables (X) | |||
| Accident attributes | |||
| Type of motor vehicle (X1) | 1 | 91.4 | 34.6 |
| 2 | 1.1 | 3.7 | |
| 3 | 7.5 | 61.7 | |
| Frontal collision (X2) | 1 | 6.8 | 7.2 |
| 2 | 93.2 | 92.8 | |
| Side collision (X3) | 1 | 36.7 | 38.3 |
| 2 | 63.3 | 61.7 | |
| Rear-end collision (X4) | 1 | 9.5 | 17.0 |
| 2 | 90.5 | 83.0 | |
| Accident liability (X5) | 1 | 64.1 | 58.6 |
| 2 | 35.9 | 41.4 | |
| Driver attributes | |||
| Gender (X6) | 1 | 91.1 | 99.4 |
| 2 | 8.9 | 0.6 | |
| Age (X7) | Continuous variable | ||
| Driving years (X8) | Continuous variable | ||
| Illegal act in driving (X9) | 1 | 24.6 | 36.2 |
| 2 | 75.4 | 63.8 | |
| Owning a qualified driver’s license (X10) | 1 | 94.9 | 98.1 |
| 2 | 5.1 | 1.9 | |
| Hit-and-run (X11) | 1 | 13.0 | 6.2 |
| 2 | 87.0 | 93.8 | |
| Time attributes | |||
| Weekday or weekend (X12) | 1 | 71.1 | 74.9 |
| 2 | 28.9 | 25.1 | |
| Season (X13) | 1 | 10.2 | 21.3 |
| 2 | 25.9 | 30.0 | |
| 3 | 29.9 | 17.4 | |
| 4 | 33.9 | 31.4 | |
| Time Interval (X14) | 1 | 10.2 | 18.0 |
| 2 | 25.9 | 25.5 | |
| 3 | 29.9 | 34.2 | |
| 4 | 33.9 | 22.4 | |
| Rush hour (X15) | 1 | 24.8 | 19.5 |
| 2 | 75.2 | 80.5 | |
| Spatial attributes | |||
| Administrative division (X16) | 1 | 30.8 | 18.2 |
| 2 | 44.8 | 44.3 | |
| 3 | 21.4 | 30.8 | |
| 4 | 3.1 | 6.6 | |
| Location of road cross section (X17) | 1 | 68.0 | 69.2 |
| 2 | 4.8 | 16.8 | |
| 3 | 16.2 | 6.0 | |
| 4 | 10.9 | 8.1 | |
| Physical isolation of road (X18) | 1 | 1.6 | 2.3 |
| 2 | 78.8 | 75.8 | |
| 3 | 17.2 | 20.3 | |
| 4 | 2.4 | 1.7 | |
| Pavement condition (X19) | 1 | 99.5 | 98.8 |
| 2 | 0.5 | 1.2 | |
| Environmental attributes | |||
| Weather (X20) | 1 | 90.0 | 88.8 |
| 2 | 10.0 | 11.2 | |
| Variables | Passenger Vehicle Accidents | Freight Vehicle Accidents | ||
|---|---|---|---|---|
| p | Exp(B) | p | Exp(B) | |
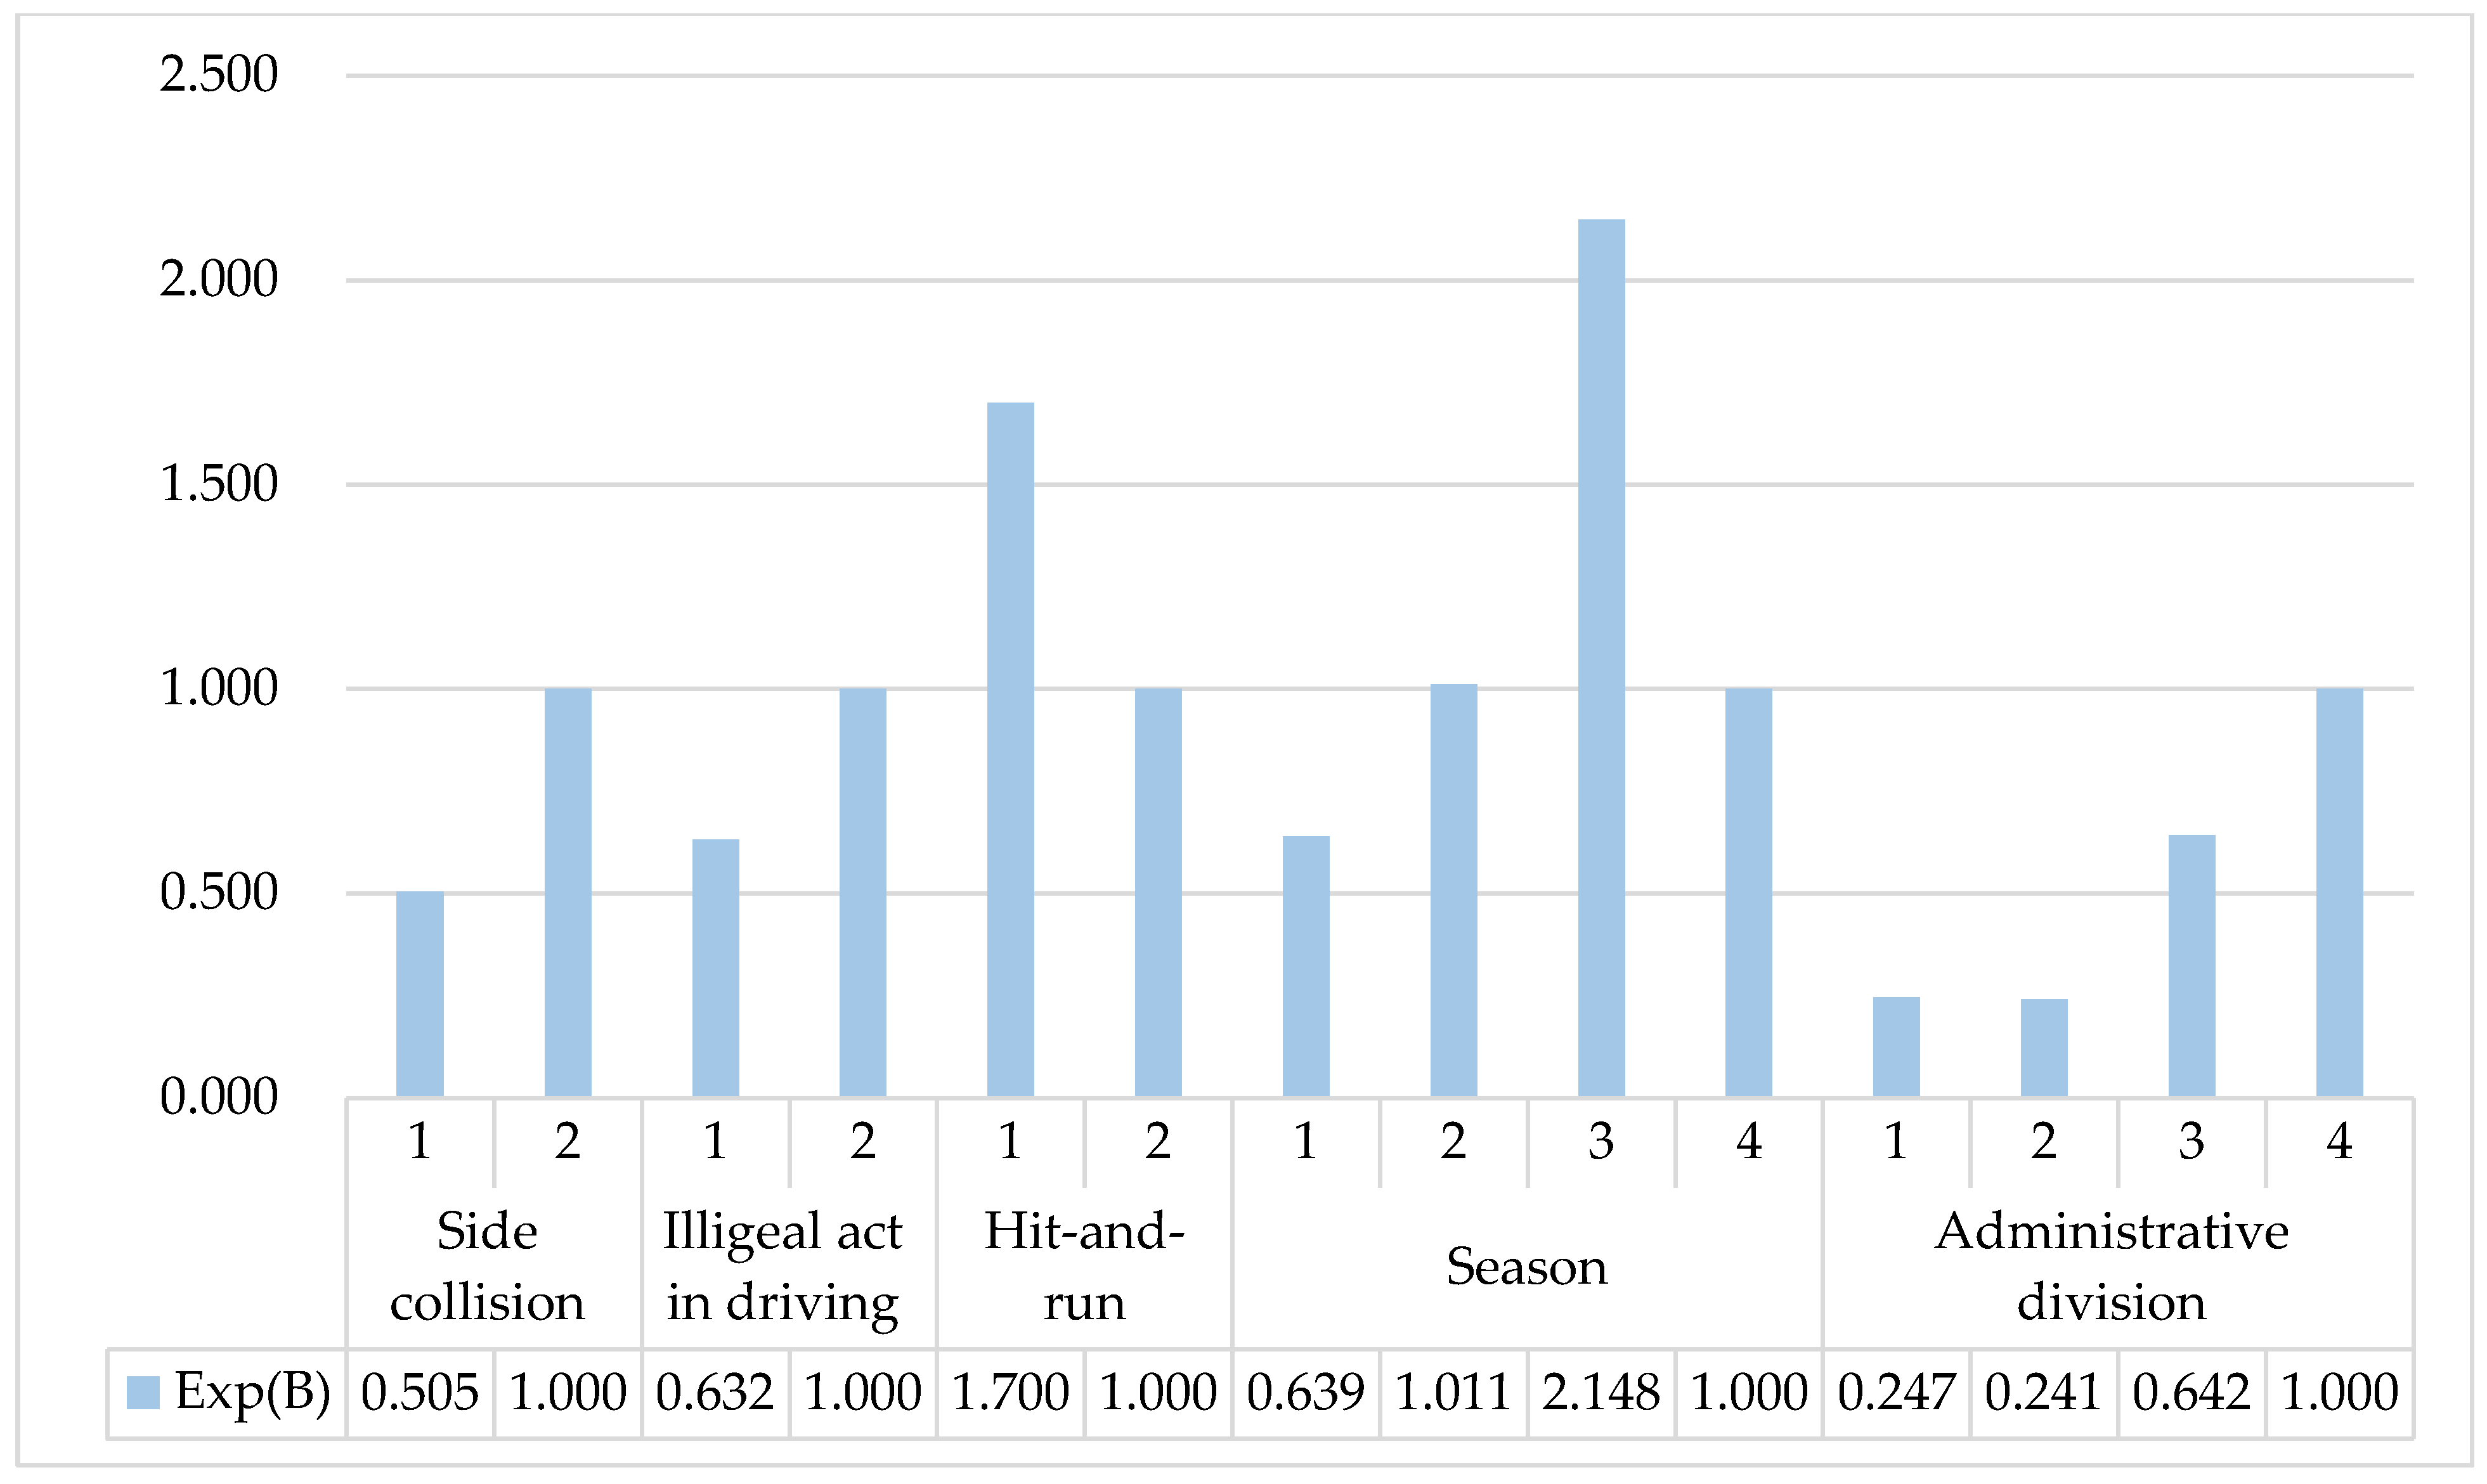
| Side collision | 0.000 | - | ||
| 1 | 0.505 | |||
| 2 | # | |||
| Illegal act in driving | 0.004 | 0.025 | ||
| 1 | 0.632 | 0.628 | ||
| 2 | # | # | ||
| Hit-and-run | 0.005 | - | ||
| 1 | 1.700 | |||
| 2 | # | |||
| Season | 0.000 | 0.047 | ||
| 1 | 0.639 | 0.698 | ||
| 2 | 1.011 | 0.673 | ||
| 3 | 2.148 | 1.438 | ||
| 4 | # | # | ||
| Administrative division | 0.000 | 0.000 | ||
| 1 | 0.247 | 1.500 | ||
| 2 | 0.241 | 1.114 | ||
| 3 | 0.642 | 3.011 | ||
| 4 | # | # | ||
| Year | Month | Maximum Temperature (°C) | Minimum Temperature (°C) |
|---|---|---|---|
| 2015 | September | 30 | 7 |
| October | 26 | −5 | |
| 2016 | September | 27 | 3 |
| October | 26 | −9 | |
| 2017 | September | 28 | 3 |
| October | 23 | −5 |
© 2020 by the authors. Licensee MDPI, Basel, Switzerland. This article is an open access article distributed under the terms and conditions of the Creative Commons Attribution (CC BY) license (http://creativecommons.org/licenses/by/4.0/).
Share and Cite
Wang, J.; Lu, H.; Sun, Z.; Wang, T. Exploring Factors Influencing Injury Severity of Vehicle At-Fault Accidents: A Comparative Analysis of Passenger and Freight Vehicles. Int. J. Environ. Res. Public Health 2020, 17, 1146. https://0-doi-org.brum.beds.ac.uk/10.3390/ijerph17041146
Wang J, Lu H, Sun Z, Wang T. Exploring Factors Influencing Injury Severity of Vehicle At-Fault Accidents: A Comparative Analysis of Passenger and Freight Vehicles. International Journal of Environmental Research and Public Health. 2020; 17(4):1146. https://0-doi-org.brum.beds.ac.uk/10.3390/ijerph17041146
Chicago/Turabian StyleWang, Jianyu, Huapu Lu, Zhiyuan Sun, and Tianshi Wang. 2020. "Exploring Factors Influencing Injury Severity of Vehicle At-Fault Accidents: A Comparative Analysis of Passenger and Freight Vehicles" International Journal of Environmental Research and Public Health 17, no. 4: 1146. https://0-doi-org.brum.beds.ac.uk/10.3390/ijerph17041146