Article

Prediction of Epidemic Spread of the 2019 Novel Coronavirus Driven by Spring Festival Transportation in China: A Population-Based Study

1
School of Sociology, Central China Normal University, Wuhan 430079, Hubei Province, China
2
School of Public Administration, Hangzhou Normal University, Hangzhou 311121, Zhejiang Province, China
3
School of Social and Behavioral Sciences, Nanjing University, Nanjing 210046, Jiangsu Province, China
4
School of Sociology, Wuhan University, Wuhan 430072, Hubei Province, China
5
School of Economics, Minzu University of China, Beijing 100081, China
*
Author to whom correspondence should be addressed.
Int. J. Environ. Res. Public Health 2020, 17(5), 1679; https://0-doi-org.brum.beds.ac.uk/10.3390/ijerph17051679
Submission received: 7 February 2020 / Revised: 22 February 2020 / Accepted: 29 February 2020 / Published: 4 March 2020
(This article belongs to the Section Environmental Health)

Abstract

:
After the 2019 novel coronavirus (2019-nCoV) outbreak, we estimated the distribution and scale of more than 5 million migrants residing in Wuhan after they returned to their hometown communities in Hubei Province or other provinces at the end of 2019 by using the data from the 2013–2018 China Migrants Dynamic Survey (CMDS). We found that the distribution of Wuhan’s migrants is centred in Hubei Province (approximately 75%) at a provincial level, gradually decreasing in the surrounding provinces in layers, with obvious spatial characteristics of circle layers and echelons. The scale of Wuhan’s migrants, whose origins in Hubei Province give rise to a gradient reduction from east to west within the province, and account for 66% of Wuhan’s total migrants, are from the surrounding prefectural-level cities of Wuhan. The distribution comprises 94 districts and counties in Hubei Province, and the cumulative percentage of the top 30 districts and counties exceeds 80%. Wuhan’s migrants have a large proportion of middle-aged and high-risk individuals. Their social characteristics include nuclear family migration (84%), migration with families of 3–4 members (71%), a rural household registration (85%), and working or doing business (84%) as the main reason for migration. Using a quasi-experimental analysis framework, we found that the size of Wuhan’s migrants was highly correlated with the daily number of confirmed cases. Furthermore, we compared the epidemic situation in different regions and found that the number of confirmed cases in some provinces and cities in Hubei Province may be underestimated, while the epidemic situation in some regions has increased rapidly. The results are conducive to monitoring the epidemic prevention and control in various regions.

1. Introduction

The outbreak of a new coronavirus (2019-nCoV) has spread internationally since the initial report of cases by Wuhan Municipal Health Commission, China on 31 December 2019 [1,2,3,4]. On 26 January 2020, WHO announced that there is a high risk of a 2019-nCoV epidemic in China and at a global level [5].
By 31 January 2020, 9720 confirmed cases, 15,238 suspected cases and 176 cures of 2019-nCoV, and 213 deaths from 2019-nCoV had been reported by the national authorities in China [6]. Some confirmed cases had also been reported in Thailand, Singapore, the United States, Australia, Japan, Korea, Malaysia, France, Vietnam, Nepal, Canada, Cambodia, Germany, and Sri Lanka [7].
Based on preliminary judgments, the transmission of this coronavirus has particular distinguishing features [8,9,10,11]. First, the epidemic first originated in Wuhan and then spread to other places [12,13,14,15,16]. Second, the illness can spread from human to human [9,13,14,15,16,17,18,19,20,21,22], for example, there have been several cases of human-to-human transmission in Guangdong Province during family gatherings [23], and several healthcare workers were diagnosed in the early period of the outbreak [24]. Additionally, the 2019-nCoV coronavirus can survive in an environment and on the surface of objects up to 14 days [8].
The floating population, i.e., the seasonal and temporary non-resident population of a geographic area, is a potential carrier for virus transmission [16,21]. Wuhan, the epicentre of the outbreak, has a large floating population, and, being in the centre of China, is a major travel hub. Wuhan is a megacity, with a population of over 11 million in 2018, which includes a floating population of 2,243,700 living there for six months or more [25].
This floating population may have exposure history in Wuhan, and could contribute to the increase in transmission of 2019-nCoV. Considering the features of 2019-nCoV transmission and the large-scale regional travel that occurs over the Spring Festival holiday [26], the Wuhan government announced the implementation of travel restrictions on 23 January 2020 [27]. However, many migrant workers had already left Wuhan by this date, and returned to their hometowns in other areas of China [28]. This floating population may therefore have transmitted 2019-nCoV in their hometowns, especially those members of this population within Hubei Province.
The dualistic structure of urban and rural populations in China is likely to exacerbate the 2019-nCoV epidemic [29]. Many of Wuhan’s floating population who are from rural areas but work in the Wuhan metropolitan area may be susceptible. For example, Wuhan’s Huanan Seafood Wholesale Market, which is regarded as a possible point source of the virus, is less than 600 metres from the Hankou Railway Station [30]. This district and railway station is a hub of migrant worker life and transport.
As individual members of the floating population must frequently work overtime hours, are vulnerable to having poor nutrition, and due to lack of resources have higher rates of poor health [29,31], they may have lower resistance to 2019-nCoV infection. Due to lower educational investment in this population, it may be more difficult for individuals to identify preventive healthcare information, which may cause misidentification of 2019-nCoV infection as the common cold or flu. Compounding this issue, most public medical resources are concentrated in cities but are relatively scarce in rural areas [29,31]. Therefore, prevention and treatment of 2019-nCoV in rural areas will be more challenging if new phases of the epidemic emerge.
To determine the influence of the floating population on the spread of 2019-nCoV, we used data from China Migrants Dynamic Survey (CMDS) released by the National Health Commission of China to analyse the national distribution of the origins of Wuhan’s floating population, and provide reference information to predict the trend of the epidemic.
The purposes of this study were to estimate the distribution and scale of the migrants residing in Wuhan after they returned to their hometown communities in Hubei Province or other provinces after the 2019-nCoV outbreak. The social characteristics of the migrants are also analysed in the study, including age group, educational level, pattern of migration, number of migrating family members per household, type of household registration, and reasons for migration. In addition, we assumed a quasi-experimental approach to estimate the epidemic prevention and control in various regions of China. On the one hand, these findings are conducive to epidemic prevention and control, and on the other hand, currently, the predictive model of the 2019-nCoV is not detailed enough because of the lack of relevant parameters. Therefore, this study is beneficial for virologists, epidemiologists and medical professionals to deepen the study of the virus transmission and improve the accuracy of model prediction.
The analysis object of this study was the floating population who have lived in Wuhan for more than one month. Short-term migrants and students were not included. Distinct from other models of the dynamics of this epidemic, we used the information of the respondents from the CMDS and their family members to further explore the origins of Wuhan’s migrant population, such as their returning destination, population characteristics, family structures and other metrics. This approach can provide practical solutions to prepare prevention strategies, and approaches to assess resources for treatment and containment of the epidemic.

2. Research in Context

2.1. Evidence before This Study

The National Health Commission of China released a report on 27 January 2020 that stated that 2019-nCoV could be transmitted not only via respiratory droplets, but also via direct contact. 2019-nCoV has now spread nationally and worldwide, and due to the lack of data on the size and origins of the floating population of Wuhan, it has been difficult for the Chinese government to arrange real-time medical resources and implement effective public health interventions.

2.2. Added Value of This Study

We used data from the Wuhan Floating Population Monitoring Survey to estimate the size and origins of the migrant population in Wuhan. We also described the socio-demographic characteristics of this population, and compared confirmed cases from different regions to estimate the epidemic with modelling techniques. We found that three-quarters of Wuhan’s floating population are from Hubei Province, and that nearly 85% migrated with nuclear families. The number of members per family is 3 to 4, and most individuals are migrant workers from rural areas with low education levels. By comparing the predicted and actual values obtained from the model, we analysed the profile of the epidemic in various regions since January 25, and found that the spread of the 2019-nCoV has varied greatly between regions, and that the epidemic in some regions may be underestimated. There may also be unknowns, such as structural factors in some regions, that deserve further attention.

2.3. Implications of All the Available Evidence

The majority of the floating population left Wuhan before the city was “closed off” by authorities, so our analysis will be useful for estimating the key geographic areas for prevention and control. The results indicate that the floating population of Wuhan is centred in Hubei Province and the surrounding provinces, so local government must quickly and effectively take steps to prevent further spread of 2019-nCoV. Higher-level governments must also strengthen the assistance they are providing, such as sending medical workers and medical supplies to these areas to avoid 2019-nCoV becoming a new pandemic. At the same time, it is important to increase surveillance in areas where the epidemic may be underestimated, and promptly identify prevention and control loopholes to reduce the burden of a new round of transmission.
China has been deeply involved in the globalisation process, and even China’s central and western regions have become important links in the global production and trade chain. Therefore, while our research is aimed at China in the current era of migration, this research has practical implications for global public health and disease control, as floating populations are increasing in size all over the world and relationships between countries are becoming increasingly close. Thus, other countries should pay attention to the epidemic situation in specific geographic areas of China to prevent secondary and international transmission of the 2019-nCoV.

3. Methods

3.1. Data Sources

The data used in this study are based on the 2013–2018 China Migrants Dynamic Survey (CMDS), and the tabulated data of 5 million migrants in Wuhan recently released by the Wuhan municipal government. This survey was carried out via a multi-stage stratified sampling method, and collected data with structured questionnaires. As survey data is limited to the mainland provinces, municipalities, autonomous regions, and Hainan Province, the population analysed in this study excluded the populations of Hong Kong and Macao. A total of 11,999 samples of the resident floating population in Wuhan from 2013 to 2018 were extracted from the survey dataset.
According to the survey design, Wuhan’s floating population was defined as the population from other cities and districts, aged 15 and over, residing for more than one month in Wuhan, and not registered in Wuhan. In Table 1, the sample distribution of the resident population in Wuhan over time is presented. The sample size was 1999 in the year 2013, and 2000 for other years.
The outbreak is considered to have originated in the Huanan Seafood Market, near Hankou Railway Station in the Jianghan District, Wuhan, China. A severely infected area was concentrated in the urban areas of Hankou. From the sample distribution in Table 1, the floating population of Wuhan is seen to be concentrated in the urban area of Hankou. The results indicate that the sample proportion of Jianghan District and nearby Jiang’an District, Tongkou District, and Dongxihu District is approximately 51.6%. Therefore, the samples used in this study are suitably representative and thus acceptable for assessing the spread of the 2019-nCoV outbreak among the floating population.
We obtained data from the “Dingxiangyuan” National Real-time Epidemic website on confirmed cases from 25 January to 31 January 2020 [6]. These data are compiled from open data released by authorities such as the National Health Commission, and the provincial and municipal health commissions. To ensure data comparability, we collected the data daily from 12:00 to 14:00 every day.

3.2. Data Processing

Using the information of the floating population and their family members in Wuhan, we analysed their return destinations and their structural characteristics by descriptive statistical methods. In Table 2, the distribution of the origins of Wuhan’s floating population is presented, at the provincial level, over the past several years. The sample size is quite stable for each province over time. The province of origin for 75% of the floating population was Hubei Province, which contains the city of Wuhan, and approximately 25% of the population originated in other provinces.
The location information published in other historical survey data is limited to the province where household registration is located, due to a lack of data for 2019. The data provided by the Hubei Provincial Health Commission in 2017 includes more detailed information of prefectures, cities, districts and counties. The analysis was therefore divided into two parts; the first part comprised an analysis of the origin of Wuhan’s floating population at the provincial level using historical data. The second part comprised an analysis of the floating population within Hubei Province based on 2017 data. When analysing the floating population at the provincial level, we used all samples from the previous years—i.e., the mean of 6 years of data collection—to ensure the robustness of the results, in view of the stability of sample distributions in each province over time.
According to the current infectious features of 2019-nCoV, which are that middle-aged and elderly people have a high risk of infection, and transmission can occur between individuals, families and communities, we assessed several main variables. These comprised age group, educational level, pattern of migration, number of migrating family members per household, type of household registration, and reasons for migration. We defined these variables in the following ways: (1) age group was classified as under 20, 21–30, 31–40, 41–50, 51–60, and over 60; (2) educational level was divided into junior high school and below, high school/secondary school, and college and above; (3) pattern of migration was divided into independent migration, nuclear family migration, and extended family migration; (4) number of migrating family members per household was classified as 1, 2, 3, 4, and 5 or more; (5) types of household registration were divided into rural and urban household registration; (6) reasons for migration were working and doing business, family relocation, or other reasons.

3.3. Quasi-Experimental Design

The analyses assume a theoretical model of 2019-nCoV transmission. We considered a floating population of 5 million in Wuhan, who returned to their hometowns from 23 January 2020, as potential infected persons. Moreover, we added factors of demographic characteristics, the situation of medical diagnosis, government prevention and control, the number of confirmed cases, and undisclosed data to our statistical model to estimate the dynamics of the epidemic. After controlling for certain factors, we analysed the factors that were not controlled, such as government intervention and the number of statistical reports.
Specifically, we first analysed the correlation between the size of the floating population in Wuhan and the number of confirmed cases per day. Then, we examined the differences among regions and proposed a transmission rate as a reference to compare the differences in regions. In the comparative analysis, we focused on the probably underestimated number of cases and the virus transmission rate to determine the likelihood of epidemics existing in different regions.

3.4. Prediction Model Setting

Finally, we predicted the floating population of Wuhan using statistical methods and compared it with the number of 2019-nCoV confirmed cases in each region, to identify regional differences of 2019-nCoV infection. Furthermore, we predicted the forthcoming epidemic trend at the prefecture- and province-level based on the proportion of Wuhan’s floating population represented by people from these areas.
Human-to-human transmission of the 2019-nCoV has been confirmed. Four sets of factors that may influence regional differences appear to be involved: (1) Demographic factors, such as short-term business travellers between Wuhan and other regions, college students in Wuhan returning to their homes in other regions, Spring Festival tourists from Wuhan to other regions, and trans-regional floating populations for Spring Festival family reunions from or across Wuhan; (2) Intervention factors, such as medical treatments and governmental preventative measures; (3) Information disclosure and the information release system; and (4) Other unknown factors.
We considered all these factors, and hypothesised the social environment of 2019-nCoV transmission. First, although the government had taken the unprecedented measure of sealing off Wuhan city on 23 January 2020, we assumed that, at that time, the entire floating population of Wuhan, all short-term business travellers to Wuhan and all college students in Wuhan had returned to their hometowns throughout China, because 24 January 2020 was the Spring Festival’s Eve (normally, the 2020 Spring Festival holiday from January 24 to 30). Moreover, this Spring Festival vacation period started at least a week before this date time, leaving plenty of time for these people to leave the city.
However, the number of people in Wuhan that travelled to reunite with their families in other cities during the Spring Festival vacation may be negligible, for the sealing-off of the city and other preventive measures taken across the country may have prevented their travelling. Second, the influence of the college students in Wuhan was an invariant factor, as college students are young and healthy, have fixed travelling routes, come from different regions evenly scattered across the country, and travelled to return home on or around January 10; we would assume their influence on virus transmission to different regions to be the same. Third, the medical treatment ability of regional medical centres of Hubei Province would also be the same, as the breakout emerged so fast that these regional medical centres would have had the same level of emergency-preparedness. Finally, the above factors will not change dramatically until the mass return of Wuhan’s floating population after the conclusion of the Spring Festival vacation.

4. Results

4.1. Description of Statistical Analysis

To estimate the floating population in the cities of Hubei Province and across the country, we must determine the floating population residing in Wuhan in 2019. As the statistics compiled by the Wuhan city government from 2019 have not been released, the data from previous years was used for this prediction. The prediction of floating population in Wuhan based on the statistics from previous years is presented in Table 3, demonstrating that there were approximately 2.43 million migrants living in Wuhan for more than six months in 2019.
However, if the predictions of the statistical data were combined with survey data, which was used in this study to estimate the origin of Wuhan’s floating population that return to their hometowns, there would have been a problem with inconsistent statistical strength. This would have resulted from the fact that the floating population measured by the government statistics department reflects those who have lived in Wuhan for more than 6 months, but the respondents in the survey have lived in Wuhan for over one month. A shorter defined residence time would have therefore produced a larger estimate of the population, and thus the total floating population in Wuhan, as determined from the CMDS data, was larger than the population as determined by the government statistics department.
On 22 January 2020, Xinhua News Agency (an official government media source) interviewed the mayor of Wuhan and reported that more than 5 million members of the floating population had returned to their hometowns before the Spring Festival holiday. This number stated (over 5 million) was more than twice the predicted value in this study (2.43 million), indicating that the statistical strength of the news report was based on a shorter period of residence, and this was consistent with the data we used to determine the floating population residing in Wuhan for over one month. Thus, in the absence of more rigorous and authoritative total data, we used 5 million people as Wuhan’s floating population, from which to estimate the scale and distribution of those members of this population who returned to their hometown during the Festival.

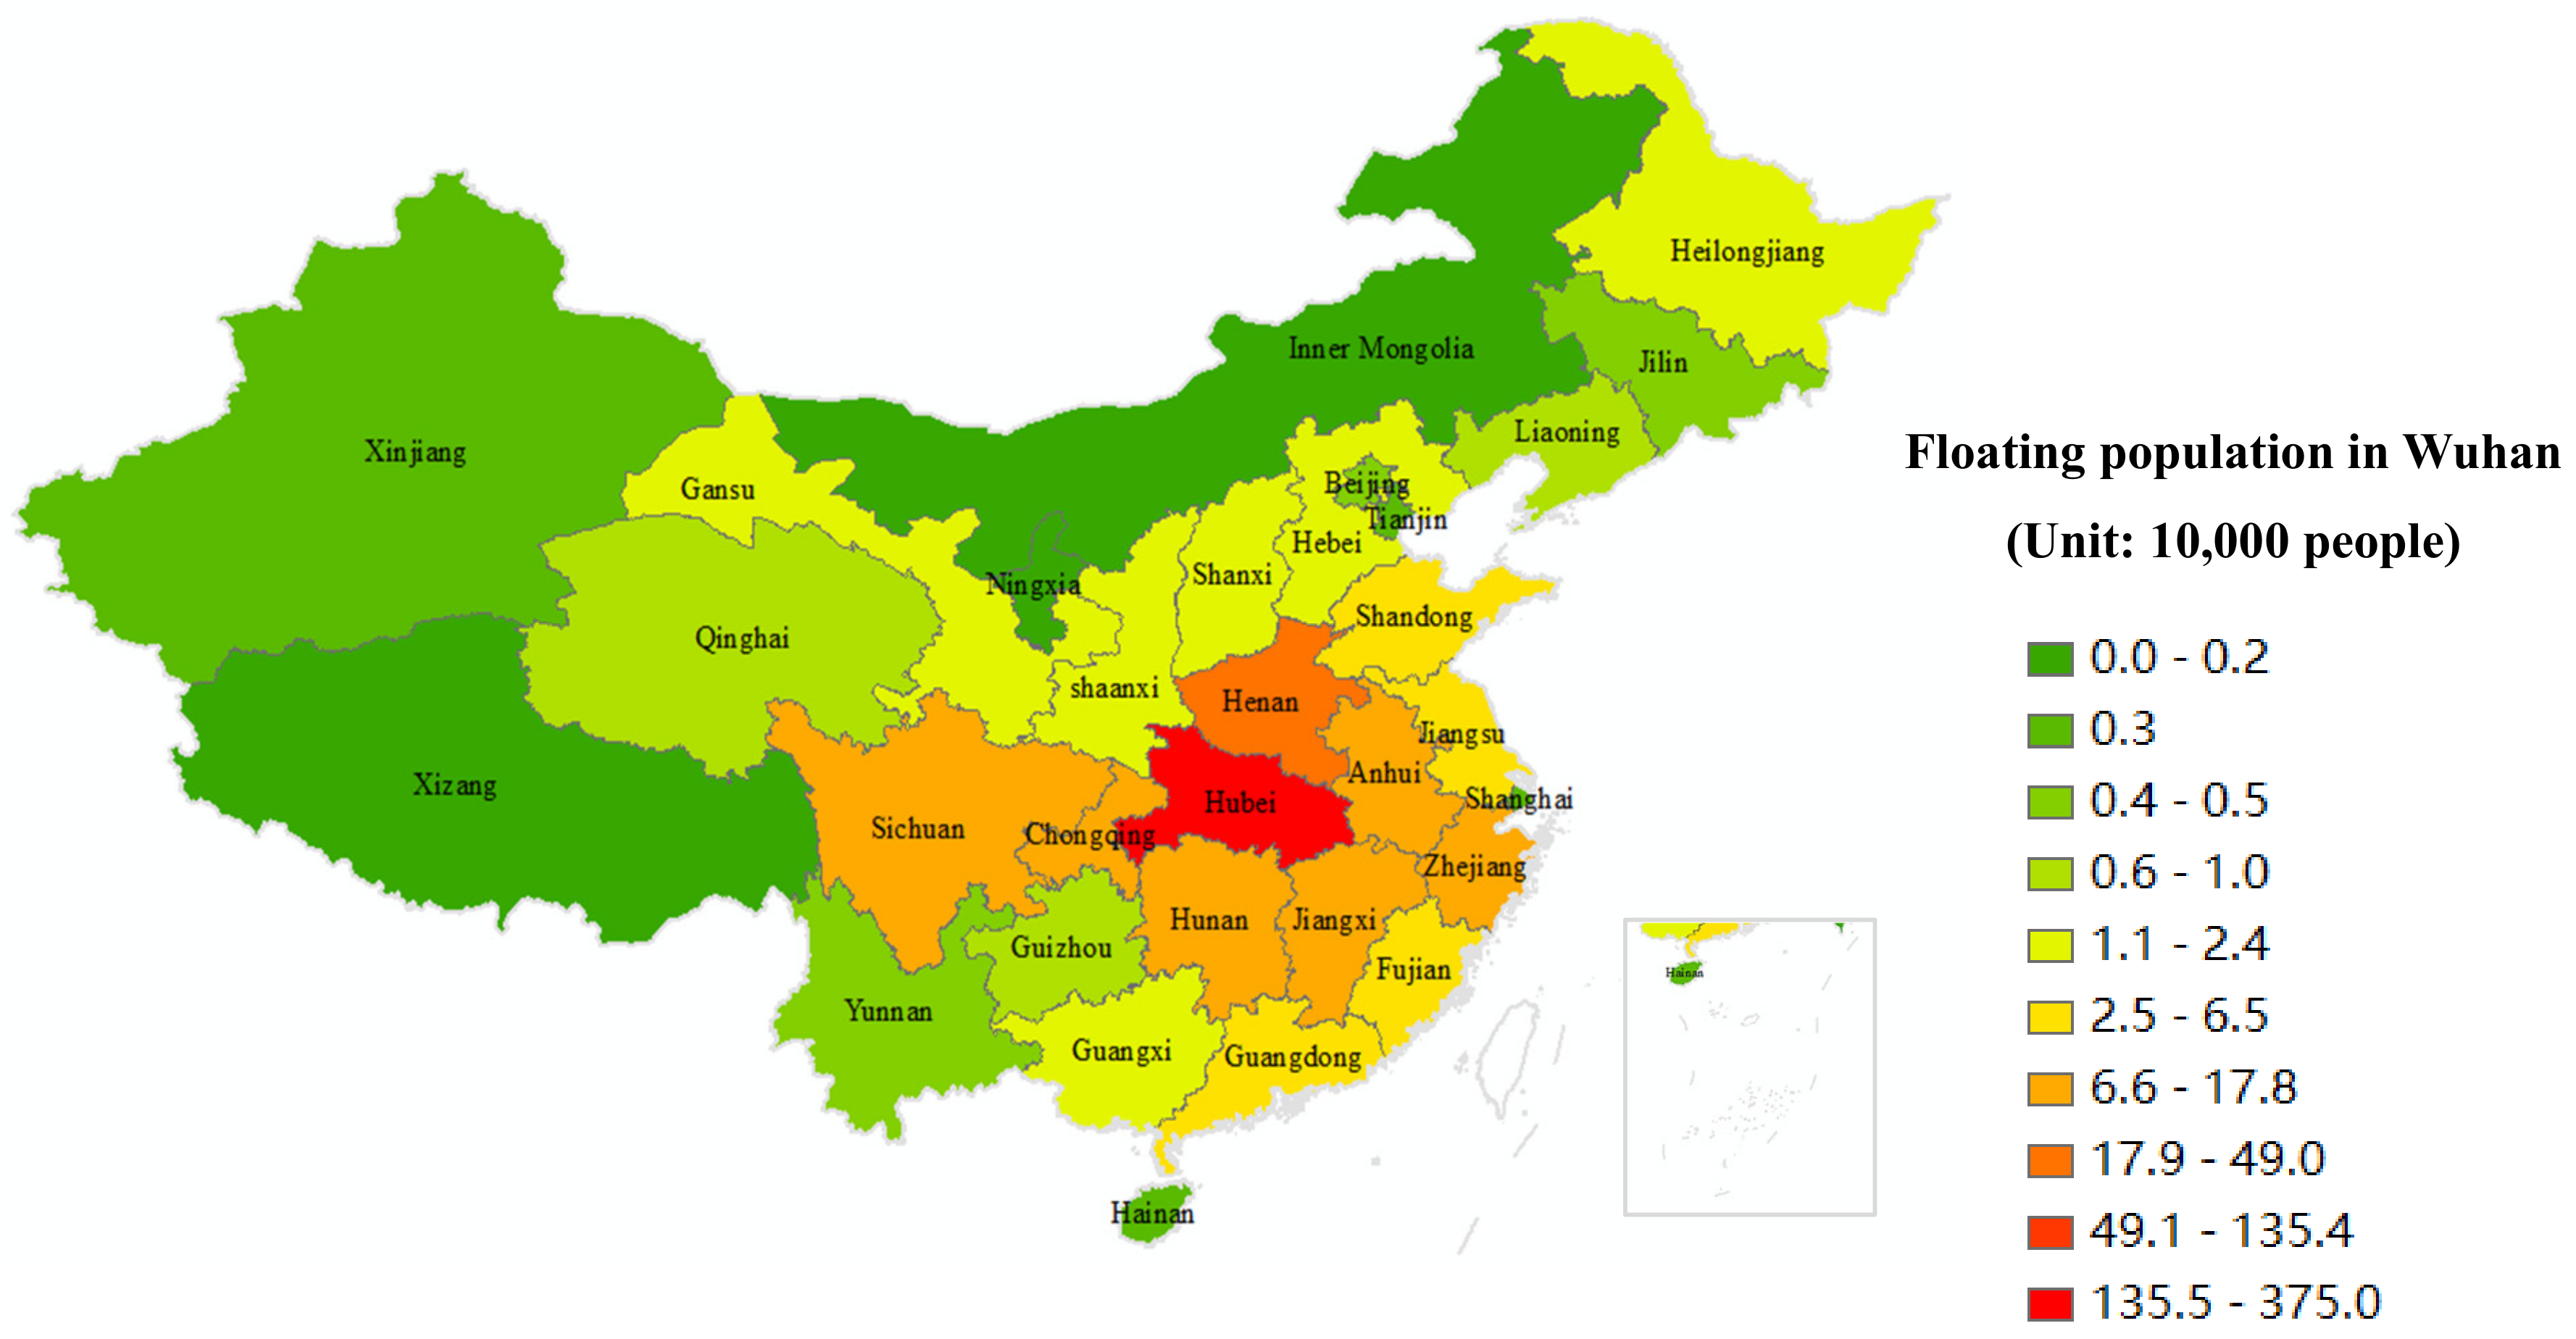
4.2. National Distribution and Social Characteristics of the Origins of Wuhan’s Floating Population

Based on sample survey data, in Table 4, the proportional estimation of the origins of Wuhan’s floating population at a provincial level is presented, as well as the results of statistical analysis based on a floating population of 5 million.
The national distribution of the migrants presents obvious spatial characteristics of circle layers and echelons at provincial level (Table 4 and Figure 1).
(1) Hubei Province is the central area of origin of Wuhan’s floating population, accounting for 75% of the population, with a 95% confidence interval of (74.21, 75.76). Based on a total population of 5 million people, Wuhan’s floating population with household registration in Hubei Province is approximately 3.75 million, with a 95% confidence interval of (3,710,227 to 3,788,125).
(2) Henan, Anhui, Jiangxi and Hunan Provinces belong to the first circle layer. Henan Province, home to a floating population of 337,000, had the highest proportion with respect to its total population, equating to approximately 6.7% and a 95% confidence interval of (315,401 to 360,712).
Based on the analysis of city data in 2017, Xinyang, Zhumadian, Shangqiu, and Nanyang cities in Henan Province accounted for 38.82%, 20.59%, 12.94%, and 10.59% respectively, of the floating population from Henan living in Wuhan, accounting for approximately 83% of the total. The floating population proportions of Anhui, Hunan, and Jiangxi Provinces were 2.7%, 2.5%, and 2.4%, respectively, with corresponding floating populations in Wuhan of 136,000, 126,000, and 121,000 respectively.
(3) Chongqing, Zhejiang, Sichuan, Fujian and Jiangsu Provinces are at the second circle layer, with 1.65%, 1.39%, 1.39%, 1.00% and 0.92% floating populations, respectively, with corresponding populations of approximately 83,000, 70,000, 70,000, 50,000 and 46,000 respectively.
(4) Shandong, Guangdong, Hebei, Gansu, Guangxi, Heilongjiang, Shaanxi, Shanxi and Guizhou Provinces are at the third circle layer, with a proportion of 0.19% to 0.62% and a corresponding population of 10,000 to 30,000.
(5) Some provinces and municipalities, including Qinghai, Liaoning, Yunnan, Jilin and Beijing, are located in the fourth circle layer, accounting for 0.08–0.16% of the floating population, equating to 4000–8000 people.
(6) The remaining provinces and municipalities, such as Hainan, Xinjiang, Tianjin, Shanghai, Inner Mongolia, Tibet and Ningxia, are at the fifth circle layer, with a floating population proportion of less than 0.04%, corresponding to ≤2000 people.
As presented in the table above, this population is mainly 21–40 years old, but the scale of the susceptible, high-risk and over 40 years old population is also very large. The distribution is as follows:
(1) The susceptible and high-risk population is concentrated in Hubei Province. The size of the 41–50 age group is more than 800,000, that of the age group of 51–60 is 180,000, and the number of people over 60 is 40,000.
(2) Henan and Anhui Provinces have larger susceptible and high-risk populations, of more than 100,000 and nearly 40,000, respectively.
(3) Six provinces and municipalities, namely Hunan, Jiangxi, Chongqing, Zhejiang, Sichuan and Jiangsu, have a high-risk population of 41 to 50 years old, comprising 14,000–30,000 people.
(4) In 10 provinces, namely Fujian, Shandong, Guangdong, Hebei, Gansu, Guangxi, Shanxi, Guizhou, Qinghai and Xinjiang, the susceptible and high-risk populations are also concentrated in the 41–50 age group, with a population of approximately 1500–6550.
(5) The three provinces of northeast China, namely Heilongjiang, Jilin and Liaoning, have large susceptible and high-risk populations, equating to approximately 7000 in Heilongjiang and approximately 3000 in Jilin and Liaoning.
Infection of family members is a main means of transmission, and the distribution of the characteristics of floating population family migration at the provincial level are detailed in Table 5. The vast majority of the floating population migrates to Wuhan in the form of nuclear families (84.42%), and most families comprise 3–4 members (71.44%). The distribution is as follows:
(1) The number of nuclear family households in the Wuhan floating population that originates from Hubei Province is 3.425 million, accounting for 62.85% of the total floating population of Wuhan, and households with 3-4 family members number 2,693,500, accounting for 53.87% of the total. The high risk of 2019-nCoV transmission within and by this population is self-evident.
(2) Families from Henan, Anhui, Hunan and Jiangxi Provinces comprise a large proportion of those in the floating population of Wuhan. Those from Henan total nearly 300,000 households, and the number of these households with 3–4 family members is more than 240,000. Approximately 110,000 families from the remaining provinces are part of the floating population of Wuhan, including nearly 100,000 3–4 family-member households from Anhui and more than 80,000 from Hunan and Jiangxi.
(3) The number of families in the floating population of Wuhan from Chongqing, Zhejiang, Sichuan, Fujian and Jiangsu municipalities and provinces is 40,000–80,000, and the number of households with 3-4 family members is 30,000–60,000.
(4) The number of families in the floating population of Wuhan that originate from 7 other provinces, namely Shandong, Guangdong, Hebei, Gansu, Guangxi, Heilongjiang and Shaanxi, is 10,000–30,000 households, and the number of households with 3–4 family members is approximately 20,000. The remaining provinces comprise fewer than 10,000 households Jiangxi.
Certain factors can easily spread the virus from homes to communities in rural areas, such as a lack of medical resources and investment, weak health prevention and control, low awareness of health, and insufficient awareness of infectious diseases. In Table 5, the floating population in Wuhan is dominated by rural households (85.14%), and working or doing business is the main reason for their having travelled to Wuhan (84.29%). Therefore, epidemic prevention and control in rural areas is of critical importance. The distribution is as follows:
(1) The joint distribution of the origins of Wuhan’s floating population within Hubei Province is 63.73%, equating to a population of 3,186,500, and 62.71% of these are migrant workers, equating to 3,135,500 people.
(2) Henan, Anhui, Hunan, and Jiangxi Province both have more than 100,000 households with rural household registers and migrant workers in Wuhan, and the population of those from Henan in Wuhan’s floating population is approximately 300,000.
(3) Chongqing, Zhejiang, Sichuan, Fujian, Jiangsu, Shandong, Guangdong, Hebei, Gansu, and Guangxi Provinces together have a population of 10,000–80,000 households with rural household registers in Wuhan and less than 10,000 in the remaining provinces of China. Notably, Guangdong, Gansu, Heilongjiang and Liaoning have a larger proportion of the population with urban household registers, and this is greater than the number of rural household registers in Guangdong Province.
Virus transmission is related to individual health awareness, which is affected by an individual’s educational level, so we also examined the educational level of the floating population in Wuhan. In Table 5, 60% of the population was educated to junior middle school and below, 26% had senior high school or technical secondary school education, and 14% had college education and above, indicating that the overall education level of this population was low. Specifically:
(1) In the provinces of Qinghai, Chongqing, Jiangxi, Anhui, Henan, Yunnan, Guangxi and Xinjiang, 60% or more of the population was educated to junior high school level or below.
(2) Approximately 50–60 % of the population of the provinces of Hubei, Sichuan, Hebei, Fujian, Jiangsu, Hunan, Guizhou, Shandong, Shanxi, Tibet and Gansu was educated to junior high school level or below.
(3) The population in three municipalities, including Beijing, Tianjin and Shanghai, have a high level of education, with over 66% receiving tertiary education. The population of the remaining provinces had a medium-to-high educational level.
Above all, these data indicated that there is a large middle-aged and older high-risk floating population in Wuhan. Their social characteristics include having travelled to Wuhan in a nuclear family of 3–4 members, being on a rural household register, and often having a lower educational level. These characteristics are consistent with conditions favouring the wide spread of 2019-nCoV.

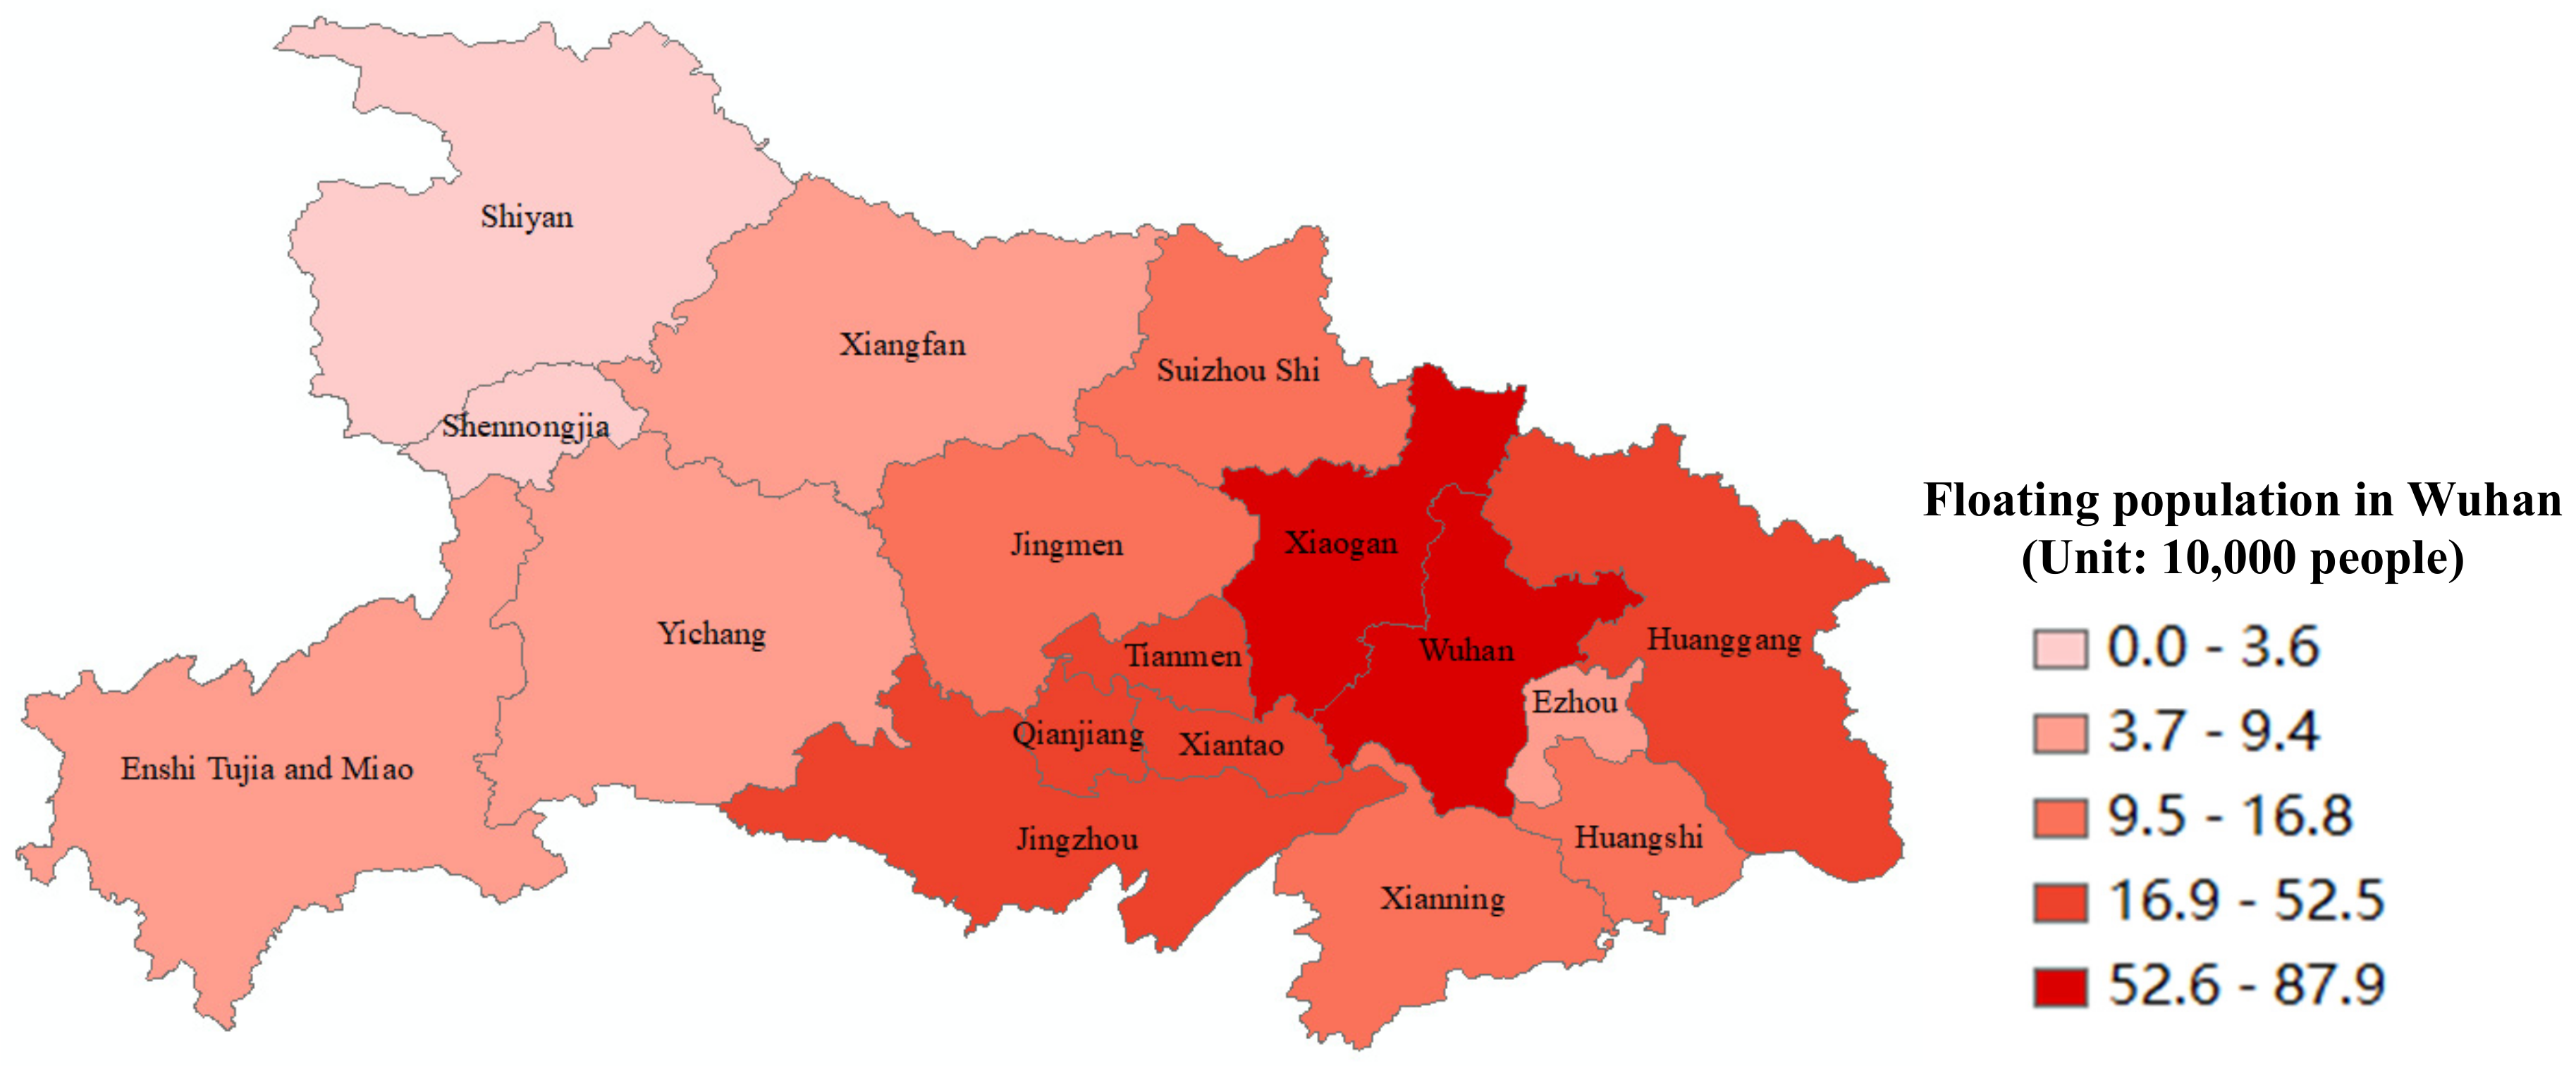
4.3. Distribution and Social Characteristics of the Origins of Wuhan’s Migrants in Hubei Province

According to the foregoing analysis, 75% of Wuhan’s floating population have registered households in Hubei Province, equating to approximately 3.75 million people. That such a large proportion of the floating population of Wuhan originate from elsewhere in Hubei Province has reduced the possibility of the epidemic spreading across the country, but all regions in Hubei Province are facing tremendous pressure from the spread of the epidemic. Therefore, we used the 2017 CMDS data to analyse the distribution of the floating population in regions within Hubei Province.
Table 6 and Figure 2 present the distribution of the origins of Wuhan’s floating population within Hubei Province. The proportion of the floating population gradually decreases from east to west across Hubei Province, and there are great differences between cities. The distribution is as follows:
(1) Xiaogan, Wuhan, and Huanggang are in the first echelon. The proportion of the floating population who originate from these cities is high, accounting for 23.4%, 19.6%, and 14% of the total, respectively. They are a cross-regional floating population of 734,000 and a 95% confidence interval of (65.89, 81.30). The analysis of districts and counties indicates that the members the floating population who originate from the outskirts of Huangpi District and Xinzhou District flow into the main urban area of Hankou, so the epidemic situation in the outskirts of Huangpi District and Xinzhou District needs special attention. Secondly, the members of Wuhan’s floating population who originate from Xiaogan comprise the largest proportion, equating to approximately 788,000 people and a 95% confidence interval of (79.81, 96.25). Members of Wuhan’s floating population who originate from Huanggang comprise the third proportion, equating to approximately 52,549 people and a 95% confidence interval of (46.06, 59.58).
(2) The three Directly Managed by Province (DMP) cities (Xiantao, Qianjiang, and Tianmen) and Jingzhou belong to the second echelon, each comprising approximately 330,000 people, and each accounting for approximately 9% of the floating population of Wuhan, with a 95% confidence interval of (28,39).
(3) Jingmen, Suizhou, Xianning, and Huangshi belong to the third echelon, accounting for 3–5% of the floating population of Wuhan, equating to 130,000–170,000 people.
(4) Xiangyang, Ezhou, Yichang, Enshi, and Shiyan belong to the fourth echelon, accounting for less than 3% of the floating population of Wuhan, equating to fewer than 100,000 people.
Overall, the suburbs of Wuhan surrounding Xiaogan, Huanggang, and the three DMP cities are the origins of the largest proportion (66%) of the floating population of Wuhan, equating to approximately 2.475 million people.
We used district- and county-level variables to estimate the floating population within Hubei Province, and the results are presented in Table 7. The survey covered 94 districts and counties, including Huangpi, Xinzhou, Jiangxia, Caidian, and Hannan in Wuhan, as well as cross-region active migrants in some major urban areas.
The top 10 districts and counties of Hubei Province in terms of floating population are Huangpi, Hanchuan, Xiantao, Xinzhou, Hong’an, Yunmeng, Honghu, Macheng, Xiaonan, and Xiaochang. That is, ≥100,000 people from each of these districts and counties are part of the floating population of Wuhan, with the top 3 districts and counties, Huangpi, Hanchuan and Xiantao, having ≥200,000 people in Wuhan’s floating population.
These top 10 district and counties of Hubei Province are followed by Jingshan, Yingcheng, Dawu, Guangshui, Tianmen, Lishui, Jianli, Anlu, Jiangxia and Caidian, which each have 60,000–100,000 people in Wuhan’s floating population.
The third tier is Huangmei, Yangxin, Daye, Gongan, Tongshan, Jiayu, Zhongxiang, Qianjiang, Songzi, Huarong, Zengdu, Enshi, Liangzihu, Zaoyang, Dongxihu, Wuxue, Huangzhou, Hannan, Xian’an, Xiangzhou, Zhijiang, Echeng, Luotian, Badong, Chibi, Chongyang, Hongshan, Shayang, Shishou, Suixian, Tuanfeng, Gucheng and Xiangcheng. These districts and counties each have 10,000–50,000 people in Wuhan’s floating population.
The remaining districts and counties have fewer than 10,000 people in Wuhan’s floating population.
In general, these members of Wuhan’s floating population originate from certain districts and counties of Hubei Province. The cumulative percentage of the top 30 districts and counties exceeds 80% of these areas’ total population, showing a clear exponential distribution trend.
We then analysed the social characteristics of the migrants in Hubei Province by age, type of migration, number of migrants, type of household registration, and reasons for traveling to Wuhan to become part of its floating population.
From Table 8 (please see the last page), we observe that in terms of susceptible and high-risk groups over 40 years old, there are approximately 300,000 people in Xiaogan, approximately 180,000 people in Wuhan (cross-region migration), and approximately 150,000 people in Huanggang. There are also approximately 100,000 people in the DMP Cities and Jingzhou respectively, and 30,000–50,000 people in Jingmen, Suizhou, Xianning, and Huangshi. Fewer than 30,000 people from each of Xiangyang, Ezhou, Yichang, Enshi and Shiyan have travelled to Wuhan.
The migration characteristics of the floating population of Wuhan from Hubei Province are detailed in Table 8. Migration with a nuclear family is the main pattern, accounting for nearly 80% of the total, or 2.985 million households. The proportion of households with 3–4 family members (i.e., nuclear families) is approximately 67%, or 2.53 million households. Specifically, 740,000 nuclear families originate from Xiaogan, 400,000–600,000 nuclear families originate from the inner suburbs of Wuhan and Huanggang, and approximately 260,000 nuclear families originate from the DMP cities and Jingzhou. More than 100,000 nuclear families originate from Jingmen, Suizhou, Xianning, and Huangshi, while fewer than 100,000 nuclear families originate from Xiangyang, Ezhou, Yichang, Enshi and Shiyan. The distribution of households with 3-4 members is similar to that of nuclear families.
It also presents the distribution of the origins of Wuhan’s floating population who originate from within Hubei Province. According to the statistical results, rural household registers account for 83%, equating to a population of approximately 3.12 million. The proportion of the group who was working and doing business in urban areas is 77%, and the population is 2.89 million. The size of the population distribution in each city is similar to the aforementioned migration types and other variables, and is not reported here.
In Table 8, the overall educational level of those members of Wuhan’s floating population who originate from Hubei Province is higher than the national level, with approximately 52% having been educated to junior high school level and below, approximately 29% to high school/secondary school level and below, and approximately 19% to college and above. However, in those members of Wuhan’s floating population who originate from the surrounding cities of Wuhan, which contribute a large number of people to the floating population of Wuhan, namely Xiaogan, Huanggang, Huangshi, Suizhou, DMP cities, Xianning, and Ezhou, >50% of people have an educational level of junior high school and below, with this being >60% in Xiaogan. This means that the awareness of health protection and timely treatment may be low in this section of the floating population of Wuhan, which will heighten the risk of large-scale transmission of 2019-nCoV.

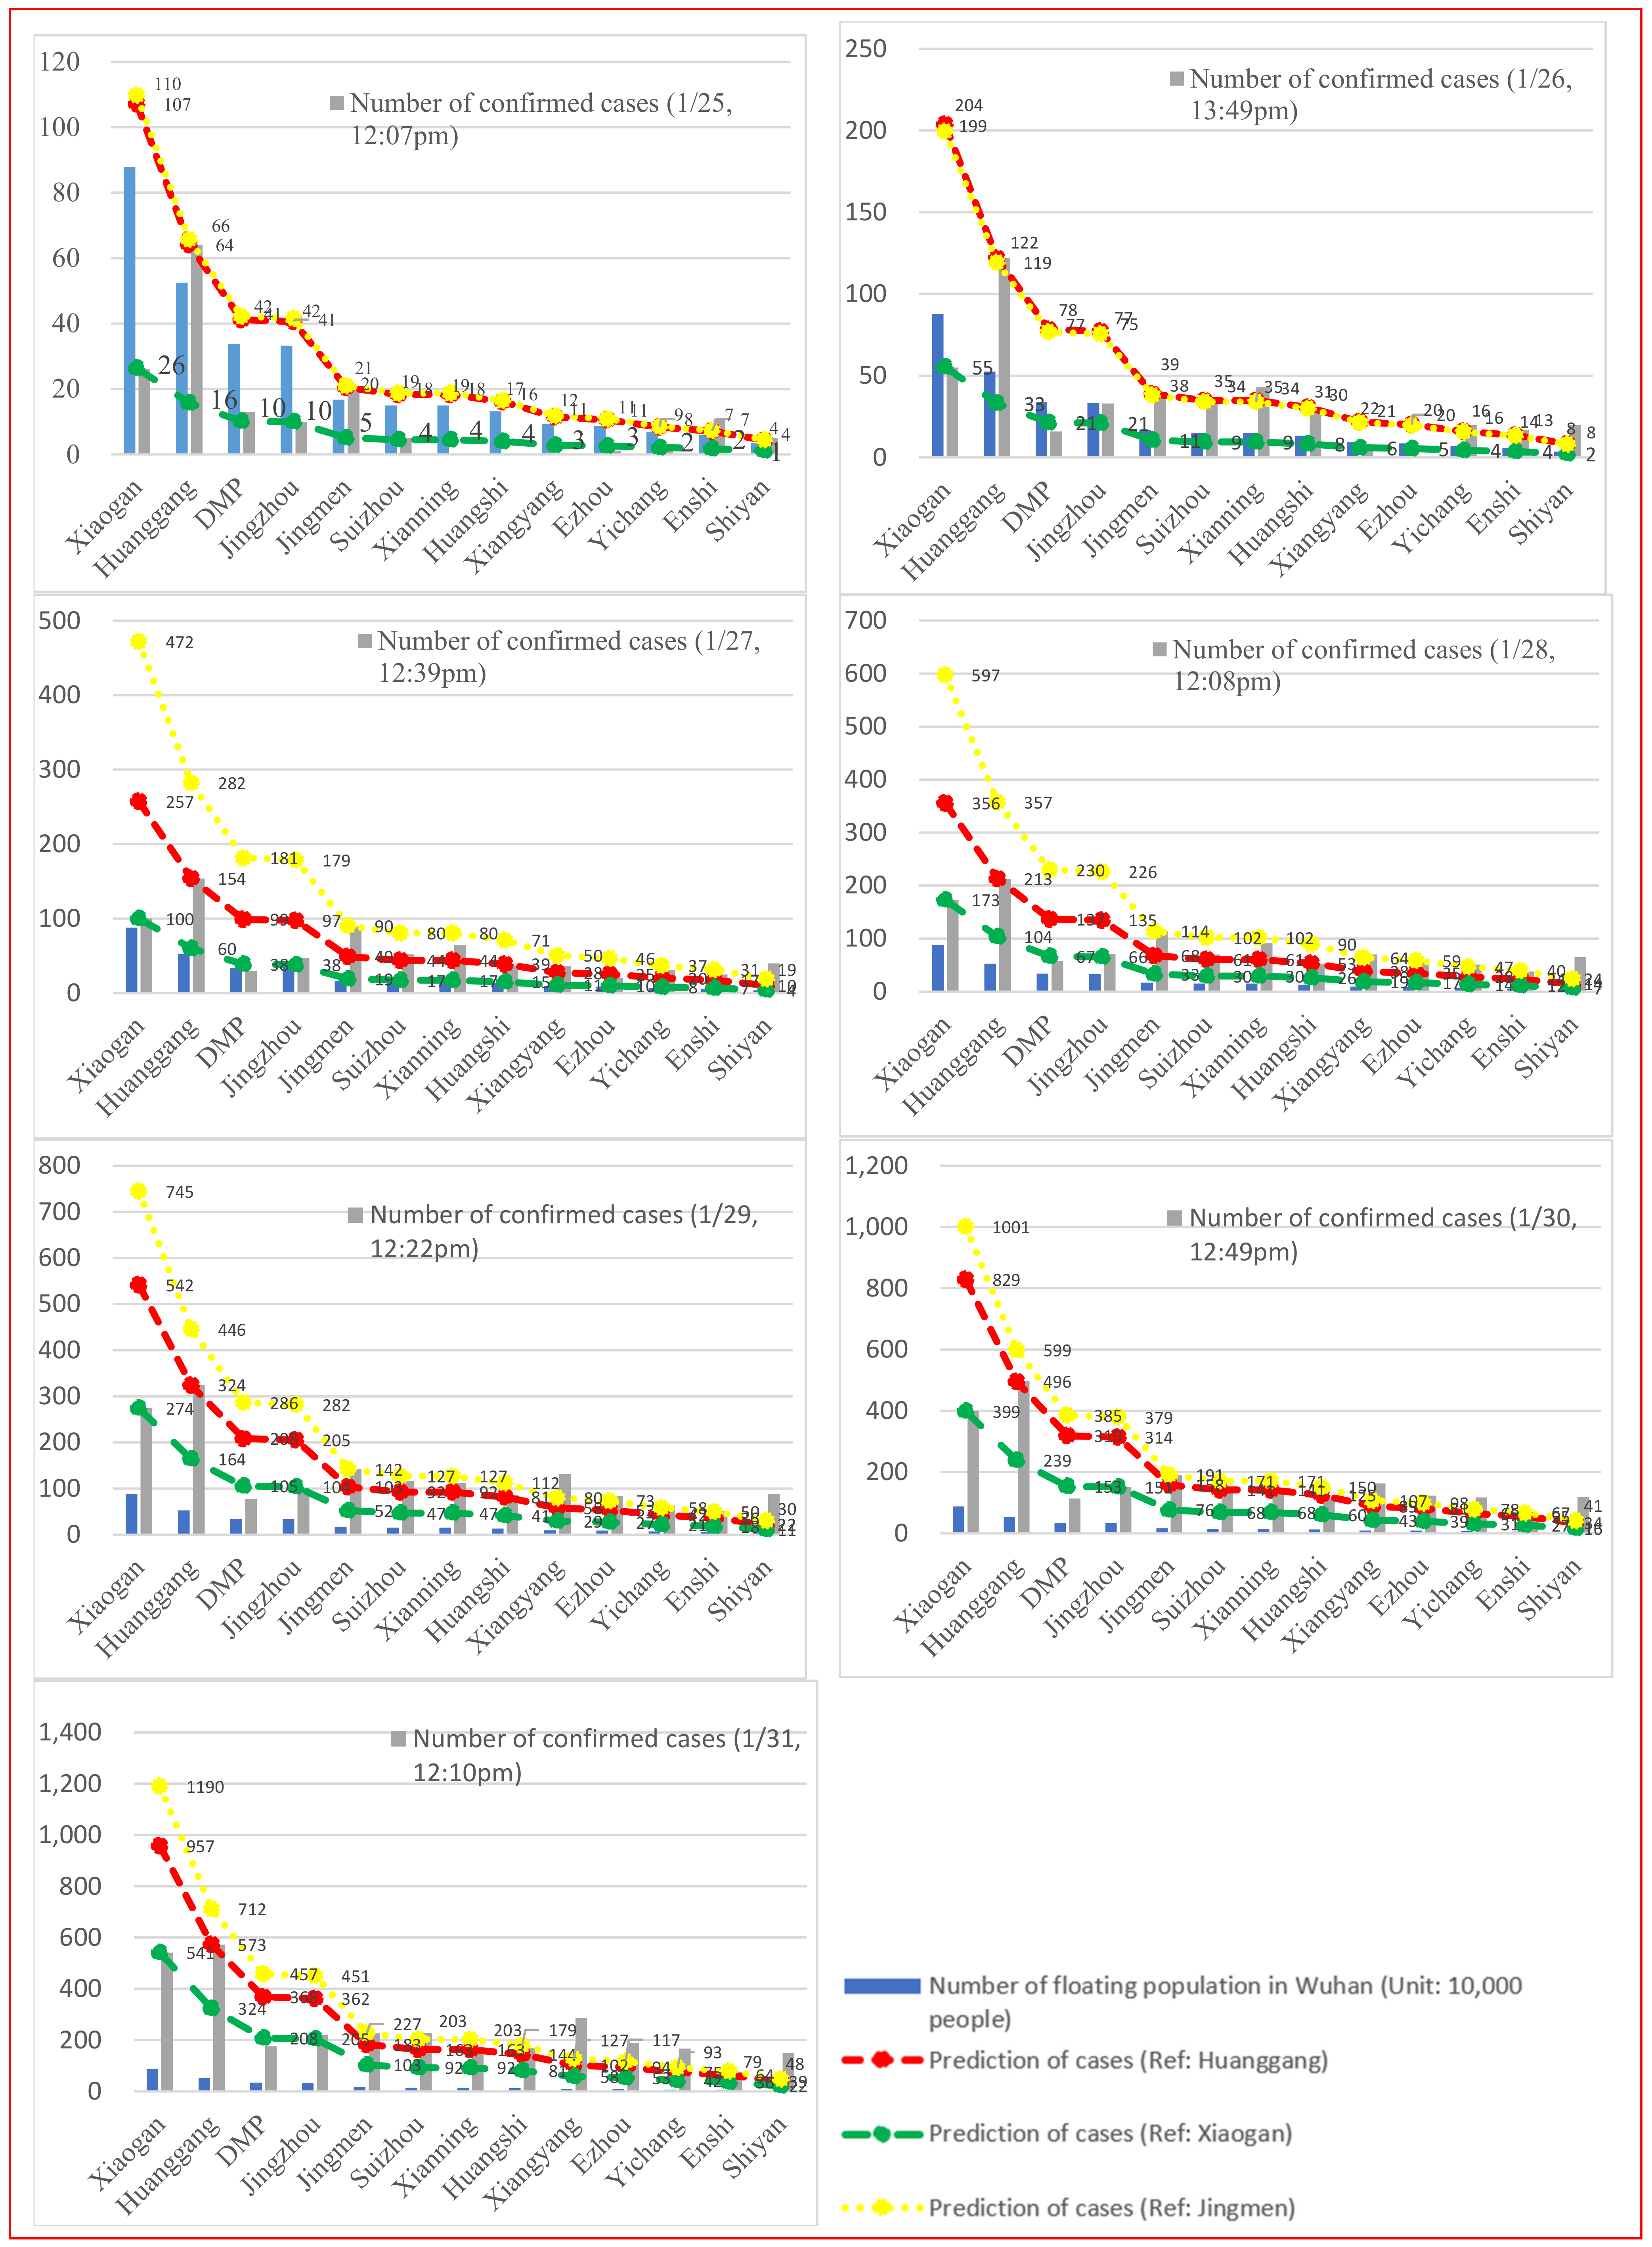
4.4. Prediction of Epidemic Trends within Hubei Province

The floating population in Wuhan will serve as a sound predictor for the trend of the 2019-nCoV outbreak. The Pearson’s correlation coefficient between the proportion of the floating population in Wuhan who originate from a certain region of Hubei and the number of confirmed 2019-nCoV cases in each region increased from 0.65 on 25 January 2020 to 0.84 on 31 January 2020 (Table 9). This indicates that when a region contributes a higher number of people to the floating residential population of Wuhan, more confirmed cases will emerge in this region.
We assumed that the effect of the floating population on the transmission of the 2019-nCoV is consistent across Hubei province, and selected three prefectures that contribute the greatest number of people to the floating population of Wuhan (Xiaogan, Huanggang and Jingmeng) as the reference prefectures to predict the epidemic trend of the 2019-nCoV at prefecture level. Those prefectures can be divided into three groups since 28 January 2020 (Figure 3): (1) Prefectures with a rapid increase in confirmed cases, comprising Jingmen, Xianning, Xiangyang, Ezhou, Yichang, and Enshi; (2) Prefectures with a moderate growth in confirmed cases, comprising Huanggang, Suizhou, Huangshi, and Shennongjia; and (3) Prefectures with a slow increase in confirmed cases, comprising Xiaogan, DMP cities, and Jingzhou.
Our predictions of the epidemic trends of the 2019-nCoV outbreak within Hubei Province are as follows: (1) The epidemic growth model for Jingmen predicts a rapid increase in the number of confirmed cases in Xiaogan, DMP cities, and Jingzhou. In other words, if the epidemic pattern in Jingmen is regarded as a typical evolutionary pattern of the spread of 2019-nCoV, the actual number of confirmed cases of 2019-nCoV in Xiaogan, DMP cities, and Jingzhou have been greatly underestimated. For example, the number of confirmed cases in Xiaogan on 31 January 2020 would reach 1190, but the number of officially announced cases was only 541. This could be attributable to a lack of sufficient diagnostic capabilities, or undisclosed data from the government, or both. (2) The epidemic growth model for Xiaogan predicts a rapid increase in the number of confirmed 2019-nCoV cases in Jingmen, Xianning, Xiangyang, Ezhou, Yichang and Enshi. If this is true, large-scale outbreaks have occurred in these places, but their regional governments have either not detected this, or true figures are not available or revealed. (3) The epidemic growth model for Huanggang better fits the actual epidemic situation of the 2019-nCoV outbreak, based on the floating population and the intensity of medical intervention. The outbreak in Xiaogan, DMP cities, and Jingzhou may be underestimated, while the rapid increase in the number of confirmed cases in Jingmen, Xianning, and Xiangyang may be affected by other unknown factors or uncontrollable random factors that need further investigation.

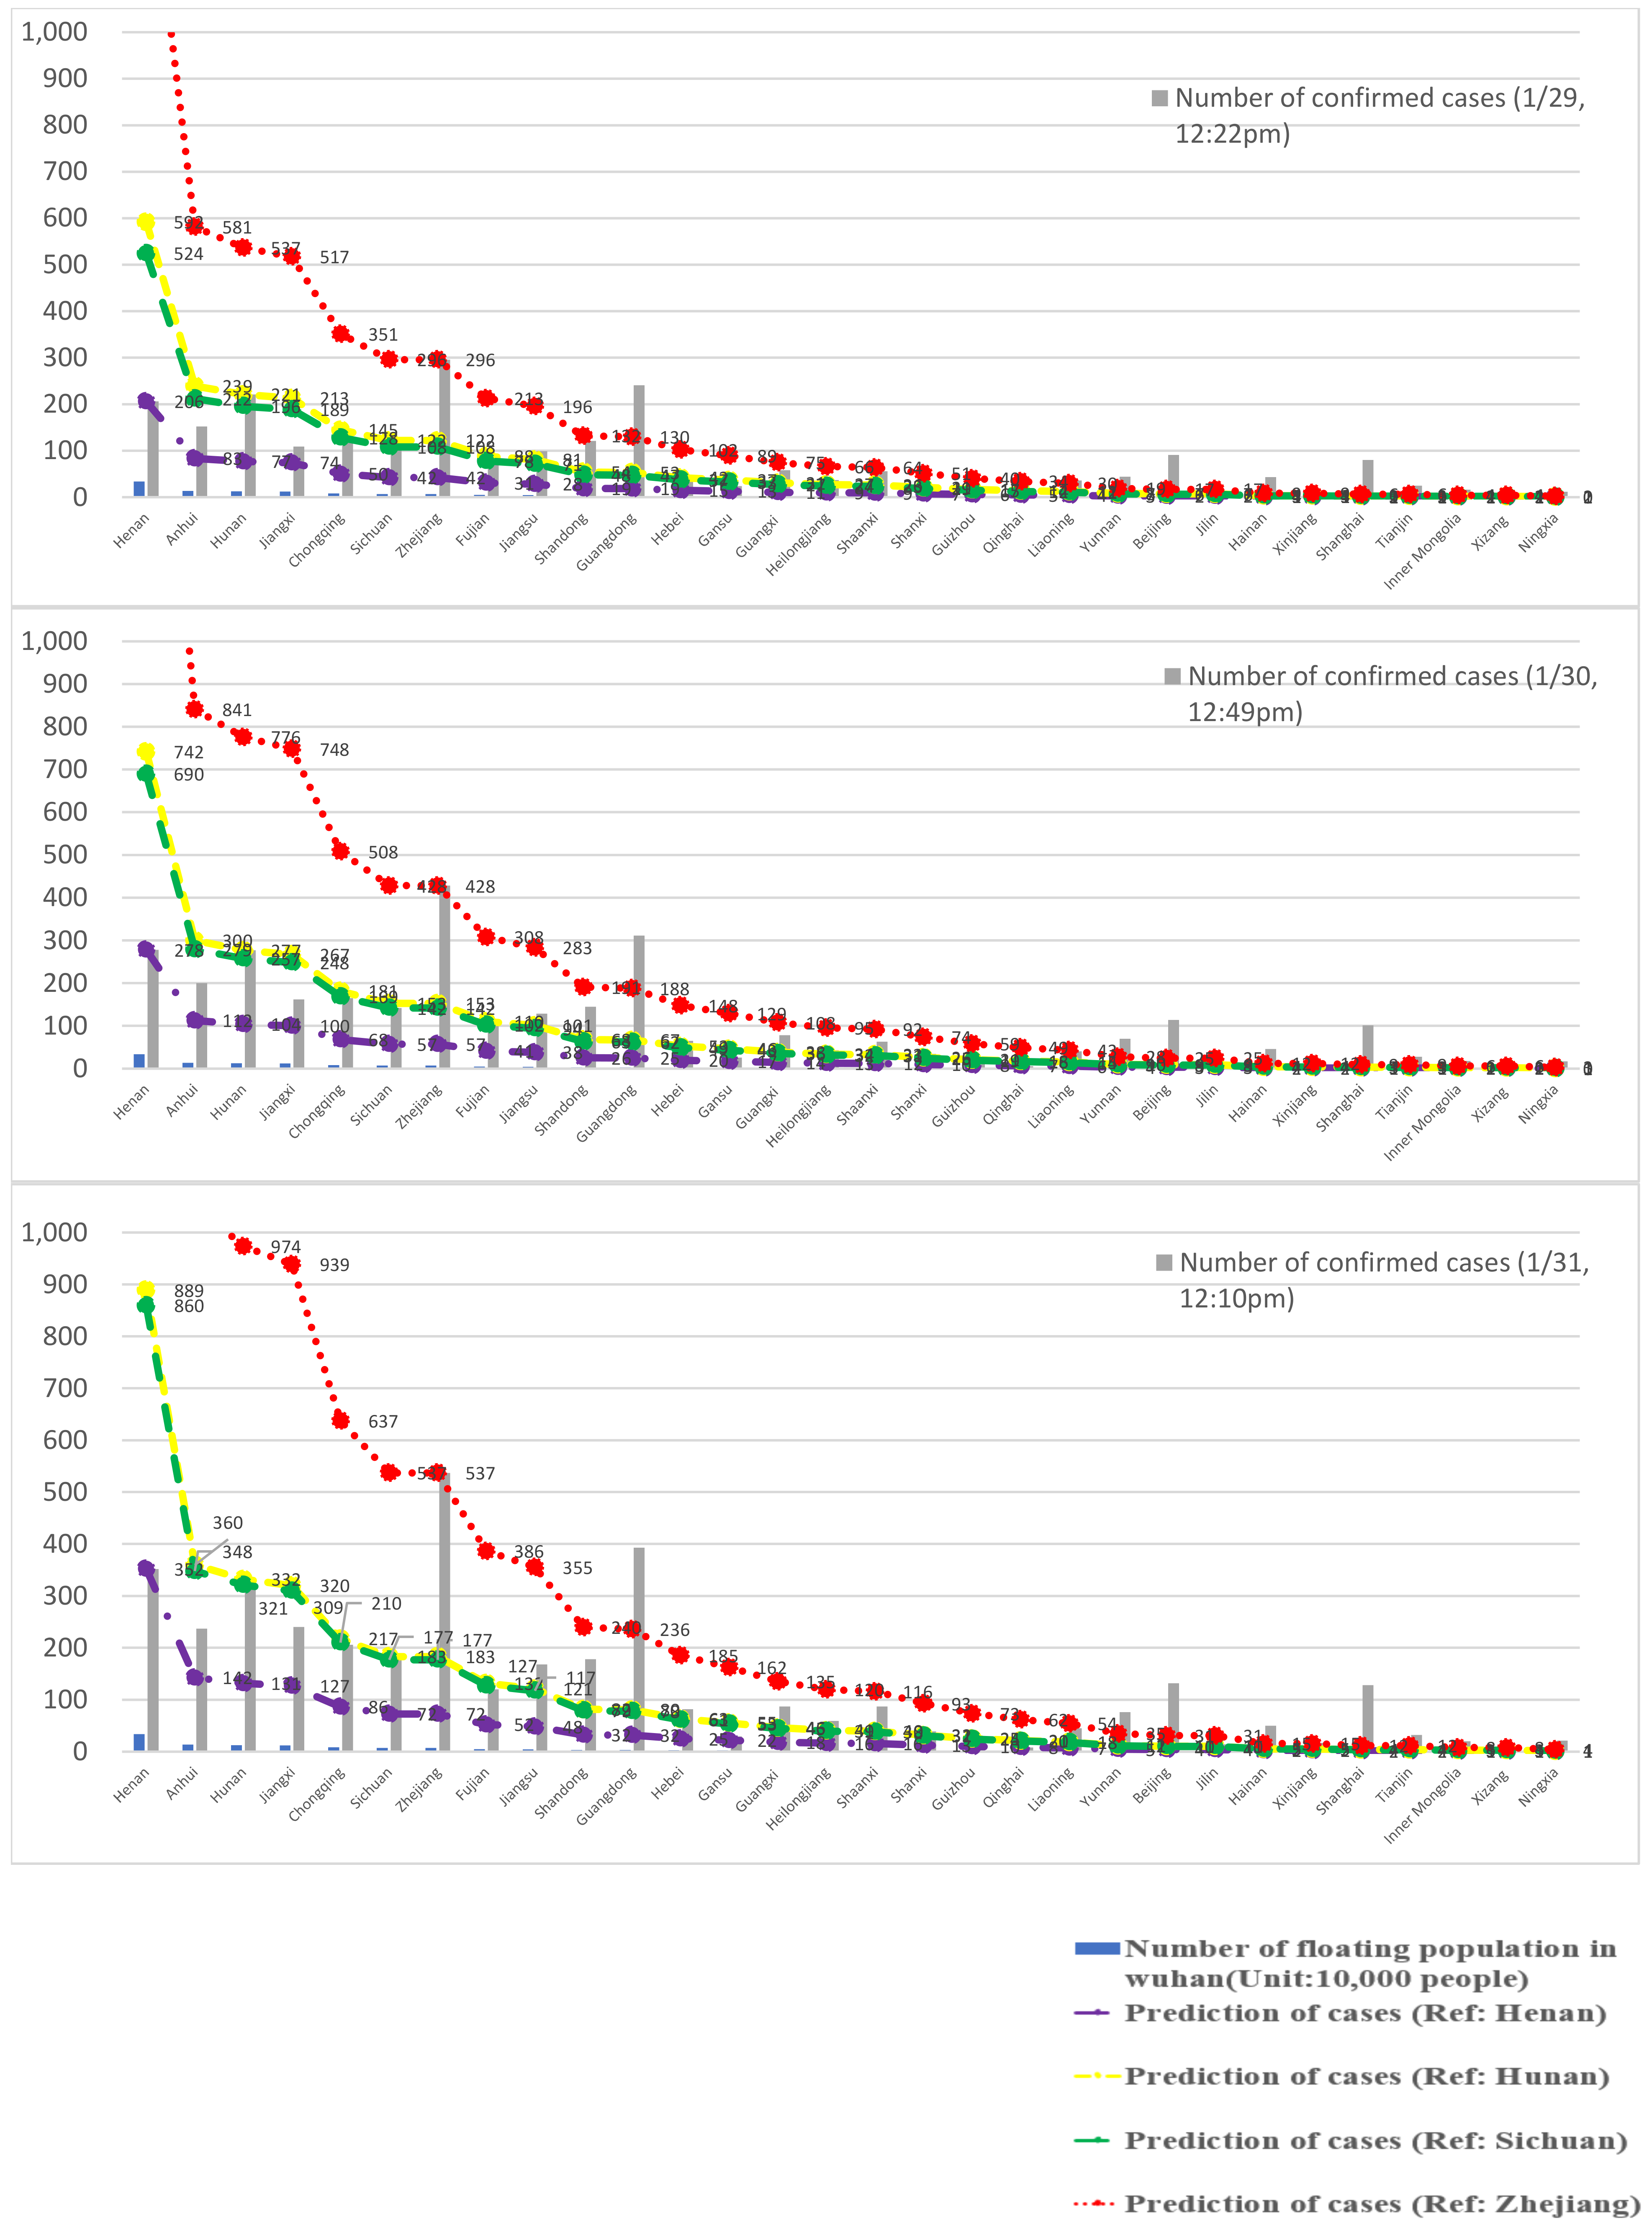
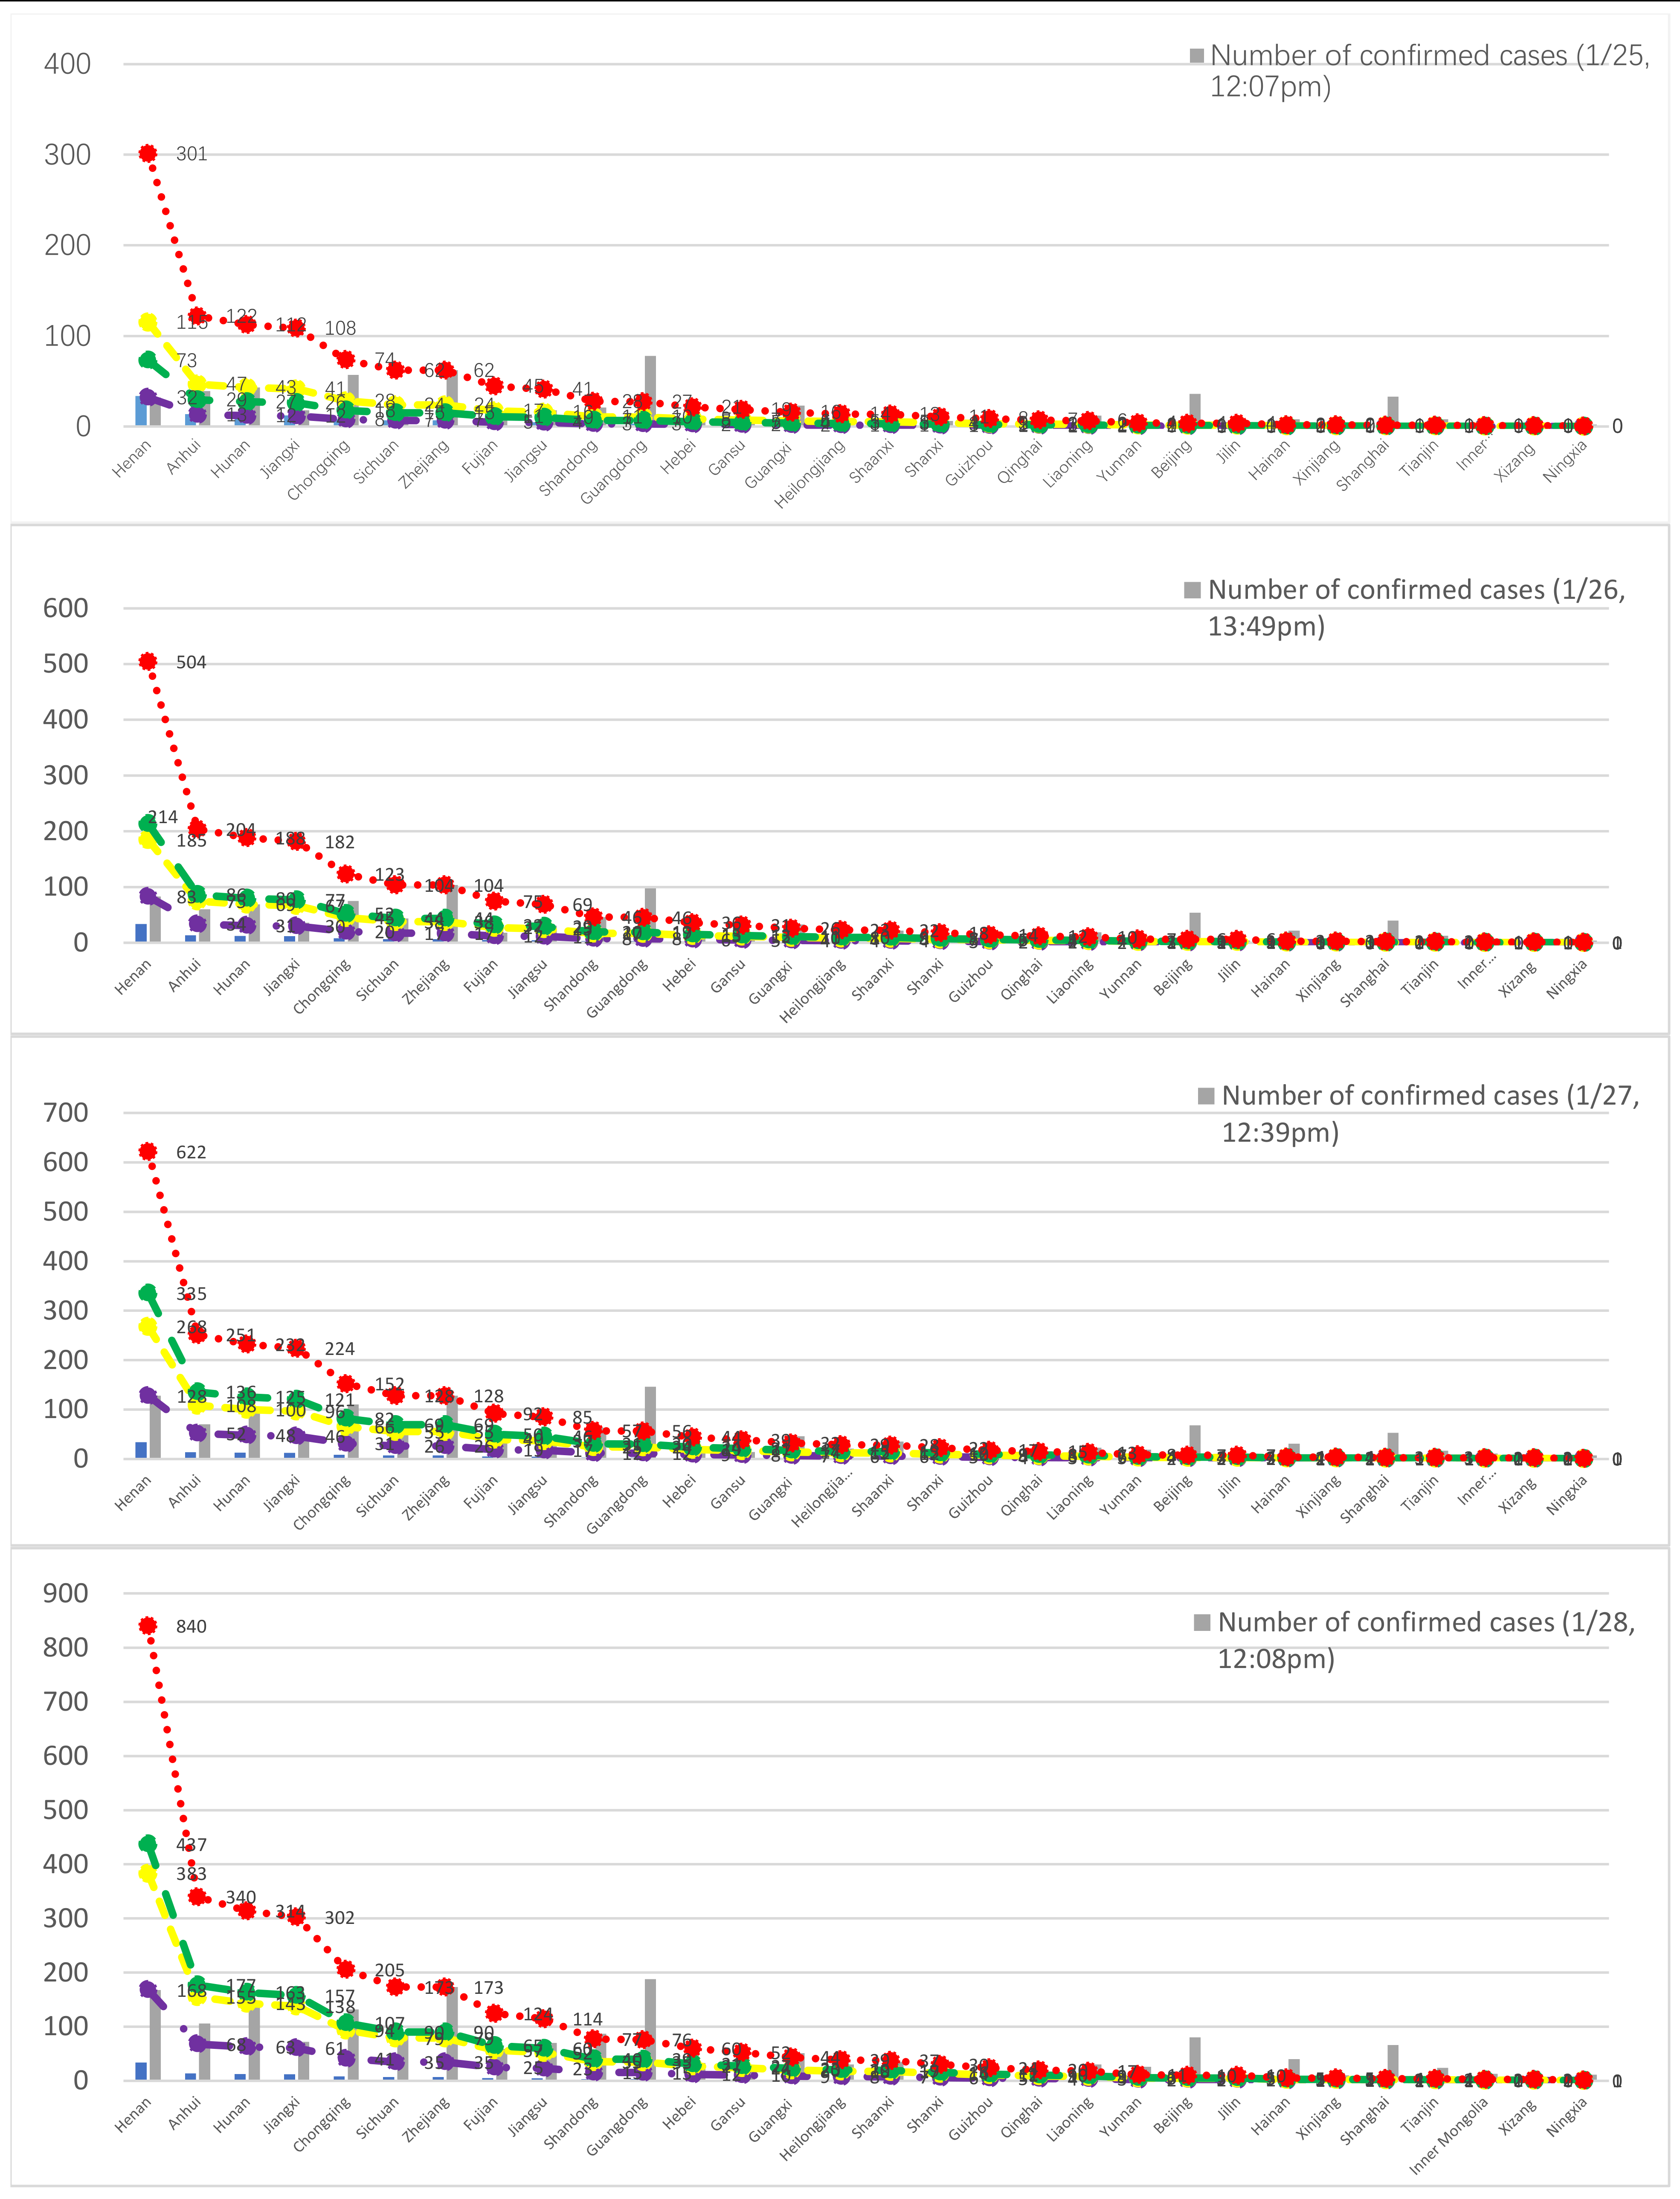
4.5. Prediction of Epidemic Trends outside Hubei Provinces

The floating population of Wuhan originated from outside Hubei Province may have promoted the spread of 2019-nCoV. Table 10 compares the number of individuals travelling from Wuhan to other provinces and the daily number of confirmed cases for those other provinces. Analysis revealed that the correlation coefficient at the provincial level was lower than at the prefecture level within Hubei Province, but the correlation coefficient increased from 0.4 on 25 January 2020 to 0.63 on 31 January 2020.
Table 10 also shows the ratio of confirmed cases in each province to the proportion of people in the floating population in Wuhan who originate from each of these provinces, on 28 January 2020. We divide provinces into two categories based on their short-term travel populations in Wuhan, and Wuhan’s travelling population to other provinces during the Spring Festival holiday. The first category comprises those provinces that have large-scale short-term business trips or tourist populations in Wuhan during the Spring Festival holiday, namely Beijing, Shanghai, Tianjin, and Hainan. Obviously, such a high level of inter-provincial population mobility may exacerbate the spread of 2019-nCoV. For example, the high ratio of confirmed cases in Guangdong Province may be due to the large short-term travel populations visiting Shenzhen and Guangzhou and Wuhan, while the high ratio of confirmed cases in Hainan Province may result from the outbound tourist population from Wuhan to Hainan during the Spring Festival holiday. In Table 10, the results are divided into two parts: the correlation coefficient of the first category of provinces, which reaches a maximum of 0.96, and the correlation coefficient of the second category of provinces, which increased from 0.56 to 0.7. This abovementioned second category comprise the other 25 provinces that have small short-term business trip groups or tourist populations in Wuhan during the Spring Festival holiday. We assumed that the effect of the floating population on the spread of 2019-nCoV was consistent across the country. The other 25 provinces are divided into three groups since 25 January 2020 (Figure 4): (1) Provinces with a rapid increase in the number of confirmed cases, namely Zhejiang, Shandong, Guangxi, Shaanxi, Liaoning, and Yunnan; (2) Provinces with a moderate increase in the number of confirmed cases, namely Hunan, Chongqing, Sichuan, Fujian, Jiangsu, Hebei, Gansu, Heilongjiang, Shaanxi, Guizhou, Qinghai, Jilin, Xinjiang, Inner Mongolia, Tibet, and Ningxia; and (3) Provinces with a small increase in the number of confirmed cases, namely Henan, Anhui, and Jiangxi. In Table 10, if we exclude the data of Henan Province and Zhejiang Province from the second category, we find that the correlation coefficient on 31 January 2020 is 0.93.
We selected four provinces (Henan, Hunan, Sichuan, and Zhejiang) as the reference provinces to predict the epidemic trend of 2019-nCoV in each province. We found that: (1) The epidemic growth model of Henan Province does not fit the situation in most other provinces. That is, except in Anhui and Jiangxi, the actual number of outbreaks in other provinces was higher than that predicted by the Henan model. As these provinces have large floating populations in Wuhan, the rapid increase in the number of confirmed cases in Henan, Anhui and Jiangxi may result from effective measures that have been taken to control the spread of 2019-nCoV, or the lack of sufficient diagnostic capabilities to detect suspected cases. (2) The epidemic growth model for Hunan and Sichuan Province predicts a rapid increase in the number of confirmed cases in Henan, Anhui and Jiangxi provinces. Thus, if the epidemic pattern in Hunan and Sichuan follows a typical evolutionary pattern, the current numbers of confirmed cases in the three provinces of Henan, Anhui, and Jiangxi are greatly underestimated. For example, the number of confirmed cases in Henan on 31 January 2020 would be between 860 and 889, but the number in official announcements was only 168. In contrast, the number of confirmed cases in Zhejiang, Shandong, Guangxi, Shaanxi, Liaoning, and Yunnan Provinces were higher than the predicted number, which may be affected by uncontrollable local factors that need further investigation. (3) The epidemic growth model for Zhejiang Province predicts a rapid increase in the number of confirmed cases in most provinces, especially Jiangsu and Fujian provinces that are adjacent to Zhejiang. It is important to investigate why there were so many confirmed cases in Zhejiang, and whether the outbreak in Jiangsu and Fujian Province was not detected in a timely manner, or whether all possible cases have not yet occurred.
Overall, the predicted epidemic pattern for Hunan and Sichuan provinces fits best to the actual epidemic trend of the 2019-nCoV outbreak. However, the current number of confirmed cases in Henan, Anhui, and Jiangxi provinces is likely to be underestimated, especially given that these contain extensive rural areas with large populations and limited medical resources. The higher actual number of confirmed cases in Zhejiang, Shandong, Guangxi, Shaanxi, Liaoning, and Yunnan provinces may be affected by other unknown factors or uncontrollable random factors that need further investigation.

5. Discussion

To prevent or mitigate the spread of an emerging infectious disease and its negative effects, public health interventions mainly aim at three types of population, namely the population in the source area, the floating population leaving the source area, and the population travelling from the infected area to other areas. The Spring Festival in 2020 is much earlier than in previous years. At this time, the possibility of human-to-human transmission of a new coronavirus had just been discovered. When the Wuhan Municipal Government decided on 23 January 2020 to “close the city” to control the outflow of population, more than 5 million people had already left Wuhan on the Spring Festival holiday, and it was too late to control the entire potentially infected population in the epidemic area. At present, China’s high-speed railway and expressway transportation network has experienced great development. This fast and convenient transportation has led to a floating population that can leave the source area to quickly reach every part of the country, which makes it very difficult to quarantine the floating population leaving the source area through transportation stations. In addition, there is an incubation period after human infection, further increasing the difficulty of quarantine at traffic stations, which is also an important reason for the implementation of “city closure” control policies in many cities across the country.
After 2019-nCoV was confirmed as being capable of transmitting from human to human, the Chinese government implemented top to bottom national mobilisation. It fully investigated and isolated the population of Wuhan, and also publicised the severity of the epidemic, and also increased awareness of the prevention of infectious diseases and raised people’s vigilance through messages on television, mobile communications and the Internet. In addition, according to the latest epidemic surveillance, the incubation period of the coronavirus is 3 to 7 days, with an upper limit of 14 days. For this reason, the central government has issued an executive order to extend the Spring Festival holiday from 30 January to 2 February 2020. Many provinces are even requiring firms to not restart work until 9 February, except those necessary for social operations related to the national economy and people’s livelihood. Extending the holiday is needed to avoid the returning people leaving home early and returning to work, so as to minimise the risk of the epidemic spreading again due to population fluctuations.
There are limitations to this study. First, our analysis did not include other large-scale populations. For example, some are college students, because Wuhan is the city with the largest number (>1 million) of college students in China and the world. The other parts include short-term business travellers, transit passengers and tourists. Official media reported that the size of the populations during the Spring Festival holiday would reach more than 30 million. This can be confirmed from the daily-confirmed cases of 2019-nCoV infection. Although there is a small permanent population in Wuhan whose household register belongs to provinces and cities such as Beijing, Shanghai, Tianjin, Hainan, and Guangdong (in fact, Shenzhen and Guangzhou are two megacities), these provinces and cities still have large-scale temporary floating populations from and to Wuhan because of the large population and well-developed economy. Therefore, the number of confirmed cases of 2019-nCoV infection in these areas is far ahead of that in most other provinces that have a large floating population in Wuhan.
Second, our sample has a certain deviation. The data on the origin of Wuhan’s floating population does not include Hong Kong, Macao, or international migrants, which makes our research unable to estimate the population size of these regions. At present, some cases have been confirmed in surrounding Asian countries, Europe, North America and Australia. Third, limited to interdisciplinary research capabilities, our model does not include infectious disease analysis models such as SIR to further analyse the potential and scale of 2019-nCoV spread, which may reduce the value of this research in the prevention and control of 2019-nCoV infections. Finally, the results of the study are mainly applicable to the end of the Spring Festival holiday, and after the large-scale population comes back to work or study, the spread of the epidemic will be more complicated.
We believe that the abovementioned limitations can be overcome. Using big data such as location information of transportation and mobile Internet, short-term floating populations can be included in the study to maximise the estimated population flotation and scale in Wuhan. Unfortunately, thus far we have not seen a rigorous study using big data to analyse the outflow of populations in the epicentre of an epidemic. This means that there is still a long way to go for the research and application of big data in the field of national and global public health.

6. Conclusions

At the time of writing this paper (29 January 2020), all provinces in China have reported confirmed or suspected cases of 2019-nCoV, every prefecture and city in Hubei Province has confirmed cases of 2019-nCoV, and transmission of 2019-nCoV has spread from imported to inter-regional. Due to the fact that 5 million migrants had left Wuhan before the “closure of the city”, our research reveals a high correlation between the number of Wuhan’s floating population and the number of confirmed cases. Fortunately, the origin of Wuhan’s floating population is highly concentrated in Hubei Province and its surrounding provinces, of which the migrants with Hubei household registers account for 75%, and more than 80% of the population is concentrated in the top 30 districts and counties. This means that some areas will face a very high risk of epidemic outbreaks, but it is also conducive to centralised resources enabling prevention and control of the epidemic to avoid large-scale spread in other regions.
More than 5 million of Wuhan’s floating population have returned to their hometowns as potential carriers of the virus and may become carriers of the virus’s re-transmission. Due to China’s urban and rural dualistic structure, most of these people are rural migrant workers with low levels of education. The results find that 85% of the migrants have rural household registers. These people, who frequently work outdoors or work overtime are more likely to be susceptible because of their poor diet and nutrition. At the same time, most of these people travel with 3–4 family members, and the susceptible and high-risk population over 40 years old accounts for a large proportion of this floating population, which provides ideal conditions for the transmission of 2019-nCoV within families. To make matters worse, the rural areas where these people return to have very limited medical and public health services, and gatherings during the Spring Festival aggravate the risk of virus transmission in the community.
So far, confirmed cases of 2019-nCoV continue to increase every day across China. The results of our model analysis indicate that, on the one hand, the correlation between the size of the floating population and the number of confirmed cases in Wuhan has continued to increase over time, and by 28 January, the correlation coefficient of these factors in Hubei Province had reached 0.78, which means that the size of the floating population in Wuhan is an important parameter for predicting the epidemic. On the other hand, we also found that the effect of the size of the floating population in Wuhan is heterogeneous across regions. Some areas have a large floating population in Wuhan, including Henan, Anhui, and Jiangxi provinces, and Xiaogan City, Jingzhou City, and the three county-level cities directly under the provincial government, and yet the number of confirmed cases of 2019-nCoV is apparently relatively small. However, we believe that the epidemic situation in these areas may be underestimated. Considering the serious consequences of delays in diagnosis and loopholes in infection control in suspected or confirmed cases of SARS in the SARS epidemic in 2003, it is necessary to strengthen surveillance in these areas to determine the causes of the fewer confirmed cases of 2019-nCoV in these areas.

Author Contributions

L.L. conceived and proposed research ideas, C.F. and C.Y. collected the data, C.F. undertook the main research work such as research methods, data analysis, and manuscript writing. C.F., L.L., W.G., A.Y., C.Y., M.J., M.R., P.X., H.L. and Y.W. participated in draft review, contributed to data interpretation, and approved final manuscript. All authors have read and agreed to the published version of the manuscript.

Funding

This research was supported by the Youth Program of the National Social Science Fund of China (18CRK009) and the Fundamental Research Funds for the Central Universities (CCNU19QN044).

Acknowledgments

Thanks to the National Health Committee for the migrant population data; the Youth Project of National Social Science Foundation and the Youth Teacher Project of Central China Normal University 2019 for support on previous construction of floating population database; Binbin Tang and Junyue Qian for their selfless help in the process of thesis writing.

Conflicts of Interest

The authors declare no conflict of interest.

References

  1. Heymann, D.L. Data sharing and outbreaks: Best practice exemplified. Lancet 2020, 395, 469–470. [Google Scholar] [CrossRef] [Green Version]
  2. Mahase, E. China coronavirus: What do we know so far? BMJ 2020. [Google Scholar] [CrossRef] [PubMed] [Green Version]
  3. Wu, J.T.; Leung, K.; Leung, G.M. Nowcasting and forecasting the potential domestic and international spread of the 2019-nCoV outbreak originating in Wuhan, China: A modelling study. Lancet 2020, 395, 689–697. [Google Scholar] [CrossRef] [Green Version]
  4. Wuhan Municipal Health Commission. The Current Epidemic of Pneumonia in Our City by Wuhan Municipal Health Commission. Available online: http://wjw.wh.gov.cn/front/web/showDetail/2019123108989 (accessed on 25 January 2020).
  5. WHO. Novel Coronavirus (2019-nCoV) Situation Report-6. Geneva: World Health Organization. Available online: https://www.who.int/docs/default-source/coronaviruse/situation-reports/20200126-sitrep-6-2019--ncov.pdf?sfvrsn=beaeee0c_4 (accessed on 27 January 2020).
  6. Ding, X.Y. National Real-Time Epidemic Website. Available online: https://ncov.dxy.cn/ncovh5/view/pneumonia?scene=2&clicktime=1579593095&enterid=1579593095&from=groupmessage&isappinstalled=0 (accessed on 25 January 2020).
  7. WHO. Novel Coronavirus (2019-nCoV) Situation Report-10. Geneva: World Health Organization. Available online: https://www.who.int/docs/default-source/coronaviruse/situation-reports/20200130-sitrep-10-ncov.pdf?sfvrsn=d0b2e480_2 (accessed on 31 January 2020).
  8. Read, J.M.; Jessica, R.E.; Bridgen, J.R.E.; Cummings, D.A.T.; Ho, A.; Jewell, C.P. Novel coronavirus 2019-nCoV: Early estimation of epidemiological parameters and epidemic predictions. Medrxiv 2020. [Google Scholar] [CrossRef] [Green Version]
  9. Imai, N.; Cori, A.; Dorigatti, I.; Baguelin, M.; Donnelly, C.A.; Riley, S.; Ferguson, N.M. Report 3: Transmissibility of 2019-nCoV. Available online: https://www.imperial.ac.uk/media/imperial-college/medicine/sph/ide/gida-fellowships/Imperial-2019-nCoV-transmissibility.pdf (accessed on 26 January 2020).
  10. Chen, N.; Zhou, M.; Dong, X.; Qu, J. Epidemiological and clinical characteristics of 99 cases of 2019 novel coronavirus pneumonia in Wuhan, China: A descriptive study. Lancet 2020, 395, 507–513. [Google Scholar] [CrossRef] [Green Version]
  11. Zhu, N.; Zhang, D.Y.; Wang, W.L.; Li, X.W.; Yang, B.; Song, J.D.; Zhao, X.; Huang, B.Y.; Shi, W.F.; Lu, R.J.; et al. A novel coronavirus from patients with pneumonia in China, 2019. N. Engl. J. Med. 2020, 382, 727–733. [Google Scholar] [CrossRef] [PubMed]
  12. Chan, J.F.W.; Yuan, S.; Kok, K.H.; To, K.K.W.; Chu, H.; Yang, J.; Xing, F.F.; Liu, J.L.; Yip, C.C.Y.; Poon, R.W.S.; et al. A familial cluster of pneumonia associated with the 2019 novel coronavirus indicating person-to-person transmission: A study of a family cluster. Lancet 2020, 395, 514–523. [Google Scholar] [CrossRef] [Green Version]
  13. Wang, C.; Horby, P.W.; Hayden, F.G.; Gao, G.F. A novel coronavirus outbreak of global health concern. Lancet 2020, 395, 470–473. [Google Scholar] [CrossRef] [Green Version]
  14. The Lancet. Emerging understandings of 2019-nCoV. Lancet 2020, 395, 311. [Google Scholar] [CrossRef] [Green Version]
  15. Paules, C.I.; Marston, H.D.; Fauci, A.S. Coronavirus infections-more than just the common cold. JAMA 2020, 323, 707–708. [Google Scholar] [CrossRef] [PubMed] [Green Version]
  16. Chen, Z.L.; Zhang, W.J.; Lu, Y.; Guo, C.; Guo, Z.M.; Liao, C.H.; Zhang, X.; Zhang, Y.; Han, X.H.; Li, Q.L.; et al. From SARS-CoV to Wuhan 2019-nCoV Outbreak: Similarity of Early Epidemic and Prediction of Future Trends. Biorxiv 2020. [Google Scholar] [CrossRef]
  17. Munster, V.J.; Koopmans, M.; Koopmans, M.; Doremalen, N.V.; Riel, D.V.; Wit, E.D. A novel coronavirus emerging in China—key questions for impact assessment. N. Engl. J. Med. 2020, 382, 692–694. [Google Scholar] [CrossRef] [PubMed]
  18. Perlman, S. Another decade, another coronavirus. N. Engl. J. Med. 2020, 382, 760–762. [Google Scholar] [CrossRef] [PubMed]
  19. Imai, N.; Dorigatti, I.; Cori, A.; Riley, S.; Ferguson, N.F. Report 1: Estimating the Potential Total Number of Novel Coronavirus Cases in Wuhan City, China. Available online: https://www.imperial.ac.uk/media/imperial-college/medicine/sph/ide/gida-fellowships/2019-nCoV-outbreak-report-17-01-2020.pdf (accessed on 23 January 2020).
  20. Imai, N.; Dorigatti, I.; Cori, A.; Riley, S.; Ferguson, N.F. Report 2: Estimating the Potential Total Number of Novel Coronavirus Cases in Wuhan City, China. Available online: https://www.imperial.ac.uk/media/imperial-college/medicine/sph/ide/gida-fellowships/2019-nCoV-outbreak-report-22-01-2020.pdf (accessed on 24 January 2020).
  21. Shen, M.; Peng, Z.; Yanni, X.Y.; Zhang, L. Modelling the epidemic trend of the 2019 novel coronavirus outbreak in China. Biorxiv 2020. [Google Scholar] [CrossRef]
  22. Huang, C.L.; Wang, Y.M.; Li, X.W.; Ren, L.L.; Zhao, J.P.; Hu, Y.; Zhang, L.; Fan, G.H.; Xu, J.Y.; Gu, X.Y.; et al. Clinical features of patients infected with 2019 novel coronavirus in Wuhan, China. Lancet 2020, 395, 497–506. [Google Scholar] [CrossRef] [Green Version]
  23. Health Commission of Guangdong Province. Epidemic Situation of the Novel Coronavirus in Guangdong Province Published on 23 January 2020. Available online: http://wsjkw.gd.gov.cn/zwyw_yqxx/content/post_2878571.html (accessed on 25 January 2020).
  24. Xinhua News Agency. 15 Chinese Medical Workers Confirmed Infected with Coronavirus. Available online: http://www.xinhuanet.com/english/2020-01/21/c_138721955.htm (accessed on 23 January 2020).
  25. Statistics Bureau of Wuhan Municipality. Wuhan Statistical Communiqué on National Economic and Social Development. Available online: http://www.tjcn.org/tjgb/17hb/35881_3.html (accessed on 22 January 2020).
  26. China Highlights. The Chinese New Year Travel Rush—The World’s Largest Annual Human Migration. Available online: https://www.chinahighlights.com/travelguide/special-report/chinese-new-year/transportation.htm (accessed on 24 January 2020).
  27. Wuhan Municipal People’s Government. Wuhan Implements Restriction to Curb the Spread of the Epidemic. Available online: http://www.hubei.gov.cn/zhuanti/2020/gzxxgzbd/zxtb/202001/t20200121_2013644.shtml (accessed on 23 January 2020).
  28. Global Times. Real-Time Update on Coronavirus Outbreak. Available online: http://www.globaltimes.cn/content/1177737.shtml (accessed on 29 January 2020).
  29. Hu, X.; Cook, S.; Salazara, M.A. Internal Migration and Health in China. Lancet 2008, 372, 1717–1719. [Google Scholar] [CrossRef]
  30. The New York Times. China Grapples with Mystery Pneumonia-Like Illness. Available online: https://www.nytimes.com/2020/01/06/world/asia/china-SARS-pneumonialike.html (accessed on 6 January 2020).
  31. Therese, H.; Ye, X.; Li, L.; Wang, H. Health Status and Access to Health Care of Migrant Workers in China. Public Health Rep. 2008, 123, 189–197. [Google Scholar]
Figure 1. The national distribution of floating population in Wuhan.
Ijerph 17 01679 g001
Figure 2. The distribution of Wuhan’s migrants within Hubei Province.
Ijerph 17 01679 g002
Figure 3. Prediction of the epidemic situation in Hubei Province.
Ijerph 17 01679 g003
Figure 4. Prediction of the epidemic situation in China.
Ijerph 17 01679 g004aIjerph 17 01679 g004b
Table 1. Sample distribution of floating population living in Wuhan, 2013–2018.
District201320142015201620172018Total
Total19992000200020002000200011,999
Hankou zone
Jiang’an400360360320400-1840
Qiaokou240240240200240-1160
Jianghan280240200200160-1080
Dongxihu200160200320200-1080
Huangpi120120120120160-640
Xinzhou0040400-80
Wuchang zone
Hongshan239240240240200-1159
Wuchang200160200200240-1000
Qingshan801601208040-480
Jiangxia400404040-160
Hanyang zone
Hanyang120160160160200-800
Hannan40120808080-400
Caidian40400040-120
All three zones-----20002000
Table 2. Household registration distribution of floating population in Wuhan, 2013–2018.
Province201320142015201620172018Total
Total19992000200020002000200011,999
Hubei1514150814871465147715478998
Henan113134109159170125810
Anhui595855535646327
Hunan574668544136302
Jiangxi584053574934291
Chongqing342934333335198
Zhejiang222925332533167
Sichuan223045212227167
Fujian141716153919120
Jiangsu381316191311110
Shandong1218111381274
Guangdong78181814873
Hebei91539101258
Gansu4149671050
Guangxi98873742
Heilongjiang57677537
Shaanxi82856736
Shanxi23384929
Guizhou25544323
Qinghai53620319
Liaoning22165117
Yunnan01530211
Jilin04103210
Beijing1231209
Hainan0020125
Xinjiang0310015
Tianjin1001013
Shanghai0101013
Inner Mongolia1000102
Xizang0010012
Ningxia0010001
Table 3. Prediction of floating population living in Wuhan, 2019.
Population Type2013201420152016201720182019
Permanent population at the year-end10,220,00010,338,00010,607,70010,766,20010,892,90011,081,00011,263,800
Household population8,220,5008,273,1008,292,7008,338,400-8,837,3008,896,900
Floating population (calculate) 11,999,5002,064,9002,315,0002,427,800-2,243,7002,423,700
Floating population (predicted)2,078,7002,138,4002,198,2002,258,0002,317,8002,377,6002,437,400
From 2013 to 2018, the values are from Wuhan Statistical Bulletin of the National Economic and Social Development. In 2019, the values are based on linear regression; 1 Floating population (calculate) = Permanent population at the year-end − Household population. Predicted value based on linear regression.
Table 4. Estimation of proportion and population size in China based on floating population in Wuhan, 2013–2018.
ProvincePopulation Size in WuhanPercentage (95% CI)Estimation of Population Size (95% CI)
Total11,9991005,000,000
Hubei899875.0 (74.2–75.8)3,749,479 (3,710,227 – 3,788,125)
Henan8106.8 (6.3–7.2)337,528 (315,401–360,712)
Anhui3272.7 (2.4–3.0)136,262 (122,063–151,622)
Hunan3022.5 (2.2–2.8)125,844 (112,201–140,665)
Jiangxi2912.4 (2.2–2.7)121,260 (107,869–135,822)
Chongqing1981.7 (1.4–1.9)82,507 (71,491–94,717)
Zhejiang1671.4 (1.2–1.6)69,589 (59,493–80,888)
Sichuan1671.4 (1.2–1.6)69,589 (59,493–80,888)
Fujian1201.0 (0.8–1.2)50,004 (41,492–59,734)
Jiangsu1100.9 (0.8–1.1)45,837 (37,702–55,194)
Shandong740.6 (0.5–0.8)30,836 (24,228–38,681)
Guangdong730.6 (0.5–0.8)30,419 (23,859–38,218)
Hebei580.5 (0.4–0.6)24,169 (18,362–31,222)
Gansu500.4 (0.3–0.5)20,835 (15,472–27,450)
Guangxi420.4 (0.3–0.5)17,502 (12,619–23,643)
Heilongjiang370.3 (0.2–0.4)15,418 (10,860–21,239)
Shaanxi360.3 (0.2–0.4)15,002 (10,511–20,756)
Shanxi290.2 (0.2–0.3)12,085 (8096–17,346)
Guizhou230.2 (0.1–0.3)9584 (6078–14,374)
Qinghai190.2 (0.1–0.2)7918 (4768–12,359)
Liaoning170.1 (0.1–0.2)7084 (4128–11,337)
Yunnan110.1 (0.05–0.2)4584 (2289–8199)
Jilin100.1 (0.04–0.2)4167 (1999–7661)
Beijing90.1 (0.03–0.14)3751 (1715–7117)
Henan50.04 (0.01–0.1)2084 (677–4861)
Xinjiang50.04 (0.01–0.1)2084 (677–4861)
Tianjin30.03 (0.01–0.1)1250 (258–3653)
Shanghai30.03 (0.01–0.1)1250 (258–3653)
Inner Mongolia20.02 (0.002–0.1)834 (101–3010)
Xizang20.02 (0.002–0.1)834 (101–3010)
Ningxia10.008 (0.0002–0.05)417 (11–2322)
Estimation of population size is based on the total number of floating population in Wuhan (about 5 million); CI = confidence interval.
Table 5. Joint distribution of Wuhan floating population in China.
ProvinceTotalAge GroupMigration CharacteristicsNumber of Migrant Family MembersHousehold RegistrationReason for MigrationEducation Level
<2021–3031–4041–5051–6060+Migration AloneNuclear Family MigrationExtended Family Migration1234≥5RuralNon-RuralWork, BusinessWith FamilyOther ReasonJunior High School And BelowHigh SchoolCollege and Above
Total5,000,000158,7631,740,1451,730,5611,094,675227,93647,921483,7904,213,268302,942483,790750,4792,345,1951,226,769193,7664,255,355742,5624,214,518599,217186,2663,007,3341,308,442684,224
Hubei3,749,479112,0931,283,4401,307,192824,652180,84841,253377,9483,142,345229,186377,948539,6281,800,567892,991138,3453,185,265564,2143,135,678456,7053,135,6782,224,3521,006,334518,793
Henan337,52812,918123,344101,25885,00713,751125024,585292,94120,00224,58550,004137,511104,17521,252310,44327,086294,19134,586294,191236,68670,42330,419
Anhui136,261500047,50445,83731,253541712509167118,3438751916727,91952,08840,4206667124,59411,668119,59315,001119,59396,25826,66913,334
Hunan125,844375047,92145,42025,0023750013,334105,842666713,33425,00256,25527,5023750107,09218,752107,09216,668107,09272,08937,92015835
Jiangxi121,260583449,17141,25320,8354167012,501100,008875112,50120,00243,75437,0867917101,67519,585103,75914,168103,75985,84025,00210,418
Chongqing82,507458422,91926,25223,7524584417541771,2565834541718,75233,75321,668291773,339916770,839666770,83961,25515,8355417
Zhejiang69,589166719,58524,58518,3354584833291764,5892084291710,00135,83617,918291757,50512,08462,505625162,50533,33622,91913334
Sichuan69,589250027,08622,08514,5852917417583458,7555000583412,50132,91916,668166761,672791756,67110,83456,67140,83718,75210001
Fujian50,004208418,33522,50262518330541742,50420845417583422,08515,001166743,337666746,254333446,25429,16914,5856251
Jiangsu45,837250014,58514,16812,501166741741742,0873334417833424,58511,66883340,003583439,170625139,17026,66913,7515417
Shandong30,83641712,50112,50145848330333424,58529173334583412,918833441725,419541726,669375026,66916,25179176667
Guangdong30,41941712,91812,91833348330375025,00216673750541715,0016251014,58515,83524,585500024,5858751958412,084
Hebei24,169010,00187514584417417125022,5024171250208410,8348751125021,252291721,252250021,25214,16879172084
Gansu20,835166791677917208400208417,9188332084416711,6681250166715,001583416,668375016,66810,00141676667
Guangxi17,5014177917750112504170291714,5850291741710,8343334015,001250013,334333413,33410,83441672500
Heilongjiang15,418041674584500083383341713,7511250417375010,41883309167625113,751125013,751625166672500
Shaanxi15,0010583483344174170333410,001166733348338751833125011,251375013,751125013,751541741675417
Shanxi12,0844174584541716670016679167125016671250416745844179584250010,83483310,834625129172917
Guizhou95844175000250016670083387510833125054172084075012084708425007084541720842084
Qinghai791741737502084166700075014170166737502084417791707084833708475014170
Liaoning70840166729171250125001667500041716671667333441702500458462514176251166716673750
Yunnan4584833291783300041737504174178332084833417416741733341250333429174171250
Beijing416704178332917008333334083316671250417012502917416704167125016671250
Jilin3750417125012508330016672084016670208400833291733344173334125002500
Hainan20840125041704170833125008330125000833125016674171667417833833
Xinjiang2084083301250004171667041704171250020840166741716671250417417
Tianjin12504174174170004178330417417041708334178334178334170833
Shanghai125008330004174178330417833000012501250012500417833
Inner Mongolia83304174170000833000833004174174174174170417417
Xizang83300417004170833004174170041741741704174174170
Ningxia417041700000417000417004170417041741700
Table 6. Estimation of proportion and population size in Hubei Province based on floating population in Wuhan, 2017.
CityPopulation Size in WuhanPercentage (95% CI)Estimation of Population Size (95% CI)
Total14771003,749,479
Xiaogan34623.4 (21.3–25.7)878,348 (798,137–962,540)
Wuhan28919.6 (17.6–21.7) 733,649 (658,849–813,015)
Huanggang20714.0 (12.3–15.9)525,486 (460,570–595,817)
DMP cities 11339.0 (7.6–10.6)337,631 (284724–396,739)
Jingzhou1318.9 (7.5–10.4)332,554 (280,029–391,301)
Jingmen664.5 (3.5–5.7)167,546 (130,201–211,854)
Suizhou594.0 (3.1–5.1)149,776 (114,529–192,075)
Xianning594.0 (3.1–5.1)149,776 (114,529–192,075)
Huangshi523.5 (2.6–4.6)132,006 (98,999–172,155)
Xiangyang372.5 (1.8–3.4) 93,927 (66,358–128,851)
Ezhou342.3 (1.6–3.2)86,312 (59,966–120,059)
Yichang271.8 (1.2–2.6)68,542 (45,296–99,309)
Enshi231.6 (1.0–2.3)58,387 (37,106–87,268)
Shiyan140.9 (0.5–1.6)35,540 (19,465–59,439)
1 DMP (Directly Managed by the Province) cities includes Xiantao, Qianjiang and Tianmen; CI = confidence interval.
Table 7. Estimation of proportion and population size within Hubei Province based on floating population in Wuhan, 2017.
No.District or CountyPopulation Size in WuhanPercentage (95% CI)Estimation of Population Size (95% CI)
Total 14771003,749,476
1Huangpi1399.4 (8.0–11.0)352,862 (298,830–413,031)
2Hanchuan956.4 (5.2–7.8)241,165 (196,273–292,679)
3Xiantao825.6 (4.4–6.8)208,163 (166,459–256,639)
4Xinzhou664.5 (3.5–5.7)167,546 (130,201–211,854)
5Hong’an604.1 (3.1–5.2)152,315 (116,759–194,908)
6Yunmeng493.3 (2.5–4.4)124,390 (92,395–163,568)
7Honghu463.1 (2.3–4.1)116,775 (85,825–154,948)
8Macheng463.1 (2.3–4.1)116,775 (85,825–154,948)
9Xiaonan422.8 (2.1–3.8)106,620 (77,125–143,397)
10Xiaochang412.8 (2.0–3.7)104,082 (74,961–140,497)
11Jingshan392.6 (1.9–3.6)99,005 (70,649–134,685)
12Yingcheng392.6 (1.9–3.6)99,005 (70,649–134,685)
13Dawu382.6 (1.8–3.5)96,466 (68,501–131,771)
14Guangshui382.6 (1.8–3.5)96,466 (68,501–131,771)
15Tianmen352.4 (1.7–3.3)88,850 (62,091–122,996)
16Xishui352.4 (1.7–3.3)88,850 (62,091–122,996)
17Jianli342.3 (1.6–3.2)86,312 (59,966–120,059)
18Anlu322.2 (1.5–3.0)81,234 (55,737–114,166)
19Jiangxia292.0 (1.3–2.8)73,619 (49,448–105,275)
20Caidian281.9 (1.3–2.7)71,080 (47,368–102,296)
21ND 1261.8 (1.2–2.6)66,003 (43,233–96,313)
22Huangmei251.7 (1.1–2.5)63,464 (41,180–93,308)
23Yangxin241.6 (1.0–2.4)60,926 (39,138–90,293)
24Daye201.4 (0.8–2.1)50,772 (31,084–78,123)
25Gong’an201.4 (0.8–2.1)50,772 (31,084–78,123)
26Tongshan171.2 (0.7–1.8)43,156 (25,192–68,858)
27Jiayu161.1 (0.6–1.8)40,617 (23,263–65,737)
28Zhongxiang151.0 (0.6–1.7)38,079 (21,353–62,598)
29Qianjiang140.9 (0.5–1.6)35,540 (19,465–59,439)
30Songzi140.9 (0.5–1.6)35,540 (19,465–59,439)
31Huarong130.9 (0.5–1.5)33,001 (17,602–56,257)
32Zengdu130.9 (0.5–1.5)33,001 (17,602–56,257)
33Enshi120.8 (0.4–1.4)30,463 (15,766–53,051)
34Liangzihu120.8 (0.4–1.4)30,463 (15,766–53,051)
35Zaoyang110.7 (0.4–1.3)27,924 (13,961–49,817)
36Dongxihu100.7 (0.3–1.2)25,386 (12,191–46,553)
37Wuxue90.6 (0.3–1.2)22,847 (10,461–43,252)
38Huangzhou80.5 (0.2–1.1)20,309 (8,778–39,911)
39Hannan80.5 (0.2–1.1)20,309 (8778–39,911)
40Xian’an80.5 (0.2–1.1)20,309 (8778–39,911)
41Xiangzhou80.5 (0.2–1.1)20,309 (8778–39,911)
42Zhijiang80.5 (0.2–1.1)20,309 (8778–39,911)
43Echeng70.5 (0.2–1.0)17,770 (7152–36,521)
44Luotian70.5 (0.2–1.0)17,770 (7152–36,521)
45Badong60.4 (0.1–0.9)15,232 (5595–33,073)
46Chibi60.4 (0.1–0.9)15,232 (5595–33,073)
47Chongyang60.4 (0.1–0.9)15,232 (5595–33,073)
48Hongshan60.4 (0.1–0.9)15,232 (5595–33,073)
49Shayang60.4 (0.1–0.9)15,232 (5595–33,073)
50Shishou60.4 (0.1–0.9)15,232 (5595–33,073)
51Sui60.4 (0.1–0.9)15,232 (5595–33,073)
52Tuanfeng60.4 (0.1–0.9)15,232 (5595–33,073)
53Gucheng50.3 (0.1–0.8)12,693 (4125–29,554)
54Xiangcheng50.3 (0.1–0.8)12,693 (4125–29,554)
55Jiangling40.3 (0.1–0.7)10,154 (2769–25,944)
56Shashi40.3 (0.1–0.7)10,154 (2769–25,944)
57Tongcheng40.3 (0.1–0.7)10,154 (2769–25,944)
58Yiling40.3 (0.1–0.7)10,154 (2769–25,944)
59Yingshan40.3 (0.1–0.7)10,154 (2769–25,944)
60Qichun40.3 (0.1–0.7)10,154 (2769–25,944)
61Dangyang30.2 (0.04–0.6)7616 (1571–22,213)
62Fancheng30.2 (0.04–0.6)7616 (1571–22,213)
63Maojian30.2 (0.04–0.6)7616 (1571–22,213)
64Xialu30.2 (0.04–0.6)7616 (1571–22,213)
65Dongbao20.1 (0.02–0.5)5077 (615–18,308)
66Duodao 20.1 (0.02–0.5)5077 (615–18,308)
67Shannongjia20.1 (0.02–0.5)5077 (615–18,308)
68Jianshi20.1 (0.02–0.5)5077 (615–18,308)
69Jiang’an20.1 (0.02–0.5)5077 (615–18,308)
70Danjiangkou20.1 (0.02–0.5)5077 (615–18,308)
71Jingzhou20.1 (0.02–0.5)5077 (615–18,308)
72Lichuan20.1 (0.02–0.5)5077 (615–18,308)
73Saishan20.1 (0.02–0.5)5077 (615–18,308)
74Wuchang20.1 (0.02–0.5)5077 (615–18,308)
75Yicheng20.1 (0.02–0.5)5077 (615–18,308)
76Yidu20.1 (0.02–0.5)5077 (615–18,308)
77Yunxi20.1 (0.02–0.5)5077 (615–18,308)
78Changyang20.1 (0.02–0.5)5077 (615–18308)
79Zigui20.1 (0.02–0.5)5077 (615–18308)
80Baokang10.1 (0.002–0.4)2538 (64–14,122)
81Dianjun10.1 (0.002–0.4)2538 (64–14,122)
82Dahongshan10.1 (0.002–0.4)2538 (64–14,122)
83Qujialing10.1 (0.002–0.4)2538 (64–14,122)
84Wujiagang10.1 (0.002–0.4)2538 (64–14,122)
85Xiaogan10.1 (0.002–0.4)2538 (64–14,122)
86Fang10.1 (0.002–0.4)2538 (64–14,122)
87Tieshan10.1 (0.002–0.4)2538 (64–14,122)
88Xiling10.1 (0.002–0.4)2538 (64–14,122)
89Xianfeng10.1 (0.002–0.4)2538 (64–14,122)
90Xingshan10.1 (0.002–0.4)2538 (64–14,122)
91Yuan’an10.1 (0.002–0.4)2538 (64–14,122)
92Yunyang10.1 (0.002–0.4)2538 (64–14,122)
93Zhangwan10.1 (0.002–0.4)2538 (64–14,122)
94Zhushan10.1 (0.002–0.4)2538 (64–14,122)
1 ND means that the districts are not divided; CI = confidence interval.
Table 8. Joint distribution of Wuhan floating population in Hubei Province.
CityTotalAge GroupMigration CharacteristicsNumber of Migrant Family MembersHousehold RegistrationReason for MigrationEducation Level
<2021–3031–4041–5051–6060+Migration AloneNuclear family MigrationExtended Family Migration1234≥5RuralNon-RuralWork, BusinessWith FamilyOther
Reason
Junior High School and BelowHigh SchoolCollege and Above
Total3,749,47925,3861,304,8291,360,678751,419236,08871,080487,4072,985,367276,705487,407548,3331,627,228906,272180,2393,114,835632,1062,891,440538,178319,8611,939,4731,083,973726,033
Xiaogan878,3487616279,244291,936210,70271,08017,77073,619738,72666,00373,619152,315350,324253,85848,233771,728106,620662,569137,08378,696540,717225,933111,697
Wuhan733,64910,154256,396286,859134,54538,079761693,927578,79660,92693,92778,696357,939170,08533,002599,104134,545535,640109,15988,850337,631236,088159,930
Huanggang525,4862539167,546208,163114,23625,386761668,542408,71148,23368,54260,926203,086149,77643,156459,48366,003431,55853,31040,617294,475149,77681,234
DMP cities337,6310121,852116,77568,54217,77012,69348,233261,47327,92448,23350,772157,39266,00315,231241,16596,466266,55143,15627,924180,23991,38966,003
Jingzhou332,5542539106,620124,39068,54225,386507755,849253,85822,84755,84968,542129,46771,0807616274,16658,387256,39650,77225,386152,315106,62073,619
Jingmen167,546066,00358,38730,46312,693030,463132,006507730,46333,00281,23420,3092539132,00635,540139,62217,77010,15478,69653,31035,540
Suizhou149,776066,00340,61722,84715,23150777616134,5457616761627,92476,15727,92410,154132,00617,770111,69738,079081,23450,77217,770
Xianning149,776053,31060,92622,84710,154253927,924116,775507727,92420,30963,46433,0025077129,46720,309129,467761612,69376,15735,54038,079
Huangshi132,006045,69438,07935,5407616507722,84793,92715,23122,847761653,31038,07910,154101,54330,463106,62017,770761673,61930,46327,924
Xiangyang93,927038,07930,46317,7705077253922,84768,542253922,84722,84733,00212,693253973,61920,30968,54215,23110,15433,00235,54025,386
Ezhou86,312038,07935,54050775077253910,15473,619253910,154507745,69422,847253976,15710,15455,84920,30910,15443,15625,38617,770
Yichang68,542025,38633,00210,15400507758,3875077507712,69335,54015,231043,15625,38653,31010,154507712,69322,84733,002
Enshi58,387253920,30922,84776162539253912,69340,617507712,693507725,38615,231055,849253945,69410,154253925,38612,69320,309
Shiyan35,540020,30912,693253900761625,38625397616253915,23110,154025,38610,15427,9247616010,154761617,770
Table 9. 2019-nCoV confirmed cases and floating population from Wuhan in Hubei Province.
CityConfirmed Cases in 2020 (Accumulative) 1Floating Population in Wuhan (Unit: 10,000 People) 2Ratio 3 (City)
Jan 25
12:07 p.m.
Jan 26
13:49 p.m.
Jan 27
12:39 p.m.
Jan 28
12:08 p.m.
Jan 29
12:22 p.m.
Jan 30
12:49 p.m.
Jan 31
12:10 p.m.
DMP cities 4131630587711417633.765.21
Xiaogan265510017327439954187.836.16
Jingzhou1033477110115122133.266.65
Huanggang6412215421332449657352.5510.90
Xianning043649111213016614.9811.08
Huangshi03136538611316813.2012.73
Enshi111725385166755.8412.85
Jingmen21389011414219122716.7513.55
Suizhou536527011614322814.9815.22
Ezhou112057841231898.6321.90
Yichang1203151631171676.8524.36
Xiangyang0836701311632869.3930.45
Shiyan5204065881191503.5542.21
Pr 50.650.610.670.780.800.810.84--
1 The number of confirmed cases was from Chinese dynamic epidemic monitoring website (A confirmed case refers to a suspected case who have tested positive via a nucleic acid test); 2 The number of floating populations from Wuhan is calculated value (Please see Table 6); 3 Ratio = Confirmed cases (on 2020/1/31)/Floating population from Wuhan (Unit: 10,000 people); 4 DMP (Directly Managed by the Province) cities includes Xiantao, Qianjiang and Tianmen; 5 The Pearson’s correlation coefficient is calculated from the number of floating populations in Wuhan and the number of confirmed cases per day.
Table 10. 2019-nCoV confirmed cases and floating population from Wuhan in China.
ProvinceConfirmed Cases in 2020 (Accumulative)Floating Population in Wuhan (Unit: 10,000 People)Ratio (Province)
Jan 25
12:07 p.m.
Jan 26
13:49 p.m.
Jan 27
12:39 p.m.
Jan 28
12:08 p.m.
Jan 29
12:22 p.m.
Jan 30
12:49 p.m.
Jan 31
12:10 p.m.
Qinghai11466680.8010.00
Xizang00000110.1010.00
Henan328312816820627835233.7510.43
Gansu4714192426292.1013.81
Guizhou4579912150.9515.79
Anhui39607010615220023713.6517.36
Jiangxi1836487210916224012.1519.75
Fujian10183559821011205.0024.00
Chongqing57751101321471652068.2524.97
Sichuan154469901081421776.9525.47
Hunan436910014322127733212.6026.35
Shanxi6913202735391.2032.50
Hebei81318334865822.4034.17
Jilin4468914140.4035.00
Jiangsu18314770991291684.6036.52
Heilongjiang91521303743591.5538.06
Guangxi233346515878871.7549.71
Shandong214663871211451783.1057.42
Shaanxi52235355663871.5058.00
Liaoning121923303641450.7064.29
Zhejiang621041281732964285376.9577.27
Xinjiang345101314170.2085.00
Guangdong78981461882413113933.05128.85
Yunnan51119264470760.45168.89
Inner Mongolia1711131618200.10200.00
Tianjin81317242528320.15213.33
Hainan82231404346500.20250.00
Beijing36546880911141320.40330.00
Ningxia247111217210.05420.00
Shanghai33405366801011280.15853.33
Pr (All province)0.400.590.630.660.620.620.63--
Pr (First type)0.900.910.940.960.960.960.96--
Pr (Second type)0.560.720.760.780.70.690.70--
Pr (Second type excluded Henan and Zhejiang) 0.780.830.810.860.890.910.93--

