Optimization of a Capacitated Vehicle Routing Problem for Sustainable Municipal Solid Waste Collection Management Using the PSO-TS Algorithm

Abstract
:1. Introduction
2. Literature Review
2.1. Research on Sustainable Development in MSW Collection
2.2. Research about Algorithms for the CVRP Model
3. Mathematical Model
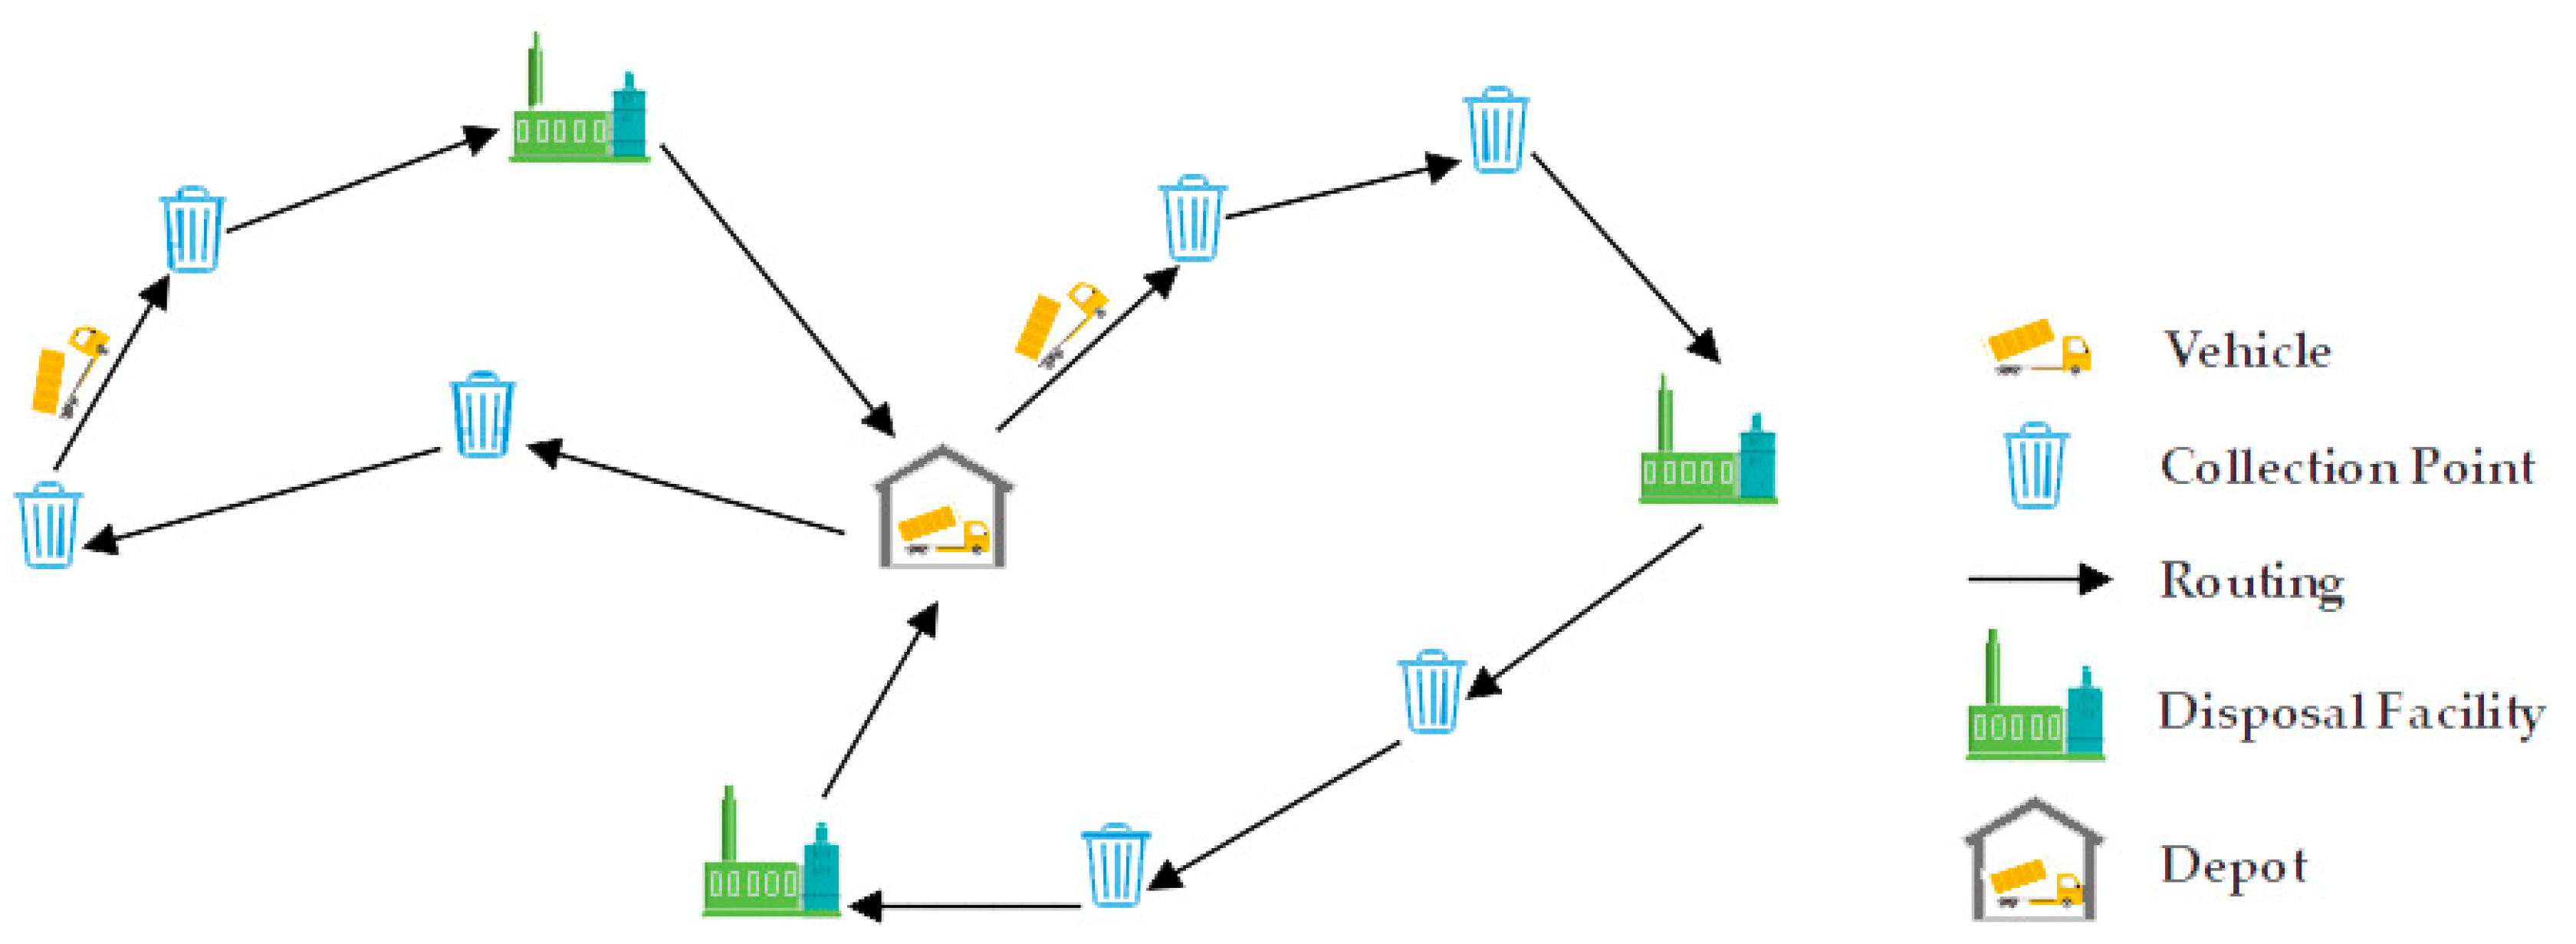
3.1. Problem Description
3.2. Problem Assumptions
- (1)
- Only one depot is considered in this model. All vehicles start from the depot at the same time, and return there eventually.
- (2)
- The vehicles start and end their trips with an empty load.
- (3)
- All vehicles are homogeneous with the same capacity limit.
- (4)
- The collection points are also homogeneous with the same capacity limit. Each point should be served once by one vehicle.
- (5)
- The vehicles may take multiple trips.
3.3. Parameters and Variables
3.4. Model Construction
3.4.1. Objectives Function
- (1)
- Vehicles’ Fixed Costs
- (2)
- Fuel Consumption Costs
- (3)
- Carbon Emission Costs
- (4)
- Penalty Costs
3.4.2. Model Setting
4. Algorithm Description
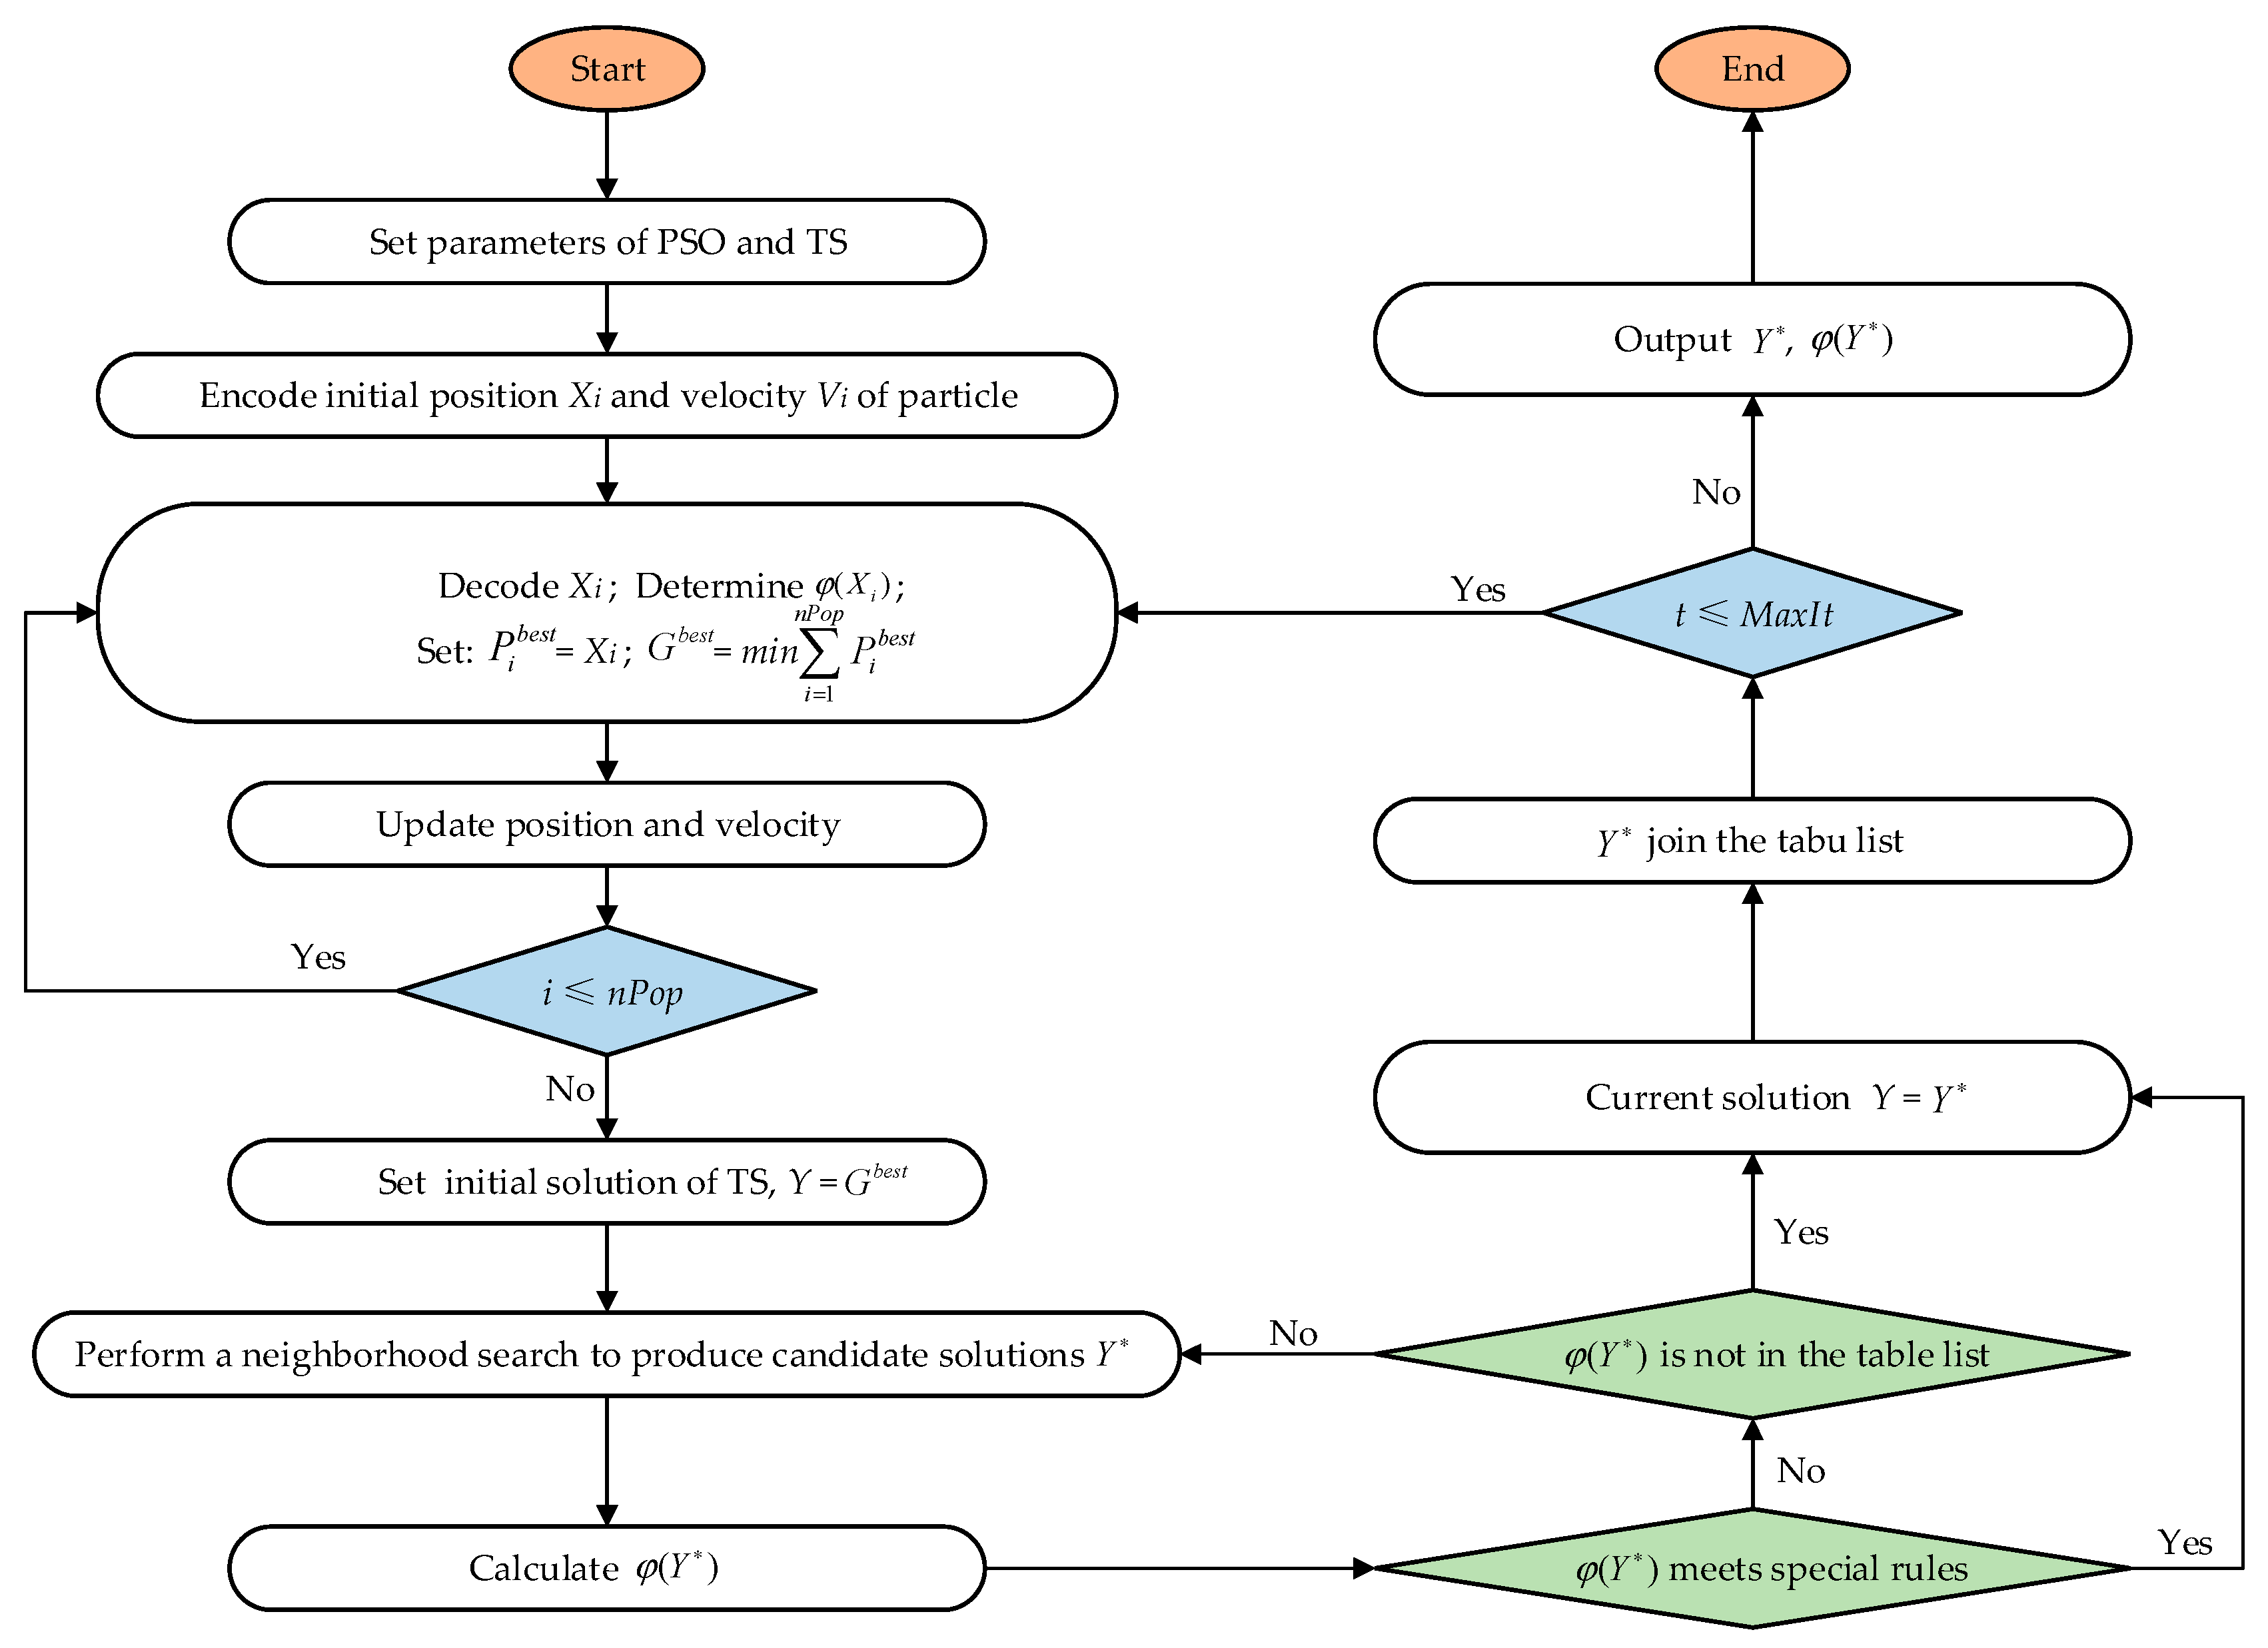
4.1. Algorithm Step Design
- (a)
- The length of particle code VarSize, the number of population nPop, and maximum number of iterations MaxIt are initialized.
- (b)
- PSO parameters are set: maximum value of inertia weight wmax, minimum value of inertia weight wmin, variance of random inertia weight , random value of R1, R2, and acceleration factors C1, C2.
- (c)
- TS parameters are set: tabu length TL, neighborhood size NS, and candidate size CS.
- (d)
- For each particle, initial position Xi and velocity Vi are determined as per Equation (16).
- (e)
- A set of vehicle routes is determined by decoding .
- (f)
- The fitness value of is determined by the objective function .
- (g)
- The personal best position of particle i is identified as .
- (h)
- The global best position of all particles is identified. If , . Otherwise, remains unchanged.
- (i)
- The velocity and position of particle i according to Equation (17) are updated. N(0,1) represents the standard normally distributed random numbers.
- (j)
- A set of vehicle routes (t+1) is updated by decoding (t+1).
- (k)
- : (t+1) is updated, if .
- (l)
- : is updated, if .
- (m)
- When the number of iterations is greater than the number of population nPop, the current partial optimization solution calculated by the PSO is regarded as the initial solution of TS: Y = .
- (n)
- Three kinds of neighborhood search algorithms, swap, reversion, and insertion, are randomly selected to improve the partial optimization solution Y.
- (o)
- The tabu list is renewed based on the special rules. Thus, the final selected solution is taken as the optimal solution .
- (p)
- Return to step (i) until the maximum number of iteration MaxIt is met.
- (q)
- as the best set of vehicle routes is decoded, with its corresponding fitness value .
4.2. Solution Representation and Decoding Method
5. Experimental Design and Results Analysis
5.1. Algorithm Experiment
5.2. Model Experiment
5.2.1. Experimental Design
5.2.2. Experimental Results
- (1)
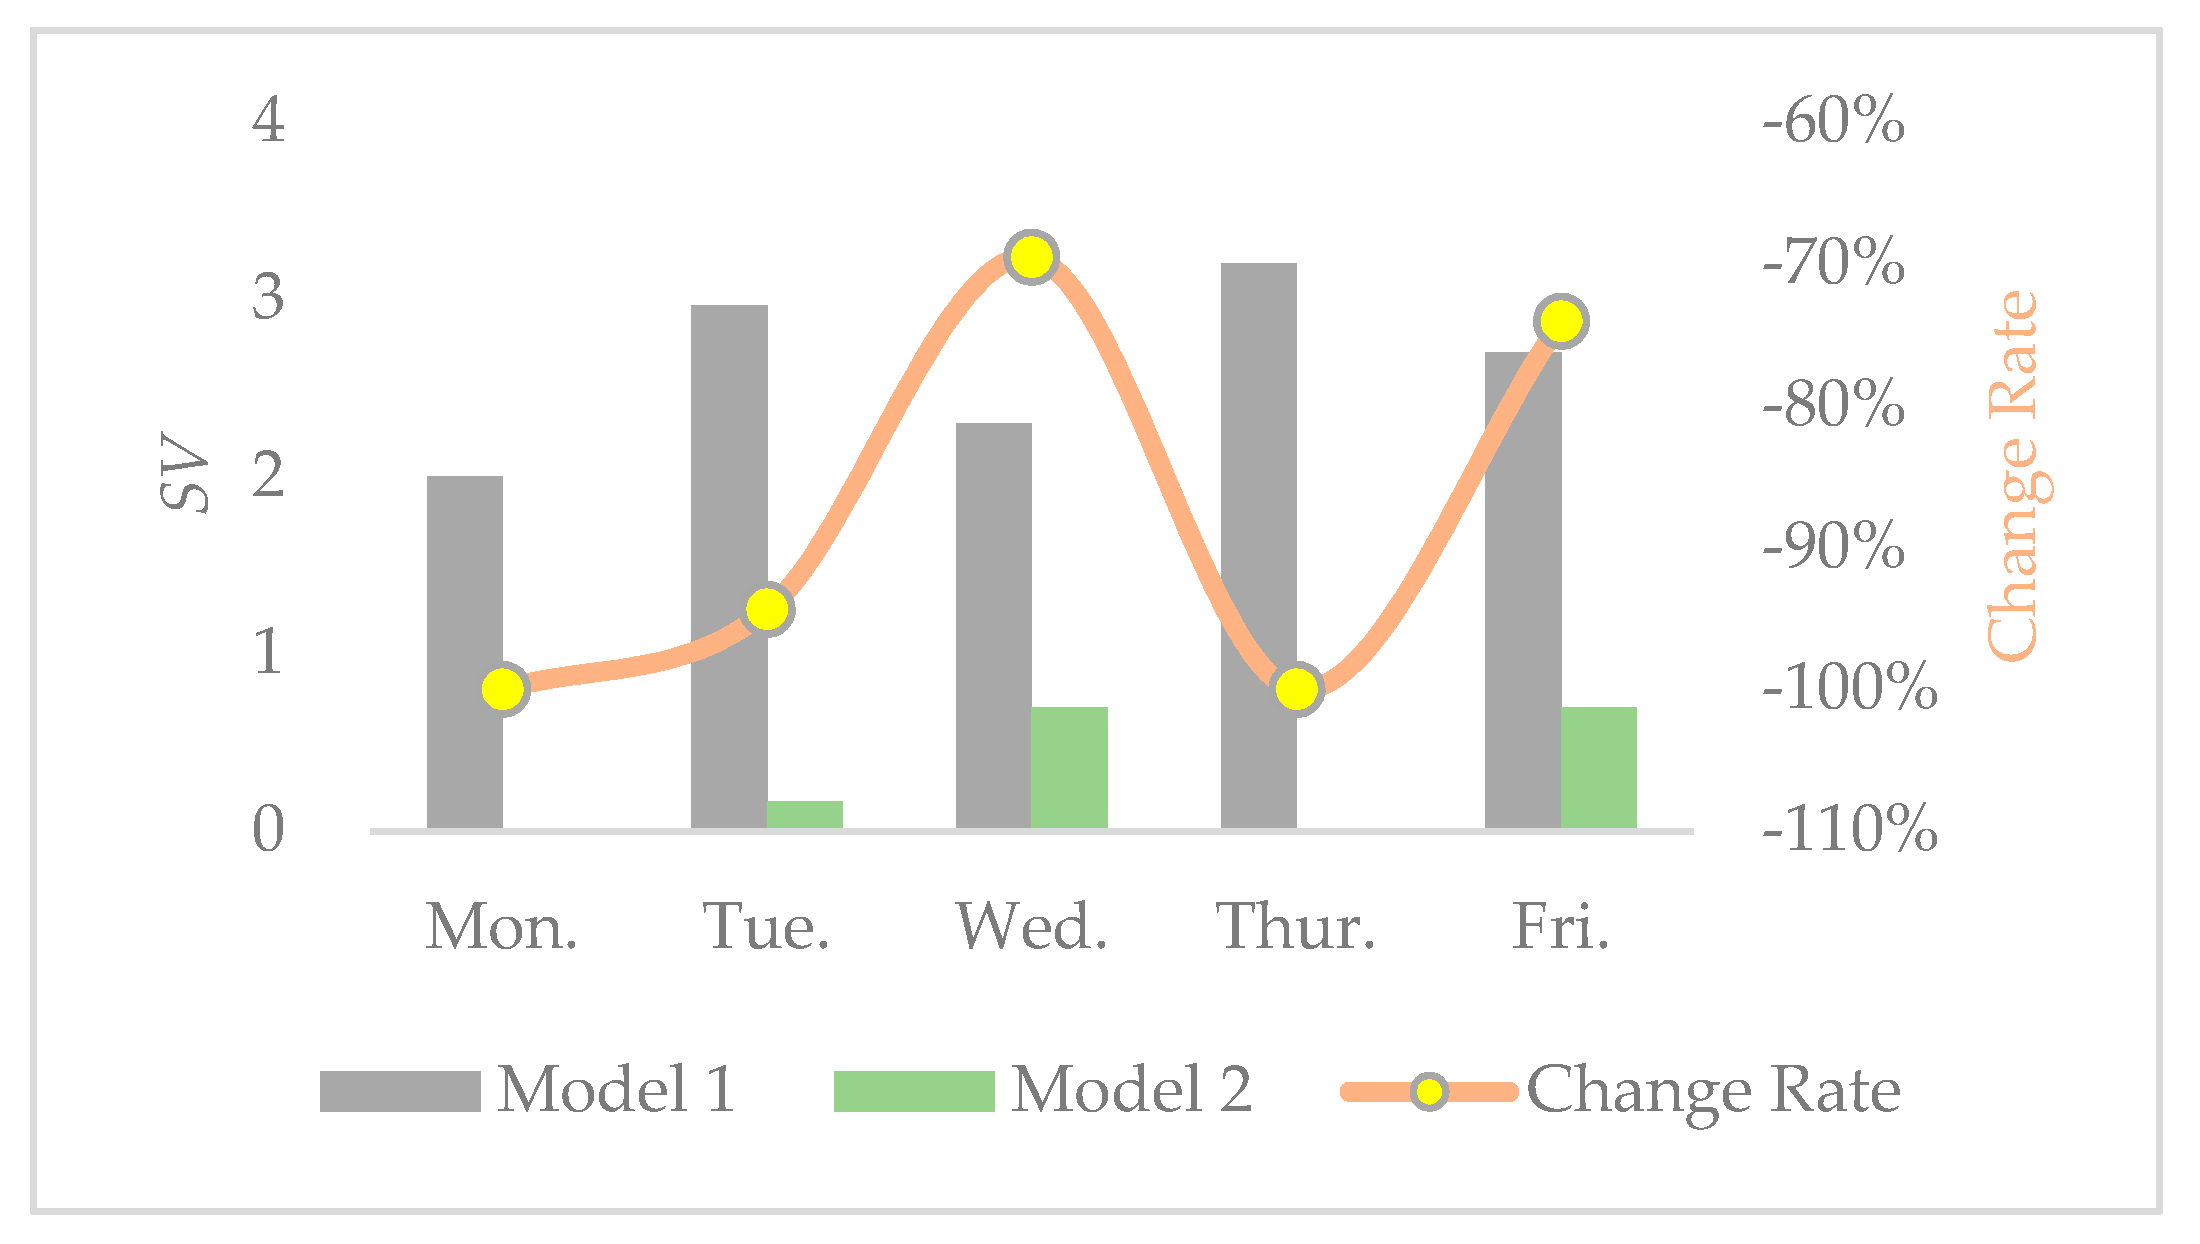
- When minimized penalty costs are added to the objective function in model 2, the values of SV obtained by model 2 are smaller than the values in model 1 every single day. Therefore, model 2 is efficient for improving social equity by acquiring balanced trip assignments of disposal facilities.
- (2)
- After accumulating for a whole week, the SV is 2.97 in model 2, while the value is 55.97 in model 1. However, for each day, the values of SV are between 0 and 3.5 in the two models. Therefore, the imbalanced phenomenon can be more severe in the long-term in model 1.
- (3)
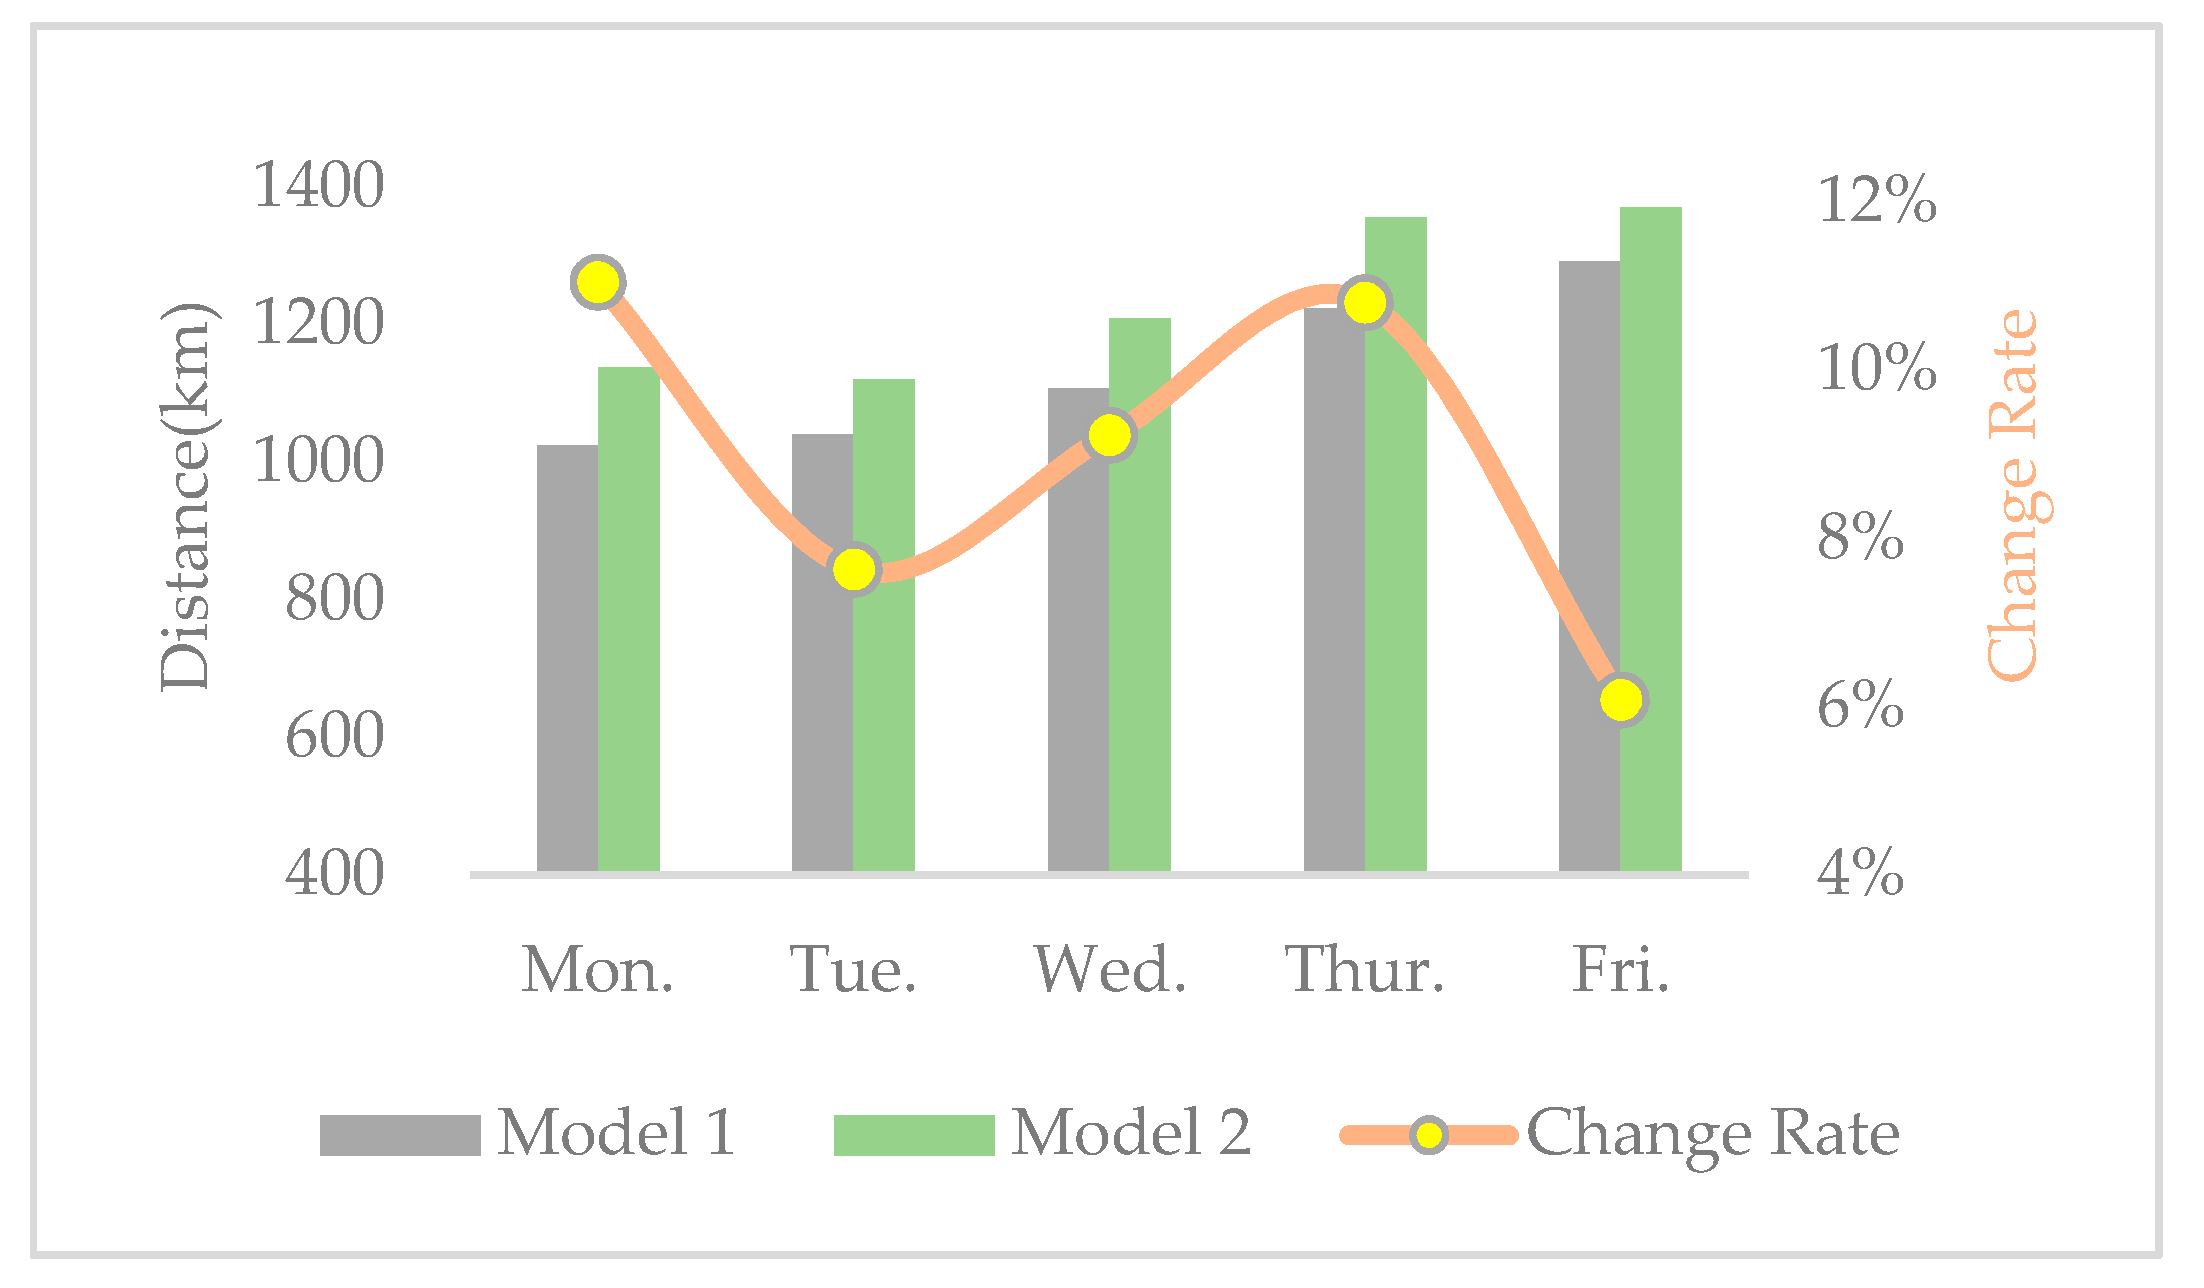
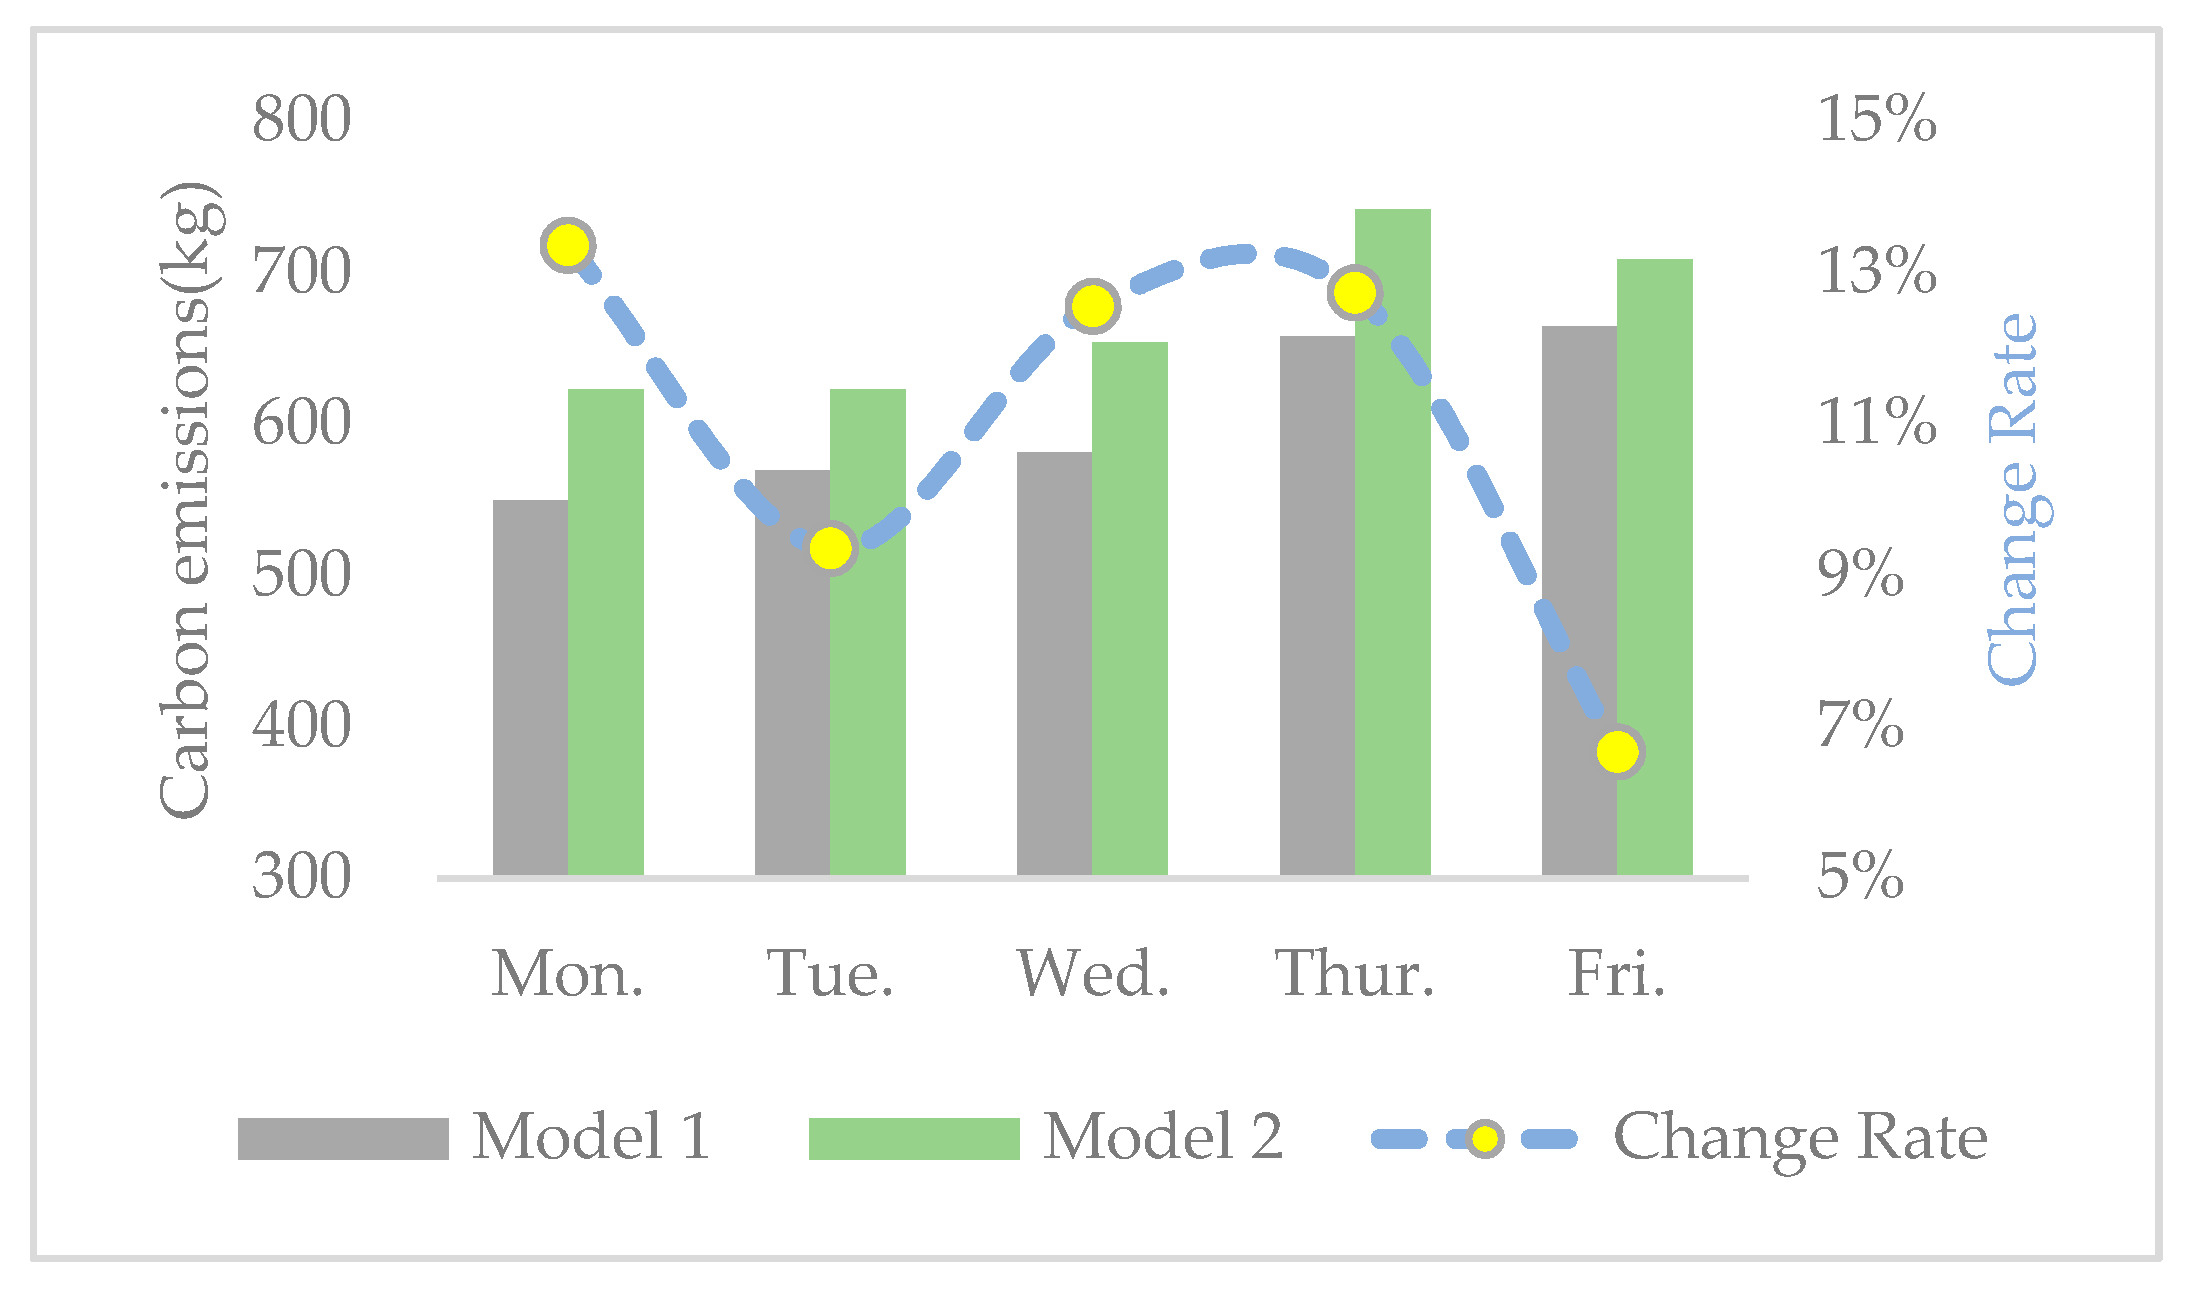
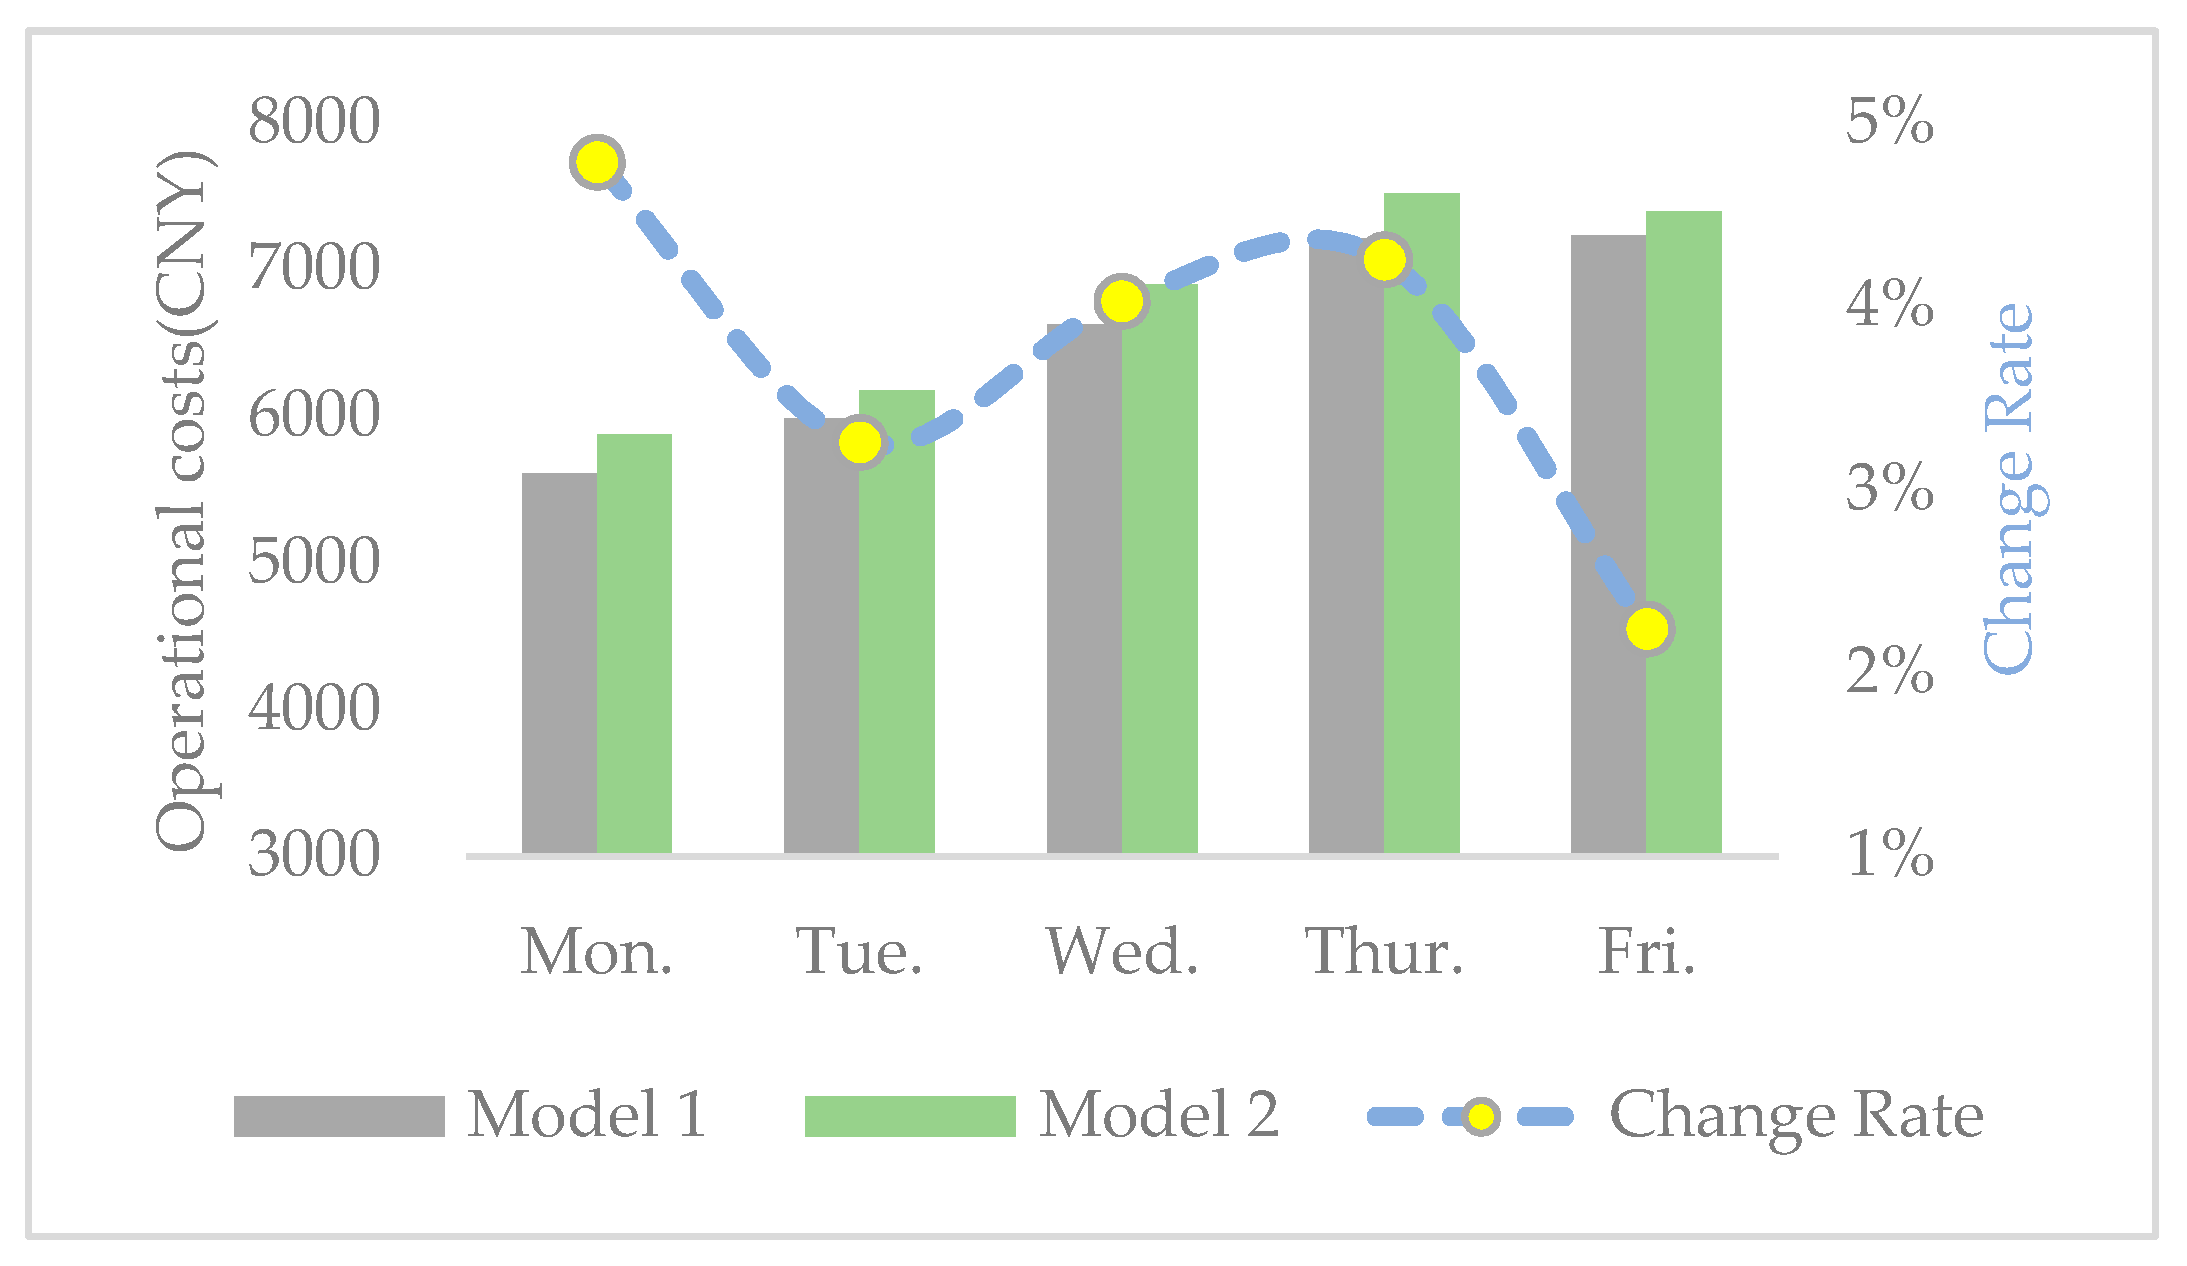
- In the meantime, the distance, carbon emissions, and operational costs of model 2 all increase in the results of model 1. Thus, we infer that there is a trade-off between economic costs, environmental benefits, and social equity.
- (1)
- The change trends of distance, carbon emissions, and operational costs coincide every day, that is, they ascend and descend simultaneously at each turning point. Therefore, we infer that there is a positive correlation between economic and environmental benefits.
- (2)
- The change rates of distance, carbon emissions, and operational costs are all situated in the interval between 1% and 15%, while the change rate of SV varies from −60% and −110%. Therefore, compared with the increase of social equity, the decrease in economic and environmental benefits is much smaller.
5.3. Analysis of Results
- The proposed CVRP model can simultaneously take into account economic cost, environmental benefits (carbon emissions), and social equity (balanced workload of disposal facilities), resulting in a sustainable solution.
- There is a certain trade-off between economic costs, environmental benefits, and social equity. Social equity can be increased between 60% and 110% when economic and environmental benefits only decrease between 1% and 15%.
- There is a positive correlation between economic costs and environmental benefits, which can be combined into one objective.
6. Discussion
7. Conclusions
Author Contributions
Funding
Conflicts of Interest
Appendix A

| PSO Parameters | Explanation |
|---|---|
| t | Iteration index: |
| i | Population index: |
| VarSize | Length of particle code |
| w(t) | Random inertia weight in the itth iteration |
| wmax | Maximum value of inertia weight |
| wmin | Minimum value of inertia weight |
| Variance of random inertia weight | |
| R1 | Random number in the interval [0, 1] |
| R2 | Random number in the interval [0, 1] |
| C1 | Personal acceleration factor |
| C2 | Global acceleration factor |
| VarMin | Lower bound of the position for each particle |
| VarMax | Upper bound of the position for each particle |
| VelMin | Lower bound of the velocity for each particle |
| VelMax | Upper bound of the velocity for each particle |
| Vi(t) | Velocity of particle i in the tth iteration |
| Xi(t) | Position of particle i in the tth iteration |
| Ki(t) | Set of vehicle routes corresponding to particle i in the tth iteration |
| Personal best position of particle i | |
| Global best position of all particles | |
| Fitness value of Xi(t) | |
| TS Parameters | Explanation |
| TL | Tabu length |
| NS | Neighborhood size |
| CS | Candidate size |
| Day | Model 1 | Model 2 |
|---|---|---|
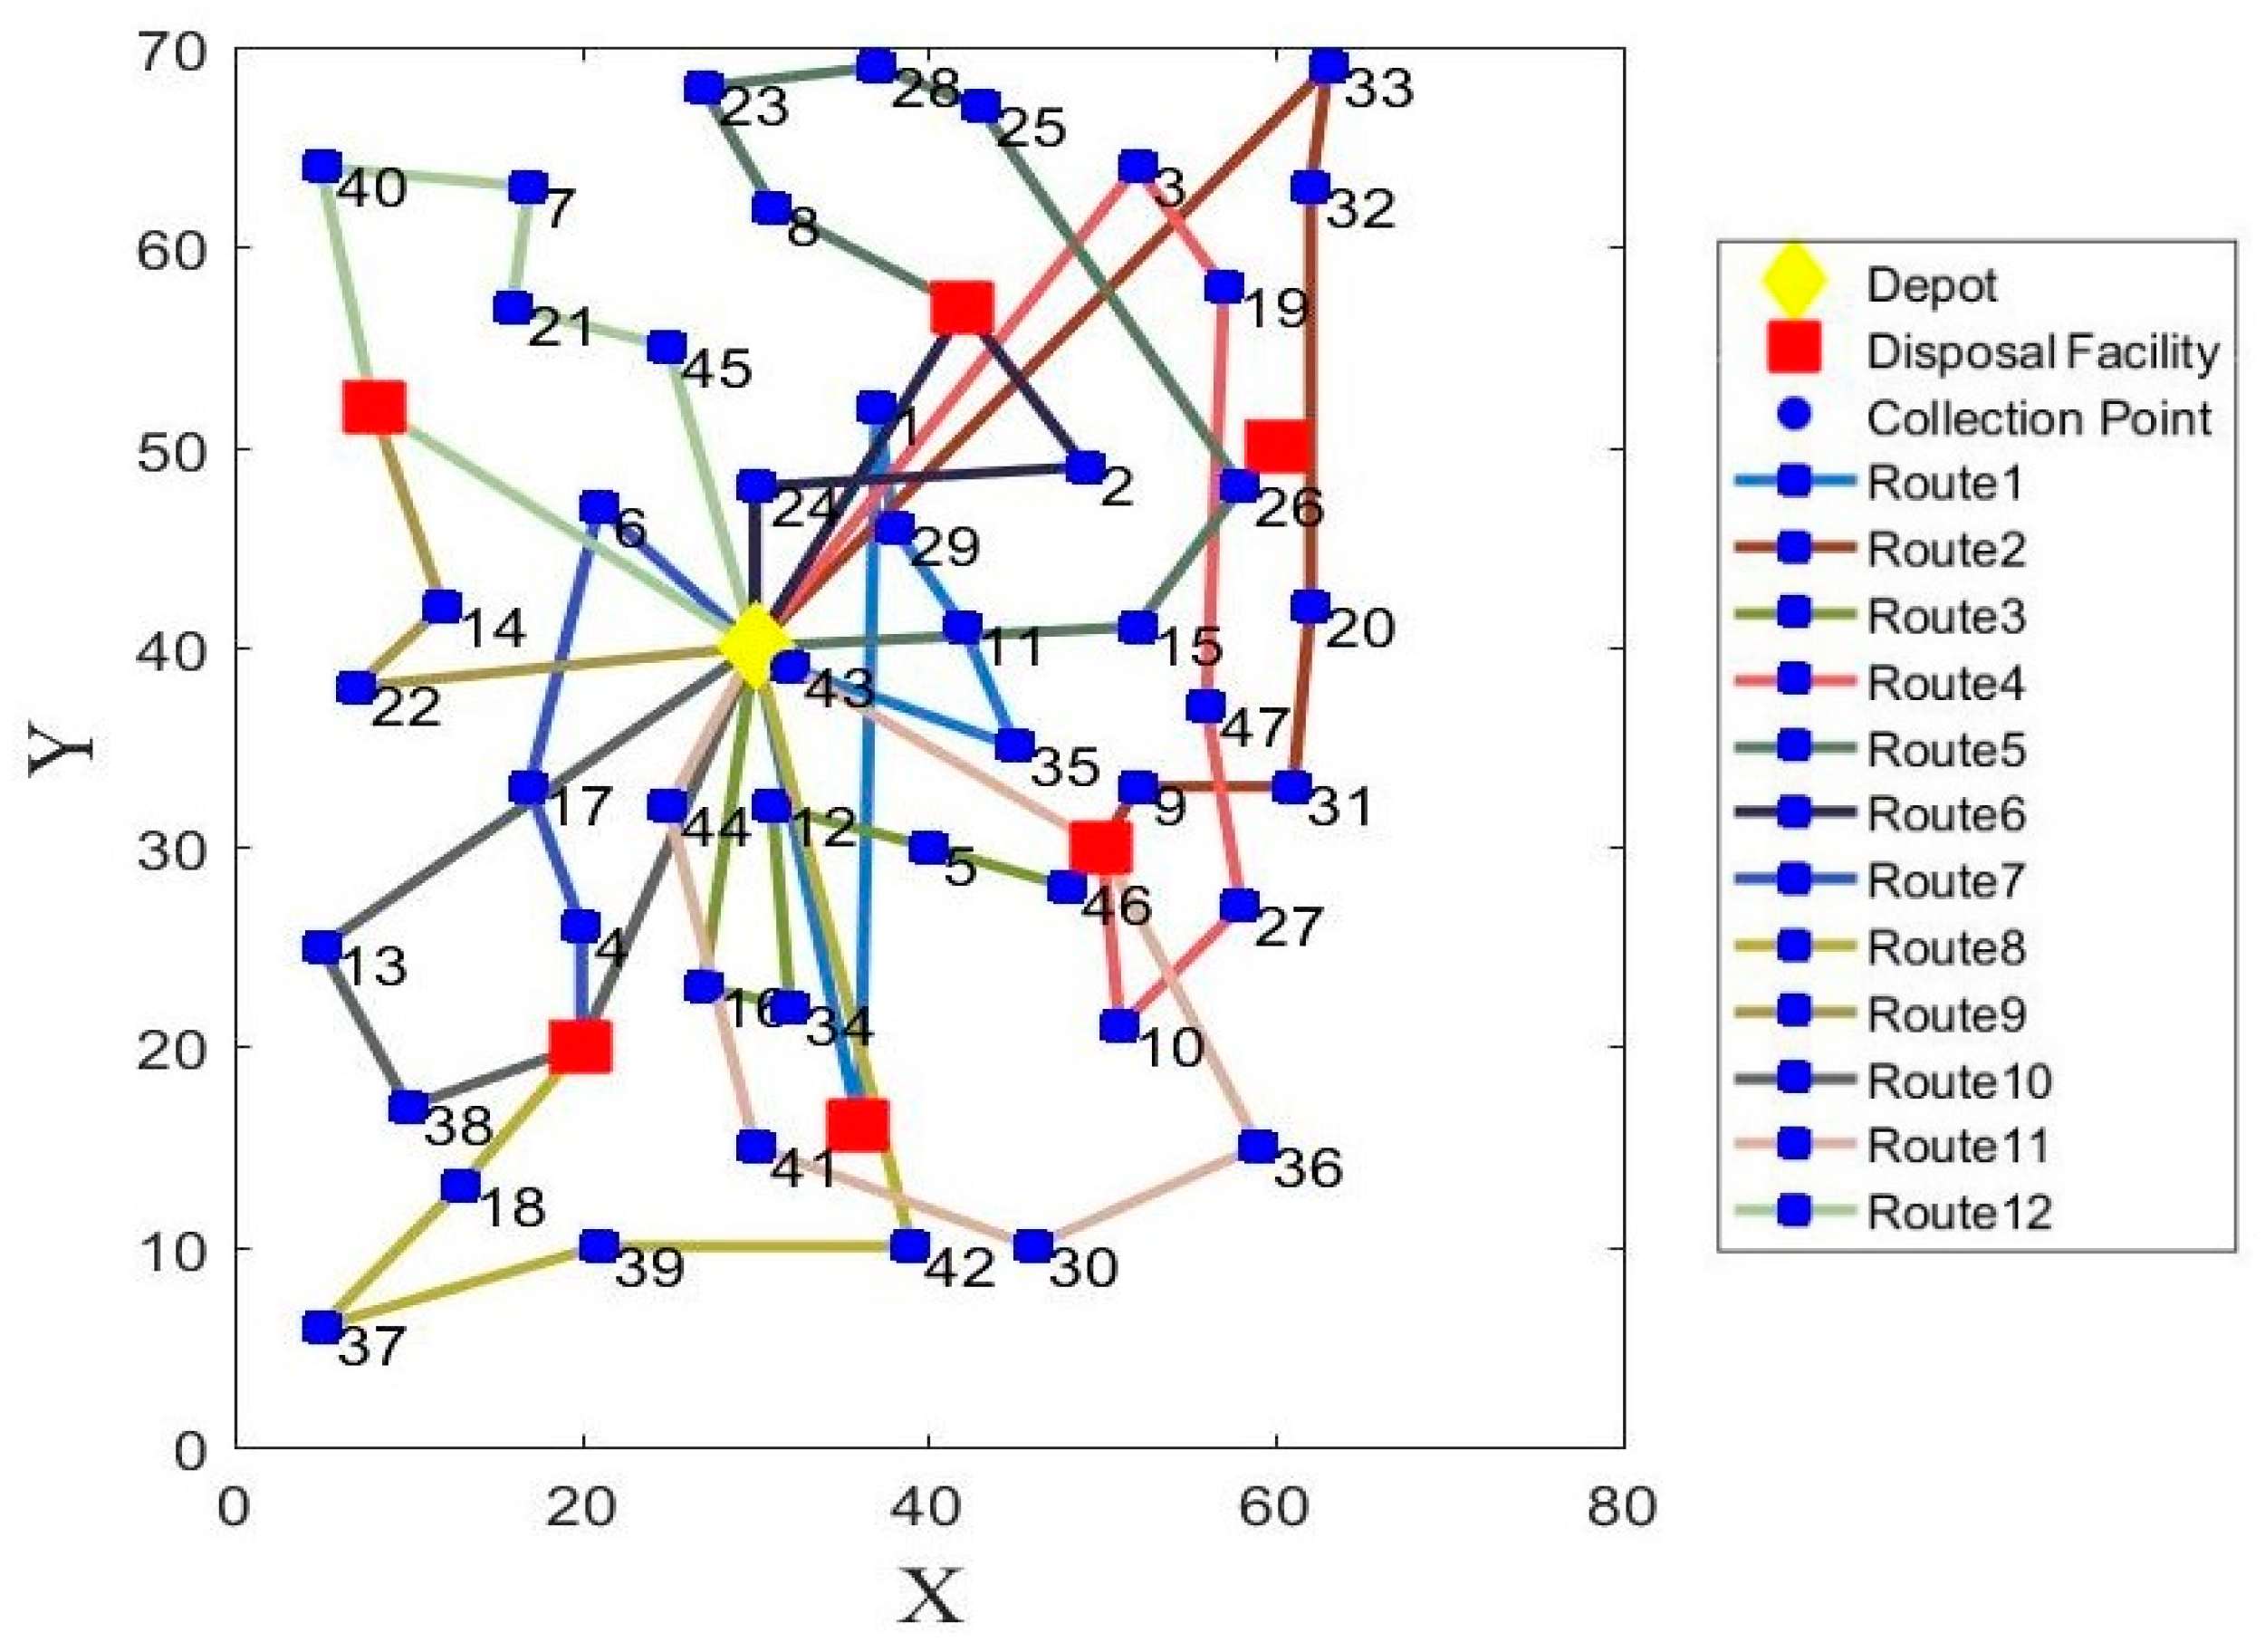
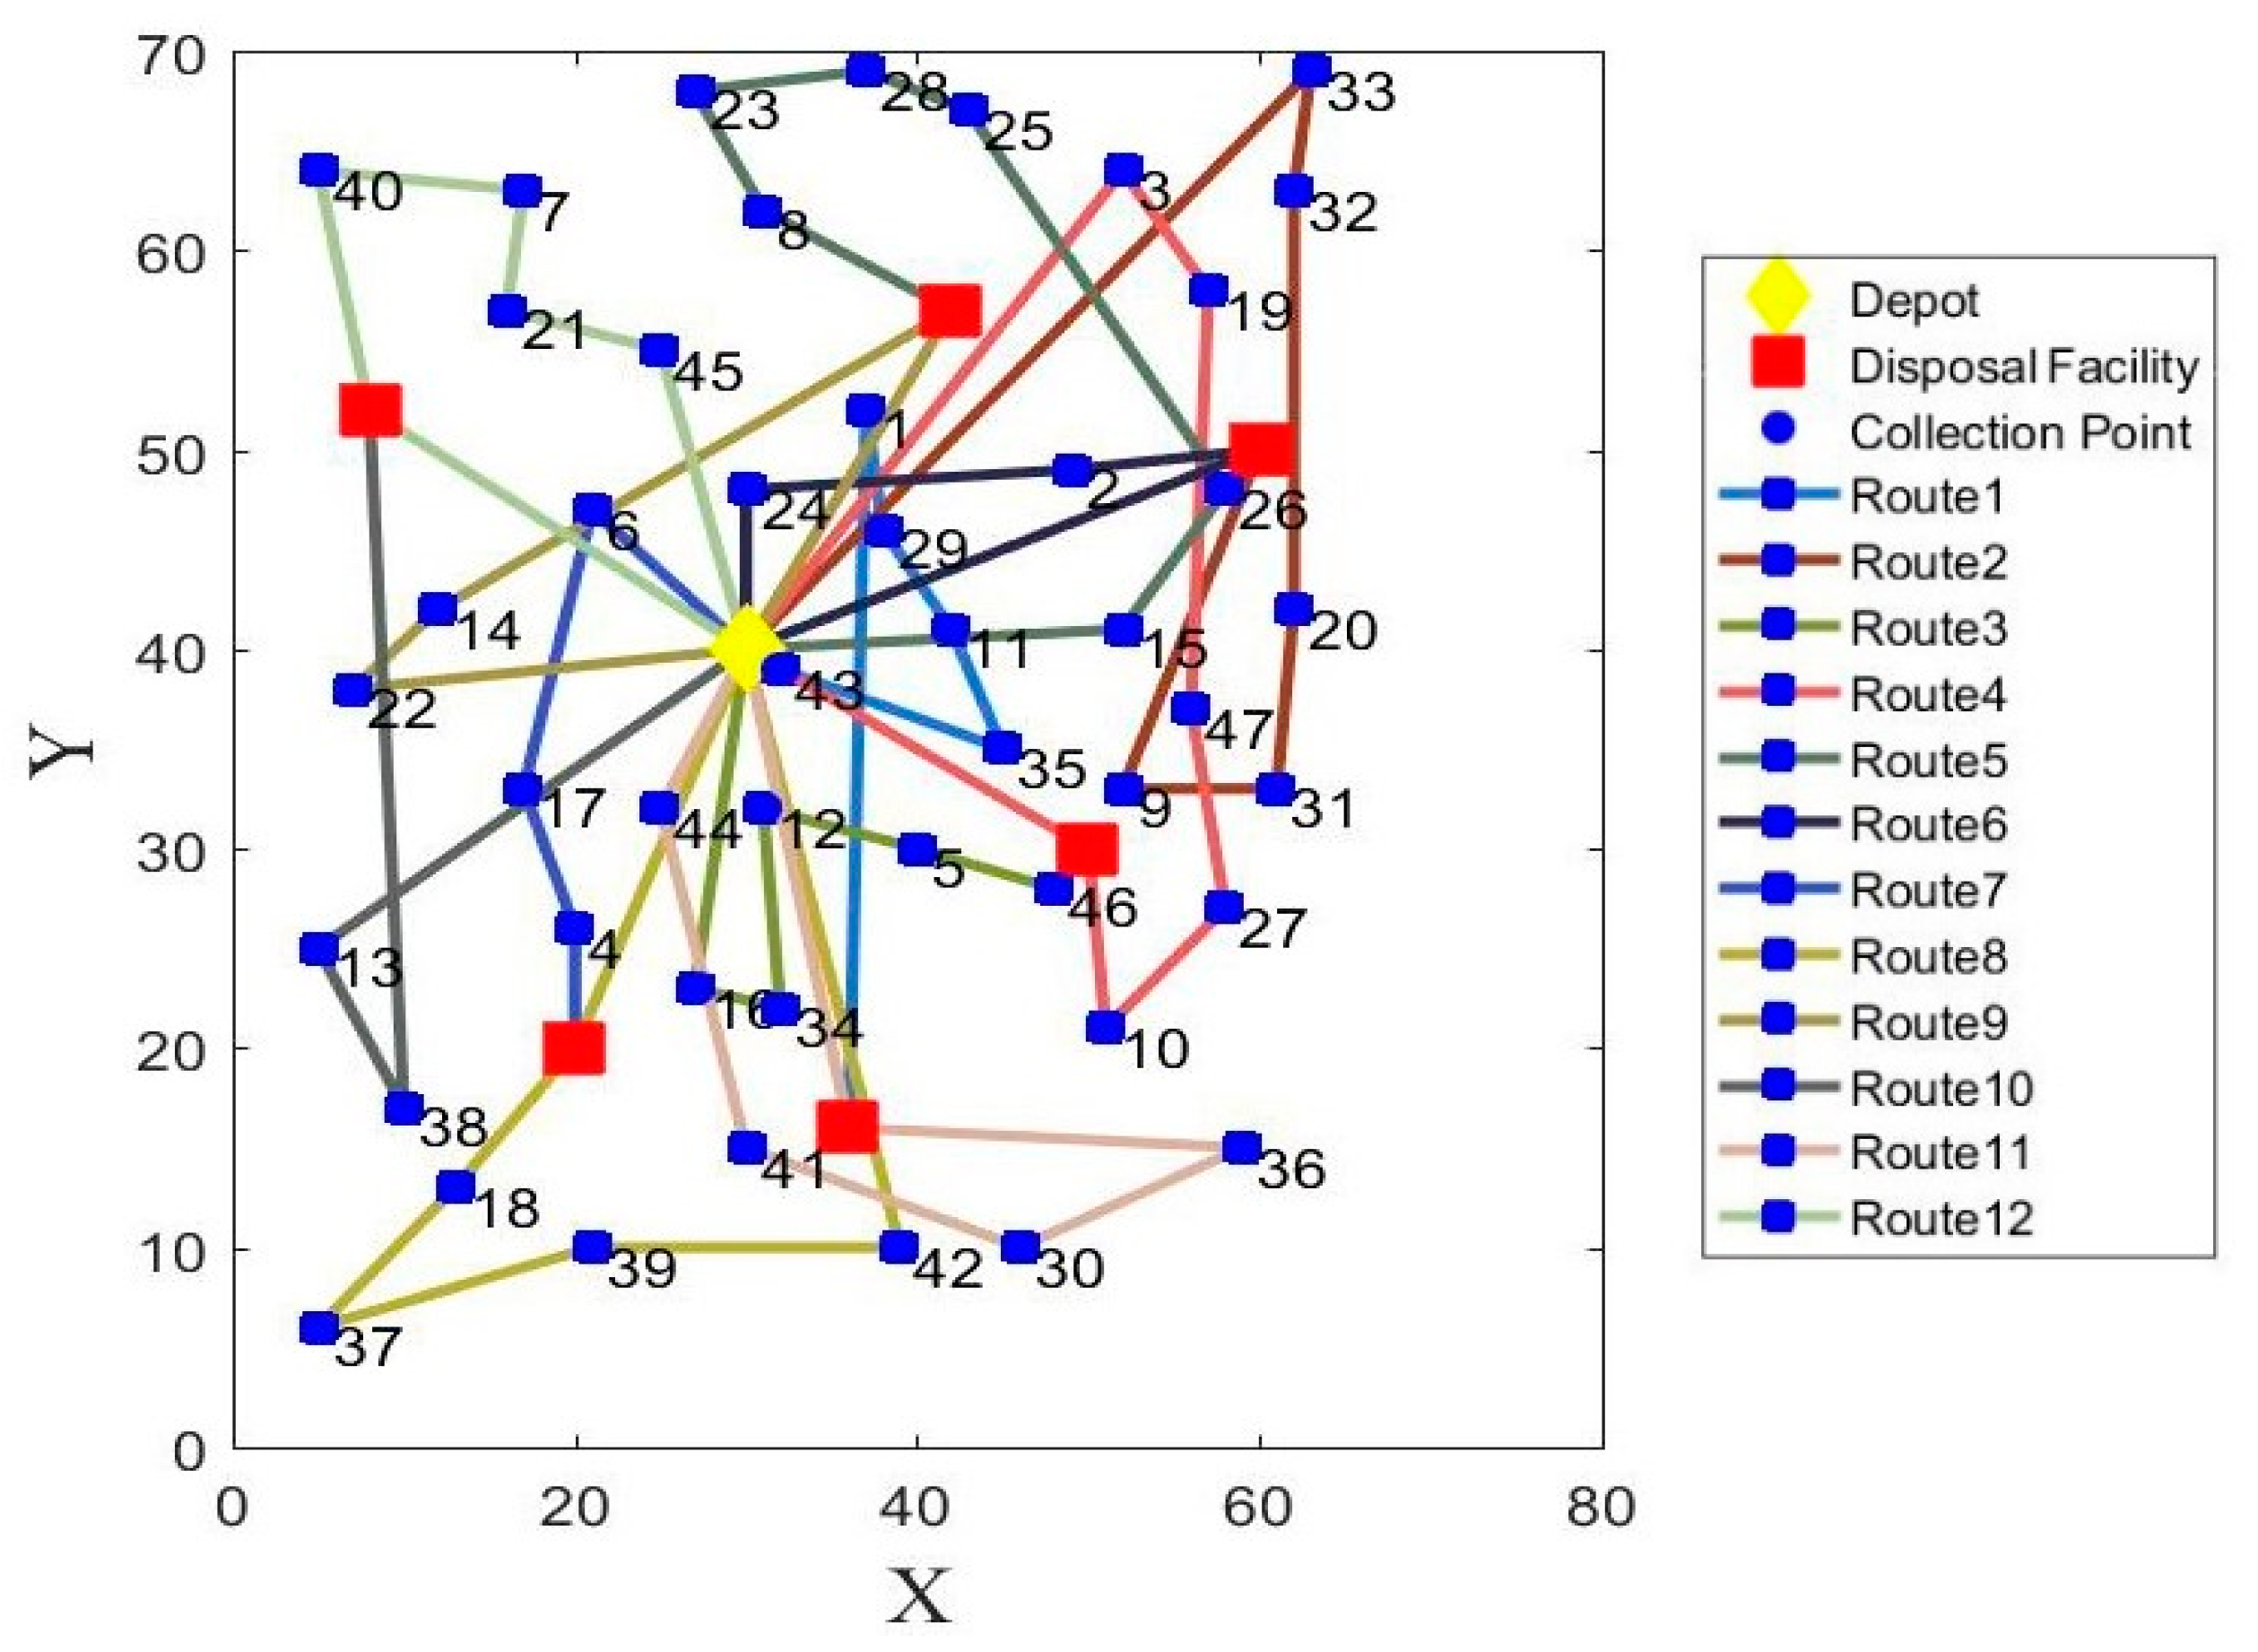
| Monday | 6-17-4-, 42-39-37-18-, 13-38-, 33-32-20-31-9-, 16-34-12-5-46-, 3-19-47-27-10-, 44-41-30-36-, 43-35-11-29-1-, 15-26-25-28-23-8-, 24-2-, 22-14-, 45-21-7-40- | 6-17-4-, 42-39-37-18-, 16-34-12-5-46-, 3-19-47-27-10-, 33-32-20-31-9-, 24-2-, 43-35-11-29-1-, 44-41-30-36-, 15-26-25-28-23-8-, 22-14-, 13-38-, 45-21-7-40- |
| Tuesday | 16-41-39-37-18-, 44-17-, 13-38-, 14-22-4-, 1-34-10-36-27-9-, 5-46-, 33-32-26-20-31-, 12-42-30-, 43-11-29-3-25-, 6-45-8-28-, 19-, 35-47-15-2-, 24-23-7-21-40- | 44-17-, 13-38-, 5-46-, 1-34-10-36-27-9-, 33-32-26-20-31-, 6-45-8-28-, 19-, 12-42-30-, 14-22-4-, 35-47-15-2-, 43-11-29-3-25-, 16-41-39-37-18-, 24-23-7-21-40- |
| Wednesday | 22-13-18-, 39-37-38-, 12-34-16-4-, 44-17-, 35-15-47-, 20-31-27-, 36-10-46-9-, 5-, 30-42-41-, 43-11-29-1-, 32-33-3-25-, 19-26-2-, 24-8-23-28-, 14-6-21-, 45-7-40- | 5-, 22-13-18-, 12-34-16-4-, 20-31-27-, 35-15-47-, 36-10-46-9-, 24-8-23-28-, 39-37-38-, 30-42-41-, 32-33-3-25-, 14-6-21-, 19-26-2-, 45-7-40-, 43-11-29-1-, 44-17- |
| Thursday | 4-, 41-39-18-, 44-17-, 13-37-38-, 36-10-31-, 15-27-,12-16-46-, 11-35-9-, 5-47-26-20-, 2-1-, 43-34-30-42-, 29-3-25-, 45-23-28-, 19-32-33-, 6-, 24-8-21-, 7-40-, 22-14- | 22-14-, 41-39-18-, 4-, 12-16-46-, 11-35-9-, 36-10-31-, 19-32-33-, 45-23-28-, 5-47-26-20-, 43-34-30-42-, 15-27-, 2-1-, 7-40-, 6-, 29-3-25-, 44-17-, 13-37-38-, 24-8-21- |
| Friday | 39-41-34-16-, 4-12-, 13-38-, 37-18-, 17-, 10-46-5-, 30-42-36-, 27-, 47-31-9-, 11-29-35-, 15-26-, 32-33-3-, 43-24-1-, 2-, 25-28-, 45-23-8-, 20-19-, 40-,44-6-, 22-14-, 21- 7- | 39-41-34-16-, 17-, 13-38-, 37-18-, 10-46-5-, 30-42-36-, 27-, 47-31-9-, 20-19-, 15-26-, 32-33-3-, 43-24-1-, 4-12-, 2-, 25-28-, 11-29-35-, 40-, 44-6-, 22-14-, 21-7-, 45-23-8- |
References
- Badran, M.F.; El-Haggar, S.M. Optimization of municipal solid waste management in Port Said—Egypt. Waste Manag. 2006, 26, 534–545. [Google Scholar] [CrossRef] [PubMed]
- Li, F.; Cai, B.; Ye, Z.; Wang, Z.; Zhang, W.; Zhou, P.; Chen, J. Changing patterns and determinants of transportation carbon emissions in Chinese cities. Energy 2019, 174, 562–575. [Google Scholar] [CrossRef]
- Heidari, R.; Yazdanparast, R.; Jabbarzadeh, A. Sustainable design of a municipal solid waste management system considering waste separators: A real-world application. Sustain. Cities Soc. 2019, 47, 101457. [Google Scholar] [CrossRef]
- Batur, M.E.; Cihan, A.; Korucu, M.K.; Bektaş, N.; Keskinler, B. A mixed integer linear programming model for long-term planning of municipal solid waste management systems: Against restricted mass balances. Waste Manag. 2020, 105, 211–222. [Google Scholar] [CrossRef] [PubMed]
- Bhat, V.N. A model for the optimal allocation of trucks for solid waste management. Waste Manag. Res. 1996, 14, 87–96. [Google Scholar] [CrossRef]
- Pereira Ramos, T.R.; Gomes, M.I.; Barbosa-Povoa, A.P. Planning a sustainable reverse logistics system: Balancing costs with environmental and social concerns. Omega 2014, 48, 60–74. [Google Scholar] [CrossRef] [Green Version]
- Sala, S. Chapter 3—Triple bottom line, sustainability and sustainability assessment, an overview. In Biofuels for a More Sustainable Future; Ren, J., Scipioni, A., Manzardo, A., Liang, H., Eds.; Elsevier: Amsterdam, The Netherlands, 2020; pp. 47–72. [Google Scholar]
- Maria, C.; Góis, J.; Leitão, A. Challenges and perspectives of greenhouse gases emissions from municipal solid waste management in Angola. Energy Rep. 2019. [Google Scholar] [CrossRef]
- Mohsenizadeh, M.; Tural, M.K.; Kentel, E. Municipal solid waste management with cost minimization and emission control objectives: A case study of Ankara. Sustain. Cities Soc. 2020, 52, 101807. [Google Scholar] [CrossRef]
- Wang, S.; Tao, F.; Shi, Y.; Wen, H. Optimization of Vehicle Routing Problem with Time Windows for Cold Chain Logistics Based on Carbon Tax. Sustainability 2017, 9, 694. [Google Scholar] [CrossRef] [Green Version]
- Shen, L.; Tao, F.; Wang, S. Multi-Depot Open Vehicle Routing Problem with Time Windows Based on Carbon Trading. Int. J. Environ. Res. Public Health 2018, 15, 2025. [Google Scholar] [CrossRef] [Green Version]
- Tang, C.S.; Zhou, S. Research advances in environmentally and socially sustainable operations. Eur. J. Oper. Res. 2012, 223, 585–594. [Google Scholar] [CrossRef]
- Li, J.-Q.; Borenstein, D.; Mirchandani, P.B. Truck scheduling for solid waste collection in the City of Porto Alegre, Brazil. Omega 2008, 36, 1133–1149. [Google Scholar] [CrossRef]
- Dukhanin, V.; Searle, A.; Zwerling, A.; Dowdy, D.W.; Taylor, H.A.; Merritt, M.W. Integrating social justice concerns into economic evaluation for healthcare and public health: A systematic review. Soc. Sci. Med. 2018, 198, 27–35. [Google Scholar] [CrossRef] [PubMed]
- Ramamoorthy, N.; Flood, P.C.; Kulkarni, S.P.; Gupta, A. Individualism–collectivism and tenure intent among knowledge workers in India and Bulgaria: Moderating effects of equity perceptions and task interdependence. J. High Technol. Manag. Res. 2014, 25, 201–209. [Google Scholar] [CrossRef]
- Kwatra, S.; Kumar, A.; Sharma, P. A critical review of studies related to construction and computation of Sustainable Development Indices. Ecol. Indic. 2020, 112, 106061. [Google Scholar] [CrossRef]
- Akhtar, M.; Hannan, M.A.; Begum, R.A.; Basri, H.; Scavino, E. Backtracking search algorithm in CVRP models for efficient solid waste collection and route optimization. Waste Manag. 2017, 61, 117–128. [Google Scholar] [CrossRef]
- Hannan, M.A.; Akhtar, M.; Begum, R.A.; Basri, H.; Hussain, A.; Scavino, E. Capacitated vehicle-routing problem model for scheduled solid waste collection and route optimization using PSO algorithm. Waste Manag. 2018, 71, 31–41. [Google Scholar] [CrossRef]
- Bektas, T.; Laporte, G. The Pollution-Routing Problem. Transp. Res. Part B-Methodol. 2011, 45, 1232–1250. [Google Scholar] [CrossRef]
- Banyai, T.; Tamas, P.; Illes, B.; Stankeviciute, Z.; Banyai, A. Optimization of Municipal Waste Collection Routing: Impact of Industry 4.0 Technologies on Environmental Awareness and Sustainability. Int. J. Environ. Res. Public Health 2019, 16, 634. [Google Scholar] [CrossRef] [Green Version]
- Faccio, M.; Persona, A.; Zanin, G. Waste collection multi objective model with real time traceability data. Waste Manag. 2011, 31, 2391–2405. [Google Scholar] [CrossRef]
- Yadav, V.; Karmakar, S. Sustainable collection and transportation of municipal solid waste in urban centers. Sustain. Cities Soc. 2020, 53, 101937. [Google Scholar] [CrossRef]
- Ramos, T.R.P.; Oliveira, R.C. Delimitation of service areas in reverse logistics networks with multiple depots. J. Oper. Res. Soc. 2011, 62, 1198–1210. [Google Scholar] [CrossRef]
- Jozefowiez, N.; Semet, F.; Talbi, E.-G. An evolutionary algorithm for the vehicle routing problem with route balancing. Eur. J. Oper. Res. 2009, 195, 761–769. [Google Scholar] [CrossRef]
- Reiter, P.; Gutjahr, W.J. Exact hybrid algorithms for solving a bi-objective vehicle routing problem. Cent. Eur. J. Oper. Res. 2012, 20, 19–43. [Google Scholar] [CrossRef]
- De Clercq, D.; Wen, Z.; Fan, F. Performance Evaluation of Restaurant Food Waste and Biowaste to Biogas Pilot Projects in China and Implications for National Policy. J. Environ. Manag. 2017, 189, 115–124. [Google Scholar] [CrossRef]
- Chu, Z.J.; Wu, B.Y.; He, Z.Y.; Zhuang, J.; Wang, W.N. The policy-making trend analysis of municipal solid waste in China 1980-2015. Waste Manag. Res. 2019, 37, 601–610. [Google Scholar] [CrossRef]
- Ma, J.; Hipel, K.W.; Hanson, M.L.; Cai, X.; Liu, Y. An analysis of influencing factors on municipal solid waste source-separated collection behavior in Guilin, China by Using the Theory of Planned Behavior. Sustain. Cities Soc. 2018, 37, 336–343. [Google Scholar] [CrossRef]
- Wang, Z.; Lv, J.; Gu, F.; Yang, J.; Guo, J. Environmental and economic performance of an integrated municipal solid waste treatment: A Chinese case study. Sci. Total Environ. 2020, 709, 136096. [Google Scholar] [CrossRef]
- Lu, J.-W.; Chang, N.-B.; Liao, L.; Liao, M.-Y. Smart and Green Urban Solid Waste Collection Systems: Advances, Challenges, and Perspectives. IEEE Syst. J. 2017, 11, 2804–2817. [Google Scholar] [CrossRef]
- Suocheng, D.; Tong, K.W.; Yuping, W. Municipal solid waste management in China: Using commercial management to solve a growing problem. Util. Policy 2001, 10, 7–11. [Google Scholar] [CrossRef]
- Pelletier, S.; Jabali, O.; Laporte, G. The electric vehicle routing problem with energy consumption uncertainty. Transp. Res. Part B-Methodol. 2019, 126, 225–255. [Google Scholar] [CrossRef]
- Rodriguez-Martin, I.; Salazar-Gonzalez, J.-J.; Yaman, H. The periodic vehicle routing problem with driver consistency. Eur. J. Oper. Res. 2019, 273, 575–584. [Google Scholar] [CrossRef]
- Benrahou, F.; Tairi, A. Capacitated Vehicle Routing Problem for Collection Waste Lube Oil in Algiers. Fresenius Environ. Bull. 2019, 28, 4500–4505. [Google Scholar]
- Hemmelmayr, V.; Doerner, K.F.; Hartl, R.F.; Rath, S. A heuristic solution method for node routing based solid waste collection problems. J. Heuristics 2013, 19, 129–156. [Google Scholar] [CrossRef] [Green Version]
- Viotti, P.; Polettini, A.; Pomi, R.; Innocenti, C. Genetic, algorithms as a promising tool for optimisation of the MSW collection routes. Waste Manag. Res. 2003, 21, 292–298. [Google Scholar] [CrossRef]
- Liu, J.; He, Y. A clustering-based multiple ant colony system for the waste collection vehicle routing problems. In Proceedings of the 2012 Fifth International Symposium on Computational Intelligence and Design, Hangzhou, China, 28–29 October 2012. [Google Scholar]
- Kuo, R.J.; Zulvia, F.E.; Suryadi, K. Hybrid particle swarm optimization with genetic algorithm for solving capacitated vehicle routing problem with fuzzy demand—A case study on garbage collection system. Appl. Math. Comput. 2012, 219, 2574–2588. [Google Scholar] [CrossRef]
- Xia, Y.; Fu, Z.; Tsai, S.-B.; Wang, J. A New TS Algorithm for Solving Low-Carbon Logistics Vehicle Routing Problem with Split Deliveries by Backpack-From a Green Operation Perspective. Int. J. Environ. Res. Public Health 2018, 15, 949. [Google Scholar] [CrossRef] [Green Version]
- Kim, B.-I.; Kim, S.; Sahoo, S. Waste collection vehicle routing problem with time windows. Comput. Oper. Res. 2006, 33, 3624–3642. [Google Scholar] [CrossRef]
- Xiao, Y.; Zhao, Q.; Kaku, I.; Xu, Y. Development of a fuel consumption optimization model for the capacitated vehicle routing problem. Comput. Oper. Res. 2012, 39, 1419–1431. [Google Scholar] [CrossRef]
- Shen, L.; Tao, F.; Shi, Y.; Qin, R. Optimization of Location-Routing Problem in Emergency Logistics Considering Carbon Emissions. Int. J. Environ. Res. Public Health 2019, 16, 2982. [Google Scholar] [CrossRef] [Green Version]
- The VRP Web. Available online: http://www.bernabe.dorronsoro.es/vrp/ (accessed on 28 February 2020).
- Alinaghian, M.; Ghazanfari, M.; Norouzi, N.; Nouralizadeh, H. A Novel Model for the Time Dependent Competitive Vehicle Routing Problem: Modified Random Topology Particle Swarm Optimization. Netw. Spat. Econ. 2017, 17, 1185–1211. [Google Scholar] [CrossRef]
- Li, M.; Chen, H.; Shi, X.; Liu, S.; Zhang, M.; Lu, S. A multi-information fusion “triple variables with iteration” inertia weight PSO algorithm and its application. Appl. Soft Comput. 2019, 84, 105677. [Google Scholar] [CrossRef]
- Wei, Q.; Guo, Z.; Lau, H.C.; He, Z. An artificial bee colony-based hybrid approach for waste collection problem with midway disposal pattern. Appl. Soft. Comput. 2019, 76, 629–637. [Google Scholar] [CrossRef] [Green Version]
- Buhrkal, K.; Larsen, A.; Ropke, S. The waste collection vehicle routing problem with time windows in a city logistics context. Procedia Soc. Behav. Sci. 2012, 39, 241–254. [Google Scholar] [CrossRef] [Green Version]
- Li, J.; Wang, D.; Zhang, J. Heterogeneous fixed fleet vehicle routing problem based on fuel and carbon emissions. J. Clean. Prod. 2018, 201, 896–908. [Google Scholar] [CrossRef]
- Nie, Y.; Wu, Y.; Zhao, J.; Zhao, J.; Chen, X.; Maraseni, T.; Qian, G. Is the finer the better for municipal solid waste (MSW) classification in view of recyclable constituents? A comprehensive social, economic and environmental analysis. Waste Manag. 2018, 79, 472–480. [Google Scholar] [CrossRef]
- Chen, S.; Huang, J.; Xiao, T.; Gao, J.; Bai, J.; Luo, W.; Dong, B. Carbon emissions under different domestic waste treatment modes induced by garbage classification: Case study in pilot communities in Shanghai, China. Sci. Total Environ. 2020, 717, 137193. [Google Scholar] [CrossRef]


| Variables | Explanation |
|---|---|
| , if vehicle h visits from point i to point j, Otherwise, | |
| if vehicle h visits point i, Otherwise, | |
| if sub-path m of vehicle h unloads waste at disposal facility r, includes point i served by the vehicle h, Otherwise, | |
| if sub-path m assigns to disposal facility r causing overload of facility r, Otherwise, | |
| Parameters | Explanation |
| Set of all the nodes in the graph network, | |
| Set of vehicles | |
| Set of collection points , 0 is the depot | |
| Set of disposal facilities | |
| Set of sub-paths | |
| Carried load of vehicle h visit from point i to point j | |
| Maximal load capacity of the vehicle | |
| Waste collection demand of collection point i | |
| Workload limit of disposal facility r | |
| Transportation distance from point i to point j | |
| Fixed costs of per unit vehicle | |
| Cost of per unit fuel consumption | |
| Cost of per unit carbon emission | |
| Fuel consumption rate when vehicle is full-loadConsumption Rate | |
| Fuel consumption rate when vehicle is empty | |
| Conversion factor for carbon dioxide and fuel consumption | |
| Penalty cost of overload disposal facility for per sub-path |
| Part 1 | 1 | 1 | 3 | 2 | 3 | 2 | 1 | 1 | 4 | 2 |
| Part 2 | 3 | 6 | 5 | 1 | 8 | 4 | 2 | 10 | 7 | 9 |
| Part 3 | 11 | 13 | 11 | 12 | ||||||
| Part 4 | 15 |
| Vehicle Routes | |
|---|---|
| 1 | 15-3-6-2-10-11-15 |
| 2 | 15-1-4-9-13-15 |
| 3 | 15-5-8-11-15 |
| 4 | 15-7-12-15 |
| Parameters of the PSO | Values | Parameters of the TS | Values |
|---|---|---|---|
| MaxIt | 1000 | TL | 20 |
| nPop | 50 | NS | |
| wmax | 0.8 | CS | (0.1*) |
| wmin | 0.5 | ||
| 0.2 | |||
| R1, R2 | rand (Varsize) | ||
| C1, C2 | 1.5 | ||
| VarMin | 0 | ||
| VarMax | 1 |
| Instance | Collection Point | Depot | Disposal Facility | Workload Limit | Vehicle | Capacity |
|---|---|---|---|---|---|---|
| p01 | 50 | 1 | 3 | 4 | 16 | 80 |
| p02 | 50 | 1 | 3 | 2 | 8 | 160 |
| p03 | 70 | 1 | 4 | 3 | 15 | 140 |
| p06 | 100 | 1 | 2 | 6 | 18 | 100 |
| p07 | 100 | 1 | 3 | 4 | 16 | 100 |
| p15 | 160 | 1 | 3 | 5 | 20 | 60 |
| Instance | PSO | PSO-TS | Optimization Rate (%) | ||
|---|---|---|---|---|---|
| Number of Sub-Paths | Distance | Number of Sub-Paths | Distance | ||
| p01 | 14 | 1517.24 | 12 | 1175.85 | 22.50% |
| p02 | 6 | 1183.91 | 6 | 904.23 | 23.62% |
| p03 | 13 | 1874.15 | 12 | 1369.59 | 26.92% |
| p06 | 19 | 2940.19 | 18 | 2445.96 | 16.81% |
| p07 | 18 | 2701.45 | 18 | 2196.23 | 18.70% |
| p15 | 18 | 14,376.75 | 17 | 11,528.92 | 19.81% |
| Average | - | - | - | - | 21.39% |
| Disposal Facilities | X Coordinate | Y Coordinate |
|---|---|---|
| 1 | 20 | 20 |
| 2 | 50 | 30 |
| 3 | 60 | 50 |
| 4 | 36 | 16 |
| 5 | 42 | 57 |
| 6 | 8 | 52 |
| Depot | X Coordinate | Y Coordinate | Number of Vehicles | Maximal Weight/t |
|---|---|---|---|---|
| 1 | 30 | 40 | 16 | 80 |
| Collection Points | 1 | 2 | 3 | 4 | 5 | 6 | 7 | 8 | 9 | 10 | 11 | 12 |
| X | 37 | 49 | 52 | 20 | 40 | 21 | 17 | 31 | 52 | 51 | 42 | 31 |
| Y | 52 | 49 | 64 | 26 | 30 | 47 | 63 | 62 | 33 | 21 | 41 | 32 |
| Waste Load/t | 7 | 30 | 16 | 9 | 21 | 15 | 19 | 23 | 11 | 5 | 19 | 29 |
| Collection Points | 13 | 14 | 15 | 16 | 17 | 18 | 19 | 20 | 21 | 22 | 23 | 24 |
| X | 5 | 12 | 52 | 27 | 17 | 13 | 57 | 62 | 16 | 7 | 27 | 30 |
| Y | 25 | 42 | 41 | 23 | 33 | 13 | 58 | 42 | 57 | 38 | 68 | 48 |
| Waste Load/t | 23 | 21 | 15 | 3 | 41 | 9 | 28 | 8 | 16 | 28 | 7 | 15 |
| Collection Points | 25 | 26 | 27 | 28 | 29 | 30 | 31 | 32 | 33 | 34 | 35 | 36 |
| X | 43 | 58 | 58 | 37 | 38 | 46 | 61 | 62 | 63 | 32 | 45 | 59 |
| Y | 67 | 48 | 27 | 69 | 46 | 10 | 33 | 63 | 69 | 22 | 35 | 15 |
| Waste Load/t | 14 | 6 | 19 | 11 | 12 | 23 | 26 | 17 | 6 | 9 | 15 | 14 |
| Collection Points | 37 | 38 | 39 | 40 | 41 | 42 | 43 | 44 | 45 | 46 | 47 | |
| X | 5 | 10 | 21 | 5 | 30 | 39 | 32 | 25 | 25 | 48 | 56 | |
| Y | 6 | 17 | 10 | 64 | 15 | 10 | 39 | 32 | 55 | 28 | 37 | |
| Waste Load/t | 7 | 27 | 13 | 11 | 16 | 10 | 5 | 25 | 17 | 18 | 10 |
| Day | Upper Limits for the Number of Sub-Paths | |||||
| Monday | 2 | 2 | 2 | 2 | 2 | 2 |
| Tuesday | 2 | 2 | 2 | 2 | 2 | 2 |
| Wednesday | 3 | 3 | 3 | 3 | 3 | 3 |
| Thursday | 3 | 3 | 3 | 3 | 3 | 3 |
| Friday | 4 | 4 | 4 | 4 | 4 | 4 |
| Parameters | Values |
|---|---|
| 300 CNY (Chinese Yuan) | |
| 7 CNY/L | |
| 0.64 CNY/kg | |
| 0.377 L/km | |
| 0.165 L/km | |
| 2.32 kg/L | |
| 150 CNY |
| Day | Sub-Paths | Distance (km) | Carbon Emissions (kg) | Operational Costs (CNY) | Sub-Path Assignments of Disposal Facilities | SV | |||||
|---|---|---|---|---|---|---|---|---|---|---|---|
| Monday | 12 | 1023.50 | 351.46 | 5608.39 | 3 | 4 | 0 | 1 | 2 | 2 | 2.00 |
| Tuesday | 13 | 1039.31 | 364.43 | 5982.53 | 4 | 3 | 0 | 1 | 4 | 1 | 2.97 |
| Wednesday | 15 | 1105.62 | 371.89 | 6625.14 | 4 | 4 | 0 | 2 | 3 | 2 | 2.30 |
| Thursday | 18 | 1222.04 | 421.18 | 7206.82 | 4 | 5 | 0 | 2 | 3 | 4 | 3.20 |
| Friday | 21 | 1290.33 | 425.17 | 7229.59 | 5 | 5 | 2 | 1 | 4 | 4 | 2.70 |
| Week | 79 | 5680.80 | 1934.13 | 32,652.48 | 20 | 21 | 2 | 7 | 16 | 13 | 55.77 |
| Day | Sub-Paths | Distance (km) | Carbon Emissions (kg) | Operational Costs (CNY) | Sub-Path Assignments of Disposal Facilities | SV | |||||
|---|---|---|---|---|---|---|---|---|---|---|---|
| Monday | 12 | 1136.56 | 398.41 | 5876.69 | 2 | 2 | 2 | 2 | 2 | 2 | 0.00 |
| Tuesday | 13 | 1118.65 | 398.53 | 6177.38 | 2 | 3 | 2 | 2 | 2 | 2 | 0.17 |
| Wednesday | 15 | 1207.62 | 418.57 | 6891.89 | 3 | 3 | 1 | 2 | 3 | 3 | 0.70 |
| Thursday | 18 | 1354.04 | 474.80 | 7513.22 | 3 | 3 | 3 | 3 | 3 | 3 | 0.00 |
| Friday | 21 | 1368.75 | 453.50 | 7391.49 | 4 | 4 | 3 | 2 | 4 | 4 | 0.70 |
| Week | 79 | 6185.62 | 2143.81 | 33,850.68 | 14 | 15 | 11 | 11 | 14 | 14 | 2.97 |
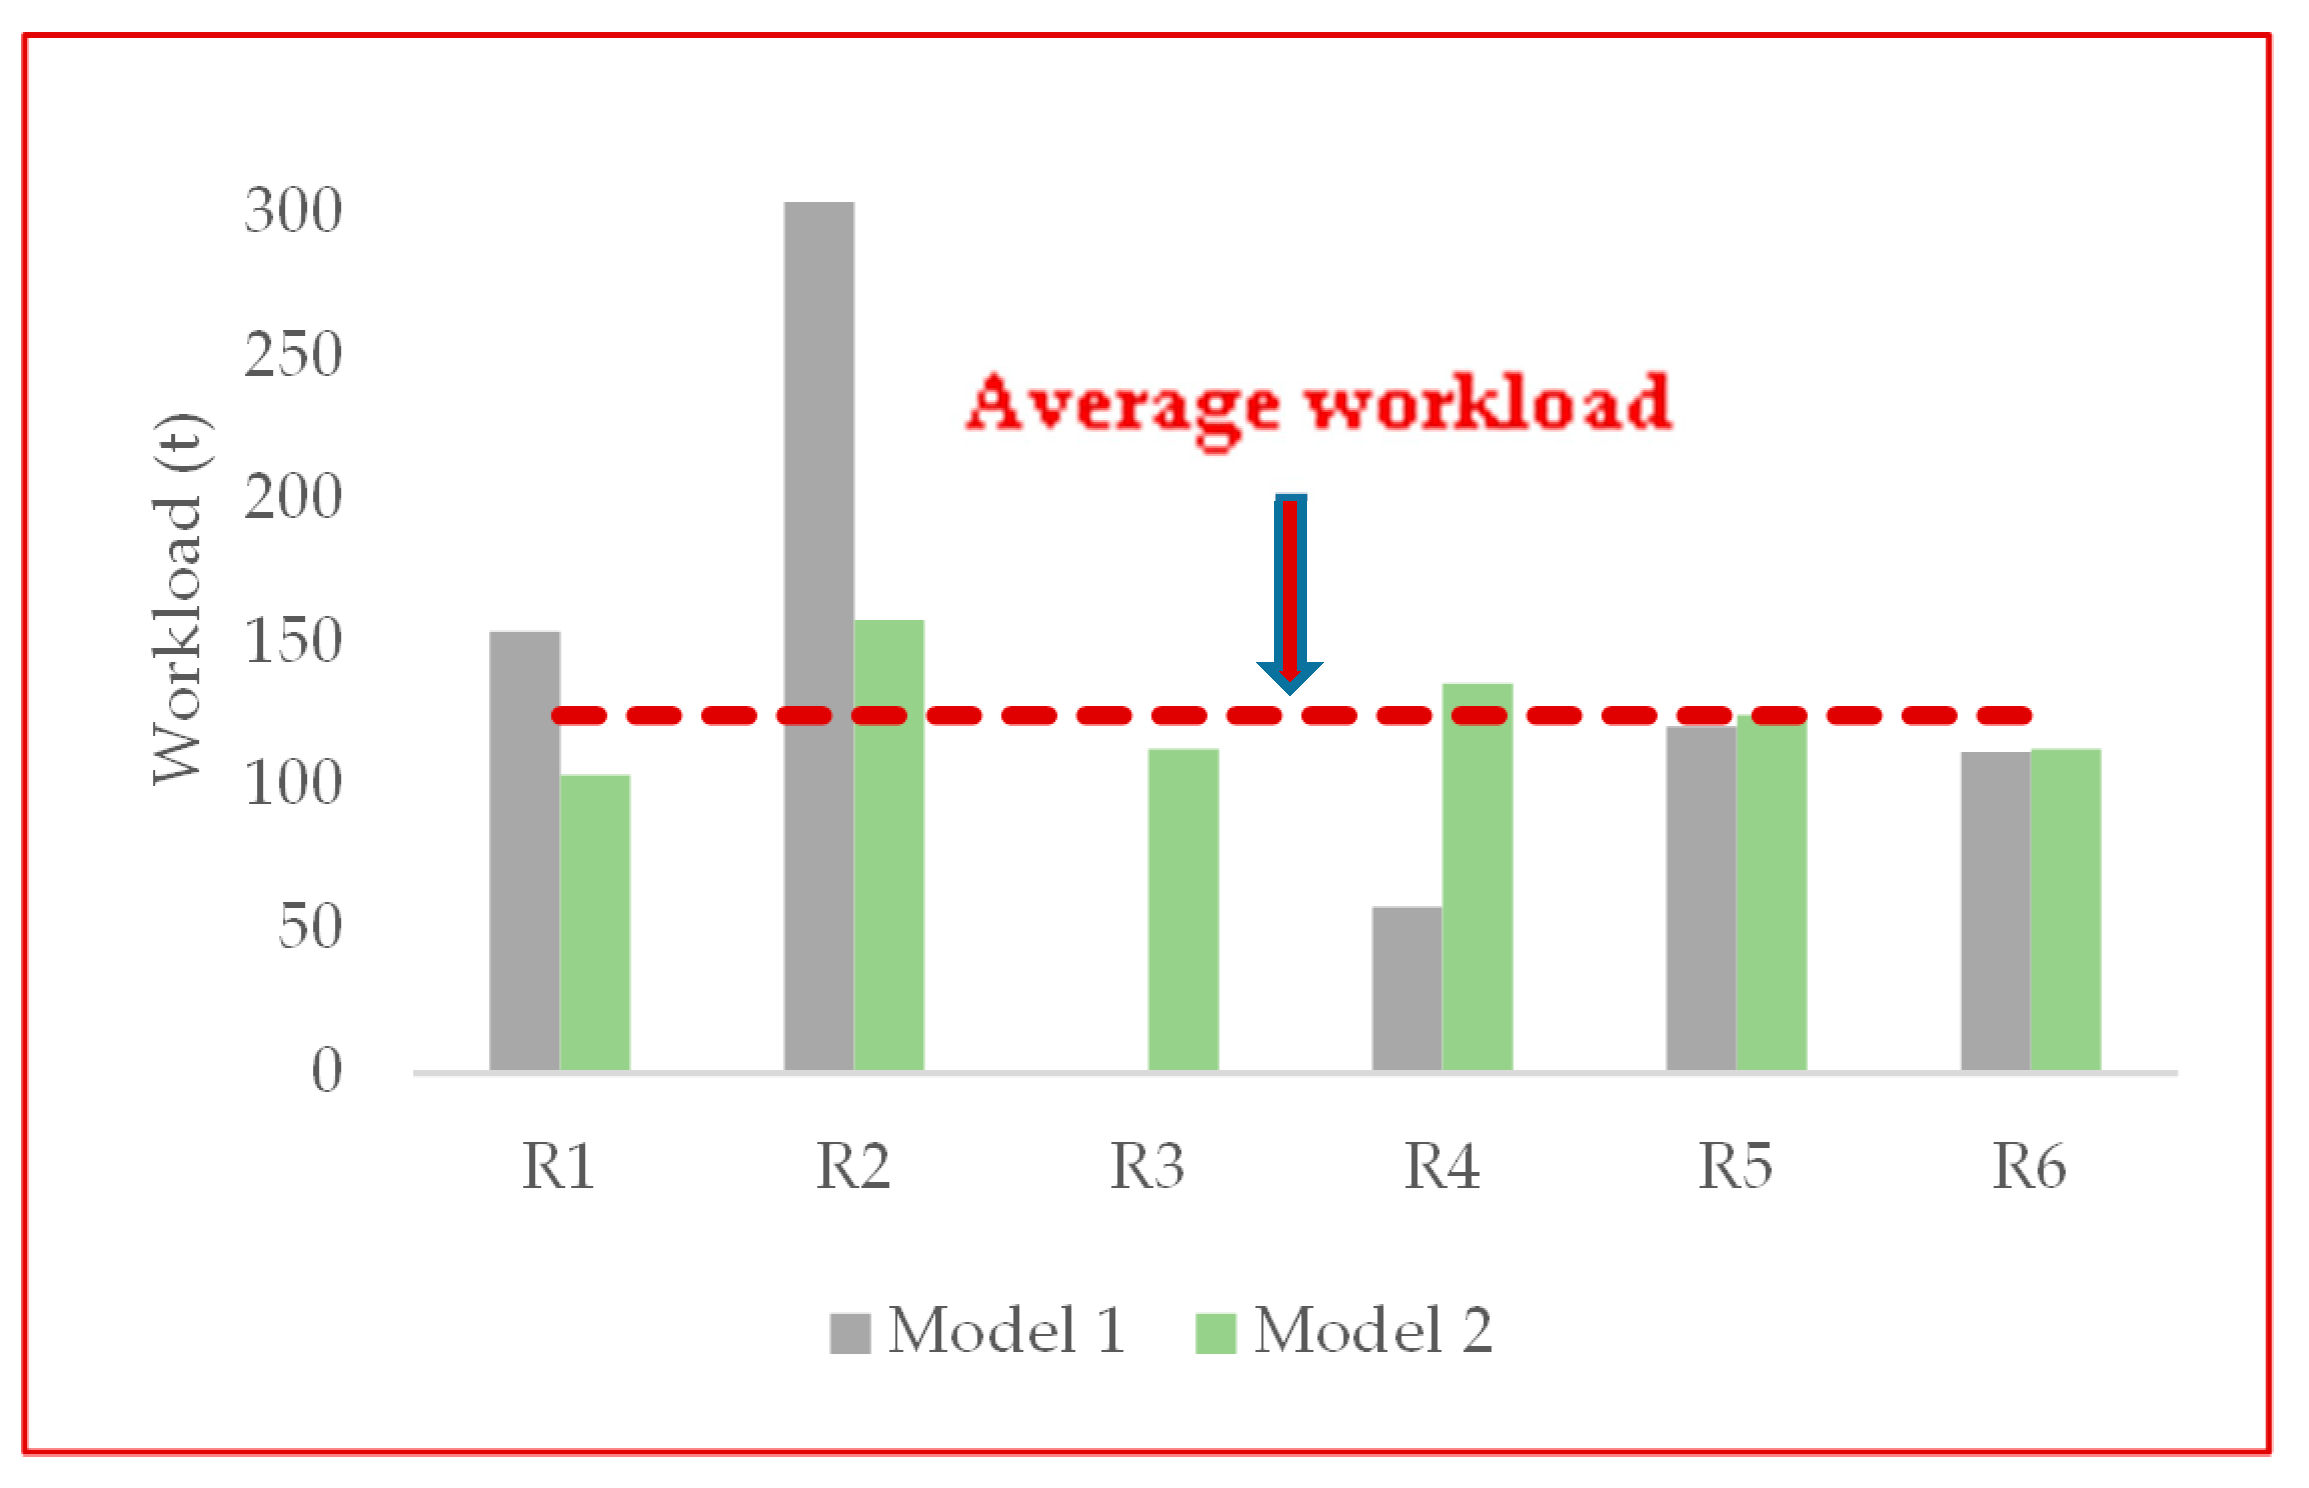
| Model | Detailed Route Assignments of Disposal Facilities on Monday | |||||
|---|---|---|---|---|---|---|
| Model 1 | 6-17-4- 42-39-37-18- 13-38- | 33-32-20-31-9- 16-34-12-5-46- 3-19-47-27-10- 44-41-30-36- | -- | 43-35-11-29-1- | 15-26-25-28-23-8- 24-2- | 22-14- 45-21-7-40- |
| Workload/t | 154 | 304 | 0 | 58 | 121 | 112 |
| Model 2 | 6-17-4- 42-39-37-18- | 16-34-12-5-46- 3-19-47-27-10- | 33-32-20-31-9- 24-2- | 43-35-11-29-1- 44-41-30-36- | 15-26-25-28-23-8- 22-14- | 13-38- 45-21-7-40- |
| Workload/t | 104 | 158 | 113 | 136 | 125 | 113 |
© 2020 by the authors. Licensee MDPI, Basel, Switzerland. This article is an open access article distributed under the terms and conditions of the Creative Commons Attribution (CC BY) license (http://creativecommons.org/licenses/by/4.0/).
Share and Cite
Qiao, Q.; Tao, F.; Wu, H.; Yu, X.; Zhang, M. Optimization of a Capacitated Vehicle Routing Problem for Sustainable Municipal Solid Waste Collection Management Using the PSO-TS Algorithm. Int. J. Environ. Res. Public Health 2020, 17, 2163. https://0-doi-org.brum.beds.ac.uk/10.3390/ijerph17062163
Qiao Q, Tao F, Wu H, Yu X, Zhang M. Optimization of a Capacitated Vehicle Routing Problem for Sustainable Municipal Solid Waste Collection Management Using the PSO-TS Algorithm. International Journal of Environmental Research and Public Health. 2020; 17(6):2163. https://0-doi-org.brum.beds.ac.uk/10.3390/ijerph17062163
Chicago/Turabian StyleQiao, Qingqing, Fengming Tao, Hailin Wu, Xuewei Yu, and Mengjun Zhang. 2020. "Optimization of a Capacitated Vehicle Routing Problem for Sustainable Municipal Solid Waste Collection Management Using the PSO-TS Algorithm" International Journal of Environmental Research and Public Health 17, no. 6: 2163. https://0-doi-org.brum.beds.ac.uk/10.3390/ijerph17062163