Who Benefits from An Intervention Program on Foundational Skills for Handwriting Addressed to Kindergarten Children and First Graders?

 , and
, and
Abstract
:1. Introduction
1.1. Handwriting and Academic Success
1.2. Intervention Programs Duration and Gender Differences
1.3. Research Aims and Questions
- (1)
- Did kindergarteners and first graders improve their visual-motor integration ability and their manual dexterity over time in the course of the intervention when mean scores of the Visual-Motor Integration Test (VMI) and Movement Assessment Battery for Children-2 (MABC-2) assessed at T1, T2 and T3 were compared? We expected that the intervention would impact fine motor skills and visual-motor integration abilities of children during the 10-wk training, improving their performances from T1 to T2. No assumptions were formulated about skills’ stability at the follow-up assessment (T3).
- (2)
- Did students at risk of movement difficulty at the baseline in manual dexterity scores make remarkable progress and demonstrate significantly different rates of improvements compared to not at-risk peers along the timepoint assessments? With respect to this issue, we do not formulate any precise hypotheses, because we still do not know if stimulation training in a classroom setting might be as effective as individual therapy.
- (3)
- Do male and female children react to the intervention differently over time? Based on previous research studies in which girls seem to perform better than boys in fine motor skills and boys being advantaged in visual-spatial tasks compared to girls, we expected that females will improve on manual dexterity scores, while males would perform better on visual-perceptual abilities.
2. Materials and Methods
2.1. Participants
2.2. Procedure and Research Design
2.3. Intervention
2.4. Measures
2.5. Statistical Analysis Plan
3. Results
3.1. Effects of the Intervention on Visual-Motor Integration and Fine Motor Skills over Time
3.2. Effects of the Intervention on different Risk Band Children
3.3. Effects of Gender on Visual-Motor Integration and Fine Motor Skills
4. Discussion
5. Conclusions
Author Contributions
Funding
Acknowledgments
Conflicts of Interest
References
- Lam, S.S.T.; Au, R.K.C.; Leung, H.W.H.; Li-Tsang, C.W.P. Chinese handwriting performance of primary school children with dyslexia. Res. Dev. Disabil. 2011, 32, 1745–1756. [Google Scholar] [CrossRef]
- McHale, K.; Cermak, S.A. Fine Motor Activities in Elementary School: Preliminary Findings and Provisional Implications for Children With Fine Motor Problems. Am J Occup Ther. 1992, 46, 898–903. [Google Scholar] [CrossRef] [Green Version]
- Tseng, M.H.; Chow, S.M.K. Perceptual-Motor Function of School-Age Children With Slow Handwriting Speed. Am. J. Occ. Ther. 2000, 54, 83–88. [Google Scholar] [CrossRef] [PubMed] [Green Version]
- Marr, D.; Windsor, M.M.; Cermak, S. Handwriting Readiness: Locatives and Visuomotor Skills in the Kindergarten Year. Early Child. Res. Pract. Internet J. Dev. Careeduc. Young Child. 2001, 3, 1–16. [Google Scholar]
- Smits-Engelsman, B.C.; Niemeijer, A.S.; van Galen, G.P. Fine motor deficiencies in children diagnosed as DCD based on poor grapho-motor ability. Hum Mov. Sci. 2001, 20, 161–182. [Google Scholar] [CrossRef]
- Graham, S.; Harris, K.R.; Herbert, M. It is more than just the message: Presentation effects in scoring writing. Focus Except. Child. 2011, 44, 1–12. [Google Scholar] [CrossRef]
- Graham, S.; Harris, K.; Fink, B. Is handwriting causally related to learning to write? Treatment of handwriting problems in beginning writers. J. Educ. Psychol. 2000, 92, 620–633. [Google Scholar] [CrossRef]
- Schneck, C.; Amudson, S. Prewriting and handwriting skills. In Occupational Therapy for Children, 6th ed.; Mosby: St. Louis, MO, USA, 2010; pp. 555–580. [Google Scholar]
- Taverna, L.; Tremolada, M.; Sabattini, F. Drawing and Writing. Learning of Graphical Representational Systems in Early Childhood. In Proceedings of the 2nd International and Interdisciplinary Conference on Image and Imagination; Cicalò, E., Ed.; Advances in Intelligent Systems and Computing book series (AISC); Springer Nature: Berlin/Heidelberg, Germany, 2020; pp. 216–229. [Google Scholar]
- Berninger, V.W. Coordinating Transcription and Text Generation in Working Memory during Composing: Automatic and Constructive Processes. Learn. Disabil. Q. 1999, 22, 99–112. [Google Scholar] [CrossRef]
- Moore, R.L.; Rust, J.O. Printing errors in the prediction of academic performance. J. of Sch. Psychol. 1989, 27, 297–300. [Google Scholar] [CrossRef]
- Holopainen, L.; Kofler, D.; Koch, A.; Hakkarainen, A.; Bauer, K.; Taverna, L. Ci sono differenti predittori della lettura nelle lingue che hanno un’ortografia trasparente? Evidenze da uno studio longitudinale. J. Educ. Cult. Psychol. Stud. 2020, 21, 1–22. [Google Scholar]
- Jones, D.; Christensen, C.A. Relationship between automaticity in handwriting and students’ ability to generate written text. J. Educ. Psychol. 1999, 91, 44–49. [Google Scholar] [CrossRef]
- Tröster, H.; Flender, J.; Reineke, D. Predictive validity of the Dortmunder Entwicklungsscreening für den Kindergarten (DESK 3-6). Diagnostica 2011, 57, 201–211. [Google Scholar] [CrossRef]
- Vellutino, F.R.; Scanlon, D.M.; Small, S.; Fanuele, D.P. Response to intervention as a vehicle for distinguishing between children with and without reading disabilities: Evidence for the role of kindergarten and first-grade interventions. J. Learn Disabil. 2006, 39, 157–169. [Google Scholar] [CrossRef] [PubMed]
- Speece, D.L.; Schatschneider, C.; Silverman, R.; Case, L.P.; Cooper, D.H.; Jacobs, D.M. Identification of Reading Problems in First Grade within a Response-To-Intervention Framework. Elem. Sch. J. 2011, 111, 585–607. [Google Scholar] [CrossRef] [PubMed]
- Goldstein, J.; McCoach, D.B.; Yu, H. The Predictive Validity of Kindergarten Readiness Judgments: Lessons from One State. J. Educ. Res. 2017, 110, 50–60. [Google Scholar] [CrossRef]
- Cornhill, H. Factors that relate to good and poor handwriting. Am. J. Occup. Ther. 1996, 50, 732–739. [Google Scholar] [CrossRef] [Green Version]
- Cameron, C.E.; Brock, L.L.; Hatfield, B.E.; Cottone, E.A.; Rubinstein, E.; LoCasale-Crouch, J. Visuomotor integration and inhibitory control compensate for each other in school readiness. Dev. Psychol. 2015, 51, 1529–1543. [Google Scholar] [CrossRef]
- Cameron, C.E.; Cottone, E.A.; Murrah, W.M.; Grissmer, D.W. How Are Motor Skills Linked to Children’s School Performance and Academic Achievement? Child Dev. Perspect. 2016, 10, 93–98. [Google Scholar] [CrossRef]
- Maeland, A.F. Handwriting and Perceptual-Motor Skills in Clumsy, Dysgraphic, and ‘Normal’ Children. Percept. Mot. Skills 1992, 75 (Suppl. 3), 1207–1217. [Google Scholar]
- Tseng, M.H.; Murray, E.A. Differences in Perceptual-Motor Measures in Children with Good and Poor Handwriting. Occup. Ther. J. Res. 1994, 14, 19–36. [Google Scholar] [CrossRef]
- Volman, M.J.M.; van Schendel, B.M.; Jongmans, M.J. Handwriting difficulties in primary school children: A search for underlying mechanisms. Am. J. Occup. Ther. 2006, 60, 451–460. [Google Scholar] [CrossRef] [PubMed] [Green Version]
- Weil, M.J.; Amundson, S.J. Relationship between visuomotor and handwriting skills of children in kindergarten. Am. J. Occup. Ther. 1994, 48, 982–998. [Google Scholar] [CrossRef] [Green Version]
- Cameron, C.E.; Brock, L.L.; Murrah, W.M.; Bell, L.H.; Worzalla, S.L.; Grissmer, D. Fine motor skills and executive function both contribute to kindergarten achievement. Child Dev. 2012, 83, 1229–1244. [Google Scholar] [CrossRef] [Green Version]
- Becker, D.R.; Miao, A.; Duncan, R.; McClelland, M.M. Behavioral self-regulation and executive function both predict visuomotor skills and early academic achievement. Early Child. Res. Q. 2014, 29, 411–424. [Google Scholar] [CrossRef]
- Kulp, T.M. Relationship between visual motor integration skill and academic performance in kindergarten through third grade. Optom. Vis. Sci. 1999, 76, 159–163. [Google Scholar] [CrossRef]
- McPhillips, M.; Jordan-Black, J.A. The effect of social disadvantage on motor development in young children: A comparative study. J. Child. Psychol. Psychiatry 2007, 48, 1214–1222. [Google Scholar] [CrossRef] [PubMed]
- Tremolada, M.; Taverna, L.; Bonichini, S. Which factors influence attentional functions? Attention assessed by KITAP in 105 6-to-10-year-old children. Behav. Sci. 2019, 9, 7. [Google Scholar] [CrossRef] [PubMed] [Green Version]
- Feder, K.P.; Majnemer, A. Handwriting development, competency, and intervention. Dev. Med. Child. Neurol. 2007, 49, 312–317. [Google Scholar] [CrossRef] [PubMed]
- Hillier, S. Intervention for Children with Developmental Coordination Disorder: A Systematic Review. Internet J. Allied Health Sci. Pract. 2007, 5, 1–11. [Google Scholar]
- Zwicker, J.G.; Harris, S.R. A reflection on motor learning theory in pediatric occupational therapy practice. Can. J. Occup. Ther. 2009, 76, 29–37. [Google Scholar] [CrossRef]
- Brock, L.L.; Murrah, W.M.; Cottone, E.A.; Mashburn, A.J.; Grissmer, D.W. An after-school intervention targeting executive function and visuospatial skills also improves classroom behavior. Int. J. Behav. Dev. 2018, 42, 474–484. [Google Scholar] [CrossRef]
- Case-Smith, J. Effectiveness of School-Based Occupational Therapy Intervention on Handwriting. Am. J. Occup. Ther. 2002, 56, 17–25. [Google Scholar] [CrossRef] [PubMed] [Green Version]
- Parush, S.; Hahn-Markowitz, J. A Comparison of Two Settings for Group Treatment in Promoting Perceptual-Motor Function of Learning Disabled Children. Phys. Occup. Ther. Pediatrics 1997, 17, 45–57. [Google Scholar] [CrossRef]
- Case-Smith, J. Fine Motor Outcomes in Preschool Children Who Receive Occupational Therapy Services. Am. J. Occup. Ther. 1996, 50, 52–61. [Google Scholar] [CrossRef] [PubMed] [Green Version]
- Ohl, A.M.; Graze, H.; Weber, K.; Kenny, S.; Salvatore, C.; Wagreich, S. Effectiveness of a 10-Week Tier-1 Response to Intervention Program in Improving Fine Motor and Visual-Motor Skills in General Education Kindergarten Students. Am. J. Occup. Ther. 2013, 67, 507–514. [Google Scholar] [CrossRef] [PubMed] [Green Version]
- Lust, C.A.; Donica, D.K. Effectiveness of a Handwriting Readiness Program in Head Start: A Two-Group Controlled Trial. Am. J. Occup. Ther. 2011, 65, 560–568. [Google Scholar] [CrossRef] [Green Version]
- Ratzon, N.Z.; Efraim, D.; Bart, O. A short-term graphomotor program for improving writing readiness skills of first-grade students. Am. J. Occup. Ther. 2007, 61, 399–405. [Google Scholar] [CrossRef] [Green Version]
- Jordan, G.; Michaud, F.; Kaiser, M.L. Effectiveness of an intensive handwriting program for first grade students using the application LetterSchool: A pilot study. J. Occup. Ther. Sch. Early Interv. 2016, 9, 176–184. [Google Scholar] [CrossRef]
- Taverna, L.; Bellavere, M.; Tremolada, M.; Santinelli, L.; Biffi, A.; Putti, M.C. Psycho-educational play supports occupational activity in ALL children during hospitalization. Effects on children’s fine motor skills, HRQOL, parents’ perception of the child. Int. J. Psychosoc. Rehabil. 2019, 23, 1–27. [Google Scholar]
- Taverna, L.; Tremolada, M.; Bonichini, S.; Tosetto, B.; Basso, G.; Messina, C. Motor skill delays in pre-school children with leukemia one year after treatment: Hematopoietic stem cell transplantation therapy as an important risk factor. PLoS ONE 2017, 12, e0186787. [Google Scholar] [CrossRef] [Green Version]
- Gelati, C. Female superiority and gender similarity effects and interest factors in writing. In Past, Present, and Future Contributions of Cognitive Writing Research to Cognitive Psychology; Taylor & Francis: New York, NY, USA, 2012; pp. 153–174. [Google Scholar]
- Adams, A.M.; Simmons, F.R. Exploring individual and gender differences in early writing performance. Read Writ 2019, 32, 235–263. [Google Scholar] [CrossRef] [Green Version]
- Persky, H.R.; Dane, M.C.; Jin, Y. The Nation’s report card: Writing 2002 (NCES 2003-529); National Center for Education Statistics: Washington, DC, USA, 2003.
- Salahu-Din, D.; Persky, H.R.; Miller, J. The Nation’s Report Card: Writing; U.S. Department of Education: Washington, DC, USA, 2008.
- Pargulski, J.R.; Reynolds, M.R. Sex differences in achievement: Distributions matter. Personal. Individ. Differ. 2017, 104, 272–278. [Google Scholar] [CrossRef]
- Malecki, C.K.; Jewell, J. Developmental, gender, and practical considerations in scoring curriculum-based measurement writing probes. Psychol. Sch. 2003, 40, 379–390. [Google Scholar] [CrossRef]
- Matarma, T.; Lagström, H.; Löyttyniemi, E.; Koski, P. Motor Skills of 5-Year-Old Children: Gender Differences and Activity and Family Correlates. Percept. Mot. Ski. 2020, 127, 367–385. [Google Scholar] [CrossRef] [PubMed]
- Venetsanou, F.; Kambas, A. Motor Proficiency in Young Children: A Closer Look at Potential Gender Differences. SAGE Open 2016, 6. [Google Scholar] [CrossRef] [Green Version]
- Morley, D.; Till, K.; Ogilvie, P.; Turner, G. Influences of gender and socioeconomic status on the motor proficiency of children in the UK. Hum. Mov. Sci. 2015, 44, 150–156. [Google Scholar] [CrossRef]
- Casey, M.B.; Nuttall, R.; Pezaris, E.; Benbow, C.P. The influence of spatial ability on gender differences in mathematics college entrance test scores across diverse samples. Dev. Psychol. 1995, 31, 697–705. [Google Scholar] [CrossRef]
- Jansen, P.; Schmelter, A.; Quaiser-Pohl, C.; Neuburger, S.; Heil, M. Mental rotation performance in primary school age children: Are there gender differences in chronometric tests? Cogn. Dev. 2013, 28, 51–62. [Google Scholar] [CrossRef]
- Lauer, J.E.; Udelson, H.B.; Jeon, S.O.; Lourenco, S.F. An early sex difference in the relation between mental rotation and object preference. Front. Psychol. 2015, 6, 558. [Google Scholar] [CrossRef] [Green Version]
- Levine, S.C.; Huttenlocher, J.; Taylor, A.; Langrock, A. Early sex differences in spatial skill. Dev. Psychol. 1999, 35, 940–949. [Google Scholar] [CrossRef]
- Lippa, R.A.; Collaer, M.L.; Peters, M. Sex differences in mental rotation and line angle judgments are positively associated with gender equality and economic development across 53 nations. Arch. Sex. Behav. 2010, 39, 990–997. [Google Scholar] [CrossRef] [PubMed]
- Voyer, D.; Voyer, S.; Bryden, M.P. Magnitude of sex differences in spatial abilities: A meta-analysis and consideration of critical variables. Psychol. Bull. 1995, 117, 250–270. [Google Scholar] [CrossRef] [PubMed]
- Shea, D.L.; Lubinski, D.; Benbow, C.P. Importance of assessing spatial ability in intellectually talented young adolescents: A 20-year longitudinal study. J. Educ. Psychol. 2001, 93, 604–614. [Google Scholar] [CrossRef]
- Sugden, D.A.; Chambers, M.E. Intervention in children with Developmental Coordination Disorder: The role of parents and teachers. Br. J. of Educ. Psychol. 2003, 73, 545–561. [Google Scholar] [CrossRef]
- Beery, K.E.; Beery, N.A. The Beery-Buktenica Developmental Test of Visual-Motor Integration (Beery VMI) with Supplemental Developmental Tests of Visual Perception and Motor Coordination and Stepping Stones Age Norms: Administration, Scoring and Teaching Manual, 6th ed.; NCS Pearson: Minneapolis, MN, USA, 2010. [Google Scholar]
- Henderson, S.E.; Sugden, D.A.; Barnett, A.L. Movement Assessment Battery for Children, 2nd ed.; Pearson Psychological Corporation: London, UK, 2007. [Google Scholar]
- Beery, K.E.; Beery, N.A. The Beery-Buktenica Developmental Test of Visual-Motor Integration (Berry VMI) with Supplemental Developmental Tests of Visual Perception and Motor Coordination: Administration, Scoring and Teaching Manual; NCS Pearson: Minneapolis, MN, USA, 2004. [Google Scholar]
- Chinner, A.; Brown, T.; Stagnitti, K. The Reliability of Two Visual Motor Integration Tests Used with Children. J. Occup. Ther. Sch. Early Interv. 2011, 4, 129–140. [Google Scholar] [CrossRef] [Green Version]
- Biancotto, M.; Hirnstein, M.; Pelamatti, G.M.; Santamaria, T.; Zoia, S. Movement Assessment Battery for Children Second Edition Standardizzazione Italiana; Giunti OS: Firenze, Italy, 2016. [Google Scholar]
- Greenhouse, S.W.; Geisser, S. On methods in the analysis of profile data. Psychometrika 1959, 24, 95–112. [Google Scholar] [CrossRef]
- Maldarelli, J.E.; Kahrs, B.A.; Hunt, S.C.; Lockman, J.J. Development of early handwriting: Visual-motor control during letter copying. Dev. Psychol. 2015, 51, 879–888. [Google Scholar] [CrossRef]
- Psotta, R.; Brom, O. Factorial Structure of the Movement Assessment Battery for Children Test—Second Edition in Preschool Children. Percept. Mot. Ski. 2016, 123, 702–716. [Google Scholar] [CrossRef]
- Eddy, L.H.; Wood, M.L.; Shire, K.A.; Bingham, D.D.; Bonnick, E.; Creaser, A. A systematic review of randomized and case-controlled trials investigating the effectiveness of school-based motor skill interventions in 3- to 12-year-old children. Child Care Health Dev. 2019, 45, 773–790. [Google Scholar] [CrossRef]
- Santangelo, T.; Graham, S. A Comprehensive Meta-analysis of Handwriting Instruction. Educ. Psychol. Rev. 2016, 28, 225–265. [Google Scholar] [CrossRef]
- Axford, C.; Joosten, A.V.; Harris, C. iPad applications that required a range of motor skills promoted motor coordination in children commencing primary school. Aust. Occup. Ther. J. 2018, 65, 146–155. [Google Scholar] [CrossRef] [PubMed]
- Marini, A.; Piccolo, B.; Taverna, L.; Berginc, M.; Ozbič, M. The Complex Relation between Executive Functions and Language in Preschoolers with Developmental Language Disorders. Int. J. Environm. Res. Pub. Health 2020, 17, 1772. [Google Scholar] [CrossRef] [PubMed] [Green Version]
- Liu, T.; Hoffmann, C.; Hamilton, M. Motor Skill Performance by Low SES Preschool and Typically Developing Children on the PDMS-2. Early Child. Educ. J. 2017, 45, 53–60. [Google Scholar] [CrossRef]
- Duiser, I.H.F.; van der Kamp, J.; Ledebt, A.; Savelsbergh, G.J.P. Relationship between the quality of children’s handwriting and the Beery Buktenica developmental test of visuomotor integration after one year of writing tuition. Aust. Occup. Ther. J. 2014, 61, 76–82. [Google Scholar] [CrossRef]
- van Hartingsveldt, M.J.; Cup, E.H.C.; Hendriks, J.C.M.; de Vries, L.; de Groot, I.J.M.; Nijhuis-van der Sanden, M.W.G. Predictive validity of kindergarten assessments on handwriting readiness. Res. Dev. Disabil. 2015, 36, 114–124. [Google Scholar] [CrossRef]
- Halpern, D.F.; Eliot, L.; Bigler, R.S.; Fabes, R.A.; Hanish, L.D.; Hyde, J. The Pseudoscience of Single-Sex Schooling. Science 2011, 333, 1706–1707. [Google Scholar] [CrossRef]
- Hirnstein, M.; Hugdahl, K.; Hausmann, M. Cognitive sex differences and hemispheric asymmetry: A critical review of 40 years of research. Laterality 2019, 24, 204–252. [Google Scholar] [CrossRef]


| Kindergarteners (n = 42) | First Graders (n = 13) | Total Sample (n = 55) | ||||
|---|---|---|---|---|---|---|
| n | % | n | % | n | % | |
| Age. year. | ||||||
| 4 | 8 | 19.0 | 8 | 14.5 | ||
| 5 | 33 | 78.6 | 33 | 60.0 | ||
| 6 | 1 | 2.4 | 13 | 100 | 14 | 25.5 |
| Gender | ||||||
| male | 26 | 61.9 | 5 | 38.5 | 31 | 56.4 |
| female | 16 | 38.1 | 8 | 61.5 | 24 | 43.6 |
| Mother’s Educational Level | ||||||
| junior secondary school (0–8 years) | 9 | 24.4 | 4 | 33.3 | 13 | 26.5 |
| high school (9–13 years) | 19 | 51.3 | 5 | 41.6 | 24 | 49 |
| university (14–18 years) | 8 | 21.6 | 3 | 25.1 | 11 | 22.5 |
| post-university (beyond 19 years) | 1 | 2.7 | 1 | 2 | ||
| not reported | 5 | 11.9 | 1 | 7.7 | 6 | 10.9 |
| Father’s Educational Level | ||||||
| junior secondary school (0–8 years) | 10 | 27.8 | 4 | 36.4 | 14 | 29.8 |
| high school (9–13 years) | 20 | 55.5 | 6 | 54.6 | 26 | 55.3 |
| university (14–18 years) | 5 | 13.9 | 1 | 9 | 6 | 12.8 |
| post-university (beyond 19 Medical School for Health Professions Claudiana.) | 1 | 2.8 | 1 | 2.1 | ||
| not reported | 6 | 14.3 | 2 | 15.4 | 8 | 14.5 |
| Employment Mother | ||||||
| housewife | 13 | 31.0 | 4 | 30.8 | 17 | 30.9 |
| process worker | 12 | 28.6 | 3 | 23.1 | 15 | 27.3 |
| office worker | 10 | 23.8 | 5 | 38.5 | 15 | 27.3 |
| professional | ||||||
| not reported | 7 | 16.7 | 1 | 7.7 | 8 | 14.5 |
| Employment Father | ||||||
| unemployed | 2 | 4.8 | 2 | 3.6 | ||
| process worker | 18 | 42.9 | 8 | 61.5 | 26 | 47.3 |
| office worker | 14 | 33.3 | 4 | 30.8 | 18 | 32.7 |
| professional | 3 | 7.1 | 3 | 5.5 | ||
| not reported | 5 | 11.9 | 1 | 7.7 | 6 | 10.9 |
| Home situation | ||||||
| rent flat | 14 | 33.3 | 5 | 38.5 | 19 | 34.5 |
| own flat | 15 | 35.7 | 6 | 46.2 | 21 | 38.2 |
| rent house | 2 | 4.8 | 1 | 7.7 | 3 | 5.5 |
| own house | 2 | 4.8 | 2 | 3.6 | ||
| other | 3 | 7.1 | 3 | 5.5 | ||
| not reported | 6 | 14.3 | 1 | 7.7 | 7 | 12.7 |
| Number of siblings | ||||||
| no sibling | 7 | 16.7 | 3 | 23.1 | 10 | 18.2 |
| 1 sibling | 21 | 50.0 | 5 | 38.5 | 26 | 47.3 |
| 2 siblings | 7 | 16.7 | 2 | 15.4 | 9 | 16.4 |
| ≥3 siblings | 1 | 2.4 | 2 | 15.4 | 3 | 5.4 |
| not reported | 6 | 14.3 | 1 | 7.7 | 7 | 12.7 |
| Mother’s age (Mean; SD) | 36.0 | 5.35 | 39.42 | 4.87 | 36.84 | 5.40 |
| Father’s age (Mean; SD) | 39.76 | 6.39 | 42.50 | 5.83 | 40.43 | 6.31 |
| Kindergarteners (n = 42) | First Graders (n = 13) | ||||
|---|---|---|---|---|---|
| M (SD) | Range | M (SD) | Range | ||
| Pre-Intervention | VMI (max. = 27) | ||||
| Visual-Motor Integration | 11.37 (1.97) | 8–17 | 14.77 (2.83) | 10–19 | |
| VMI_Visual Perception | 11.69 (3.72) | 1–19 | 16.08 (4.09) | 10–23 | |
| VMI_Motor Coordination | 12.83 (2.76) | 6–19 | 18.08 (3.12) | 9–22 | |
| MABC-2 | |||||
| Manual Dexterity 1 (posting coins) PH | 18.14 (6.62) | 4–30 | 16.62 (1.60) | 14–19 | |
| Manual Dexterity 1 (posting coins) OH | 20.10 (8.82) | 1–40 | 19.23 (2.45) | 15–23 | |
| Manual Dexterity 2 (threading beads) | 47.12 (18.04) | 14–94 | 40.62 (7.71) | 31–57 | |
| Manual Dexterity 3 (drawing trails) | 2.57 (2.52) | 0–9 | 0.62 (1.19) | 0–4 | |
| Post-Intervention | VMI (max. = 27) | ||||
| Visual-Motor Integration | 12.66 (2.49) | 9–19 | 16.46 (2.47) | 12–20 | |
| VMI_Visual Perception | 14.50 (3.58) | 7–23 | 18.00 (3.16) | 13–25 | |
| VMI_Motor Coordination | 12.89 (3.22) | 5–19 | 20.31 (2.86) | 14–25 | |
| MABC-2 | |||||
| Manual Dexterity 1 (posting coins) PH | 18.82 (3.76) | 9–27 | 17.46 (2.53) | 14–22 | |
| Manual Dexterity 1 (posting coins) OH | 21.03 (3.99) | 9–30 | 22.92 (5.88) | 17–37 | |
| Manual Dexterity 2 (threading beads) | 44.36 (7.66) | 28–62 | 35.31 (10.55) | 22–60 | |
| Manual Dexterity 3 (drawing trails) | 1.95 (2.11) | 0–7 | 0.62 (0.65) | 0–2 | |
| Follow-up | VMI (max. = 27) | ||||
| Visual-Motor Integration | 13.10 (2.11) | 9–18 | 16.85 (2.82) | 13–22 | |
| VMI_Visual Perception | 16.40 (2.65) | 11–22 | 20.85 (3.21) | 15–26 | |
| VMI_Motor Coordination | 14.63 (3.15) | 6–20 | 19.85 (2.44) | 14–23 | |
| MABC-2 | |||||
| Manual Dexterity 1 (posting coins) PH | 19.00 (2.62) | 15–27 | 18.54 (4.99) | 13–31 | |
| Manual Dexterity 1 (posting coins) OH | 21.26 (3.21) | 15–30 | 22.00 (6.59) | 15–38 | |
| Manual Dexterity 2 (threading beads) | 46.74 (9.21) | 35–70 | 32.15 (8.27) | 21–51 | |
| Manual Dexterity 3 (drawing trails) | 1.77 (1.61) | 0–6 | 0.31 (0.63) | 0–2 | |
| Pre-Intervention T1 | Post-Intervention T2 | Follow-up T3 | ||||||||||||||||||||
|---|---|---|---|---|---|---|---|---|---|---|---|---|---|---|---|---|---|---|---|---|---|---|
| 1a | 2a | 3a | 4a | 5a | 6a | 7a | 1b | 2b | 3b | 4b | 5b | 6b | 7b | 1c | 2c | 3c | 4c | 5c | 6c | 7c | ||
| Pre-intervention T1 | 1a | - | 0.64 *** | 0.62 *** | −0.37 ** | −0.31 * | −0.43 *** | −0.52 *** | 0.67 *** | 0.47 *** | 0.70 *** | −0.35 ** | −0.19 | −0.47 *** | −0.35 ** | 0.72 *** | 0.55 *** | 0.64 *** | −0.27 | −0.15 | −0.60 *** | −0.28 * |
| 2a | - | 0.59 *** | −0.42 *** | −0.35 ** | −0.48 *** | −0.59 *** | 0.56 *** | 0.44 *** | 0.54 *** | −0.39 ** | −0.19 | −0.44 *** | −0.30 * | 0.56 *** | 0.56 *** | 0.48 *** | −0.16 | −0.03 | −0.30 * | −0.19 | ||
| 3a | - | −0.23 | −0.16 | −0.35 ** | −0.53 *** | 0.64 *** | 0.57 *** | 0.78 *** | −0.35 * | −0.09 | −0.53 *** | −0.44 *** | 0.69 *** | 0.72 *** | 0.73 *** | −0.14 | −0.01 | −0.62 *** | −0.48 *** | |||
| 4a | - | 0.66 *** | 0.72 *** | 0.44 *** | −0.20 | −0.23 | −0.25 | 0.40 ** | 0.27 | 0.21 | 0.27 | −0.19 | −0.25 | −0.28 * | 0.10 | 0.10 | 0.22 | 0.13 | ||||
| 5a | - | 0.61 *** | 0.38 ** | −0.19 | −0.12 | −0.23 | 0.40 ** | 0.44 *** | 0.30 * | 0.17 | −0.20 | −0.12 | −0.26 | 0.03 | 0.07 | 0.16 | −0.03 | |||||
| 6a | - | 0.46 *** | −0.26 | −0.23 | −0.36 ** | 0.29 * | 0.20 | 0.40 ** | 0.27 * | −0.35 ** | −0.28 * | −0.38 ** | 0.16 | 0.19 | 0.42 ** | 0.04 | ||||||
| 7a | - | −0.60 *** | −0.40 ** | −0.61 *** | 0.39 ** | 0.22 | 0.33 * | 0.53 *** | −0.43 *** | −0.53 *** | −0.58 *** | 0.21 | 0.00 | 0.32 * | 0.39 ** | |||||||
| Post−intervention T2 | 1b | - | 0.56 *** | 0.71 *** | −0.26 | −0.15 | −0.42 ** | −0.48 *** | 0.74 *** | 0.64 *** | 0.75 *** | −0.18 | −0.10 | −0.46 *** | −0.40 ** | |||||||
| 2b | - | 0.63 *** | −0.28 * | −0.02 | −0.29 * | −0.18 | 0.50 *** | 0.60 *** | 0.53 *** | −0.21 | −0.09 | −0.49 *** | −0.46 *** | |||||||||
| 3b | - | −0.34 * | −0.07 | −0.43 *** | −0.47 *** | 0.68 *** | 0.62 *** | 0.78 *** | −0.32 * | −0.15 | −0.63 *** | −0.51 *** | ||||||||||
| 4b | - | 0.60 *** | 0.43 *** | 0.18 | −0.37 ** | −0.29 * | −0.29 * | 0.20 | 0.06 | 0.19 | 0.25 | |||||||||||
| 5b | - | 0.11 | −0.00 | −0.14 | −0.13 | −0.09 | 0.37 ** | 0.45 *** | −0.03 | −0.01 | ||||||||||||
| 6b | - | 0.27 * | −0.45 *** | −0.38 ** | −0.47 *** | −0.13 | −0.16 | 0.66 *** | 0.28 * | |||||||||||||
| 7b | - | −0.41 ** | −0.28 * | −0.59 *** | 0.16 | 0.06 | 0.29 * | 0.43 *** | ||||||||||||||
| Follow-up T3 | 1c | − | 0.60 *** | 0.73 *** | −0.11 | −0.03 | −0.57 *** | −0.26 | ||||||||||||||
| 2c | - | 0.66 *** | −0.12 | 0.05 | −0.55 *** | −0.32 * | ||||||||||||||||
| 3c | - | −0.10 | −0.07 | −0.60 *** | −0.41 ** | |||||||||||||||||
| 4c | - | 0.77 *** | 0.18 | 0.29 * | ||||||||||||||||||
| 5c | − | 0.06 | 0.06 | |||||||||||||||||||
| 6c | − | 0.28 * | ||||||||||||||||||||
| 7c | - | |||||||||||||||||||||
| Groups and Scales | Time of Administration | Statistics | ||||||||||
|---|---|---|---|---|---|---|---|---|---|---|---|---|
| Pre-Intervention (T1) | Post-Intervention (T2) | Follow-Up (T3) | F | p | ηp2 | Comparisons | M. Diff. | p | ||||
| M | SD | M | SD | M | SD | |||||||
| Kindergartners’ VMI scores (max. = 27) | ||||||||||||
| Visual-Motor Integration | 11.37 | 1.97 | 12.66 | 2.49 | 13.03 | 2.06 | 12.457 | 0.0001 | 0.252 | T1 vs. T2 | −1.289 | 0.005 |
| T2 vs. T3 | −0.368 | ns | ||||||||||
| T1 vs. T3 | −1.658 | 0.001 | ||||||||||
| Visual Perception | 11.47 | 3.77 | 14.50 | 3.58 | 16.39 | 2.70 | 32.579 | 0.0001 | 0.468 | T1 vs. T2 | −3.026 | 0.001 |
| T2 vs. T3 | −1.895 | 0.003 | ||||||||||
| T1 vs. T3 | −4.921 | 0.001 | ||||||||||
| Motor Coordination | 12.82 | 2.90 | 12.89 | 3.22 | 14.61 | 3.22 | 9.552 | 0.001 | 0.205 | T1 vs. T2 | −0.079 | ns |
| T2 vs. T3 | −1.711 | 0.001 | ||||||||||
| T1 vs. T3 | −1.789 | 0.002 | ||||||||||
| First grades’ VrMI scores (max. = 27) | ||||||||||||
| Visual-Motor Integration | 14.77 | 2.83 | 16.46 | 2.47 | 16.85 | 2.82 | 6.936 | 0.004 | 0.366 | T1 vs. T2 | −1.692 | 0.048 |
| T2 vs. T3 | −0.385 | ns | ||||||||||
| T1 vs. T3 | −2.077 | 0.029 | ||||||||||
| Visual Perception | 16.08 | 4.09 | 18.00 | 3.16 | 20.85 | 3.21 | 10.977 | 0.001 | 0.478 | T1 vs. T2 | −1.923 | ns |
| T2 vs. T3 | −2.846 | 0.012 | ||||||||||
| T1 vs. T3 | −4.769 | 0.003 | ||||||||||
| Motor Coordination | 18.08 | 3.12 | 20.31 | 2.86 | 19.85 | 2.44 | 7.641 | 0.003 | 0.389 | T1 vs. T2 | −2.231 | 0.008 |
| T2 vs. T3 | 0.462 | ns | ||||||||||
| T1 vs. T3 | −1.769 | 0.024 | ||||||||||
| Groups and Scales | Time of Administration | Statistics | ||||||||||
|---|---|---|---|---|---|---|---|---|---|---|---|---|
| Pre-Intervention (T1) | Post-Intervention (T2) | Follow-up (T3) | F | p | ηp2 | Comparisons | M. Diff. | p | ||||
| M | SD | M | SD | M | SD | |||||||
| Kindergartners’ MABC-2 scores | ||||||||||||
| Manual dexterity 1 PH | 17.92 | 6.47 | 18.71 | 3.75 | 19.03 | 2.65 | 0.752 | 0.451 | 0.020 | T1 vs. T2 | −0.789 | ns |
| T2 vs. T3 | −0.316 | ns | ||||||||||
| T1 vs. T3 | −1.105 | ns | ||||||||||
| Manual dexterity 1 OH | 20.00 | 8.90 | 20.95 | 4.02 | 21.32 | 3.23 | 0.652 | 0.471 | 0.017 | T1 vs. T2 | −0.947 | ns |
| T2 vs. T3 | −0.368 | ns | ||||||||||
| T1 vs. T3 | −1.316 | ns | ||||||||||
| Manual dexterity 2 | 47.82 | 18.02 | 44.32 | 7.76 | 46.92 | 9.27 | 1.152 | 0.308 | 0.030 | T1 vs. T2 | 3.500 | ns |
| T2 vs. T3 | −2.605 | ns | ||||||||||
| T1 vs. T3 | 0.895 | ns | ||||||||||
| Manual dexterity 3 | 2.45 | 2.29 | 1.89 | 2.11 | 1.74 | 1.62 | 2.158 | 0.123 | 0.055 | T1 vs. T2 | 0.553 | ns |
| T2 vs. T3 | 0.158 | ns | ||||||||||
| T1 vs. T3 | 0.711 | ns | ||||||||||
| First graders’ MABC-2 scores | ||||||||||||
| Manual dexterity 1 PH | 16.62 | 1.60 | 17.46 | 2.53 | 18.54 | 4.99 | 1.195 | 0.306 | 0.091 | T1 vs. T2 | −0.846 | ns |
| T2 vs. T3 | −1.077 | ns | ||||||||||
| T1 vs. T3 | −1.923 | ns | ||||||||||
| Manual dexterity 1 OH | 19.23 | 2.45 | 22.92 | 5.88 | 22.00 | 6.59 | 2.805 | 0.080 | 0.189 | T1 vs. T2 | −3.692 | ns |
| T2 vs. T3 | −0.923 | ns | ||||||||||
| T1 vs. T3 | −2.769 | ns | ||||||||||
| Manual dexterity 2 | 40.62 | 7.71 | 35.31 | 10.55 | 32.15 | 8.27 | 10.477 | 0.001 | 0.466 | T1 vs. T2 | 5.308 | ns |
| T2 vs. T3 | 3.154 | ns | ||||||||||
| T1 vs. T3 | 8.462 | 0.003 | ||||||||||
| Manual dexterity 3 | 0.62 | 1.19 | 0.62 | 0.65 | 0.31 | 0.63 | 0.513 | 0.605 | 0.041 | T1 vs. T2 | 0.000 | ns |
| T2 vs. T3 | 0.308 | ns | ||||||||||
| T1 vs. T3 | 0.308 | ns | ||||||||||
| Outcome Variables | Factors | Statistics | Comparison | |||||||||||
|---|---|---|---|---|---|---|---|---|---|---|---|---|---|---|
| Risk Band | Intervention | Risk | Intervention | Risk by Intervention | ||||||||||
| M (SD) at T1 | M (SD) at T2 | M (SD) at T3 | F | ηp2 | p | F | ηp2 | p | F | ηp2 | p | |||
| VMI | 10.609 | 0.178 | 0.002 ** | 12.685 | 0.206 | 0.001 *** | 0.142 | 0.003 | 0.868 | T2 > T1 ** | ||||
| At-Risk | 9.78 (1.64) | 11.33 (1.58) | 11.89 (1.83) | T3 > T1 *** | ||||||||||
| Not at-risk | 12.76 (2.54) | 14.12 (2.98) | 14.45 (2.78) | NR > R ** | ||||||||||
| VMI_P | T2 > T1 * | |||||||||||||
| At-Risk | 9.00 (5.09) | 10.89 (2.02) | 14.78 (2.22) | 19.300 | 0.283 | 0.001 *** | 29.087 | 0.372 | 0.001 *** | 1.198 | 0.024 | 0.306 | T3 > T2 *** | |
| Not at-risk | 13.43 (3.72) | 16.36 (3.34) | 18.12 (3.36) | T3 > T1 *** NR > R *** | ||||||||||
| VMI_MC | T3 > T2 ** | |||||||||||||
| At-Risk | 10.56 (2.69) | 9.56 (2.06) | 12.11 (3.29) | 19.561 | 0.285 | 0.001 *** | 7.552 | 0.134 | 0.001 *** | 2.242 | 0.044 | 0.112 | T3 > T1 ** | |
| Not at-risk | 14.93 (3.48) | 15.90 (4.07) | 16.76 (3.40) | NR > R *** | ||||||||||
| MD1_PH | ||||||||||||||
| At-Risk | 24.00 (4.40) | 19.88 (5.13) | 22.13 (2.53) | 20.712 | 0.297 | 0.001 *** | 0.963 | 0.019 | 0.385 | 4.334 | 0.081 | 0.021 ** | R > NR *** | |
| Not at-risk | 16.40 (5.05) | 18.12 (3.11) | 18.30 (3.15) | |||||||||||
| MD1_OH | ||||||||||||||
| At-Risk | 25.88 (11.39) | 22.13 (4.39) | 24.50 (4.03) | 6.583 | 0.118 | 0.013 * | 0.283 | 0.006 | 0.673 | 2.968 | 0.057 | 0.076 | R > NR * | |
| Not at-risk | 18.67 (6.45) | 21.33 (4.65) | 20.93 (4.12) | |||||||||||
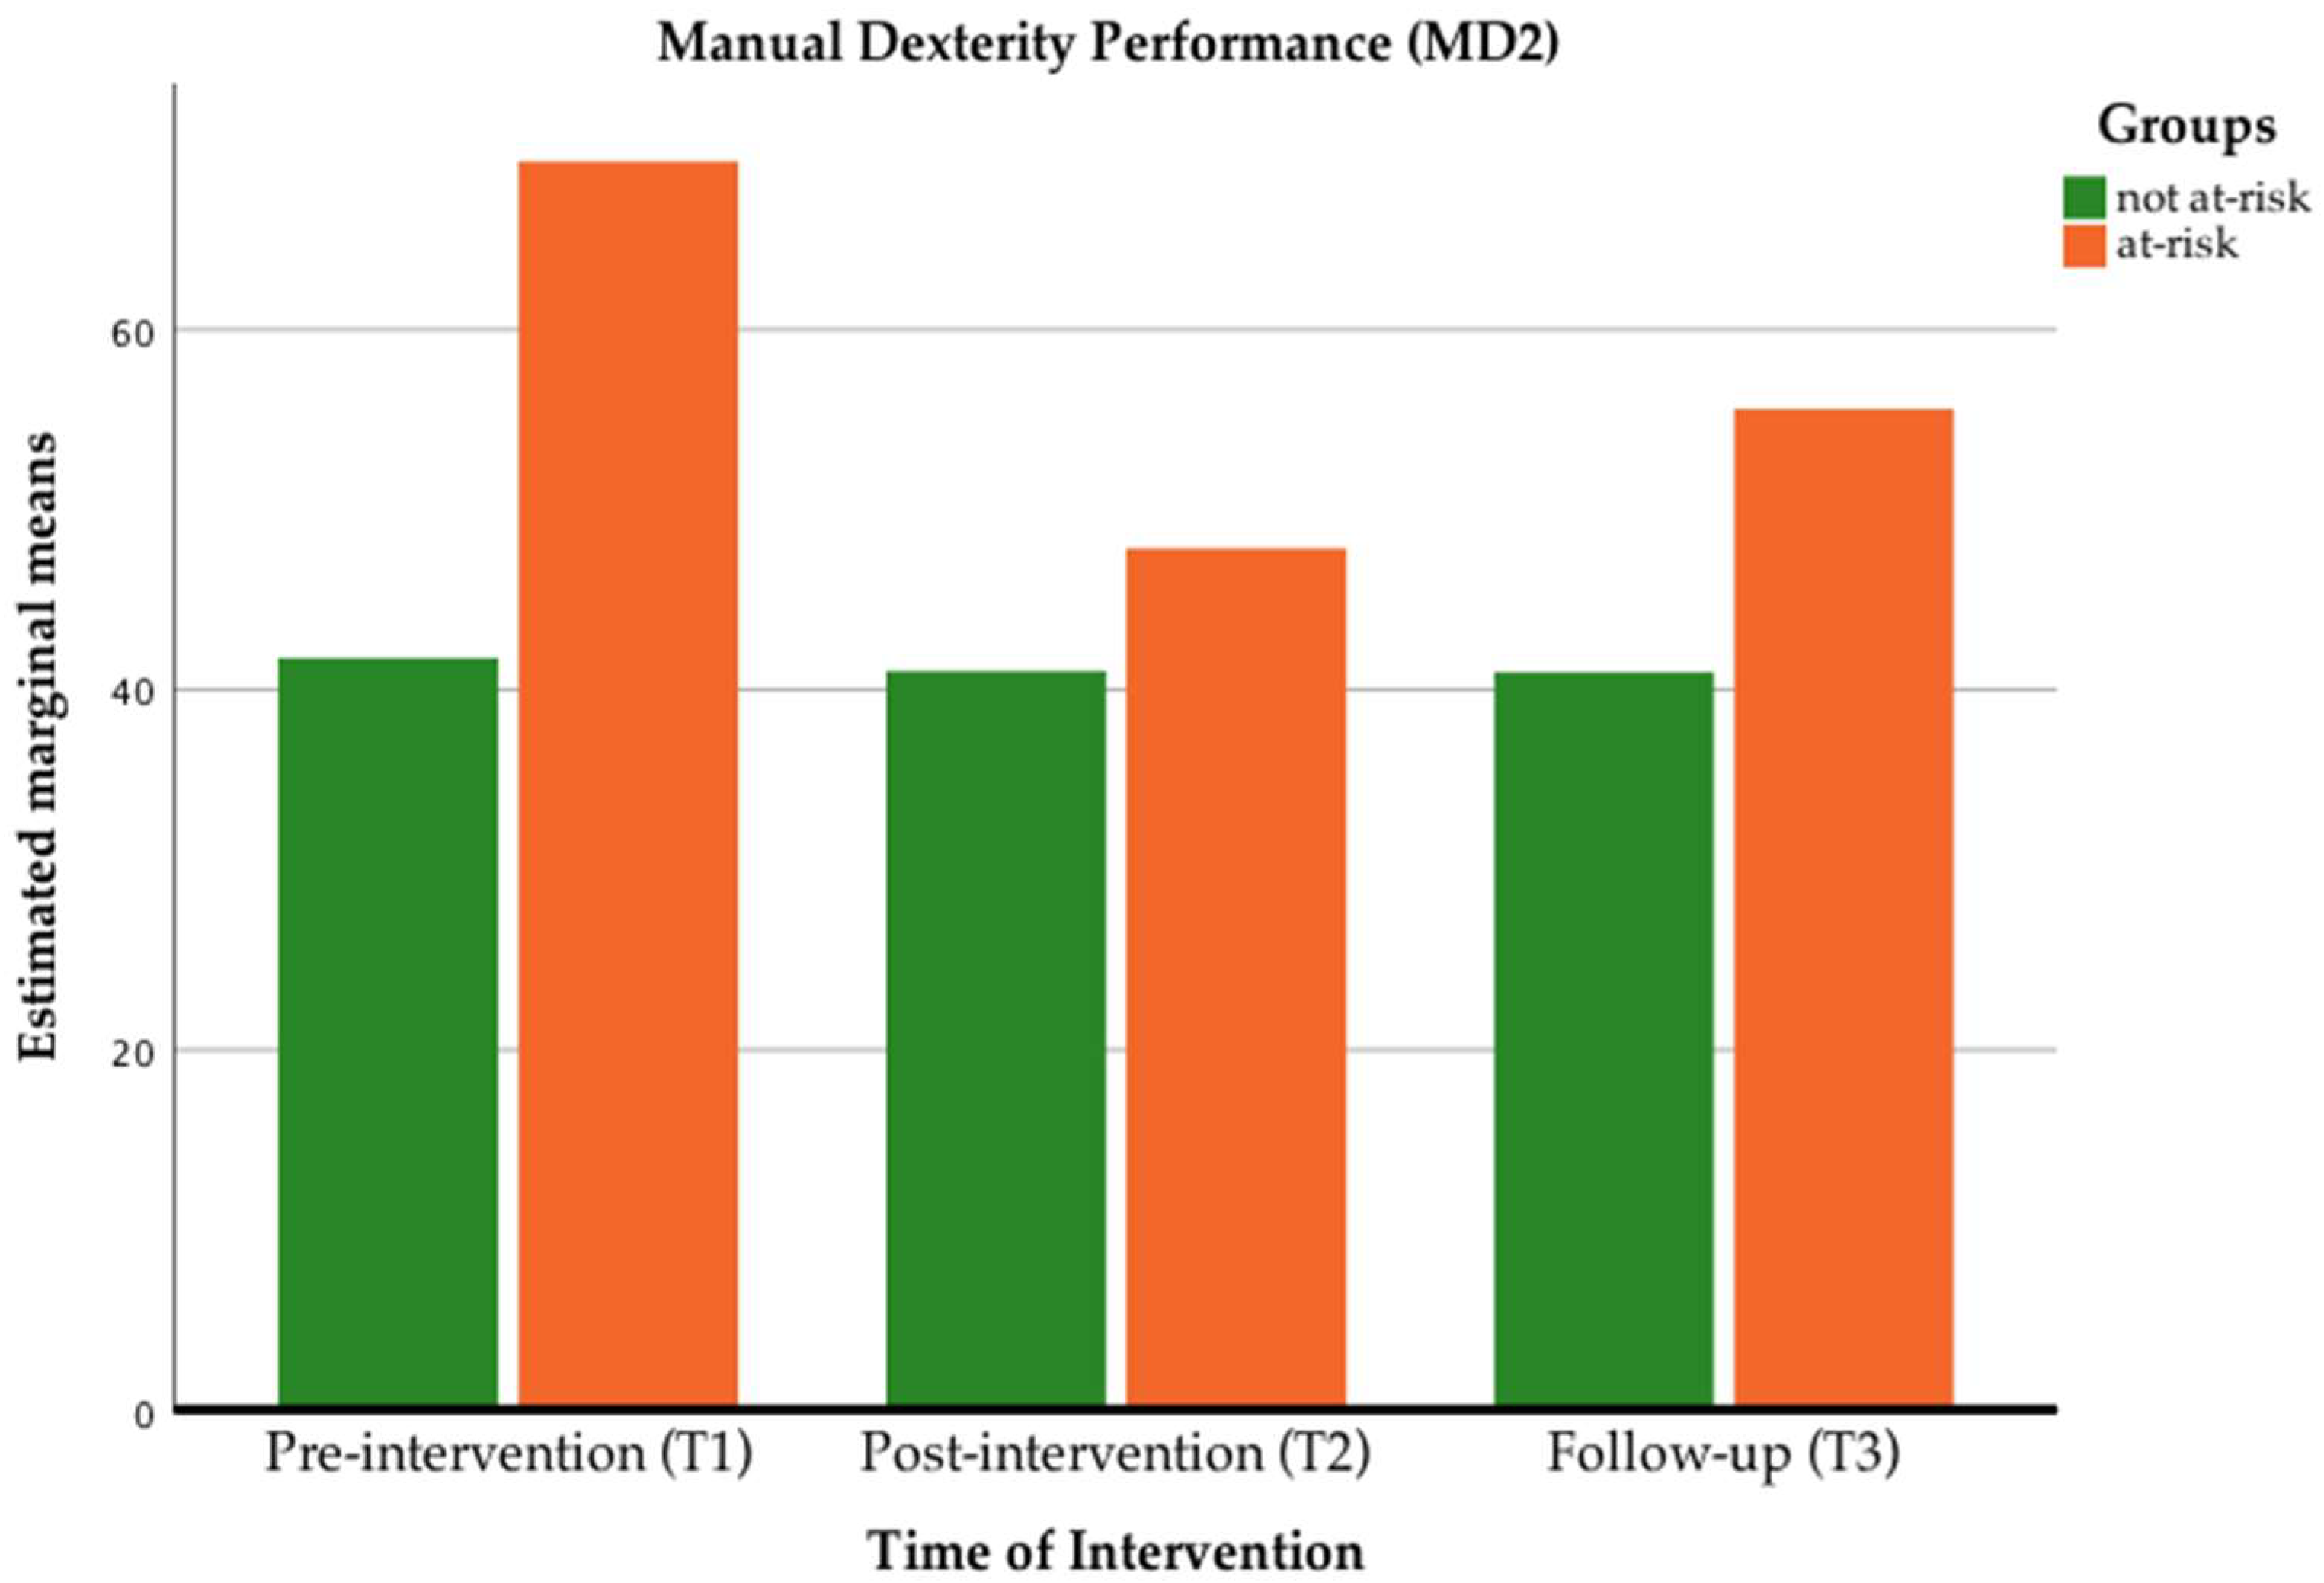
| MD2 | T2 < T1 *** | |||||||||||||
| At-Risk | 69.25 (17.56) | 47.75 (9.86) | 55.50 (8.38) | 28.218 | 0.365 | 0.001 *** | 11.316 | 0.188 | 0.001 *** | 9.824 | 0.167 | 0.001 *** | T3 > T2 * | |
| Not at-risk | 41.65 (11.89) | 40.95 (8.94) | 40.86 (9.97) | T3 < T1 * R > NR *** | ||||||||||
| MD3 | ||||||||||||||
| At-Risk | 4.50 (3.25) | 2.88 (2.41) | 2.63 (1.76) | 14.822 | 0.232 | 0.001 *** | 4.877 | 0.091 | 0.010 ** | 2.481 | 0.048 | 0.089 | T3 < T1 ** | |
| Not at-risk | 1.51 (1.62) | 1.33 (1.75) | 1.14 (1.42) | R > NR *** | ||||||||||
| Outcome Variables | Factors | Statistics | Comparison | |||||||||||
|---|---|---|---|---|---|---|---|---|---|---|---|---|---|---|
| Gender | Intervention | Gender | Intervention | Gender by Intervention | ||||||||||
| M (SD) at T1 | M (SD) at T2 | M (SD) at T3 | F | ηp2 | p | F | ηp2 | p | F | ηp2 | p | |||
| VMI | 6.712 | 0.120 | 0.013 * | 21.608 | 0.306 | 0.001 *** | 2.703 | 0.052 | 0.072 | T2 > T1 *** | ||||
| Male | 11.76 (2.43) | 12.90 (2.83) | 12.93 (2.13) | T3 > T1 *** | ||||||||||
| Female | 12.86 (2.86) | 14.59 (2.95) | 15.41 (3.00) | F > M * | ||||||||||
| VMI_P | 3.694 | 0.070 | 0.060 | 42.550 | 0.465 | 0.001 *** | 0.122 | 0.002 | 0.886 | T2 > T1 *** | ||||
| Male | 12.03 (3.85) | 14.66 (2.91) | 16.69 (2.52) | T3 > T2 *** | ||||||||||
| Female | 13.45 (4.83) | 16.36 (4.57) | 18.64 (4.14) | T3 > T1 *** | ||||||||||
| VMI_MC | 9.082 | 0.156 | 0.004 ** | 10.523 | 0.17 | 0.001 *** | 0.061 | 0.001 | 0.941 | T3 > T1 *** | ||||
| Male | 12.97 (3.25) | 13.48 (4.12) | 14.66 (3.50) | T3 > T2 * | ||||||||||
| Female | 15.73 (3.80) | 16.50 (4.49) | 17.64 (3.56) | F > M ** | ||||||||||
| MD1_PH | 0.133 | 0.003 | 0.717 | 1.449 | 0.029 | 0.240 | 1.370 | 0.027 | 0.258 | |||||
| Male | 17.13 (6.22) | 18.87 (3.82) | 18.50 (2.52) | |||||||||||
| Female | 18.24 (4.79) | 17.71 (2.95) | 19.48 84.27) | |||||||||||
| MD1_OH | 0.659 | 0.013 | 0.421 | 2.172 | 0.042 | 0.136 | 0.402 | 0.008 | 0.602 | |||||
| Male | 19.83 (9.38) | 20.80 (4.71) | 20.93 (3.46) | |||||||||||
| Female | 19.76 (4.77) | 22.38 (4.33) | 22.29 (5.21) | |||||||||||
| MD2 | 4.665 | 0.087 | 0.036 * | 2.251 | 0.044 | 0.127 | 0.032 | 0.001 | 0.931 | M > F * | ||||
| Male | 48.37 (19.31) | 44.27 (8.21) | 45.80 (10.59) | |||||||||||
| Female | 42.57 (10.01) | 38.81 (10.06) | 39.38 (10.84) | |||||||||||
| MD3 | 1.160 | 0.023 | 0.287 | 1.971 | 0.039 | 0.145 | 0.474 | 0.010 | 0.624 | |||||
| Male | 2.30 (2.33) | 1.73 (1.91) | 1.47 (1.38) | |||||||||||
| Female | 1.52 (1.99) | 1.33 (1.98) | 1.24 (1.81) | |||||||||||
© 2020 by the authors. Licensee MDPI, Basel, Switzerland. This article is an open access article distributed under the terms and conditions of the Creative Commons Attribution (CC BY) license (http://creativecommons.org/licenses/by/4.0/).
Share and Cite
Taverna, L.; Tremolada, M.; Dozza, L.; Zanin Scaratti, R.; Ulrike, D.; Lallo, C.; Tosetto, B. Who Benefits from An Intervention Program on Foundational Skills for Handwriting Addressed to Kindergarten Children and First Graders? Int. J. Environ. Res. Public Health 2020, 17, 2166. https://0-doi-org.brum.beds.ac.uk/10.3390/ijerph17062166
Taverna L, Tremolada M, Dozza L, Zanin Scaratti R, Ulrike D, Lallo C, Tosetto B. Who Benefits from An Intervention Program on Foundational Skills for Handwriting Addressed to Kindergarten Children and First Graders? International Journal of Environmental Research and Public Health. 2020; 17(6):2166. https://0-doi-org.brum.beds.ac.uk/10.3390/ijerph17062166
Chicago/Turabian StyleTaverna, Livia, Marta Tremolada, Liliana Dozza, Renata Zanin Scaratti, Domahs Ulrike, Carlo Lallo, and Barbara Tosetto. 2020. "Who Benefits from An Intervention Program on Foundational Skills for Handwriting Addressed to Kindergarten Children and First Graders?" International Journal of Environmental Research and Public Health 17, no. 6: 2166. https://0-doi-org.brum.beds.ac.uk/10.3390/ijerph17062166