Does the Presence of Birdsongs Improve Perceived Levels of Mental Restoration from Park Use? Experiments on Parkways of Harbin Sun Island in China


Abstract
:1. Introduction
2. Materials and Methods
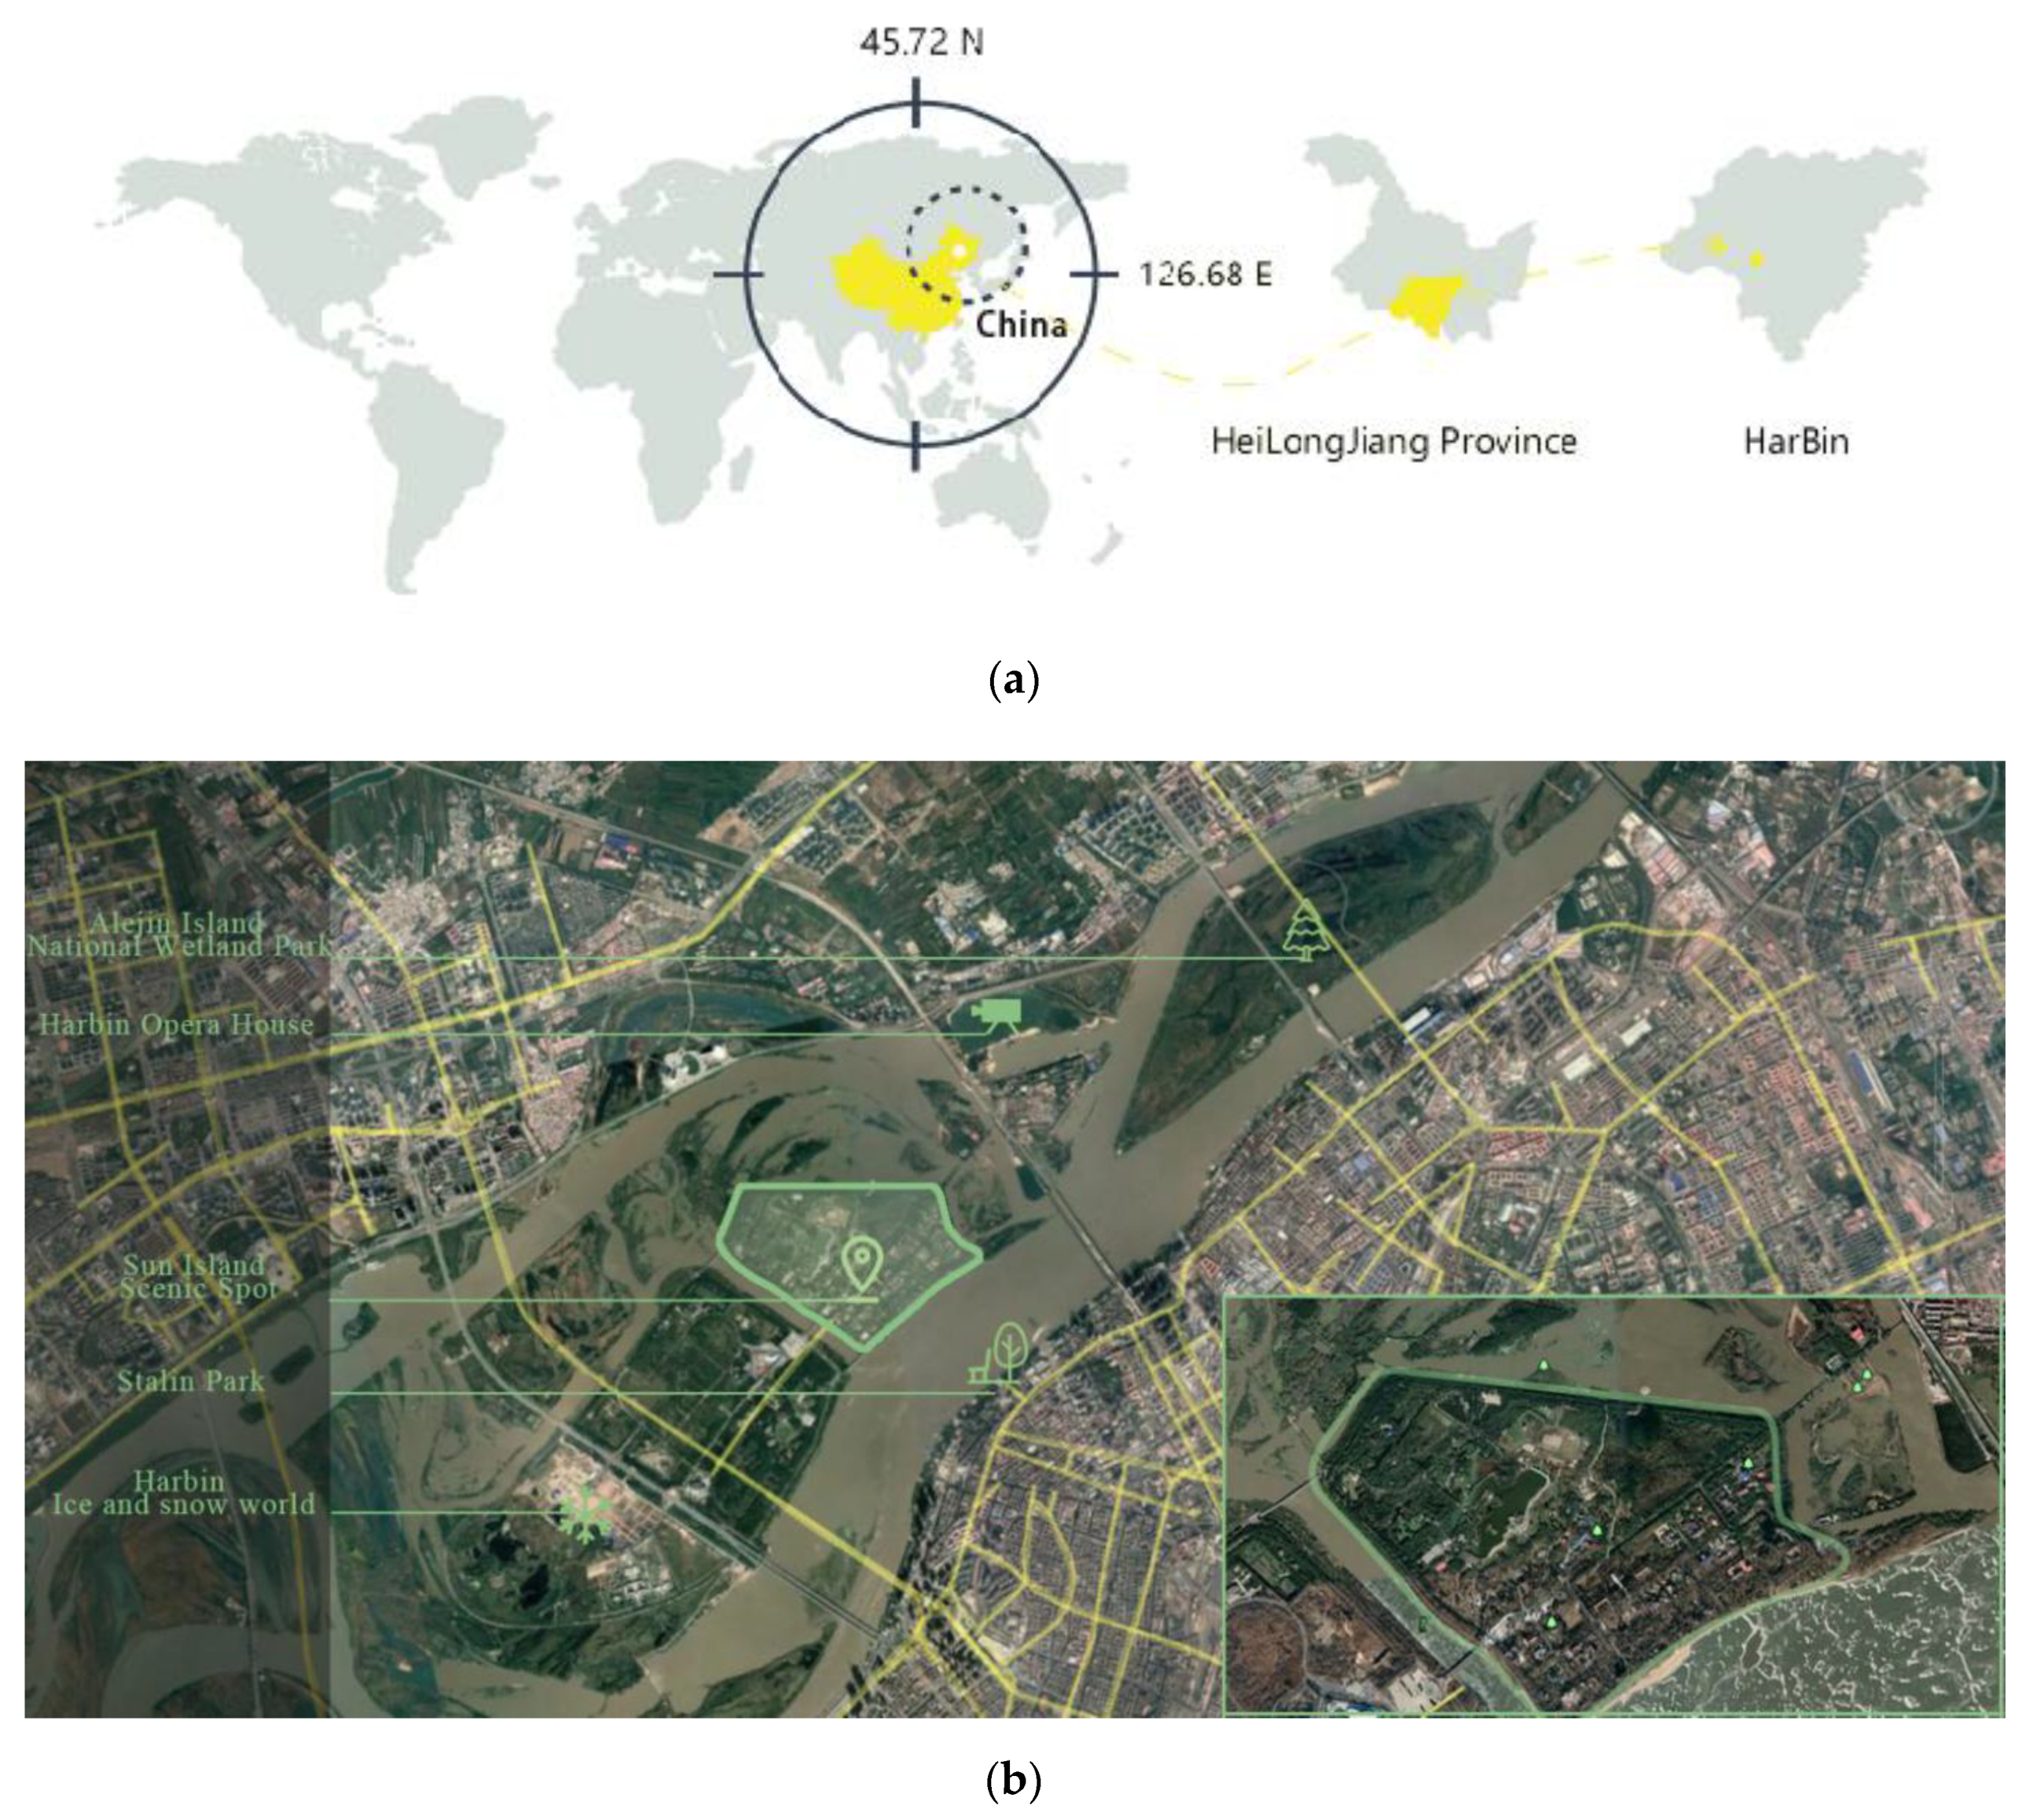
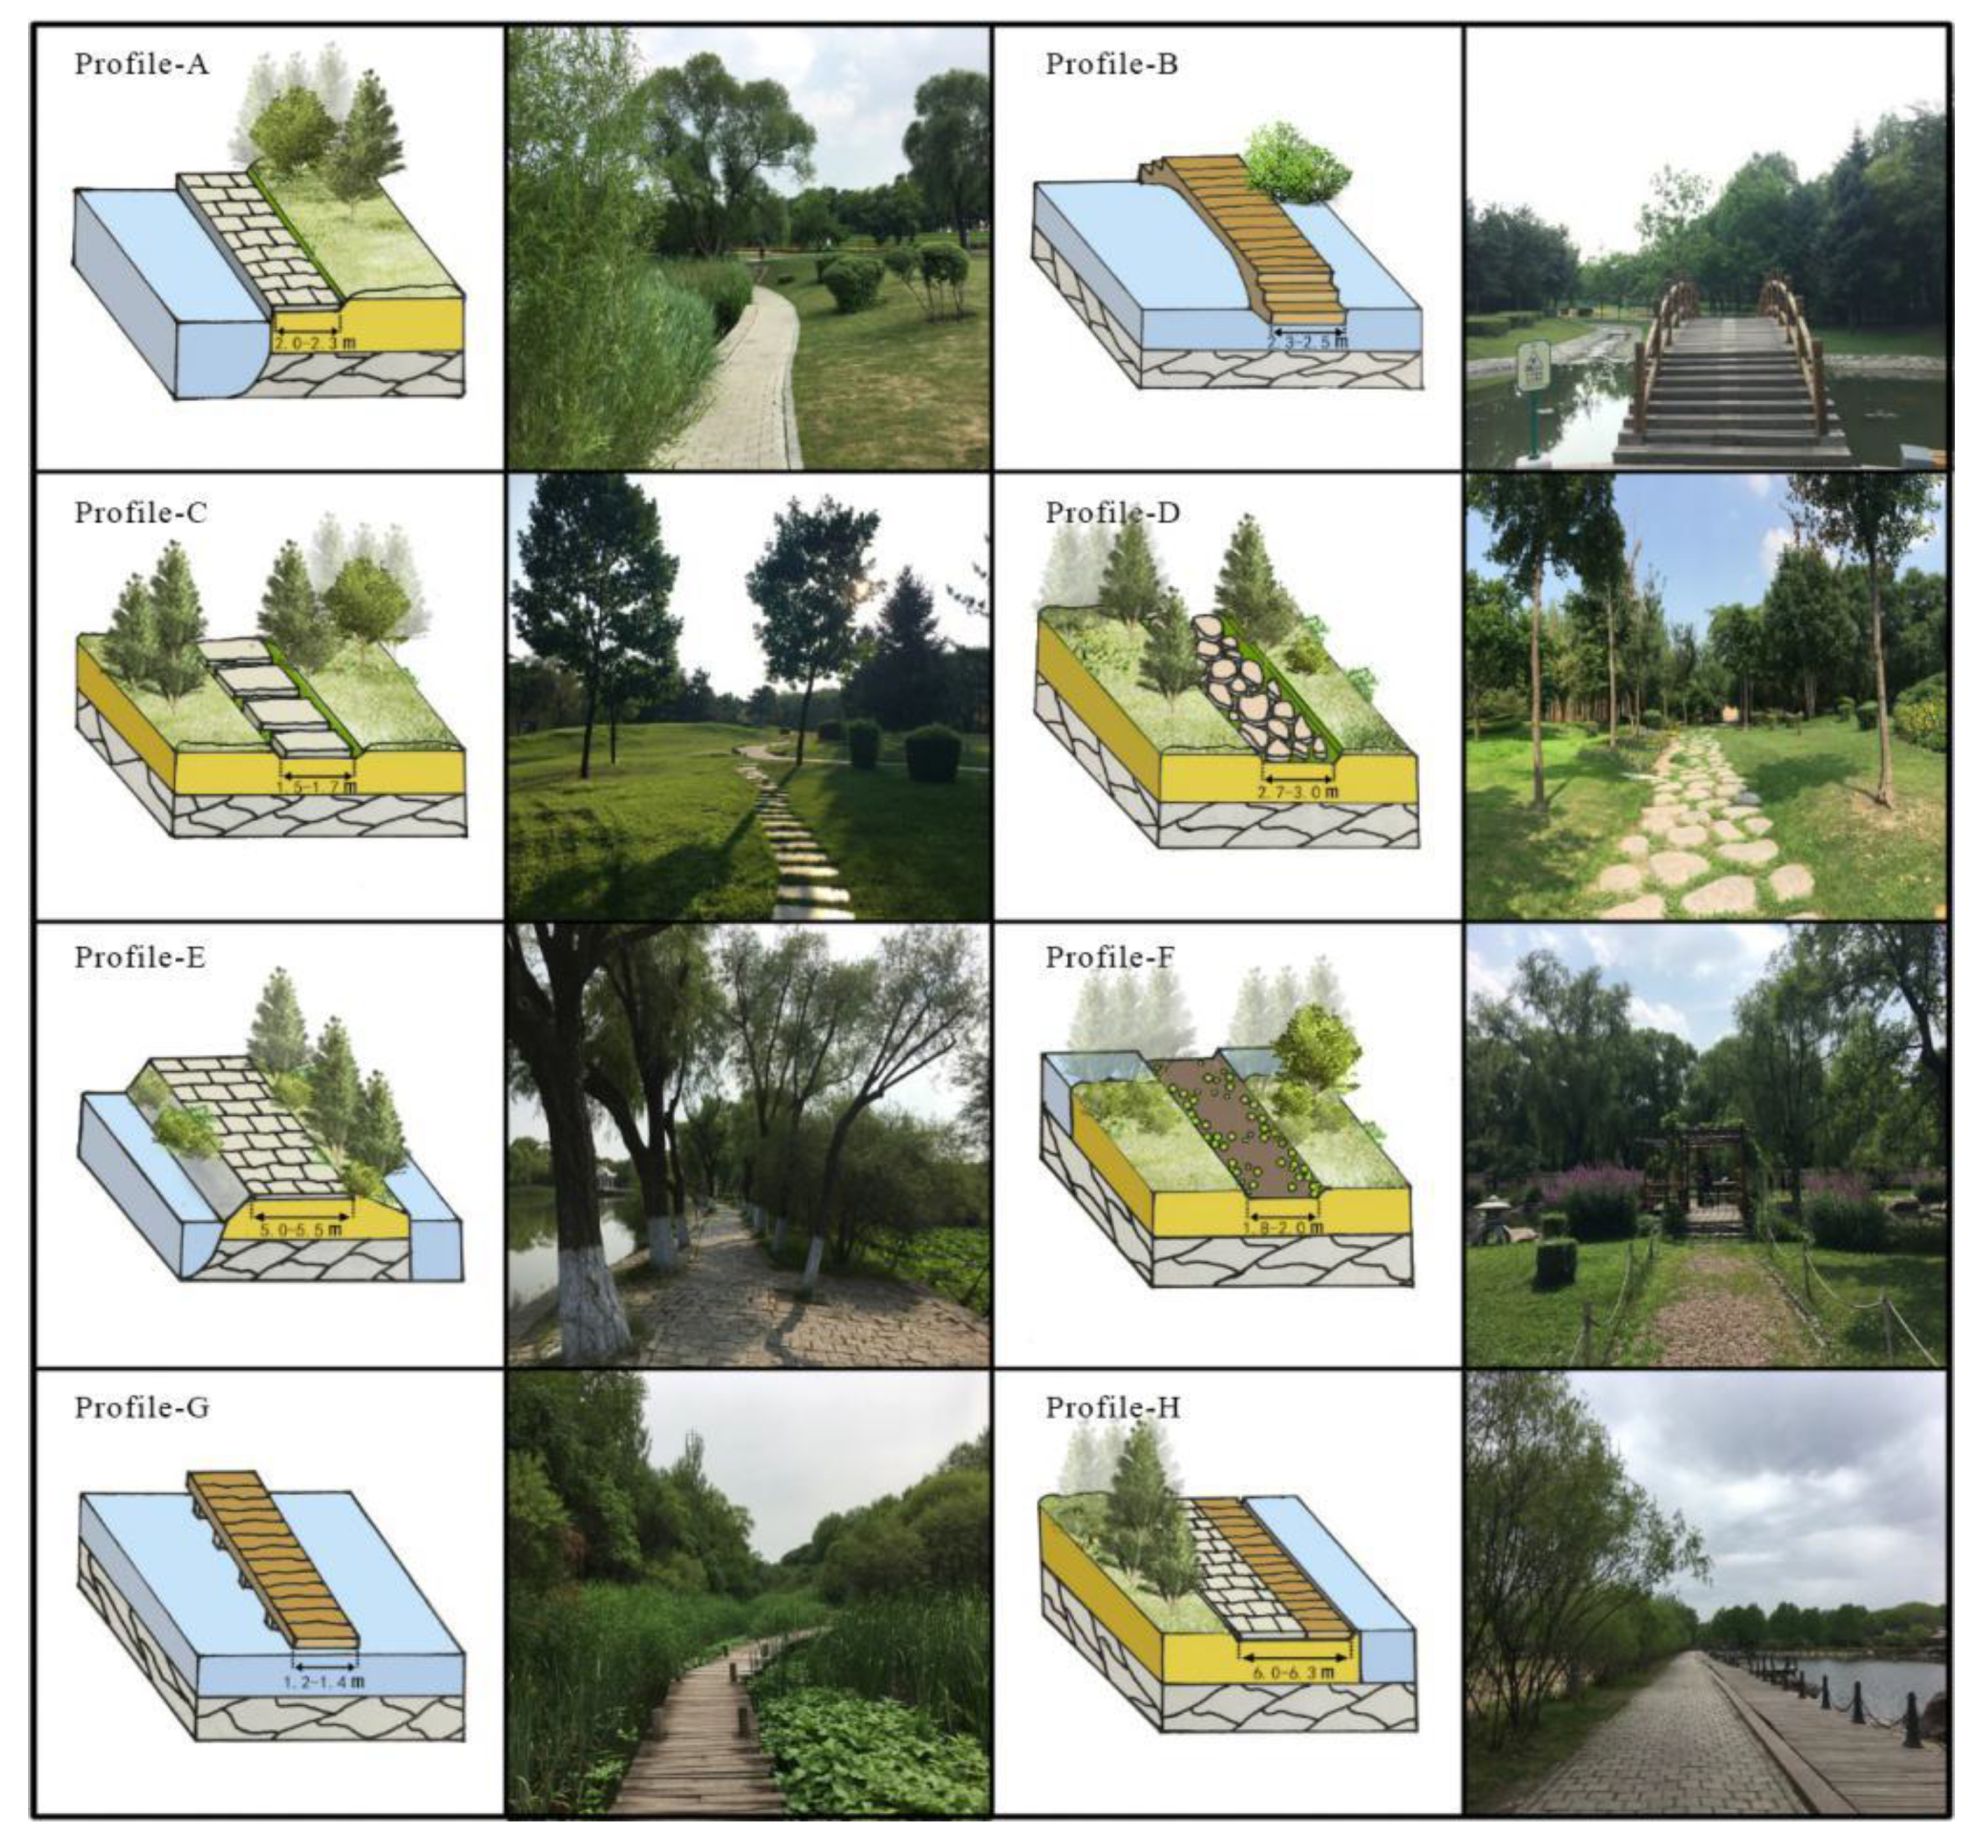
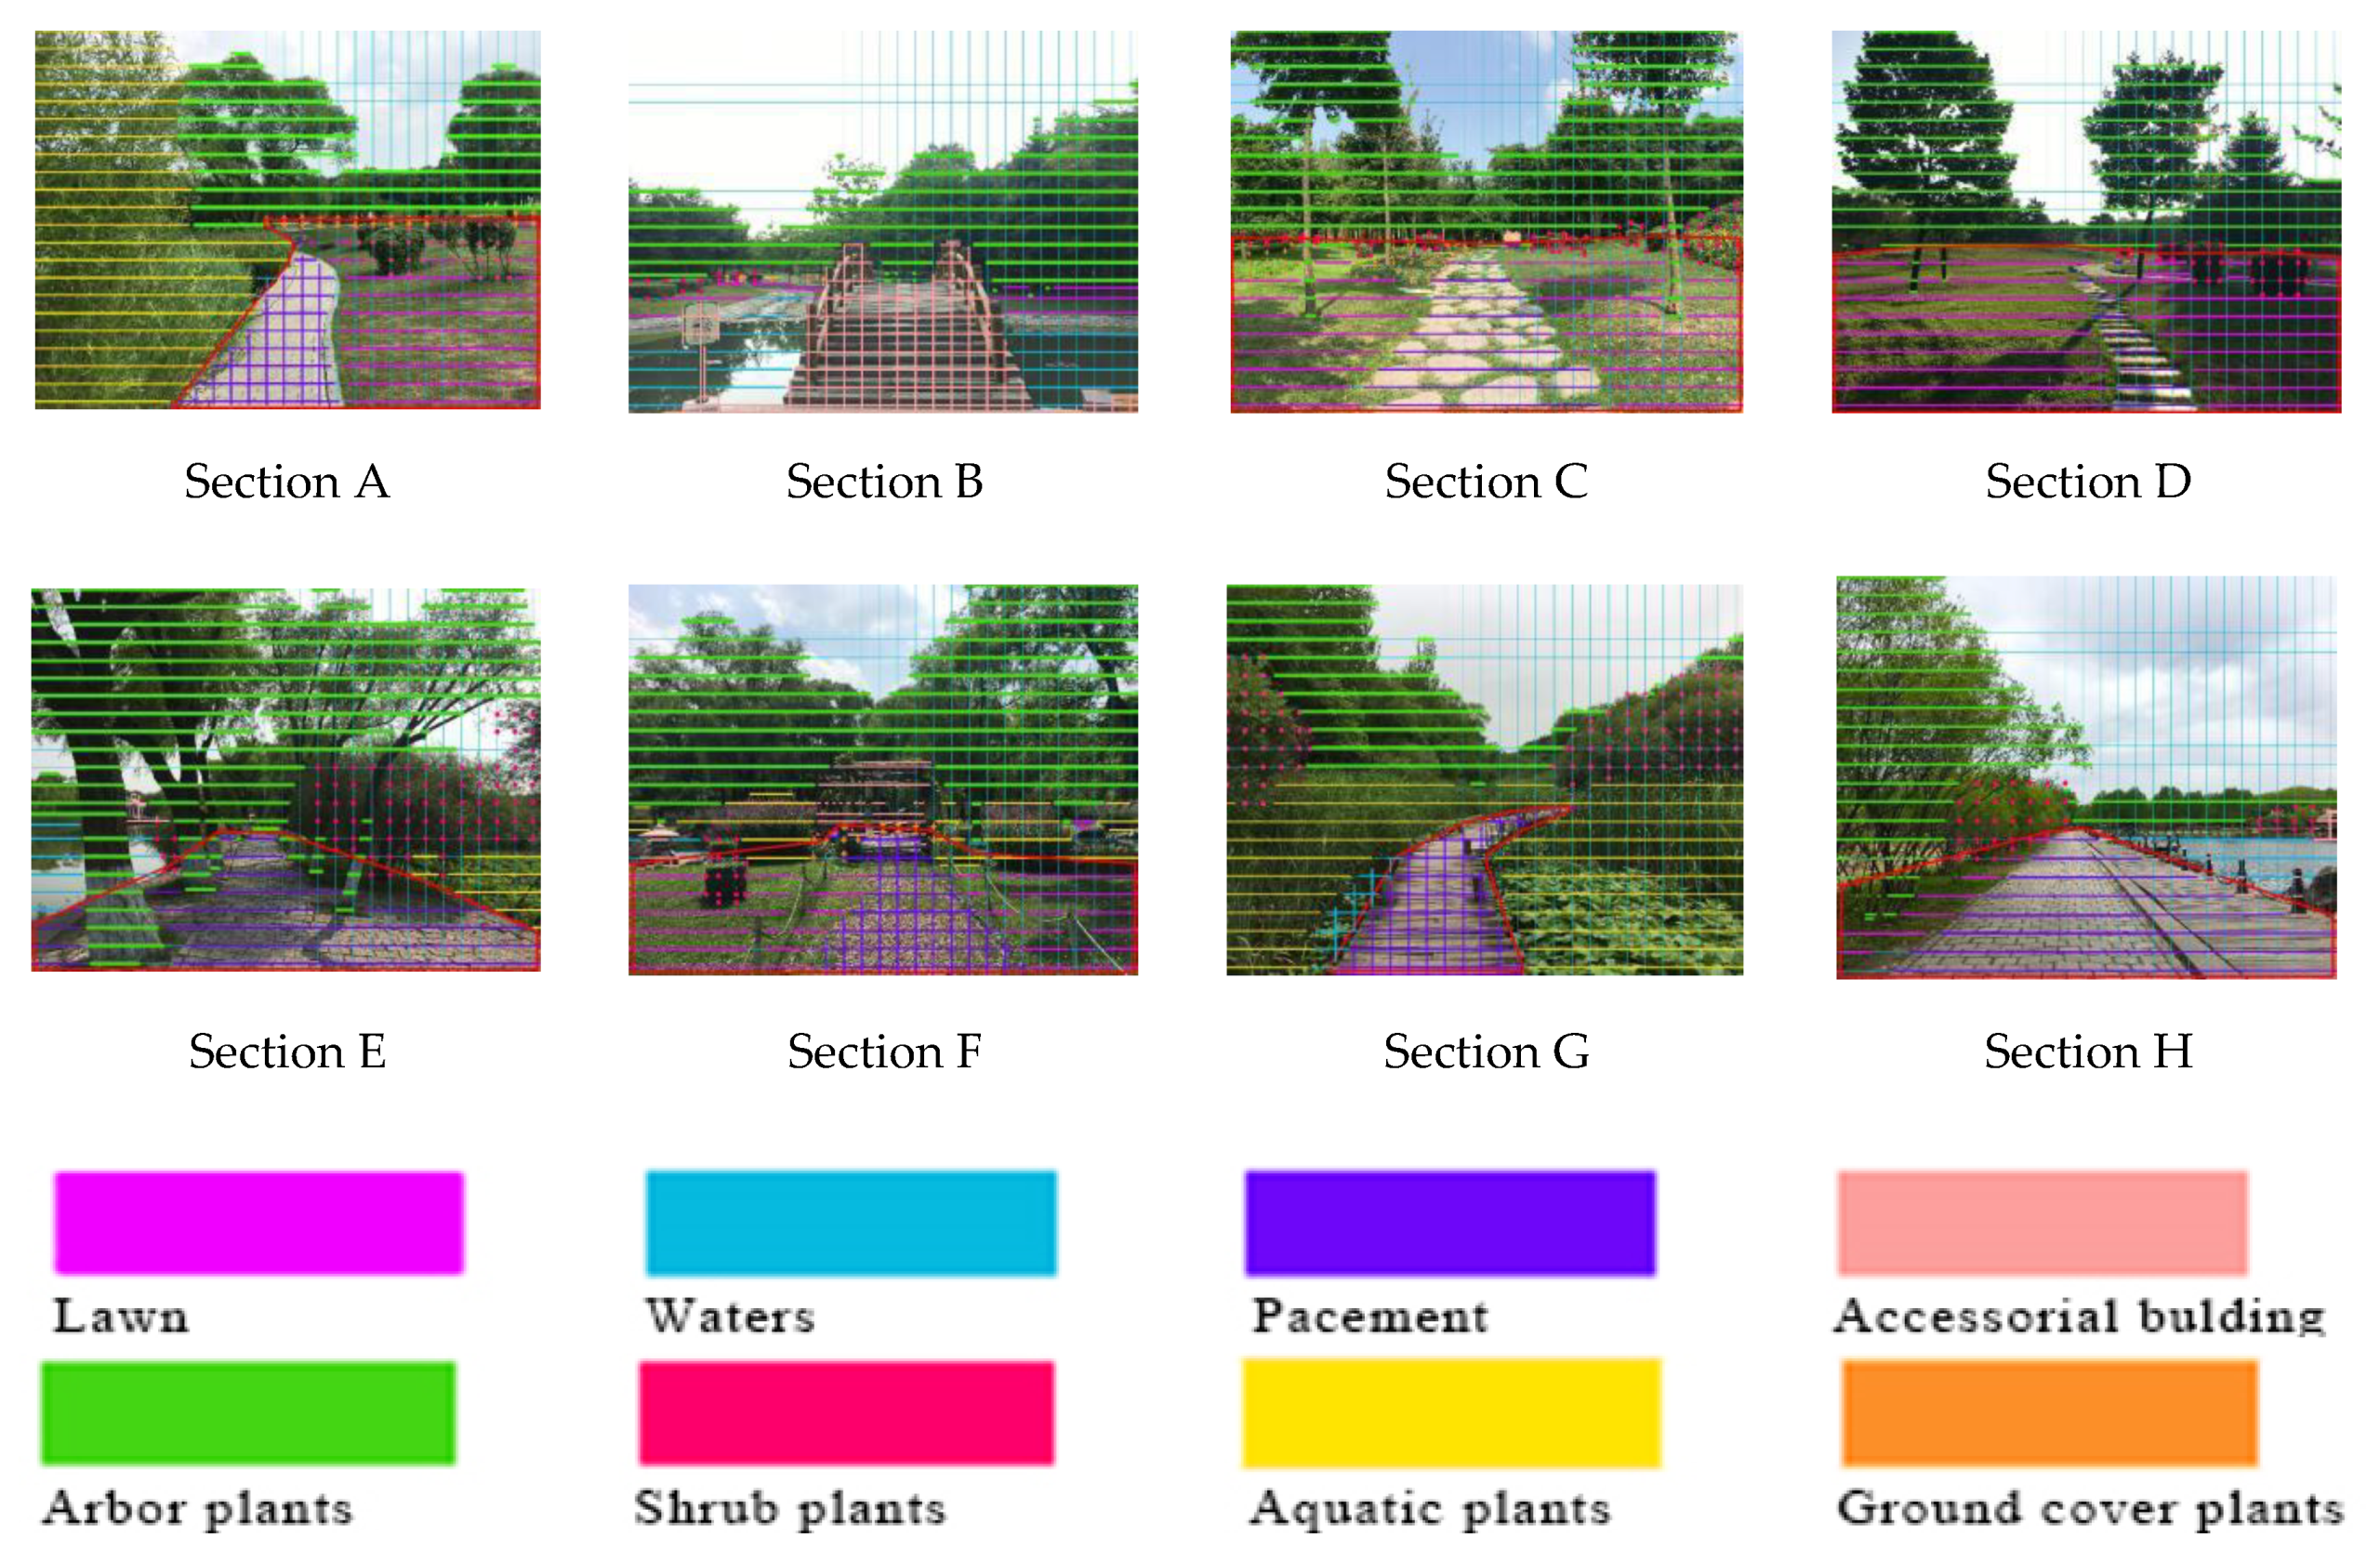
2.1. Path Sample Selection
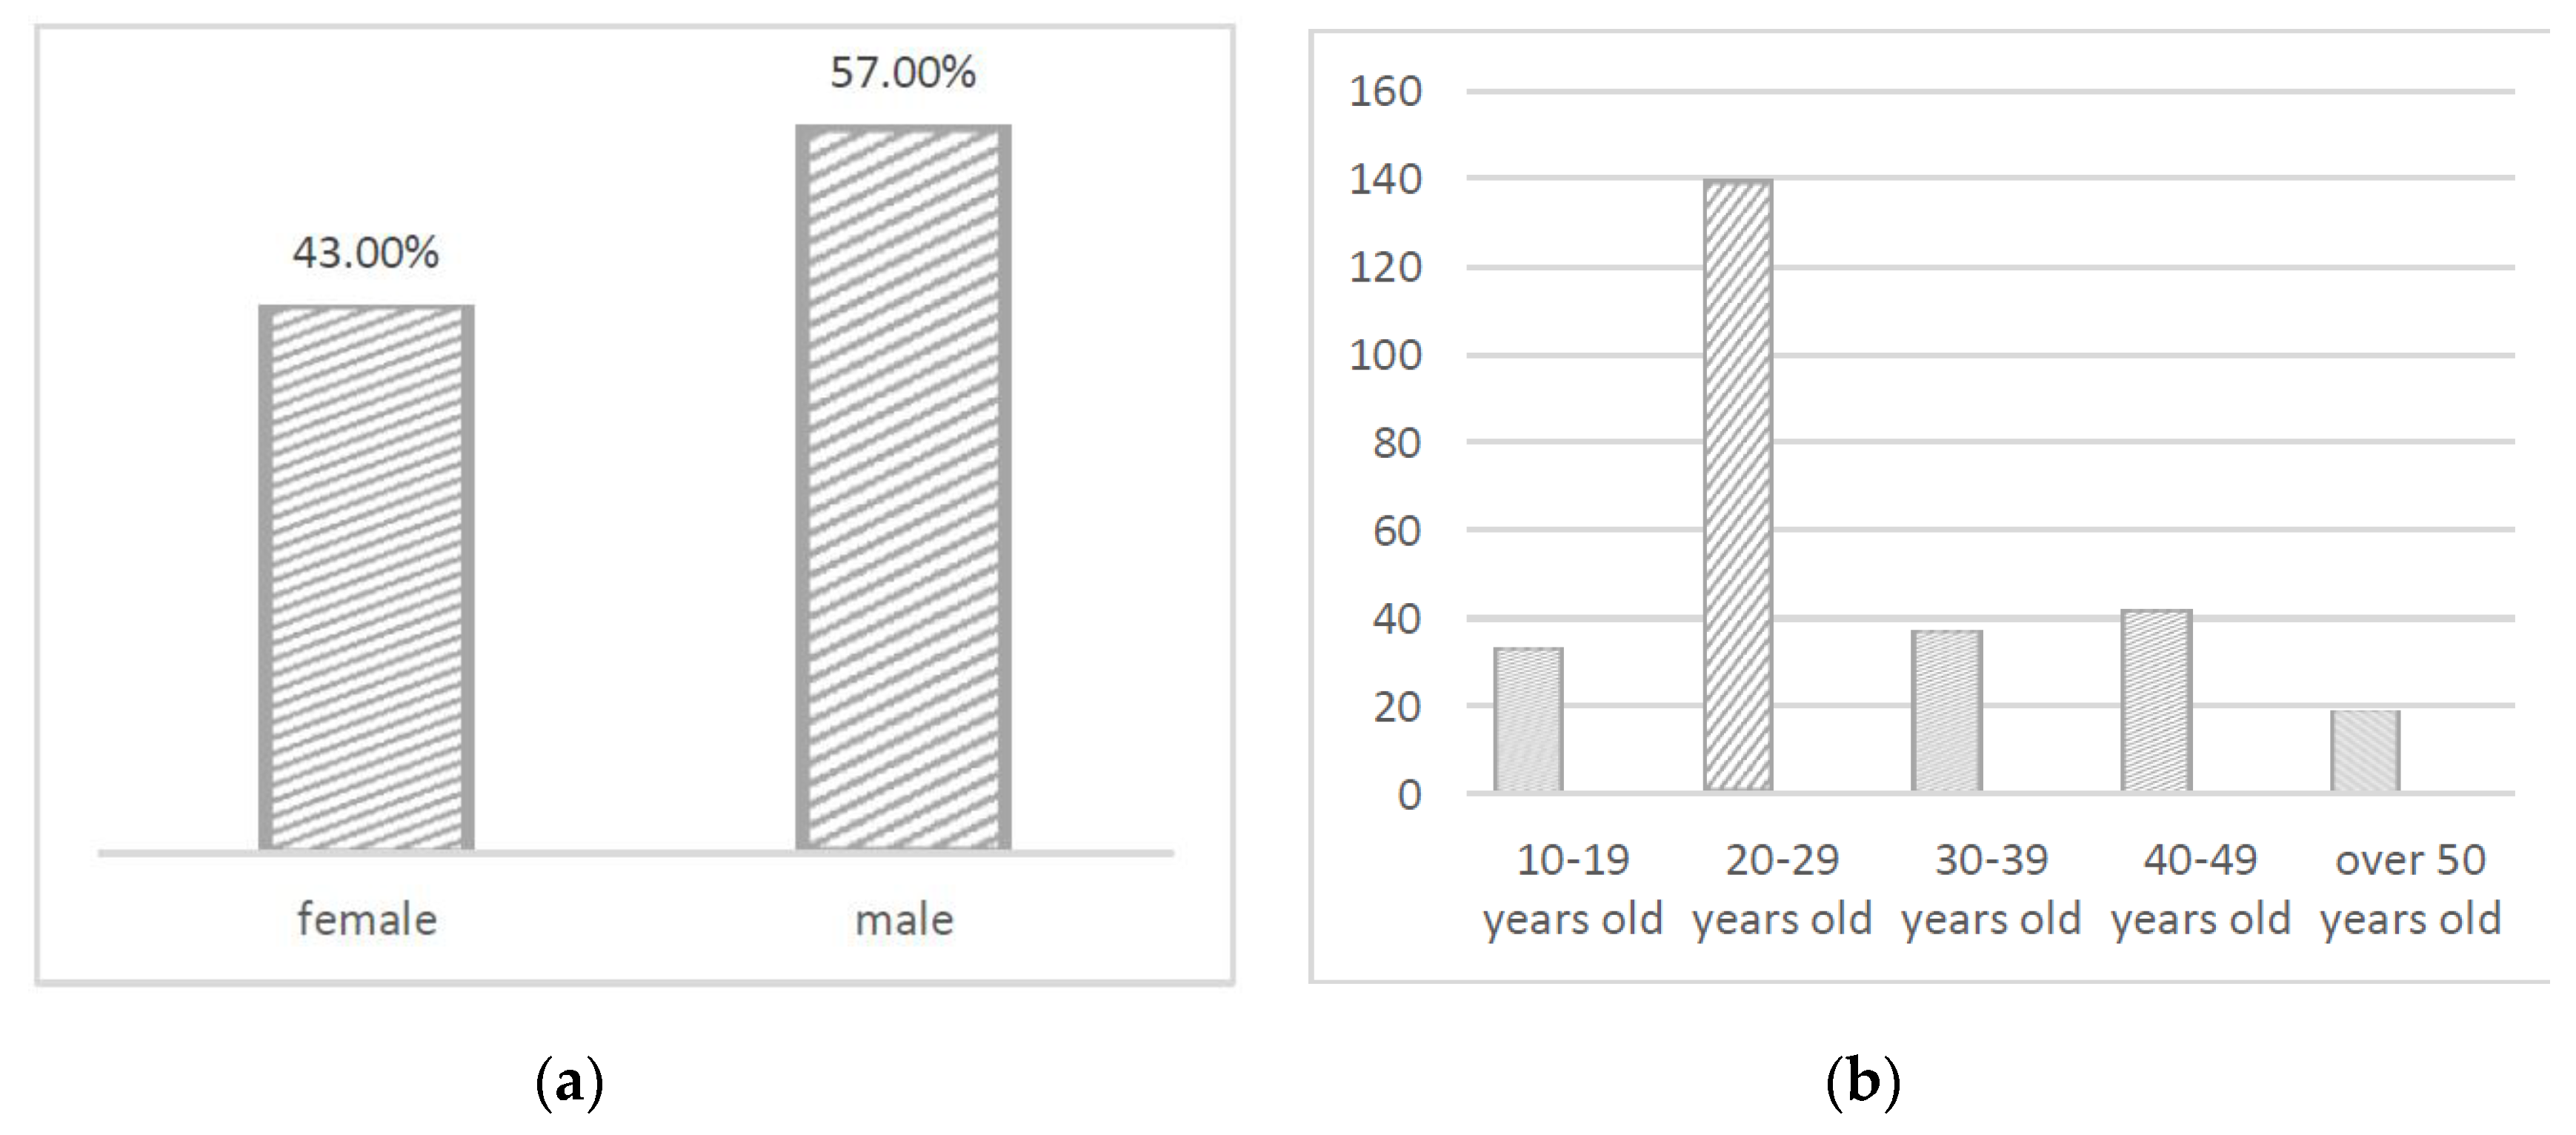
2.2. Sample Characteristics
2.3. Selection of Sound Sources
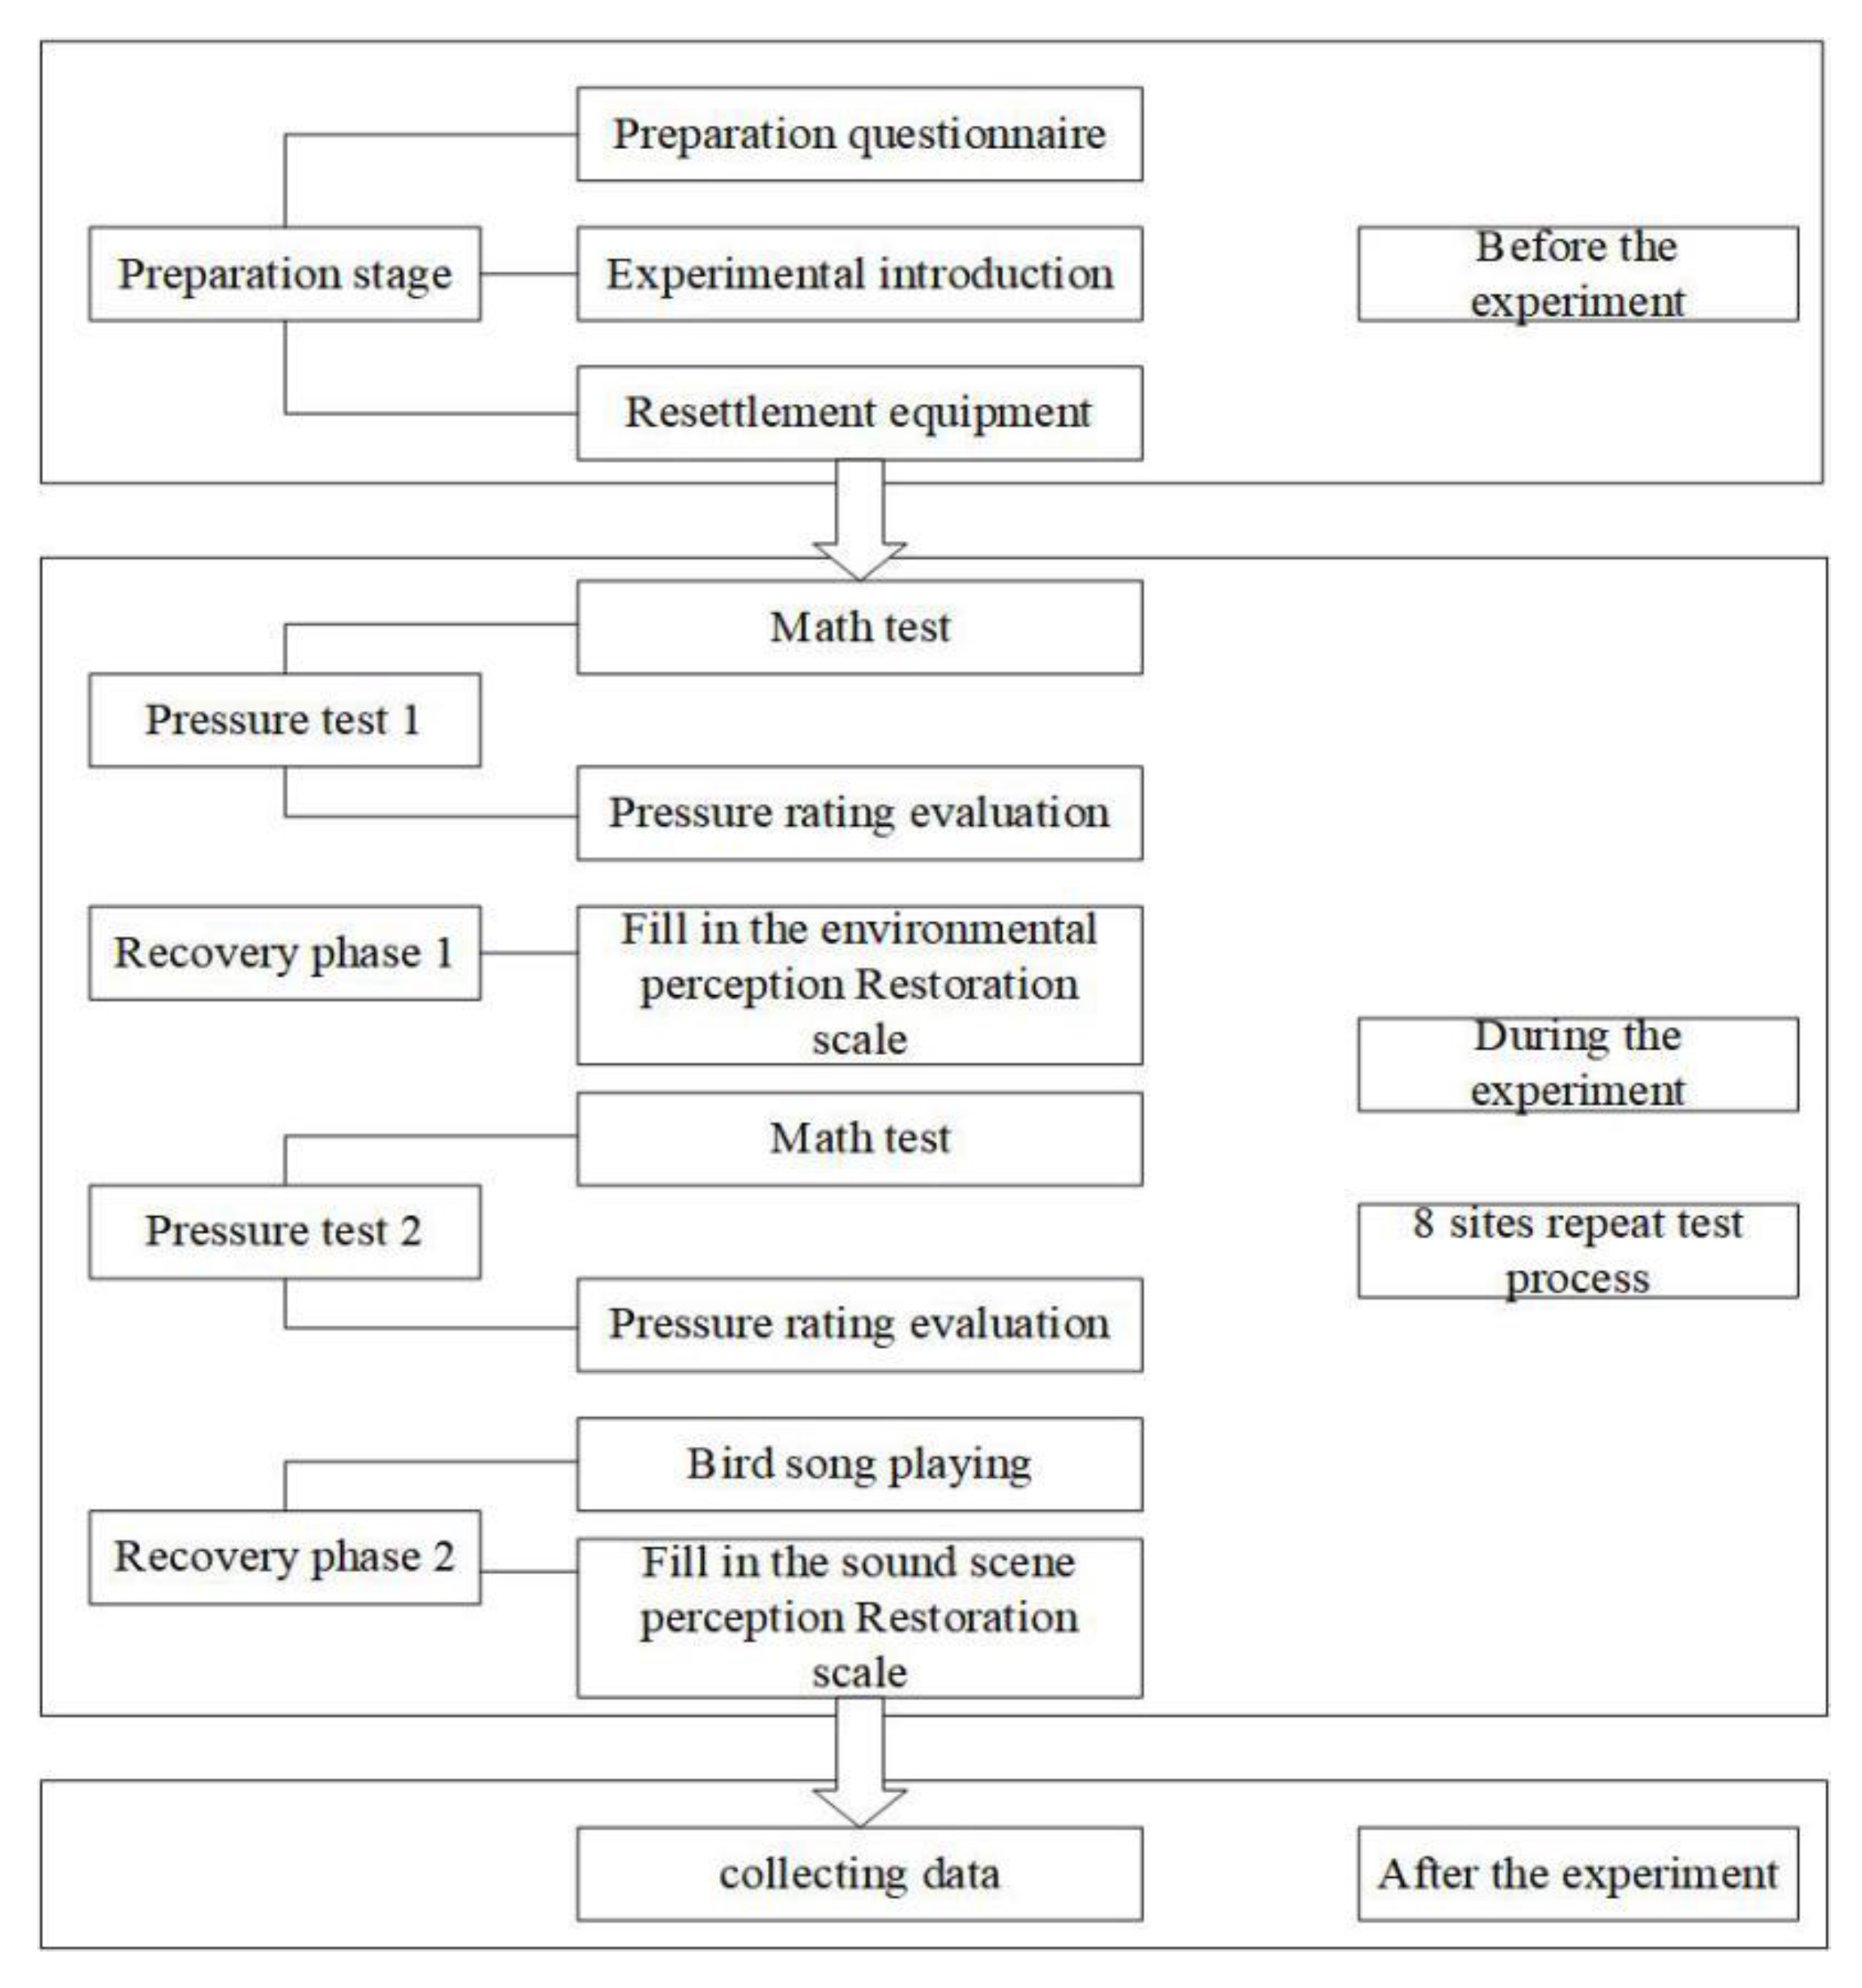
2.4. Experiment Flow
2.5. Selection of Subjects and Stress Analysis
3. Results
3.1. An Analysis of Perceived Recovery Benefits of Park Paths
- (1)
- Fascination: The scores of sections E and H were relatively high, at 5.62 and 5.57, respectively. Both of these sections are positioned close to a calm lake, indicating that natural water environments enhance perceived restorative effects by increasing landscape attractiveness, adding interest, promoting interaction, and attracting visitors. Section G is located in a wetland environment and presented the lowest score of 4.68. Landscapes on both sides of the road are relatively simple, leaving levels of attraction quite low.
- (2)
- Being away: Scores for sections F and H were high, at 5.17 and 5.22, respectively. One of these sections is located in a quiet environment with beautiful scenery, while the other is positioned near a calm lake, showing that beautiful, secluded spaces and calm water bodies encourage visitors to remain in spaces for longer periods of time. Scores for sections 1 and 2 were low, showing that the presence of paths encourages people to pass through quickly.
- (3)
- Compatibility: The compatibility scores of each section were almost identical, showing that when the compatibility of park paths is high, the surrounding landscape conforms to the overall environment and can mobilize crowds.
- (4)
- Extent: Section H had a score of 4.82, showing that the restorative effect of this section was relatively high. The section is positioned close to a large lake. Water bodies can enhance a sense of closeness between humans and nature, indicating that people become more immersed in such environments. Section 4 presented the lowest value of 3.88, showing that paths surrounded by treed grassland cause people to feel more detached.
3.2. Benefit Analysis of Perceived Restorative Effects of Birdsongs
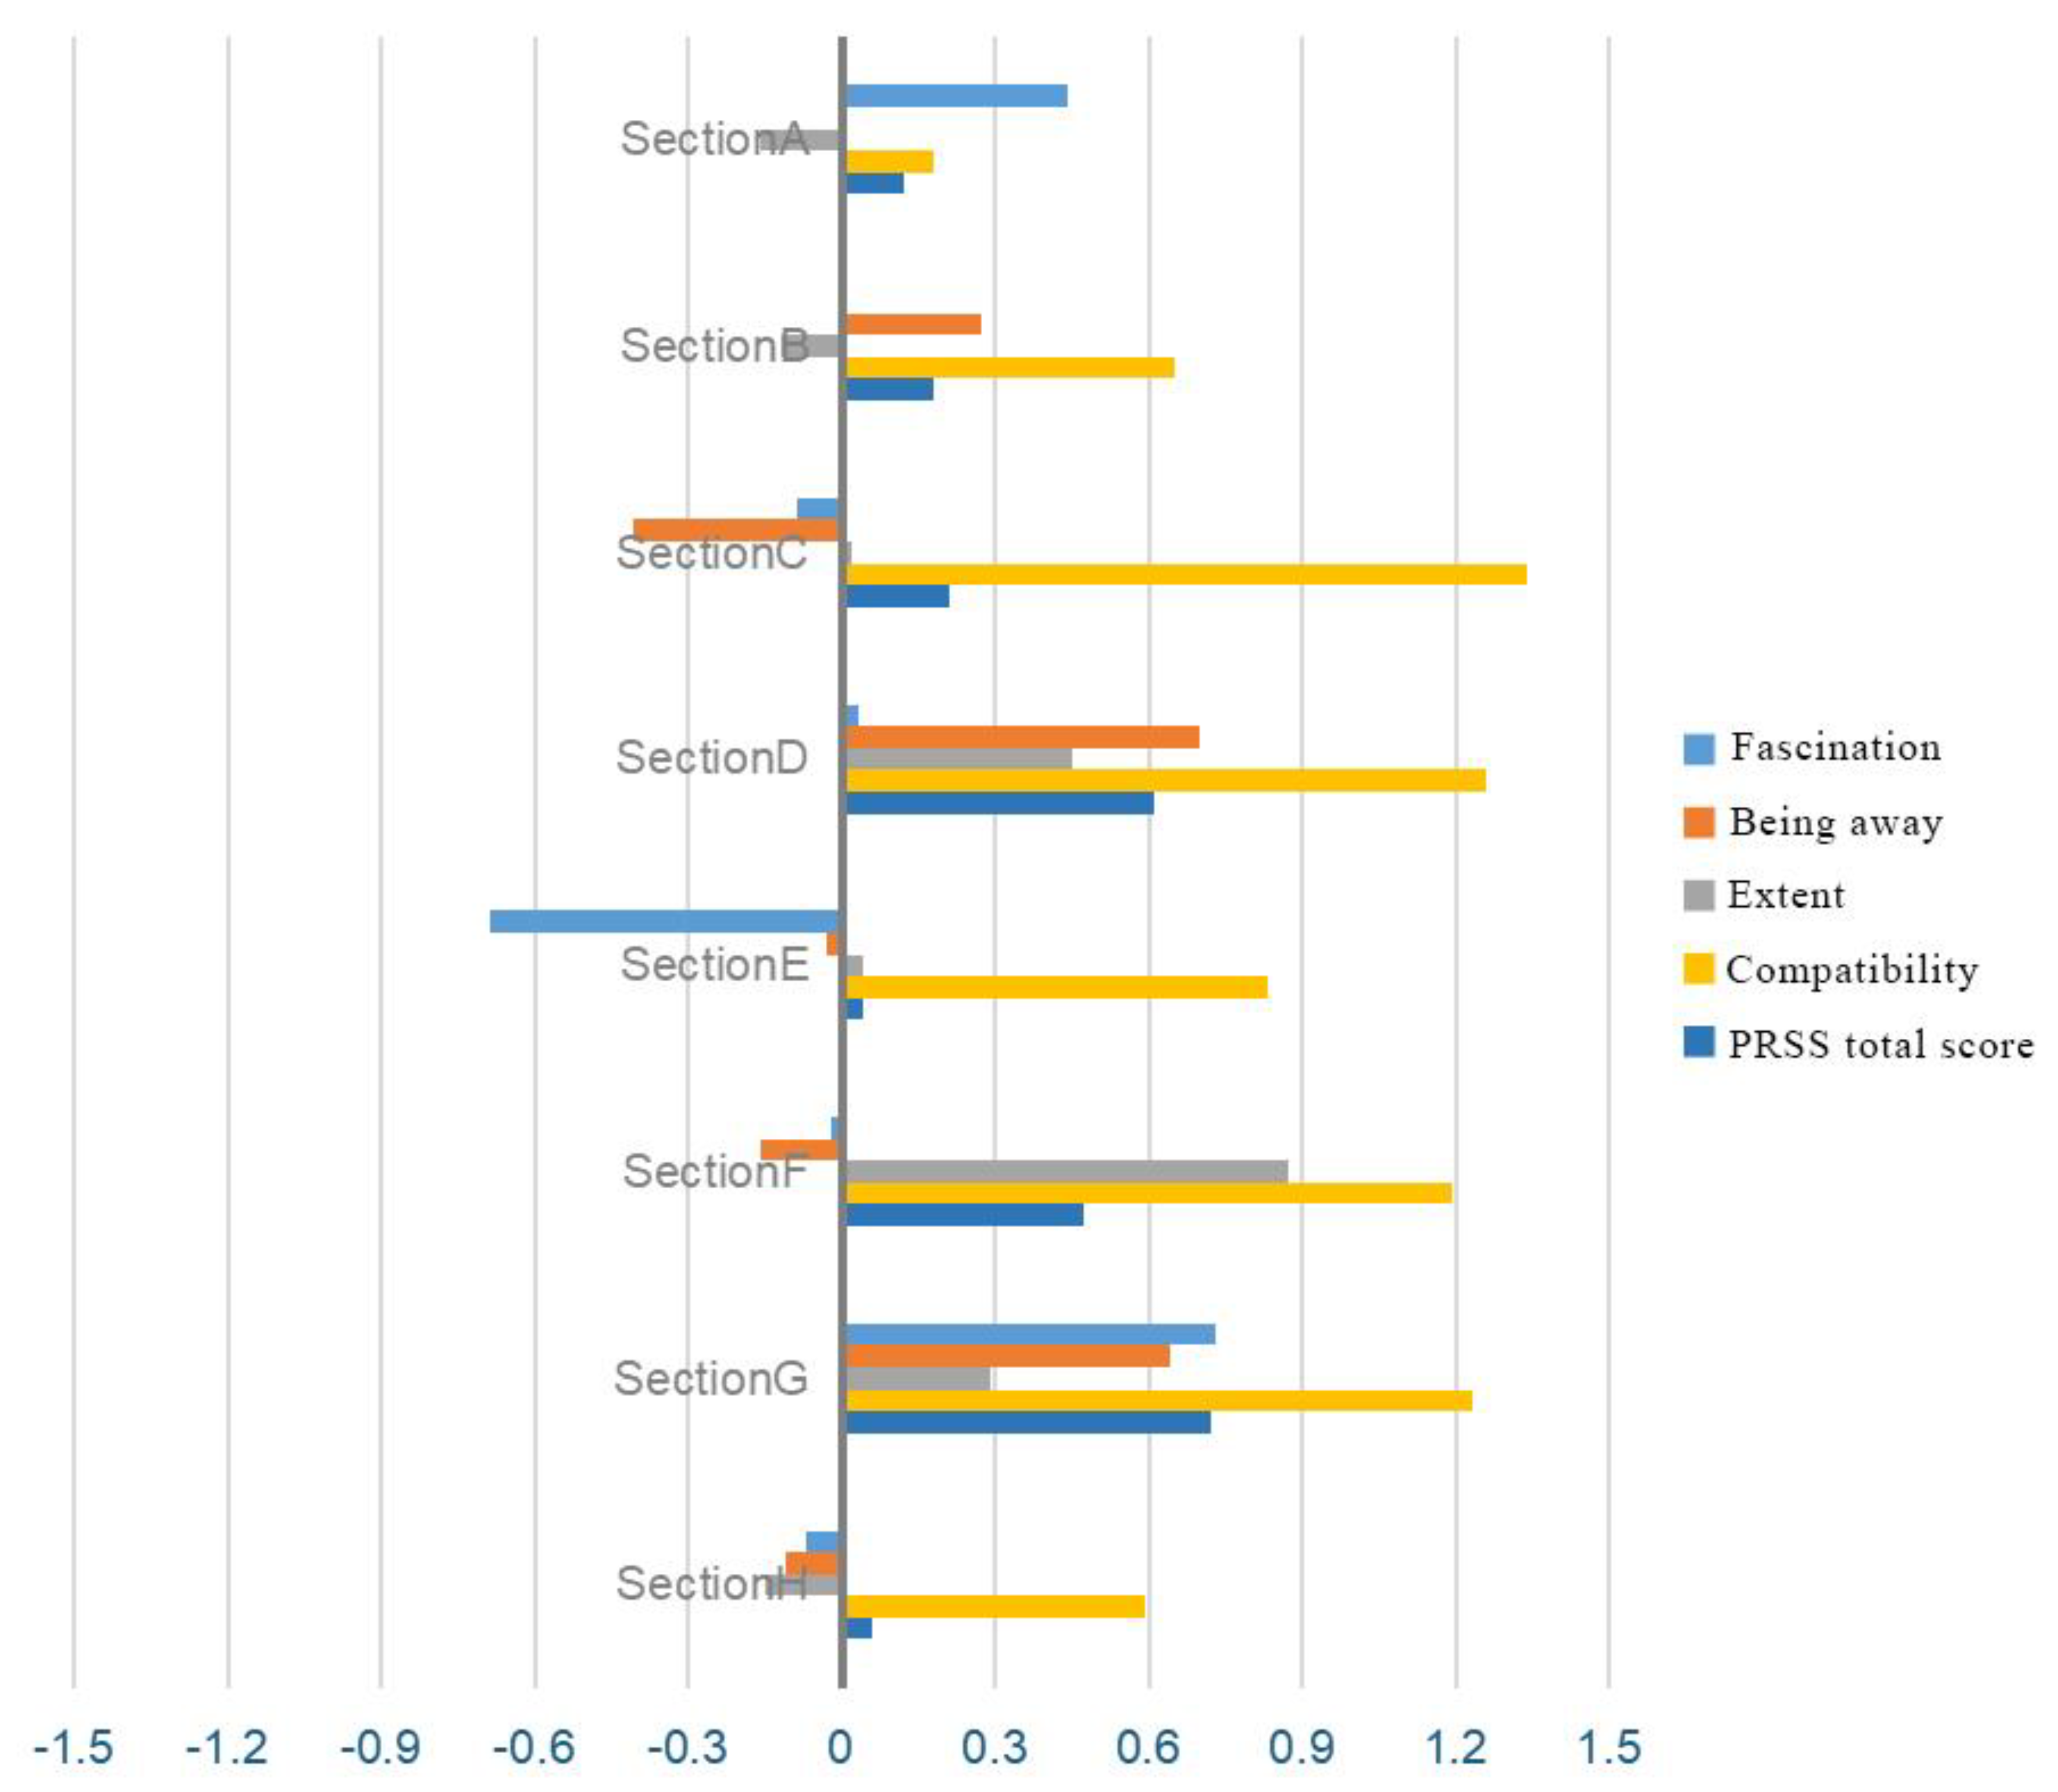
- (1)
- Fascination: After introducing birdsongs, scores for sections A and G increased by 0.44 and 0.73, respectively, showing that the participants generally found birdsongs to create a more harmonious setting in wetland environments and that they preferred wetland landscapes with birdsongs.
- (2)
- Being away: After introducing birdsongs, considerable increases of 0.70 and 0.64 were observed in sections D and G, respectively, showing that winding paths are more suited to bird habitat environments and allow visitors to relieve themselves of daily work stress. The score for section C was reduced by 0.41, which may have occurred because the path in this section passes through a clearing in a forest, increasing the probability of “unnecessary interference” from tourists and promoting a feeling of escape.
- (3)
- Compatibility: After introducing birdsongs, the score for section F increased the most, by 0.87, while other scores changed less, showing that birdsongs had a limited impact on path compatibility and a certain impact on paths through dense forest, allowing visitors to quickly adjust to surrounding dense forested environments and encouraging a state of relaxation.
- (4)
- Extent: After introducing birdsongs, extent scores changed considerably, increasing by 0.925 on average in the eight sections. The score for section C changed the most, increasing by 1.34, showing that birdsongs have a strong impact on extent values. Birdsongs can broaden a scene, increase the perceived openness of a site, and highlight the naturally artistic features of birdsongs.
- (5)
- The total PRS score for section H was highest when birdsongs were not introduced. After introducing birdsongs, the total score for sections D and G changed the most, increasing by 0.61 and 0.72 and showing that the restorative effects of birdsongs are stronger when introducing birdsongs to path environments that include water bodies.
3.3. An Analysis of the Restorative Benefits of Path Spaces
3.4. Correlation Analysis of Landscape Elements and Perceptual Restoration
- (1)
- There was a significant negative correlation between the sky index and each feature. The effects of the restorative characteristics of landscape perceptions are ranked as follows: Fascination > Compatibility > Being away > Extent. The effects of restorative characteristics of soundscape perceptions are ranked as follows: Fascination > Being away > Extent > Compatibility. This may be the case because park users usually remain in shaded areas. A small sky index means that the broader one’s view of a landscape, the less private that landscape is and the lower the level of psychological safety, resulting in a reduced restorative effect.
- (2)
- The soft/hard ratio had a significant positive correlation with each property. The effects of restorative characteristics of landscape perception are ranked as follows: Fascination > Compatibility > Extent > Being away. The effects of restorative characteristics of soundscape perception are ranked as follows: Extent > Fascination > Compatibility > Being away. Relative to the soft/hard ratio, the higher the proportion is, the larger the proportion of vegetated soft and hard surfaces are in a site, the more places there are for birds to inhabit, and the higher the diversity and recovery of birdsong species.
- (3)
- Vertical coverage had a positive correlation with each characteristic. The significance of perceived restorative landscape effects can be ranked as follows: Compatibility > Extent > Fascination > Being away. The significance of soundscape perception recovery can be ranked as follows: Fascination > Being away > Compatibility > Extent.
4. Discussion
4.1. Comparison of Perceived Visual and Auditory Restorative Benefits of Landscape Paths
- (1)
- Park paths have restorative benefits, and paths with tall trees and water bodies promote perceived restorative effects.
- (2)
- Birdsongs offer a significant recovery benefit; after introducing birdsongs, perceived recovery benefits are significantly improved.
- (3)
- When improving recovery efficiency, ductility levels are the highest, while attractiveness levels are the lowest.
4.2. Recovery Benefits of Birdsongs in Relation to Path Types
- (1)
- In terms of the restorative benefits of road space types, paths through wetlands and waterfront spaces have more benefits than paths through open spaces in forests in terms of four characteristics(Extent, Fascination, Compatibility, and Being away), but after introducing birdsongs, three characteristics (escape, compatibility, and extension) are greatly improved relative to the original values, though the difference found between the two types of paths is minor.
- (2)
- The effects of path types on restoration efficiency differ. Wetland and waterfront spaces present higher path values than open spaces in forests, and restorative effects are positive. Birdsongs have a stronger impact on the perceived restorative effects of site, but the effect on path types is not significant.
- (3)
- Under original landscape conditions, paths through waterfront spaces have more restorative effects than paths through wetlands; after introducing birdsongs, wetland paths have more restorative effects than waterfront paths.
4.3. Landscape Characteristic Indexes and Restorative Benefits
- (1)
- The lower the sky index, the higher the proportion of soft and hard surfaces, the greater the degree of vertical coverage, and the more obvious the perceived restorative effect.
- (2)
- The effect of the soft/hard ratio and vertical coverage on the restoration of visual interactive perceptions is stronger than that of visual landscape perceptions. Total PR and PRS scores are higher, and the restorative effect is stronger.
- (3)
- The proportion range is 29.9–65.6%. The higher the proportion of trees and shrubs present, the stronger the benefits of perceptual restoration.
4.4. Path Space Patterns of the Perceived Restorative Effects of Birdsong Soundscapes
- (1)
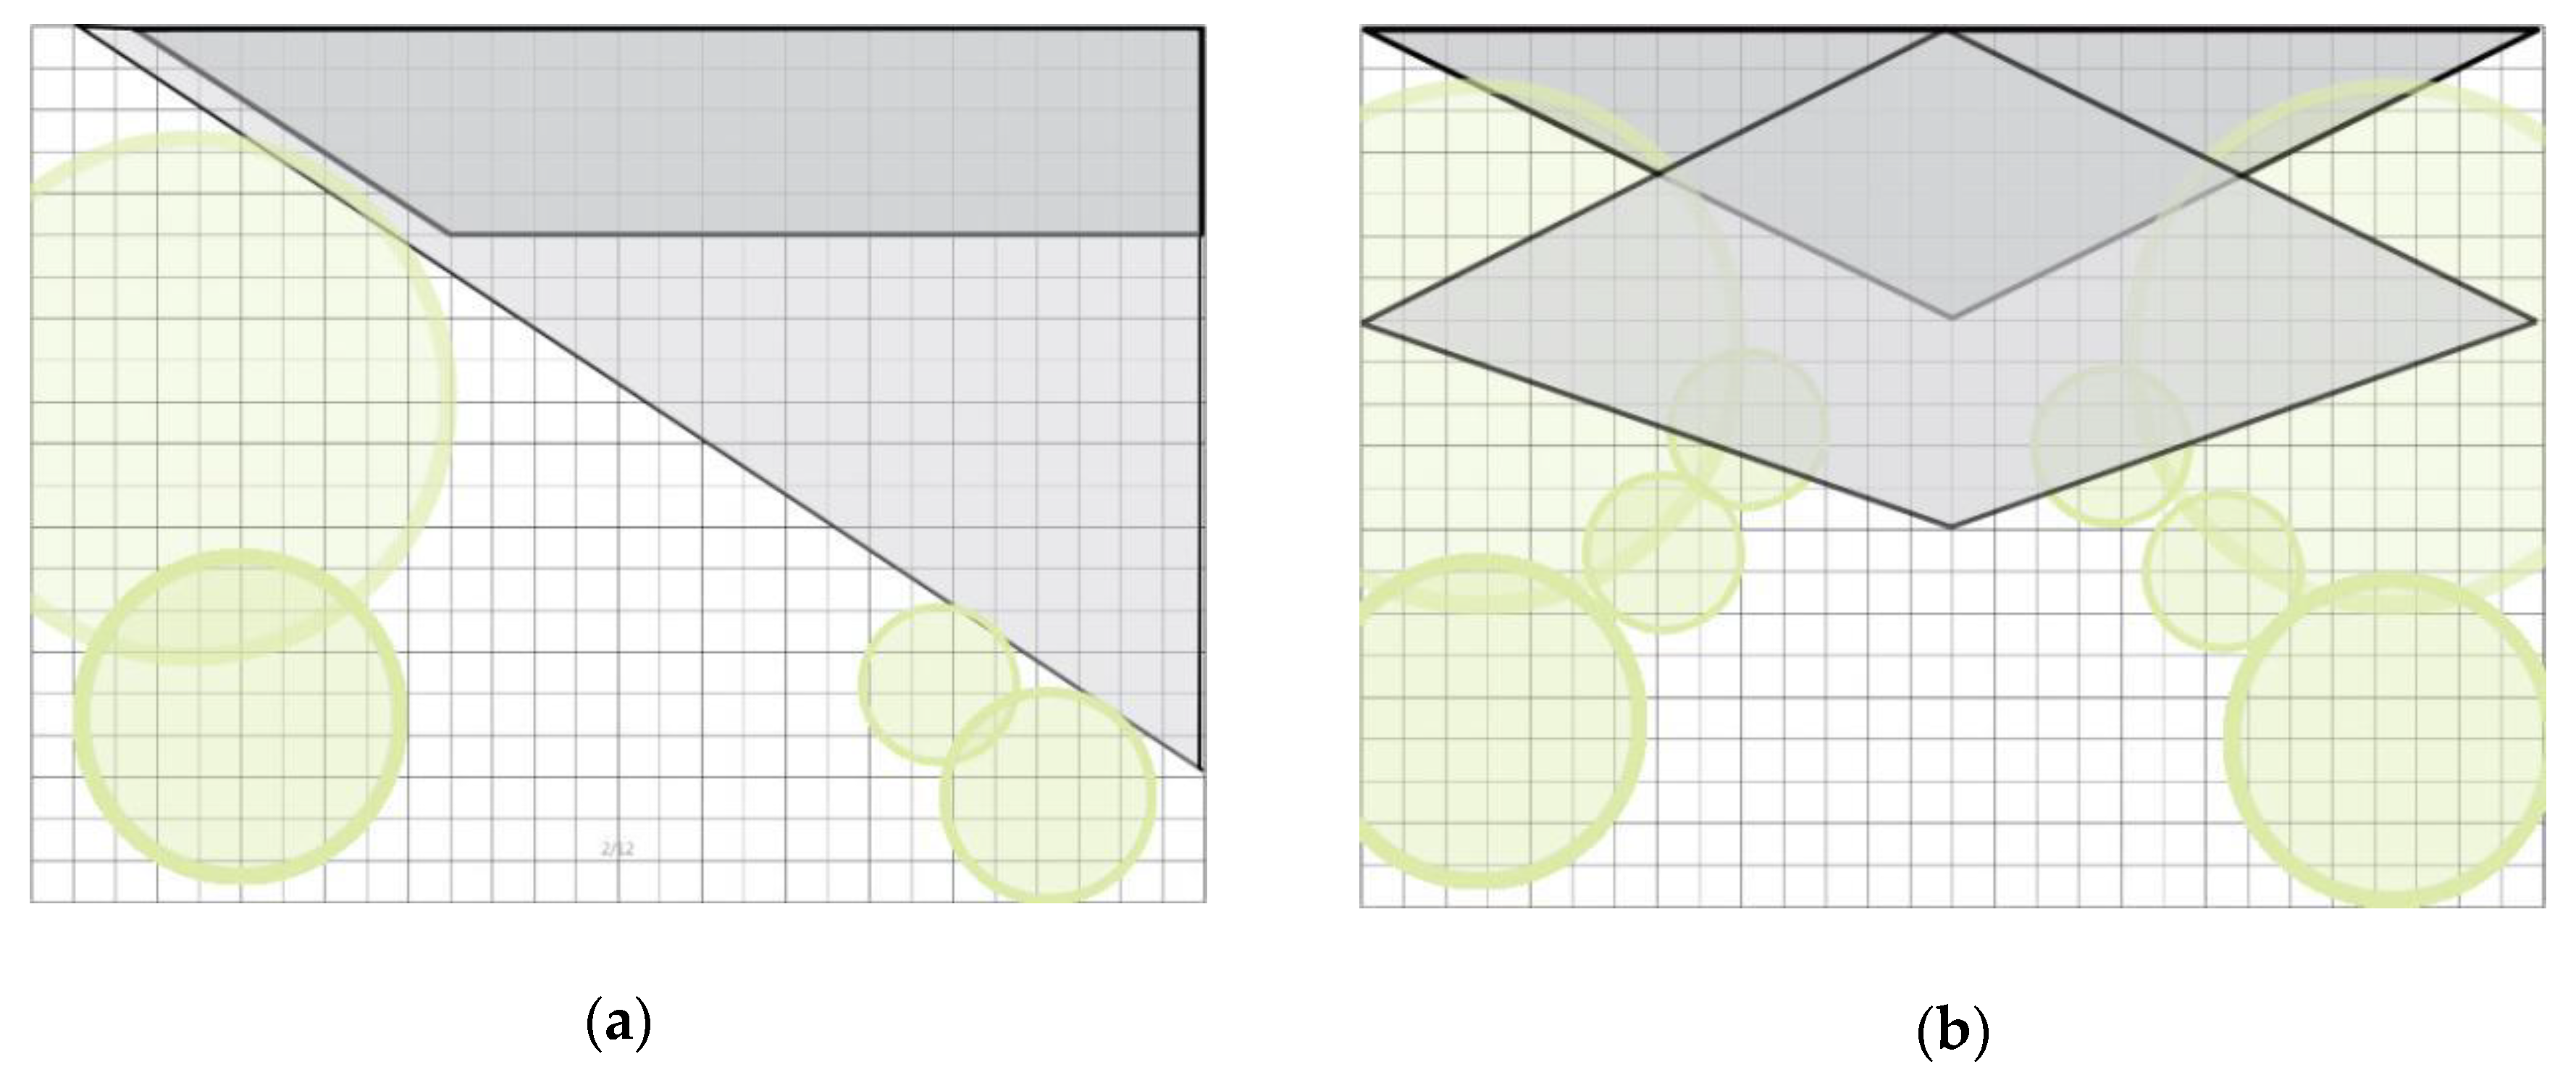
- Environmental model: When the sky index range is between 13% and 36%, the recovery effect is stronger. Therefore, an environmental model maximizing the recovery benefit is proposed. Gray areas in two kinds of environment models represent the sky area, which are divided into one side and two sides, with different lines expressing the value ranges of the sky. The proposed environmental models based on different space types are shown in Figure 9.
- (2)
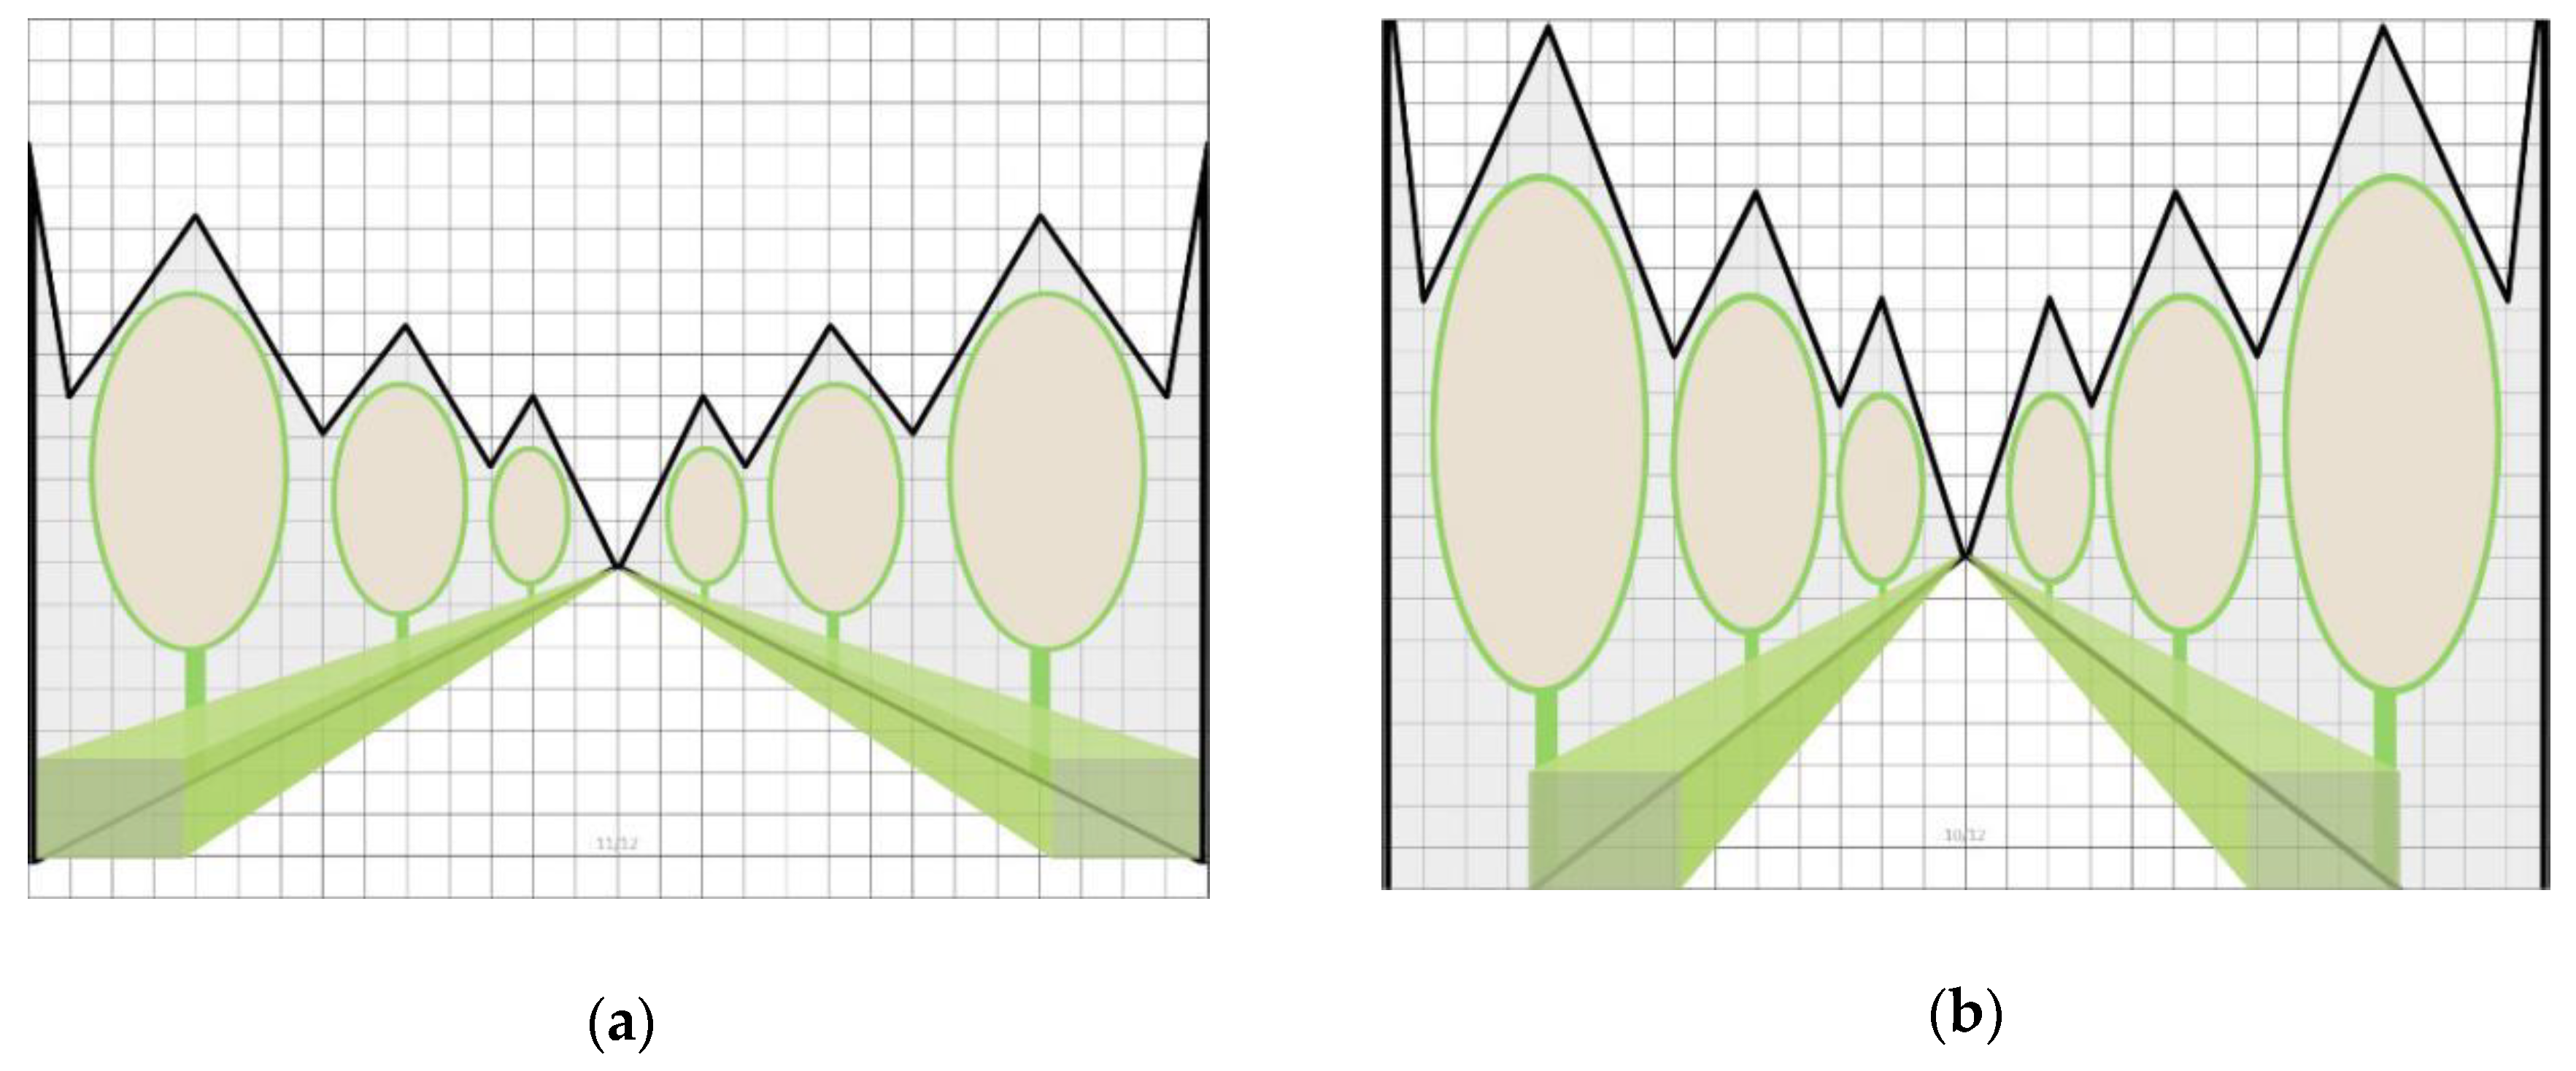
- In the vegetation model, when the vertical coverage range is 30.28–65.65%, the recovery effect is stronger; when the vertical coverage of trees is 30.28–38.6% and the vertical coverage of trees and shrubs is 32.5–65.6%, the recovery effect is stronger. Based on these data, the following two vegetation models (taking the simplest planting method as an example) are proposed to maximize the restorative effects of shrubs and trees, as shown in Figure 10.
- (3)
- In the path mode, when the soft/hard ratio ranges from 5–21, the recovery effect is strong. Therefore, according to scale data used to calculate the path size according to the range requirements, two kinds of path modes are proposed to maximize the recovery benefit (taking the simplest path mode as an example), as shown in Figure 11.
5. Conclusions
- (1)
- Among the perceived restorative effects observed through audio-visual interactions, birdsongs significantly improved perceived restorative effects, and birdsongs had the strongest impact on ductility.
- (2)
- After introducing birdsongs, the restorative effects of wetland path spaces were the strongest; for different types of path restorative effects, the difference was not significant.
- (3)
- The proportion of soft and hard surfaces present was positively correlated with the perceived recovery benefit. When the value was no less than 5, the perceived restorative effect was enhanced. When the proportion of trees and shrubs was 29.9–65.6%, the perceived restorative benefit was the strongest, showing that planting trees and shrubs along a path is the most desirable within this range. The sky index was negatively correlated with the perceived recovery benefit, and the perceived recovery benefit was most significant when the value was 13–36. This shows that the overall crown threshold for the planting of tall trees along a path should not be too high, and that the proportion of sky should be between 42% and 68%.
Author Contributions
Funding
Acknowledgments
Conflicts of Interest
Appendix A

| 12 + 68 = | 22 + 70 − 50 = | 67 − 34 = | 61 − 10 = | 80 − 72 + 18 = | 83 − 24 = |
|---|---|---|---|---|---|
| 78 − 23 = | 88 − 43 − 31 = | 76 − 26 = | 59 + 6 = | 70 − 48 = | 56 + 12 = |
| 12 + 48 = | 34 + 40 − 13 = | 84 − 66 = | 66 − 33 = | 79 − 40 = | 99 − 9 = |
| 25 − 14 = | 75 − 51 + 52 = | 39 + 8 = | 51 + 5 + 35 = | 72 − 54 = | 35 − 28 = |
| 27 + 56 = | 6 + 59 = | 73 − 41 = | 50 − 5 − 15 = | 33 + 38 = | 32 − 29 = |
| 54 − 45 = | 58 − 13 = | 68 − 40 = | 62 − 29 − 29 = | 81 − 36 = | 63 + 10 = |
| 13 + 49 = | 14 + 53 = | 16 + 27 = | 54 − 32 + 45 = | 92 − 38 = | 97 − 35 = |
| 65 − 27 = | 89 − 9 = | 89 − 9 = | 98 − 97 + 39 = | 60 − 9 = | 97 − 49 = |
| 14 + 35 − 28 = | 5 + 83 = | 73 − 21 = | 96 − 43 = | 62 − 33 = | 13 + 19 − 4 = |
| 23 + 32 = | 86 − 7 = | 93 − 52 = | 80 − 18 = | 39 − 15 = | 27 + 47 − 23 = |
| 55 + 36 = | 62 − 27 = | 28 − 8 = | 45 − 41 = | 41 − 5 = | 12 + 9 − 6 = |
| 29 + 37 = | 17 − 13 + 64 = | 19 − 12 = | 16 + 8 = | 43 − 29 = | 57 − 16 − 7 = |
| 28 + 64 = | 85 − 39 + 42 = | 92 − 36 = | 84 − 73 = | 53 − 5 = | 67 − 12 = |
| 41 + 38 = | 78 − 25 + 15 = | 30 + 44 = | 25 + 31 = | 25 + 44 = | 29 + 34 = |
| 69 − 58 = | 19 + 27 − 41 = | 39 + 35 = | 99 − 75 = | 86 − 70 = | 43 − 7 = |
| 58 − 28 = | 23 + 36 − 44 = | 50 − 9 = | 20 + 16 + 13 = | 74 − 8 = | 93 − 61 = |
| 33 − 24 = | 15 + 67 − 34 = | 69 − 7 = | 46 + 39 − 53 = | 47 + 29 = | 17 + 8 + 4 = |
| A .8 9 2 4 6 7 3 6 3 2 4 6 2 8 8 2 1 2 6 4 5 6 7 8 9 8 7 6 5 4 3 7 |
| B .3 7 7 6 5 5 3 2 1 9 1 7 6 5 3 3 3 7 3 1 4 2 1 2 2 1 8 2 9 1 0 3 |
| C .2 5 6 7 8 9 0 3 4 5 4 8 2 7 3 5 9 3 0 2 7 3 5 4 9 8 2 7 3 8 4 6 |
| D .6 4 8 2 4 6 8 0 9 1 3 3 5 5 9 1 0 2 3 8 2 8 7 3 0 9 7 5 7 4 9 1 |
| E .6 8 5 4 8 2 6 5 1 4 5 2 1 5 2 2 1 6 8 7 9 1 8 2 7 6 5 5 9 8 4 2 |
| F .5 8 4 5 6 4 5 5 4 5 7 8 2 9 1 5 4 2 6 2 2 3 5 1 2 5 5 7 3 9 1 8 |
| G .9 1 3 7 8 0 2 1 4 6 6 5 2 5 4 1 6 4 2 8 9 4 5 6 5 5 2 7 9 5 6 8 |
| H .8 5 1 2 6 7 3 9 0 1 9 8 7 2 4 6 3 7 5 4 5 5 8 7 2 1 9 8 2 5 6 7 |
| I .1 1 5 7 2 6 4 7 3 8 2 9 1 4 6 8 8 7 6 5 4 9 3 4 7 2 5 5 6 4 7 3 |
| J .4 5 9 7 2 5 5 6 4 6 5 2 1 2 6 4 1 9 2 8 6 4 5 5 7 3 1 0 2 5 4 8 |
| K .4 7 8 5 4 6 9 1 2 8 5 6 7 3 0 4 0 9 7 2 6 4 8 0 2 9 1 0 4 6 5 3 |
| L .5 8 2 4 6 9 0 5 0 7 0 8 0 6 0 4 0 9 1 7 3 4 6 9 1 5 9 7 5 4 5 8 |
| M .5 7 3 4 9 7 6 8 4 1 7 3 8 2 4 9 7 5 4 6 5 5 4 6 7 6 5 4 5 5 7 9 |
| N .9 1 8 4 6 4 5 7 3 2 0 6 7 5 4 9 1 2 8 7 5 4 6 0 1 8 2 7 3 6 4 5 |
| O .4 8 4 6 1 9 7 5 9 8 1 9 4 7 8 9 6 4 5 5 8 4 3 2 8 7 3 6 4 1 8 6 |
| F | p | |
|---|---|---|
| Fascination | 4.533 | 0.000 ** |
| Being away | 3.136 | 0.003 ** |
| Extent | 1.494 | 0.17 |
| Compatibility | 2.164 | 0.038 * |
| PRS | 3.095 | 0.004 ** |
| Kruskal-Wallis Results | ||||||||||
|---|---|---|---|---|---|---|---|---|---|---|
| Section | Kruskal-Wallis Test Statistics | p | ||||||||
| A (n = 30) | B (n = 30) | C (n = 30) | D (n = 30) | E (n = 30) | F (n = 30) | G (n = 30) | H (n = 30) | |||
| Fascination | 4.750 | 5.000 | 5.500 | 5.500 | 5.500 | 5.500 | 4.750 | 6.000 | 31.929 | 0.000 ** |
| Being away | 4.500 | 4.500 | 5.250 | 4.500 | 5.500 | 5.000 | 4.500 | 5.500 | 22.581 | 0.002 ** |
| Extent | 4.500 | 4.750 | 4.500 | 4.250 | 4.500 | 4.500 | 4.500 | 4.750 | 8.781 | 0.269 |
| Compatibility | 4.500 | 4.500 | 4.500 | 3.500 | 4.500 | 4.250 | 4.500 | 4.500 | 13.510 | 0.061 |
| PRS | 4.620 | 4.750 | 4.815 | 4.560 | 4.880 | 4.815 | 4.500 | 5.060 | 18.898 | 0.009 ** |
| Kruskal–Wallis Results | ||||||||||
|---|---|---|---|---|---|---|---|---|---|---|
| Section | Kruskal-Wallis Test Statistics | p | ||||||||
| A (n = 30) | B (n = 30) | C (n = 30) | D (n = 30) | E (n = 30) | F (n = 30) | G (n = 30) | H (n = 30) | |||
| Fascination | 5.330 | 5.000 | 5.000 | 5.330 | 5.165 | 5.330 | 5.670 | 6.000 | 10.725 | 0.151 |
| Being away | 4.500 | 5.000 | 4.375 | 5.500 | 5.125 | 5.125 | 5.125 | 5.625 | 20.197 | 0.005 ** |
| Extent | 4.500 | 4.670 | 4.835 | 4.670 | 4.670 | 5.330 | 4.670 | 4.670 | 10.710 | 0.152 |
| Compatibility | 4.835 | 5.000 | 5.835 | 5.330 | 5.330 | 5.835 | 5.500 | 5.500 | 15.917 | 0.026 * |
| PRS | 4.540 | 4.890 | 5.020 | 5.250 | 5.115 | 5.390 | 5.250 | 5.325 | 11.539 | 0.117 |
References
- Kaplan, S. The restorative benefits of nature: Toward an integrative framework. J. Environ. Psychol. 1995, 15, 169–182. [Google Scholar] [CrossRef]
- Ulrich, R.S. View Through a window may influence recovery from surgery. Science 1984, 224, 420–421. [Google Scholar] [CrossRef] [PubMed] [Green Version]
- Hartig, T.; Evans, G.W.; Jamner, L.D.; Davis, D.S.; Gärling, T. Tracking restoration in natural and urban field settings. J. Environ. Psychol. 2003, 23, 109–123. [Google Scholar] [CrossRef]
- Adevi, A.A.; Mårtensson, F. Stress rehabilitation through garden therapy: The garden as a place in the recovery from stress. Urban For. Urban Green. 2013, 12, 230–237. [Google Scholar] [CrossRef]
- Artmann, M.; Chen, X.W.; Iojă, C.; Hof, A.; Onose, D.; Poniży, L.; Lamovšek, A.Z.; Breuste, J. The role of urban green spaces in care facilities for elderly people across European cities. Urban For. Urban Green. 2017, 27, 203–213. [Google Scholar] [CrossRef]
- Dzhambov, A.M.; Hartig, T.; Tilov, B.; Atanasova, V.; Makakova, D.R.; Dimitrova, D.D. Residential greenspace is associated with mental health via intertwined capacity-building and capacity-restoring pathways. Environ. Res. 2019, 178, 108708. [Google Scholar] [CrossRef]
- Browning, M.H.; Lee, K.; Wolf, K.L. Tree cover shows an inverse relationship with depressive symptoms in elderly residents living in U.S. nursing homes. Urban For. Urban Green. 2019, 41, 23–32. [Google Scholar] [CrossRef]
- Jiang, B.; Chang, C.Y.; Sullivan, W.C. A dose of nature: Tree cover, stress reduction, and gender differences. Landsc. Urban Plan. 2014, 132, 26–36. [Google Scholar] [CrossRef]
- McEachan, R.R.C.; Prady, S.L.; Smith, G.; Fairley, L.; Cabieses, B.; Gidlow, C.; Wright, J.; Dadvand, P.; van Gent, D.; Nieuwenhuijsen, M.J. The association between green space and depressive symptoms in pregnant women: Moderating roles of socioeconomic status and physical activity. J. Epidemiol. Community Health 2016, 70, 253–259. [Google Scholar] [CrossRef] [Green Version]
- Markevych, I.; Schoierer, J.; Hartig, T.; Chudnovsky, A.; Hystad, P.; Dzhambov, A.M.; de Vries, S.; Triguero-Mas, M.; Brauer, M.; Nieuwenhuijsen, M.J.; et al. Exploring pathways linking greenspace to health: Theoretical and methodological guidance. Environ. Res. 2017, 158, 301–317. [Google Scholar] [CrossRef]
- Dadvand, P.; Bartoll, X.; Basagaña, X.; Dalmau-Bueno, A.; Martinez, D.; Ambros, A.; Cirach, M.; Triguero-Mas, M.; Gascon, M.; Borrell, C.; et al. Green spaces and general health: Roles of mental health status, social support, and physical activity. Environ Int. 2016, 91, 161–167. [Google Scholar] [CrossRef] [PubMed] [Green Version]
- Dahmann, N.; Wolch, J.; Joassart-Marcelli, P.; Reynolds, K.; Jerrett, M. The active city? Disparities in provision of urban public recreation resources. Health Place 2010, 16, 431–445. [Google Scholar] [CrossRef] [PubMed]
- Sister, C.; Wolch, J.; Wilson, J. Got green? Addressing environmental justice in park provision. GeoJournal 2010, 75, 229–248. [Google Scholar] [CrossRef]
- He, M.; Pang, H. A Review of soundscape research history and progress. Landsc. Arch. 2016, 88–97. (In Chinese) [Google Scholar] [CrossRef]
- Irvine, K.N.; Devine-Wright, P.; Payne, S.R.; Fuller, R.A.; Painter, B.; Gaston, K.J. Green space, soundscape and urban sustainability: An interdisciplinary, empirical study. Local Environ. 2009, 14, 155–172. [Google Scholar] [CrossRef]
- Jabben, J.; Weber, M.; Verheijen, E. A framework for rating environmental value of urban parks. Sci. Total Environ. 2015, 508, 395–401. [Google Scholar] [CrossRef]
- Liu, J.J.; Huang, J.P.; Chen, B.; Zhou, T.; Yan, H.R.; Jin, H.C.; Huang, Z.W.; Zhang, B.D. Comparisons of PBL heights derived from CALIPSO and ECMWF reanalysis data over China. J. Quant. Spectrosc. Radiat. Transf. 2015, 153, 102–112. [Google Scholar] [CrossRef]
- Liu, J.; Kang, J.; Behm, H.; Luo, T. Effects of landscape on soundscape perception: Soundwalks in city parks. Landsc. Urban Plan. 2014, 123, 30–40. [Google Scholar] [CrossRef] [Green Version]
- Hong, J.Y.; Jeon, J.Y. Relationship between spatiotemporal variability of soundscape and urban morphology in a multifunctional urban area: A case study in Seoul, Korea. Build. Environ. 2017, 126, 382–395. [Google Scholar] [CrossRef]
- Liu, J.; Wang, Y.J.; Zimmer, C.; Kang, J.; Yu, T.H. Factors associated with soundscape experiences in urban green spaces: A case study in Rostock, Germany. Urban For. Urban Green. 2019, 37, 135–146. [Google Scholar] [CrossRef]
- Cox, D.T.C.; Gaston, K.J. Likeability of garden birds: Importance of species knowledge & richness in connecting people to nature. PLoS ONE 2015, 10, e0141505. [Google Scholar] [CrossRef] [Green Version]
- Ratcliffe, E.; Gatersleben, B.; Sowden, P.T. Bird sounds and their contributions to perceived attention restoration and stress recovery. J. Environ. Psychol. 2013, 36, 221–228. [Google Scholar] [CrossRef] [Green Version]
- Björk, J.; Albin, M.; Grahn, P.; Jacobsson, H.; Ardö, J.; Wadbro, J.; Ostergren, P.O.; Skärbäck, E. Recreational values of the natural environment in relation to neighbourhood satisfaction, physical activity, obesity and wellbeing. J. Epidemiol. Community Health 2008, 62, e2. [Google Scholar] [CrossRef] [PubMed]
- Mynott, J. Birdscapes: Birds in Our Imagination and Experience; Princeton University Press: Princeton, NJ, USA, 2009. [Google Scholar]
- Cocker, M.; Tipling, D. Birds & People; Jonathan Cape: London, UK, 2013. [Google Scholar]
- Bento Coelho, J.L.; Boubezari, M. On the soundscape of urban parks. J. Acoust. Soc. Am. 2011, 130, 2531. [Google Scholar] [CrossRef]
- Zhang, Y. Research on soundscape restorative benefits of urban open space and promotion strategy of the acoustic environment quality. New Arch. 2014, 165, 18–22. [Google Scholar] [CrossRef]
- Ratcliffe, E.; Gatersleben, B.; Sowden, P.T. Associations with bird sounds: How do they relate to perceived restorative potential? J. Environ. Psychol. 2016, 47, 136–144. [Google Scholar] [CrossRef]
- Zhao, J.W.; Xu, W.Y.; Ye, L. Effects of auditory-visual combinations on perceived restorative potential of urban green space. Appl. Acoust. 2018, 141, 169–177. [Google Scholar] [CrossRef]
- Wildlife Institute of Heilongjiang Province. Avifauna of Heilongjiang Province; China Forestry Press: Beijing, China, 1992; pp. 1–398. [Google Scholar]
- Nordh, H.; Hartig, T.; Hagerhall, C.M.; Fry, G. Components of small urban parks that predict the possibility for restoration. Urban For. Urban Green. 2009, 8, 225–235. [Google Scholar] [CrossRef]


| Profile | Path Type | Prime Number of Trees and Shrubs | Number of Path Pixels | Soft/Hard Ratio | Vertical Coverage (%) | Sky Index (%) |
|---|---|---|---|---|---|---|
| Section A | Waterfront wetland (open) | 135 | 53 | 8.55 | 37.62 | 13.95 |
| Section B | Waterfront trestle | 159 | 83 | 3.01 | 28.19 | 43.37 |
| Section C | Treed grassland | 186 | 78 | 14.83 | 56.31 | 24.66 |
| Section D | Treed grassland | 167 | 24 | 14.31 | 30.28 | 15.14 |
| Section E | Waterfront trail | 386 | 118 | 3.60 | 61.10 | 6.12 |
| Section F | Waterfront | 247 | 56 | 5.41 | 61.29 | 13.95 |
| Section G | Wetland | 178 | 60 | 6.68 | 65.65 | 21.60 |
| Section H | Waterfront (open) | 146 | 133 | 1.57 | 26.67 | 36.73 |
| Instrument | Model and Origin | Purpose | Parameter Range |
|---|---|---|---|
| Sound meters | BSWA801/China | Measurement of sound pressure level and frequency | Measure: 24 dBA~140 dBA; Frequency: 0.5 Hz~20 kHz |
| High fidelity recorder | FOSTEX FR-2LE/Japan | Record birdsong | Recording frequency: 20 Hz–20 kHz ± 2 dB (FS 44.1/48 kHz) |
| 3D camera | Fuji 3DW1/China | 3D photo shooting | Effective pixels: 10 megapixel; Highest resolution: 3648 × 2736 |
| Mini audio | JBL Flip4/America | Playing processed audio | Frequency response: 70 Hz–20 KHz |
| Restorative Environmental Characteristics | Restorative Experience with the Landscape | Semantic Description |
|---|---|---|
| Fascination | The appeal of the environment | Like - dislike Beautiful - mediocre |
| Being away | A sense of relaxation | Stay - leave Comfortable - uncomfortable |
| Compatibility | Exploration of features | Rich - monotonous Fun - boring |
| Extent | An intoxicating environment | Harmony - conflict Immersion - separation |
| Variable Name | Fascination | Being Away | Extent | Compatibility | PRS/PRSS | |
|---|---|---|---|---|---|---|
| Sky index | correlation coefficient (landscape) | −0.564 ** | −0.452 ** | −0.443 ** | −0.512 ** | −0.611 ** |
| correlation coefficient (soundscape) | −0.660 ** | −0.535 ** | −0.412 ** | −0.389 ** | −0.739 ** | |
| Soft/hard ratio | correlation coefficient (landscape) | 0.721 ** | 0.343 ** | 0.385 ** | 0.574 ** | 0.539 ** |
| correlation coefficient (soundscape) | 0.577 ** | 0.433 ** | 0.628 ** | 0.541 ** | 0.668 ** | |
| Vertical coverage | correlation coefficient (landscape) | 0.565 ** | 0.475 ** | 0.587 ** | 0.621 ** | 0.613 ** |
| correlation coefficient (soundscape) | 0.711 ** | 0.643 ** | 0.457 ** | 0.627 ** | 0.704 ** | |
| Tree vertical coverage | correlation coefficient (landscape) | 0.621 ** | 0.443 ** | 0.475 ** | 0.642 ** | 0.679 ** |
| correlation coefficient (soundscape) | 0.644 ** | 0.463 ** | 0.396 ** | 0.484 ** | 0.539 ** | |
| Shrub vertical coverage | correlation coefficient (landscape) | 0.501 ** | 0.383 ** | 0.512 ** | 0.597 ** | 0.522 ** |
| correlation coefficient (soundscape) | 0.621 ** | 0.644 ** | 0.458 ** | 0.534 ** | 0.539 ** | |
| Herbaceous vertical coverage | correlation coefficient (landscape) | 0.533 ** | 0.463 ** | 0.379 ** | 0.572 ** | 0.596 ** |
| correlation coefficient (soundscape) | 0.618 ** | 0.435 ** | 0.523 ** | 0.412 ** | 0.539 ** | |
© 2020 by the authors. Licensee MDPI, Basel, Switzerland. This article is an open access article distributed under the terms and conditions of the Creative Commons Attribution (CC BY) license (http://creativecommons.org/licenses/by/4.0/).
Share and Cite
Zhu, X.; Gao, M.; Zhao, W.; Ge, T. Does the Presence of Birdsongs Improve Perceived Levels of Mental Restoration from Park Use? Experiments on Parkways of Harbin Sun Island in China. Int. J. Environ. Res. Public Health 2020, 17, 2271. https://0-doi-org.brum.beds.ac.uk/10.3390/ijerph17072271
Zhu X, Gao M, Zhao W, Ge T. Does the Presence of Birdsongs Improve Perceived Levels of Mental Restoration from Park Use? Experiments on Parkways of Harbin Sun Island in China. International Journal of Environmental Research and Public Health. 2020; 17(7):2271. https://0-doi-org.brum.beds.ac.uk/10.3390/ijerph17072271
Chicago/Turabian StyleZhu, Xun, Ming Gao, Wei Zhao, and Tianji Ge. 2020. "Does the Presence of Birdsongs Improve Perceived Levels of Mental Restoration from Park Use? Experiments on Parkways of Harbin Sun Island in China" International Journal of Environmental Research and Public Health 17, no. 7: 2271. https://0-doi-org.brum.beds.ac.uk/10.3390/ijerph17072271