Comparative Study of Dietary Patterns by Living Arrangements: The Korea National Health and Nutrition Examination Survey (KNHANES) 2013–2015


Abstract
:1. Introduction
2. Materials and Methods
2.1. Study Design
2.2. Data Source and Study Sample
2.3. Measurements
2.3.1. The Food Frequency Questionnaire
2.3.2. Study Variables
2.3.3. Data Procedures
2.4. Data Analysis
2.5. Ethical Considerations
3. Results
3.1. Characteristics of Participants by Living Arrangement
3.2. Identification of Dietary Patterns
3.3. Dietary Patterns and Characteristics of Participants by Living Arrangement
3.4. Factors Associated with Dietary Patterns depending on Living Arrangement
4. Discussion
4.1. Practical Implications
4.2. Limitations
5. Conclusions
Author Contributions
Funding
Conflicts of Interest
References
- Inter Press Service. The Rise of One-Person Households. Available online: http://www.ipsnews.net/2017/02/the-rise-of-one-person-households (accessed on 6 January 2020).
- National Statistical Office. Estimated Future Household: 2015~2045. Available online: http://kostat.go.kr/portal/korea/kor_nw/1/1/index.board?bmode=read&aSeq=359963 (accessed on 6 January 2020).
- Korea Rural Economic Institute. Impact of Food Market and Policy Tasks According to Increase of Single-person Households. Available online: http://library.krei.re.kr/#/search/detail/395430 (accessed on 6 January 2020).
- KB Financial Group Institute. KB Research Report: 2018 Korea Single-Person Households Report. Available online: https://www.kbfg.com/kbresearch/report/reportView.do?reportId=1003700 (accessed on 6 January 2020).
- Oh, Y.J. Increasing Single-person Households, the Effects of Eating Alone, and Analysis of Dietary Behavior; The Effect of Increasing Population by Social Changes on Chronic Diseases and Socioeconomic; The Korean Society of Community Nutrition Summer Symposium, Seoul University: Seoul, Korea, 2016. [Google Scholar]
- Sun, J.; Buys, N.J.; Hills, A.P. Dietary pattern and its association with the prevalence of obesity, hypertension and other cardiovascular risk factors among Chinese older adults. Int. J. Environ. Res. Public Health 2014, 11, 3956–3971. [Google Scholar] [CrossRef] [PubMed]
- World Health Organization. Global Action Plan for the Prevention and Control of NCDs 2013–2020. Available online: https://www.who.int/nmh/events/ncd_action_plan/en/ (accessed on 6 January 2020).
- Cho, E.R.; Shin, A.; Lim, S.Y.; Kim, J. Dietary patterns and their associations with health behaviours in Korea. Public Health Nutr. 2011, 14, 356–364. [Google Scholar] [CrossRef] [PubMed] [Green Version]
- Hu, F.B. Dietary pattern analysis: A new direction in nutritional epidemiology. Curr. Opin. Lipidol. 2002, 13, 3–9. [Google Scholar] [CrossRef] [PubMed]
- Korea Centers for Disease Control and Prevention. The Sixth Korea National Health and Nutrition Examination Survey (KNHANES VI). Available online: https://knhanes.cdc.go.kr/knhanes/eng/index.do (accessed on 6 January 2020).
- Kang, M.; Joung, H.; Lim, J.H.; Lee, Y.S.; Song, Y.J. Secular trend in dietary patterns in a Korean adult population, using the 1998, 2001, and 2005 Korean National Health and Nutrition Examination Survey. Korean J. Nutr. 2011, 44, 152–161. [Google Scholar] [CrossRef]
- Kim, B.; Joo, N. Structural relations in the effect of convenience food satisfaction and quality of life according to dietary style: Comparative study of singles in metropolitan area of Korea, Japan and China. Nutr. Res. Pract. 2014, 8, 312–318. [Google Scholar] [CrossRef] [PubMed] [Green Version]
- Oh, Y.J. Considering single household for new health vulnerable groups. Wkly. Issue 2017, 4, 1–8. [Google Scholar]
- Kim, D.W.; Song, S.; Lee, J.E.; Oh, K.; Shim, J.; Kweon, S.; Paik, H.Y.; Joung, H. Reproducibility and validity of an FFQ developed for the Korea National Health and Nutrition Examination Survey (KNHANES). Public Health Nutr. 2015, 18, 1369–1377. [Google Scholar] [CrossRef]
- Korean Ministry of Health and Welfare. The Physical Activity Guide for Koreans. Available online: http://www.mohw.go.kr/react/jb/sjb030301vw.jsp?PAR_MENU_ID=03&MENU_ID=032901&CONT_SEQ=337139&page=1 (accessed on 6 January 2020).
- Korean Society of Sleep Medicine. Appropriate Sleep Time. Available online: http://www.sleepmed.or.kr/sleep/sleep02.html (accessed on 6 January 2020).
- Little, R.J.A.; Rubin, D.B. Statistical Analysis with Missing Data, 2nd ed.; Wiley Interscience: Hoboken, NJ, USA, 2002; pp. 1–408. [Google Scholar]
- White, I.R.; Royston, P.; Wood, A.M. Multiple imputation using chained equations: Issues and guidance for practice. Stat. Med. 2011, 30, 377–399. [Google Scholar] [CrossRef]
- Little, R.J.A. A test of missing completely at random for multivariate data with missing values. J. Am. Stat. Assoc. 1988, 83, 1198–1202. [Google Scholar] [CrossRef]
- Caliński, T.; Harabasz, J. A dendrite method for cluster analysis. Commun. Stat. 1974, 3, 1–27. [Google Scholar] [CrossRef]
- Wegener, D.T.; Fabrigar, L.R. Exploratory Factor Analysis Understanding Statistics; Oxford University Press: New York, NY, USA, 2012; pp. 1–159. [Google Scholar]
- Lim, H.; Kim, S.Y.; Wang, Y.; Lee, S.J.; Oh, K.; Sohn, C.Y.; Moon, Y.M.; Jee, S.H. Preservation of a traditional Korean dietary pattern and emergence of a fruit and dairy dietary pattern among adults in South Korea: Secular transitions in dietary patterns of a prospective study from 1998 to 2010. Nutr. Res. 2014, 34, 760–770. [Google Scholar] [CrossRef] [PubMed]
- Hanna, K.L.; Collins, P.F. Relationship between living alone and food and nutrient intake. Nutr. Rev. 2015, 73, 594–611. [Google Scholar] [CrossRef] [PubMed] [Green Version]
- Powell, L.M.; Isgor, Z.; Pipito, A.A.; Pugach, O.; Yaroch, A.L.; Zenk, S.N. Sugar-Sweetened Beverage Consumption among Adults, Cook County Illinois, 2017. Research Brief No. 100; Illinois Prevention Research Center, University of Illinois at Chicago: Chicago, IL, USA, 2017; pp. 1–4. Available online: https://illinoisprc.org/wp-content/uploads/2018/02/SSB-Consumption-Cook-County-IL-–-Illinois-PRC-Brief-No.100-Dec-2017.pdf (accessed on 6 January 2020).
- Kang, K.Y.; Kim, K.N.; Bae, E.J.; Byeon, C.H.; Kwon, B.W. Dietary patterns and depressive symptoms in Korean adults: Using data from 2010–2011 Korean Health and Nutrition Examination Survey. Korean J. Fam. Pract. 2015, 5, 77–83. [Google Scholar]
- Langsetmo, L.; Barr, S.I.; Dasgupta, K.; Berger, C.; Kovacs, C.S.; Josse, R.G.; Adachi, J.D.; Hanley, D.A.; Prior, J.C.; Brown, J.P.; et al. Dietary patterns in men and women are simultaneously determinants of altered glucose metabolism and bone metabolism. Nutr. Res. 2016, 36, 328–336. [Google Scholar] [CrossRef] [PubMed]
- Fransen, H.P.; Boer, J.M.A.; Beulens, J.W.J.; de Wit, G.A.; Bueno-de-Mesquita, H.B.; Hoekstra, J.; May, A.M.; Peeters, P.H.M. Associations between lifestyle factors and an unhealthy diet. Eur. J. Public Health 2017, 27, 274–278. [Google Scholar] [CrossRef]
- Buck, D.; Frosini, F. Clustering of Unhealthy Behaviours Over Time: Implications for Policy and Practice; The King’s Fund: London, UK, 2012; pp. 1–24. Available online: https://www.kingsfund.org.uk/sites/default/files/field/field_publication_file/clustering-of-unhealthy-behaviours-over-time-aug-2012.pdf (accessed on 6 January 2020).
- Campanini, M.Z.; Guallar-Castillón, P.; Rodríguez-Artalejo, F.; Lopez-Garcia, E. Mediterranean diet and changes in sleep duration and indicators of sleep quality in older adults. Sleep 2017, 40, zsw083. [Google Scholar] [CrossRef]
- Leech, R.M.; Worsley, A.; Timperio, A.; McNaughton, S.A. Understanding meal patterns: Definitions, methodology and impact on nutrient intake and diet quality. Nutr. Res. Rev. 2015, 28, 1–21. [Google Scholar] [CrossRef] [Green Version]
- Jin, H.J. For the relation between safety concern for food in restaurants or purchased outside and frequency of eating home food: Focused on household type. J. Consum. Policy Stud. 2018, 49, 1–21. [Google Scholar] [CrossRef]
- Moodie, R.; Stuckler, D.; Monteiro, C.; Sheron, N.; Neal, B.; Thamarangsi, T.; Lincoln, P.; Casswell, S.; Lancet NCD Action Group. Profits and pandemics: Prevention of harmful effects of tobacco, alcohol, and ultra-processed food and drink industries. Lancet 2013, 381, 670–679. [Google Scholar] [CrossRef]
- Ma, X.; Chen, Q.; Pu, Y.; Guo, M.; Jiang, Z.; Huang, W.; Long, Y.; Xu, Y. Skipping breakfast is associated with overweight and obesity: A systematic review and meta-analysis. Obes. Res. Clin. Pract. 2020, 14, 1–8. [Google Scholar] [CrossRef]
- Kim, Y.S.; Kim, B.R. A study on nutrition knowledge, dietary behaviors and evaluation of nutrient intakes of high school female students in Chuncheon area by frequency of breakfast. J. Korean Home Econo. Educ. Assoc. 2012, 24, 91–104. [Google Scholar]
- Korean Statistical Information Service. Single-Person Households by Region. Available online: http://kosis.kr/statHtml/statHtml.do?orgId=101&tblId=DT_1ES4I002S&conn_path=I2 (accessed on 21 March 2020).
- Seoul Metropolitan Government. ‘I Live Alone’ Era. Announced Personalized Support for Seoul Single-Person Households. Available online: http://opengov.seoul.go.kr/mediahub/18837734?tr_code=open (accessed on 6 January 2020).


| Variables | Categories | Total (n = 6719) | Living with Others (n = 6318) | Living Alone (n = 401) | χ2 | p |
|---|---|---|---|---|---|---|
| 100.0% | 93.8% | 6.2% | ||||
| Age | 19–34 years | 34.6 | 34.0 | 43.2 | 210.67 | 0.001 |
| 35–49 years | 36.0 | 37.0 | 22.2 | |||
| 50–64 years | 29.4 | 29.0 | 34.6 | |||
| Sex | Men | 50.2 | 49.5 | 61.6 | 130.55 | 0.001 |
| Women | 49.8 | 50.5 | 38.4 | |||
| Marital status | Single | 27.5 | 25.1 | 63.1 | 4114.93 | <0.001 |
| Married | 66.8 | 70.4 | 10.9 | |||
| Separated, widowed, or divorced | 5.7 | 4.5 | 26.0 | |||
| Economic status | Lowest | 8.4 | 7.5 | 22.0 | 671.70 | <0.001 |
| Lower-middle or upper-middle | 56.3 | 56.3 | 56.0 | |||
| Highest | 35.3 | 36.2 | 22.0 | |||
| Education | Elementary school or less | 6.9 | 6.3 | 14.2 | 208.98 | <0.001 |
| Middle and high school | 48.7 | 49.0 | 44.9 | |||
| Some college or higher | 44.4 | 44.7 | 40.9 | |||
| Smoking | Past smokers or non-smokers | 76.6 | 77.4 | 64.3 | 213.52 | <0.001 |
| Current smokers | 23.4 | 22.6 | 35.7 | |||
| Drinking | Non-alcohol drinking | 38.0 | 38.4 | 31.1 | 49.76 | 0.008 |
| Alcohol drinking | 62.0 | 61.6 | 68.9 | |||
| Exercise | Less than one day a week or never | 77.6 | 77.7 | 76.2 | 2.73 | 0.538 |
| More than two days a week | 22.4 | 22.3 | 23.8 | |||
| Weight control | Never tried to control the weight | 29.3 | 29.3 | 29.3 | 0.01 | 0.978 |
| Effort | 70.7 | 70.7 | 70.7 | |||
| Dining out | Less than once a month | 2.7 | 2.7 | 3.1 | 243.30 | <0.001 |
| 1–3 times a month | 13.8 | 13.8 | 12.9 | |||
| 1–6 times a week | 50.8 | 51.4 | 41.2 | |||
| Once a day | 21.1 | 21.1 | 21.7 | |||
| More than twice a day | 11.6 | 11.0 | 21.1 | |||
| Eating breakfast | None a week | 17.1 | 16.0 | 34.1 | 531.40 | <0.001 |
| 1–2 times a week | 12.7 | 12.7 | 13.0 | |||
| 3–4 times a week | 15.1 | 15.4 | 11.0 | |||
| 5–7 times a week | 55.1 | 55.9 | 41.9 | |||
| Sleep | 0–5 h a day | 12.7 | 12.5 | 16.0 | ||
| 6–8 h a day | 80.9 | 81.0 | 78.7 | 27.59 | 0.169 | |
| 9 h or more a day | 6.4 | 6.5 | 5.3 |
| Food Groups | Factor 1 | Factor 2 | Factor 3 | Factor 4 |
|---|---|---|---|---|
| Substitute Meal | Traditional Korean Meal | Healthy Dessert | Unhealthy Dessert | |
| Fast foods | 0.81 | −0.08 | −0.06 | 0.15 |
| Meat | 0.70 | 0.33 | 0.01 | 0.07 |
| Processed fish products | 0.70 | 0.15 | −0.01 | 0.11 |
| Poultry | 0.67 | 0.23 | −0.01 | 0.03 |
| Grains | 0.55 | 0.19 | 0.12 | 0.07 |
| Noodles | 0.54 | 0.24 | 0.09 | 0.08 |
| Bread | 0.49 | −0.11 | 0.45 | 0.23 |
| Rice cakes | 0.47 | 0.03 | 0.45 | −0.03 |
| Eggs | 0.43 | 0.29 | 0.22 | −0.05 |
| Vegetables | 0.18 | 0.78 | 0.29 | 0.05 |
| Beans | 0.09 | 0.71 | 0.19 | 0.00 |
| Fish | 0.13 | 0.70 | 0.22 | 0.06 |
| Soup | 0.31 | 0.64 | 0.11 | 0.07 |
| Seaweeds | 0.10 | 0.61 | 0.19 | 0.06 |
| Stew | 0.36 | 0.60 | −0.04 | 0.07 |
| Hardy plants | −0.08 | 0.23 | 0.71 | −0.08 |
| Fruits | 0.07 | 0.30 | 0.68 | −0.06 |
| Healthy drinks | 0.27 | 0.14 | 0.54 | 0.08 |
| Nuts | −0.14 | 0.34 | 0.52 | 0.02 |
| Saturated fats | −0.08 | 0.07 | −0.07 | 0.87 |
| Beverages | 0.17 | 0.14 | −0.07 | 0.75 |
| Sugar-based desserts | 0.39 | −0.03 | 0.20 | 0.75 |
| Total % of variance explained | 17.7% | 15.6% | 10.4% | 9.2% |
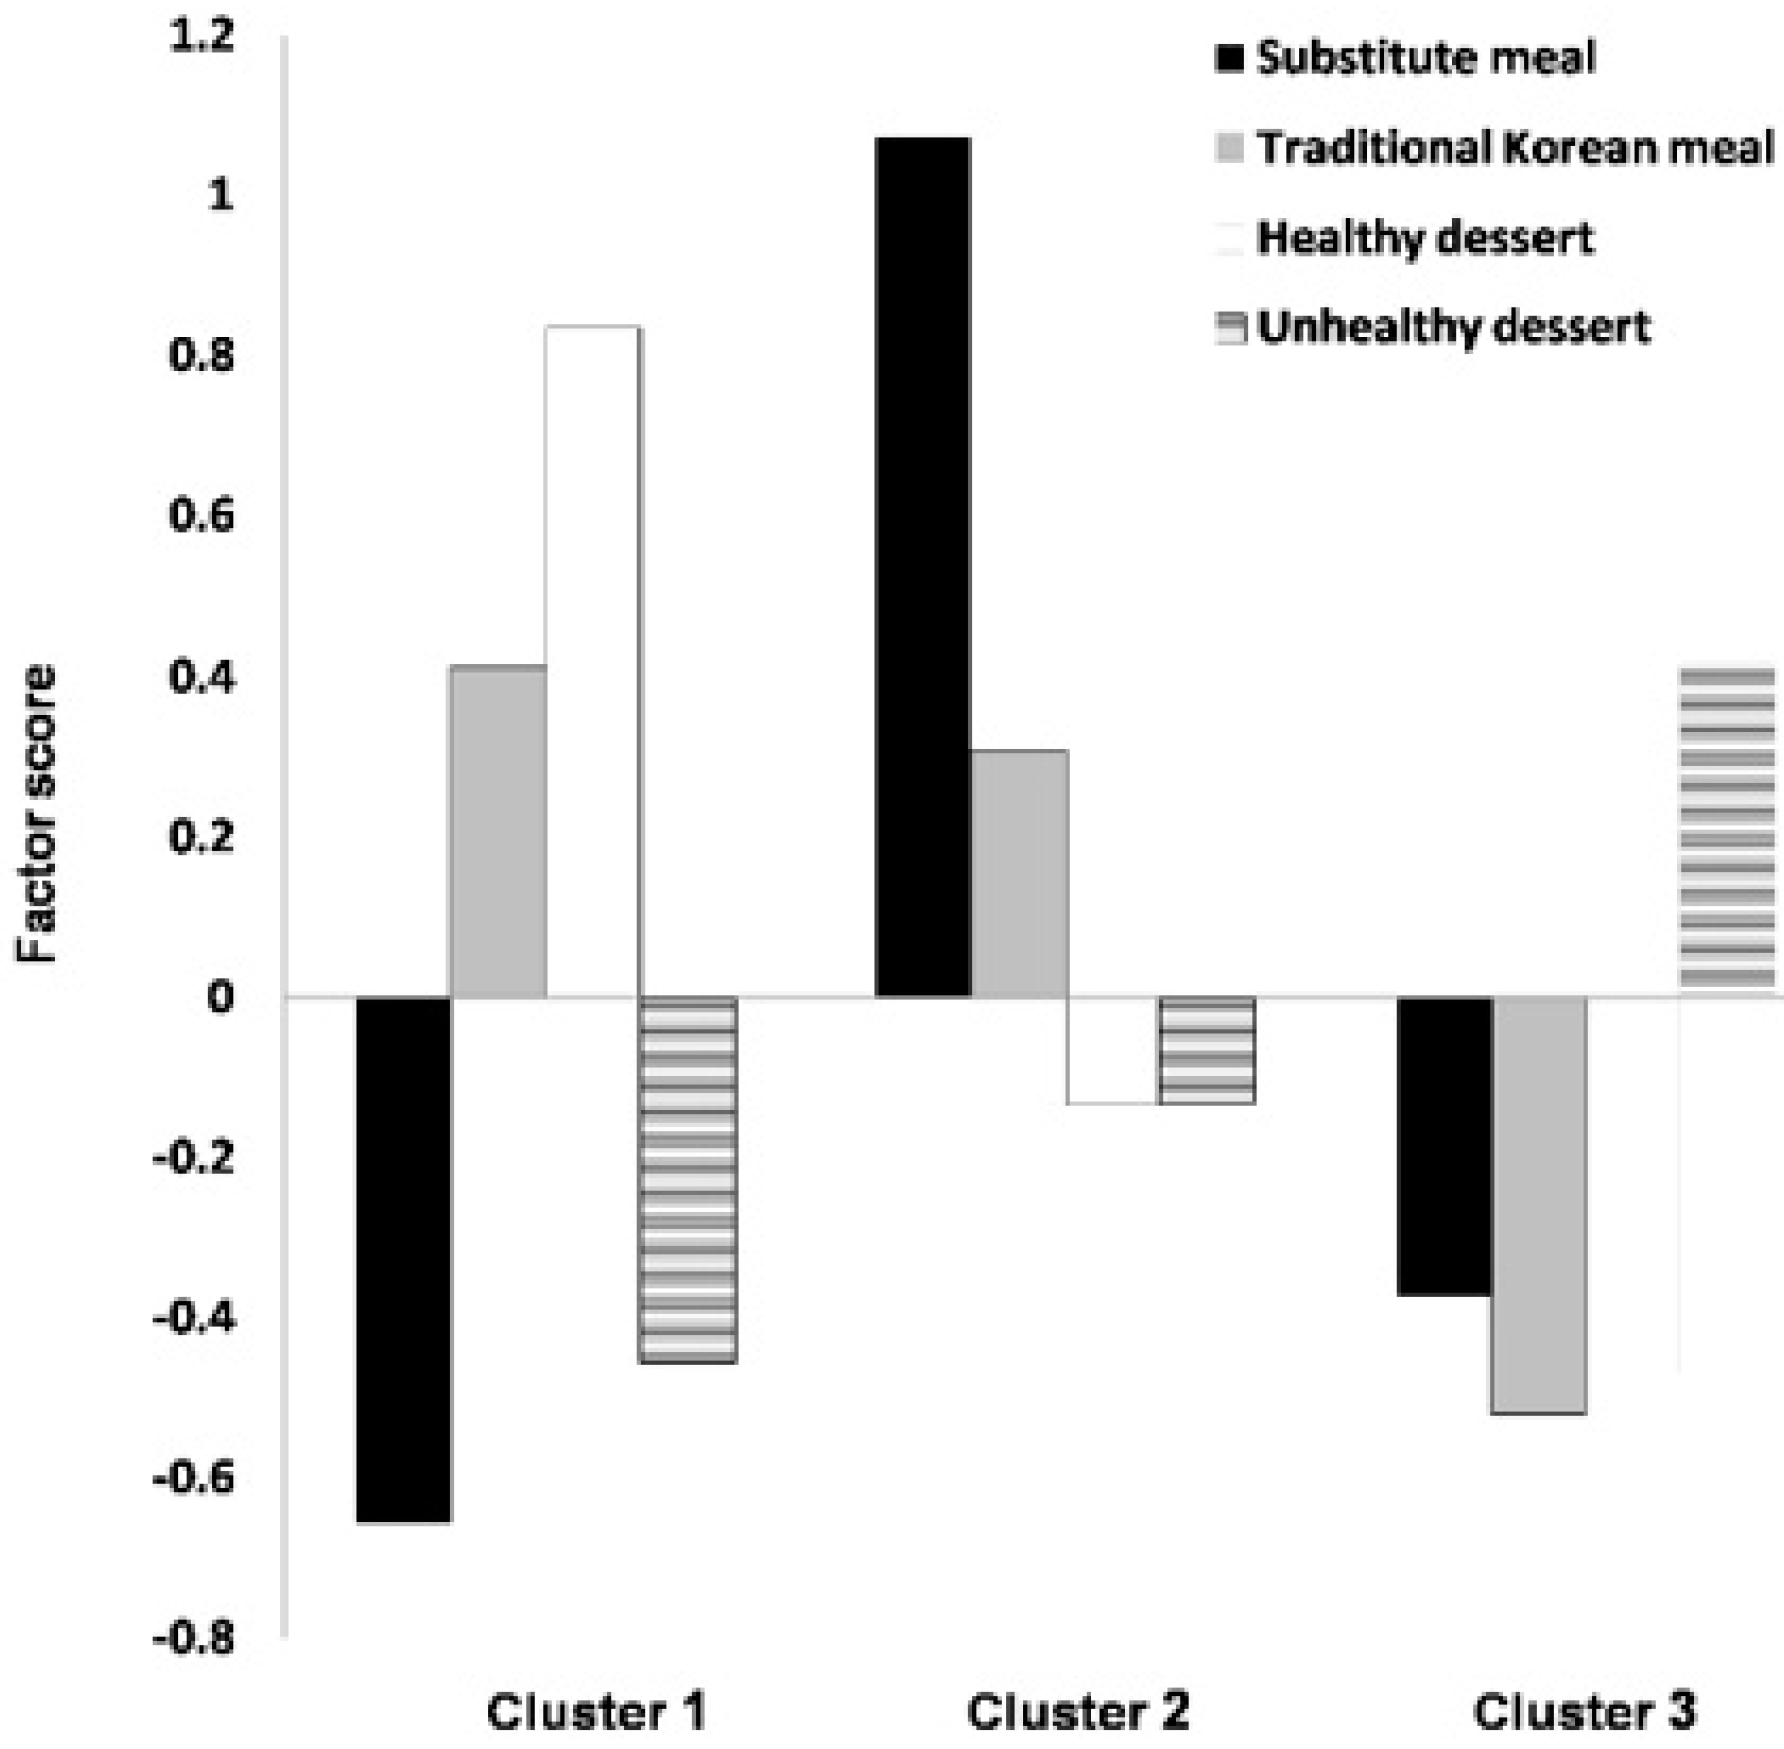
| Dietary Types | Cluster 1 (22.0%) | Cluster 2 (35.6%) | Cluster 3 (42.4%) | F | p |
|---|---|---|---|---|---|
| Substitute meal | −0.66 | 1.07 | −0.37 | 23,473.10 | <0.001 |
| Traditional Korean meal | 0.41 | 0.31 | −0.52 | 4651.37 | <0.001 |
| Healthy dessert | 0.84 | −0.13 | −0.47 | 8245.33 | <0.001 |
| Unhealthy dessert | −0.45 | −0.13 | 0.41 | 3098.75 | <0.001 |
| Living Arrangement | Living with Others (n = 6318) | Living Alone (n = 401) | ||||||||
|---|---|---|---|---|---|---|---|---|---|---|
| Variables/Categories | Traditional Meal with Healthy Dessert (n = 1768) | Meal Only (n = 2018) | Unhealthy Dessert (n = 2532) | χ2 | p | Traditional Meal with Healthy Dessert (n = 107) | Meal Only (n = 87) | Unhealthy Dessert (n = 207) | χ2 | p |
| Total Weighted % | 22.3% | 35.9% | 41.8% | 17.4% | 30.9% | 51.7% | ||||
| Age | ||||||||||
| 19–34 years | 12.4 | 49.2 | 32.6 | 6306.88 | <0.001 | 4.5 | 73.3 | 38.1 | 650.73 | <0.001 |
| 35–49 years | 28.2 | 40.6 | 38.5 | 21.3 | 17.5 | 25.3 | ||||
| 50–64 years | 59.4 | 10.2 | 28.9 | 74.2 | 9.2 | 36.6 | ||||
| Sex | ||||||||||
| Men | 26.8 | 54.9 | 56.9 | 2133.62 | <0.001 | 37.3 | 64.9 | 67.8 | 128.06 | 0.002 |
| Women | 73.2 | 45.1 | 43.1 | 62.7 | 35.1 | 32.2 | ||||
| Marital status | ||||||||||
| Single | 8.7 | 34.0 | 26.3 | 1887.21 | <0.001 | 19.4 | 89.6 | 61.9 | 576.85 | <0.001 |
| Married | 85.4 | 64.0 | 67.9 | 25.1 | 5.1 | 9.6 | ||||
| Separated, widowed, or divorced | 5.9 | 2.0 | 5.8 | 55.5 | 5.3 | 28.5 | ||||
| Economic status | ||||||||||
| Lowest | 7.6 | 5.0 | 9.8 | 503.95 | <0.001 | 24.0 | 12.0 | 27.3 | 72.33 | 0.073 |
| Lower-middle or upper-middle | 51.5 | 55.3 | 59.6 | 53.8 | 60.4 | 54.2 | ||||
| Highest | 40.9 | 39.7 | 30.6 | 22.2 | 27.6 | 18.5 | ||||
| Education | ||||||||||
| Elementary school or less | 11.1 | 1.2 | 8.3 | 1495.99 | <0.001 | 24.3 | 2.2 | 17.9 | 186.38 | <0.001 |
| Middle and high school | 52.8 | 43.9 | 51.3 | 49.0 | 41.8 | 45.4 | ||||
| Some college or higher | 36.1 | 54.9 | 40.4 | 26.7 | 56.0 | 36.7 | ||||
| Smoking | ||||||||||
| Past smokers or non-smokers | 91.8 | 76.2 | 70.8 | 1320.93 | <0.001 | 78.5 | 71.6 | 55.1 | 99.72 | 0.007 |
| Current smokers | 8.2 | 23.8 | 29.2 | 21.5 | 28.4 | 44.9 | ||||
| Drinking | ||||||||||
| Non-alcohol drinking | 54.6 | 28.7 | 38.1 | 1388.85 | <0.001 | 42.8 | 18.6 | 34.7 | 88.12 | 0.002 |
| Alcohol drinking | 45.4 | 71.3 | 61.9 | 57.2 | 81.4 | 65.3 | ||||
| Exercise | ||||||||||
| Less than one day a week or never | 76.6 | 75.6 | 80.1 | 86.07 | 0.004 | 81.8 | 68.6 | 78.9 | 35.15 | 0.102 |
| More than two days a week | 23.4 | 24.4 | 19.9 | 18.2 | 31.4 | 21.1 | ||||
| Weight control | ||||||||||
| Never tried to control the weight | 23.6 | 28.7 | 33.0 | 223.95 | <0.001 | 23.1 | 30.2 | 30.8 | 9.34 | 0.550 |
| Effort | 76.4 | 71.3 | 67.0 | 76.9 | 69.8 | 69.2 | ||||
| Dining out | ||||||||||
| Less than once a month | 4.6 | 0.3 | 3.7 | 2348.96 | <0.001 | 4.7 | 0.0 | 4.4 | 379.71 | <0.001 |
| 1–3 times a month | 23.7 | 5.6 | 15.6 | 33.7 | 0.7 | 13.3 | ||||
| 1–6 times a week | 51.5 | 54.5 | 48.8 | 45.3 | 41.3 | 39.7 | ||||
| Once a day | 14.2 | 24.8 | 21.5 | 7.4 | 26.9 | 23.3 | ||||
| More than twice a day | 6.0 | 14.8 | 10.4 | 8.9 | 31.1 | 19.3 | ||||
| Eating breakfast | ||||||||||
| None a week | 8.0 | 15.0 | 21.1 | 1896.77 | <0.001 | 9.9 | 39.9 | 38.7 | 301.99 | <0.001 |
| 1–2 times a week | 6.7 | 16.0 | 13.0 | 11.3 | 18.9 | 10.2 | ||||
| 3–4 times a week | 10.5 | 20.0 | 14.1 | 4.6 | 16.0 | 10.1 | ||||
| 5–7 times a week | 74.8 | 49.0 | 51.8 | 74.2 | 25.2 | 41.0 | ||||
| Sleep | ||||||||||
| 0–5 h a day | 15.4 | 9.9 | 13.1 | 194.43 | <0.001 | 24.6 | 9.2 | 17.2 | 59.57 | 0.121 |
| 6–8 h a day | 79.4 | 84.0 | 79.4 | 72.1 | 86.5 | 76.2 | ||||
| 9 h or more a day | 5.2 | 6.1 | 7.5 | 3.3 | 4.3 | 6.6 | ||||
| Variables/Categories | Living with Others | Living Alone | ||||||
|---|---|---|---|---|---|---|---|---|
| Meal Only Dietary Pattern | Unhealthy Dessert Dietary Pattern | Meal Only Dietary Pattern | Unhealthy Dessert Dietary Pattern | |||||
| OR | 95% CI | OR | 95% CI | OR | 95% CI | OR | 95% CI | |
| Sociodemographic characteristics | ||||||||
| Age (ref. 19–34 years) | ||||||||
| 35–49 years | 0.42 *** | 0.30, 0.58 | 0.75 | 0.54, 1.03 | 0.10 ** | 0.02, 0.44 | 0.15 * | 0.03, 0.65 |
| 50–64 years | 0.06 *** | 0.04, 0.09 | 0.25 *** | 0.18, 0.35 | 0.04 ** | 0.01, 0.23 | 0.08 ** | 0.02, 0.42 |
| Sex (ref. Women) | ||||||||
| Men | 2.73 *** | 2.17, 3.42 | 3.47 *** | 2.80, 4.29 | 2.37 | 0.83, 6.79 | 2.45 | 0.99, 6.02 |
| Marital status (ref. Single) | ||||||||
| Married | 0.92 | 0.64, 1.32 | 0.67 * | 0.47, 0.96 | 0.27 | 0.06, 1.21 | 0.52 | 0.16, 1.62 |
| Separated, widowed, or divorced | 0.72 | 0.42, 1.25 | 0.89 | 0.56, 1.41 | 0.23 * | 0.07, 0.77 | 0.56 | 0.21, 1.45 |
| Economic status (ref. Lower-middle or upper-middle) | ||||||||
| Lowest | 1.03 | 0.69, 1.53 | 1.19 | 0.85, 1.67 | 0.81 | 0.27, 2.43 | 1.83 | 0.88, 3.81 |
| Highest | 0.81 * | 0.67, 0.98 | 0.68 *** | 0.57, 0.82 | 0.76 | 0.25, 2.27 | 0.61 | 0.23, 1.58 |
| Education (ref. Middle and high school) | ||||||||
| Elementary school or less | 0.65 * | 0.43, 0.98 | 1.73 *** | 1.32, 2.27 | 0.72 | 0.13, 4.08 | 1.75 | 0.72, 4.24 |
| Some college or higher | 1.18 | 0.98, 1.43 | 0.95 | 0.79, 1.13 | 0.65 | 0.26, 1.64 | 0.74 | 0.34, 1.63 |
| Lifestyle characteristics | ||||||||
| Smoking (ref. Past smokers or non-smokers) | ||||||||
| Current smokers | 1.53 ** | 1.12, 2.09 | 1.89 *** | 1.43, 2.49 | 0.79 | 0.23, 2.66 | 2.01 | 0.74, 5.44 |
| Drinking (ref. Non-alcohol drinking) | ||||||||
| Alcohol drinking | 1.74 *** | 1.45, 2.08 | 1.21 * | 1.03, 1.43 | 1.41 | 0.58, 3.42 | 0.79 | 0.41, 1.53 |
| Exercise (ref. More than two days a week) | ||||||||
| Less than one day a week or never | 1.38 ** | 1.12, 1.71 | 1.68 *** | 1.37, 2.05 | 0.59 | 0.22, 1.54 | 0.63 | 0.27, 1.45 |
| Weight control (ref. Effort) | ||||||||
| Never tried to control the weight | 1.21 * | 1.00, 1.47 | 1.27 ** | 1.06, 1.52 | 3.13 * | 1.14, 8.54 | 1.74 | 0.73, 4.18 |
| Dining out (ref. More than twice a day) | ||||||||
| Less than once a month | 0.10 *** | 0.04, 0.27 | 1.02 | 0.64, 1.61 | < 0.001 | 0.47 | 0.10, 2.32 | |
| 1–3 times a month | 0.29 *** | 0.19, 0.45 | 0.89 | 0.62, 1.28 | 0.02 *** | 0.00, 0.16 | 0.31 | 0.09, 1.08 |
| 1–6 times a week | 0.73 | 0.51, 1.05 | 0.93 | 0.67, 1.30 | 0.38 | 0.13, 1.13 | 0.40 | 0.15, 1.09 |
| Once a day | 0.80 | 0.55, 1.15 | 0.99 | 0.68, 1.43 | 0.79 | 0.15, 4.26 | 1.13 | 0.23, 5.50 |
| Eating breakfast (ref. 5–7 times a week) | ||||||||
| None a week | 1.37 * | 1.01, 1.86 | 2.55 *** | 1.91, 3.41 | 3.77 ** | 1.39, 10.22 | 4.45 ** | 1.80, 11.02 |
| 1–2 times a week | 1.83 *** | 1.33, 2.51 | 1.95 *** | 1.43, 2.66 | 0.64 | 0.16, 2.60 | 0.48 | 0.12, 1.98 |
| 3–4 times a week | 1.62 ** | 1.22, 2.16 | 1.48 ** | 1.14, 1.92 | 6.95 ** | 1.74, 27.81 | 3.97 * | 1.24, 12.76 |
| Sleep (ref. 0–5 h a day) | ||||||||
| 6–8 h a day | 1.45 ** | 1.11, 1.89 | 1.13 | 0.90, 1.43 | 3.63 * | 1.19, 11.12 | 1.51 | 0.69, 3.32 |
| 9 h or more a day | 1.21 | 0.80, 1.84 | 1.16 | 0.80, 1.69 | 0.76 | 0.05, 11.68 | 0.87 | 0.08, 9.10 |
| Cox and Snell R2 | 0.29 | 0.43 | ||||||
| Nagelkerke R2 | 0.33 | 0.50 | ||||||
© 2020 by the authors. Licensee MDPI, Basel, Switzerland. This article is an open access article distributed under the terms and conditions of the Creative Commons Attribution (CC BY) license (http://creativecommons.org/licenses/by/4.0/).
Share and Cite
Kim, N.; Kim, G.-U.; Kim, H. Comparative Study of Dietary Patterns by Living Arrangements: The Korea National Health and Nutrition Examination Survey (KNHANES) 2013–2015. Int. J. Environ. Res. Public Health 2020, 17, 2371. https://0-doi-org.brum.beds.ac.uk/10.3390/ijerph17072371
Kim N, Kim G-U, Kim H. Comparative Study of Dietary Patterns by Living Arrangements: The Korea National Health and Nutrition Examination Survey (KNHANES) 2013–2015. International Journal of Environmental Research and Public Health. 2020; 17(7):2371. https://0-doi-org.brum.beds.ac.uk/10.3390/ijerph17072371
Chicago/Turabian StyleKim, Namhee, Go-Un Kim, and Heejung Kim. 2020. "Comparative Study of Dietary Patterns by Living Arrangements: The Korea National Health and Nutrition Examination Survey (KNHANES) 2013–2015" International Journal of Environmental Research and Public Health 17, no. 7: 2371. https://0-doi-org.brum.beds.ac.uk/10.3390/ijerph17072371