Self-Selected Pacing During a World Record Attempt in 40 Ironman-Distance Triathlons in 40 Days

 ,
,  , and
, and 
Abstract
:1. Introduction
2. Materials and Methods
2.1. Ethical Approval
2.2. Athlete
2.3. Event, Equipment, Support, and Measurements
2.4. Statistical Analysis
3. Results
4. Discussion
4.1. Cycling and Running were Predictive for Overall Race Time, But not Swimming
4.2. The Aspect of Experience and Age
4.3. Sinusoidal Change in Overall Race Time
4.4. The Aspect of Heart Rate and Energy Expenditure
4.5. Energy Expenditure, Loss in Body Mass and Body Weight as Predictor in Performance
4.6. The Influence of Environmental Factors (e.g., Wind Speed and Temperature) and Recovery
4.7. Limitations
4.8. Practical Applications
5. Conclusions
Author Contributions
Funding
Acknowledgments
Conflicts of Interest
References
- Kach, I.W.; Rust, C.A.; Nikolaidis, P.T.; Rosemann, T.; Knechtle, B. The Age-Related Performance Decline in Ironman Triathlon Starts Earlier in Swimming Than in Cycling and Running. J. Strength Cond. Res. 2018, 32, 379–395. [Google Scholar] [CrossRef] [PubMed] [Green Version]
- Knechtle, B.; Knechtle, P.; Lepers, R. Participation and performance trends in ultra-triathlons from 1985 to 2009. Scand. J. Med. Sci. Sports 2011, 21, e82–e90. [Google Scholar] [CrossRef] [PubMed] [Green Version]
- Sousa, C.V.; Nikolaidis, P.T.; Knechtle, B. Ultra-triathlon—Pacing, performance trends, the role of nationality, and sex differences in finishers and non-finishers. Scand. J. Med. Sci. Sports 2019. [Google Scholar] [CrossRef] [PubMed]
- Abbiss, C.R.; Laursen, P.B. Describing and understanding pacing strategies during athletic competition. Sports Med. (Auckl. N. Z.) 2008, 38, 239–252. [Google Scholar] [CrossRef]
- Angehrn, N.; Rust, C.A.; Nikolaidis, P.T.; Rosemann, T.; Knechtle, B. Positive pacing in elite IRONMAN triathletes. Chin. J. Physiol. 2016, 59, 305–314. [Google Scholar] [CrossRef] [Green Version]
- Knechtle, B.; Rosemann, T.; Lepers, R.; Rust, C.A. A comparison of performance of Deca Iron and Triple Deca Iron ultra-triathletes. SpringerPlus 2014, 3, 461. [Google Scholar] [CrossRef] [Green Version]
- Knechtle, B.; Rust, C.A.; Rosemann, T.; Martin, N. 33 Ironman triathlons in 33 days-a case study. SpringerPlus 2014, 3, 269. [Google Scholar] [CrossRef] [Green Version]
- Noakes, T.D. The limits of human endurance: What is the greatest endurance performance of all time? Which factors regulate performance at extreme altitude? Adv. Exp. Med. Biol. 2007, 618, 255–276. [Google Scholar] [CrossRef]
- Murray, A.; Costa, R.J. Born to run. Studying the limits of human performance. Bmc Med. 2012, 10, 76. [Google Scholar] [CrossRef] [Green Version]
- Millet, G.P.; Millet, G.Y. Ultramarathon is an outstanding model for the study of adaptive responses to extreme load and stress. Bmc Med. 2012, 10, 77. [Google Scholar] [CrossRef] [Green Version]
- Schutz, U.H.; Ehrhardt, M.; Beer, M.; Schmidt-Trucksass, A.; Billich, C. Pre-race determinants influencing performance and finishing of a transcontinental 4486-km ultramarathon. J. Sports Med. Phys. Fit. 2019, 59, 1608–1621. [Google Scholar] [CrossRef] [PubMed]
- Détails du Parcours (1 Étape = 100 kms). Available online: http://patrickmalandain-ultrarun.com/parcours-10000km (accessed on 31 March 2020).
- Traverser les Etats-Unis puis le Canada. Available online: http://patrickmalandain-ultrarun.com/#us (accessed on 31 March 2020).
- 40x Ultra Triathlon Statistics by Disciplines and Days. Available online: https://raitratasepp.ee/blog/40x-ultra-triathlon-statistics-by-disciplines-and-days (accessed on 31 March 2020).
- 40-Kordse Ultratriatloni Statistika Alade ja Päevade Lõikes. Available online: https://raitratasepp.ee/blog/40-kordse-ultratriatloni-statistika-alade-ja-paevade-loikes (accessed on 31 March 2020).
- GARMIN. Available online: www.garmin.com (accessed on 31 March 2020).
- Available online: www.playitas.net (accessed on 31 March 2020).
- Available online: www.zone3-store.de (accessed on 31 March 2020).
- Trekbikes. Available online: www.trekbikes.com/ca/en_CA/equipment/cycling-components/bike-wheels/road-bike-wheels/bontrager-race-tlr-road-wheel/p/11063/ (accessed on 31 March 2020).
- www.saucony.com. Available online: www.saucony.com (accessed on 31 March 2020).
- HOKAoneone. Available online: www.hokaoneone.eu (accessed on 31 March 2020).
- Fuerteventura Weather in October—Still Fells Like Summer. Available online: www.guidetocanaryislands.com/fuerteventura-weather-october) (accessed on 31 March 2020).
- Available online: www.aemet.es/en/eltiempo/prediccion/municipios/tuineje-id35030 (accessed on 31 March 2020).
- Enervit. Available online: https://saku.ee/et/products/vichy/vichy-vitamin-energy/?Ckey=30433 (accessed on 31 March 2020).
- www.enervit.com. Available online: www.enervit.com (accessed on 31 March 2020).
- Barbosa, L.P.; Sousa, C.V.; Sales, M.M.; Olher, R.R.; Aguiar, S.S.; Santos, P.A.; Tiozzo, E.; Simões, H.G.; Nikolaidis, P.T.; Knechtle, B. Celebrating 40 years of ironman: How the champions perform. Int. J. Environ. Res. Public Health 2019, 16, 1019. [Google Scholar] [CrossRef] [PubMed] [Green Version]
- Sousa, C.V.; Barbosa, L.P.; Sales, M.M.; Santos, P.A.; Tiozzo, E.; Simões, H.G.; Nikolaidis, P.T.; Knechtle, B. Cycling as the Best Sub-8-Hour Performance Predictor in Full Distance Triathlon. Sports 2019, 7, 24. [Google Scholar] [CrossRef] [PubMed] [Green Version]
- Knechtle, B.; de Sousa, C.V.; Simoes, H.G.; Rosemann, T.; Nikolaidis, P.T. Effects of The Performance Level and Race Distance on Pacing in Ultra-Triathlons. J. Hum. Kinet. 2019, 67, 247–258. [Google Scholar] [CrossRef] [Green Version]
- Knechtle, B.; Duff, B.; Amtmann, G.; Kohler, G. Cycling and running performance, not anthropometric factors, are associated with race performance in a Triple Iron Triathlon. Res. Sports Med. (Print) 2007, 15, 257–269. [Google Scholar] [CrossRef]
- Lepers, R.; Knechtle, B.; Knechtle, P.; Rosemann, T. Analysis of ultra-triathlon performances. Open Access J. Sports Med. 2011, 2, 131–136. [Google Scholar] [CrossRef] [Green Version]
- Knechtle, B.; Kach, I.; Rosemann, T.; Nikolaidis, P.T. The effect of sex, age and performance level on pacing of Ironman triathletes. Res. Sports Med. (Print) 2019, 27, 99–111. [Google Scholar] [CrossRef]
- Knechtle, B.; Kohler, G. Running performance, not anthropometric factors, is associated with race success in a Triple Iron Triathlon. Br. J. Sports Med. 2009, 43, 437–441. [Google Scholar] [CrossRef] [Green Version]
- Knechtle, B.; Wirth, A.; Rosemann, T. Predictors of race time in male Ironman triathletes: Physical characteristics, training, or prerace experience? Percept. Mot. Ski. 2010, 111, 437–446. [Google Scholar] [CrossRef] [Green Version]
- Knechtle, B.; Zingg, M.A.; Rosemann, T.; Rust, C.A. The aspect of experience in ultra-triathlon races. SpringerPlus 2015, 4, 278. [Google Scholar] [CrossRef] [Green Version]
- Knechtle, B.; Zingg, M.A.; Rosemann, T.; Stiefel, M.; Rust, C.A. What predicts performance in ultra-triathlon races? A comparison between Ironman distance triathlon and ultra-triathlon. Open Access J. Sports Med. 2015, 6, 149–159. [Google Scholar] [CrossRef] [PubMed] [Green Version]
- Herbst, L.; Knechtle, B.; Lopez, C.L.; Andonie, J.L.; Fraire, O.S.; Kohler, G.; Rust, C.A.; Rosemann, T. Pacing Strategy and Change in Body Composition during a Deca Iron Triathlon. Chin. J. Physiol. 2011, 54, 255–263. [Google Scholar] [CrossRef] [PubMed]
- Knechtle, B.; Knechtle, P.; Rosemann, T.; Senn, O. Personal best time, not anthropometry or training volume, is associated with total race time in a triple iron triathlon. J. Strength Cond. Res. 2011, 25, 1142–1150. [Google Scholar] [CrossRef] [PubMed]
- Knechtle, R.; Rust, C.A.; Rosemann, T.; Knechtle, B. The best triathletes are older in longer race distances—A comparison between Olympic, Half-Ironman and Ironman distance triathlon. SpringerPlus 2014, 3, 538. [Google Scholar] [CrossRef] [Green Version]
- Gallmann, D.; Knechtle, B.; Rust, C.A.; Rosemann, T.; Lepers, R. Elite triathletes in ’Ironman Hawaii’ get older but faster. Age (Dordr. Neth.) 2014, 36, 407–416. [Google Scholar] [CrossRef]
- Meggs, J.; Chen, M.A.; Koehn, S. Relationships Between Flow, Mental Toughness, and Subjective Performance Perception in Various Triathletes. Percept. Mot. Ski. 2019, 126, 241–252. [Google Scholar] [CrossRef]
- Wu, S.S.; Peiffer, J.J.; Brisswalter, J.; Nosaka, K.; Abbiss, C.R. Factors influencing pacing in triathlon. Open Access J. Sports Med. 2014, 5, 223–234. [Google Scholar] [CrossRef] [Green Version]
- Parry, D.; Chinnasamy, C.; Papadopoulou, E.; Noakes, T.; Micklewright, D. Cognition and performance: Anxiety, mood and perceived exertion among Ironman triathletes. Br. J. Sports Med. 2011, 45, 1088–1094. [Google Scholar] [CrossRef]
- Knechtle, B.; Muller, G.; Willmann, F.; Kotteck, K.; Eser, P.; Knecht, H. Fat oxidation in men and women endurance athletes in running and cycling. Int. J. Sports Med. 2004, 25, 38–44. [Google Scholar] [CrossRef]
- Pasadyn, S.R.; Soudan, M.; Gillinov, M.; Houghtaling, P.; Phelan, D.; Gillinov, N.; Bittel, B.; Desai, M.Y. Accuracy of commercially available heart rate monitors in athletes: A prospective study. Cardiovasc. Diagn. Ther. 2019, 9, 379–385. [Google Scholar] [CrossRef]
- Shcherbina, A.; Mattsson, C.M.; Waggott, D.; Salisbury, H.; Christle, J.W.; Hastie, T.; Wheeler, M.T.; Ashley, E.A. Accuracy in Wrist-Worn, Sensor-Based Measurements of Heart Rate and Energy Expenditure in a Diverse Cohort. J. Pers. Med. 2017, 7, 3. [Google Scholar] [CrossRef] [PubMed]
- Price, K.; Bird, S.R.; Lythgo, N.; Raj, I.S.; Wong, J.Y.; Lynch, C. Validation of the Fitbit One, Garmin Vivofit and Jawbone UP activity tracker in estimation of energy expenditure during treadmill walking and running. J. Med. Eng. Technol. 2017, 41, 208–215. [Google Scholar] [CrossRef] [PubMed]
- Knechtle, B.; Knechtle, P.; Schuck, R.; Andonie, J.L.; Kohler, G. Effects of a Deca Iron Triathlon on body composition: A case study. Int. J. Sports Med. 2008, 29, 343–351. [Google Scholar] [CrossRef] [PubMed]
- Kimber, N.E.; Ross, J.J.; Mason, S.L.; Speedy, D.B. Energy balance during an ironman triathlon in male and female triathletes. Int. J. Sport Nutr. Exerc. Metab. 2002, 12, 47–62. [Google Scholar] [CrossRef] [PubMed]
- Barrero, A.; Erola, P.; Bescos, R. Energy balance of triathletes during an ultra-endurance event. Nutrients 2014, 7, 209–222. [Google Scholar] [CrossRef] [Green Version]
- Mueller, S.M.; Anliker, E.; Knechtle, P.; Knechtle, B.; Toigo, M. Changes in body composition in triathletes during an Ironman race. Eur. J. Appl. Physiol. 2013, 113, 2343–2352. [Google Scholar] [CrossRef]
- Knechtle, B.; Baumann, B.; Wirth, A.; Knechtle, P.; Rosemann, T. Male ironman triathletes lose skeletal muscle mass. Asia Pac. J. Clin. Nutr. 2010, 19, 91–97. [Google Scholar]
- Knechtle, B.; Knechtle, P.; Rosemann, T.; Oliver, S. ATriple Iron triathlon leads to a decrease in total body mass but not to dehydration. Res. Q. Exerc. Sport 2010, 81, 319–327. [Google Scholar] [CrossRef]
- Knechtle, B.; Duff, B.; Amtmann, G.; Kohler, G. An ultratriathlon leads to a decrease of body fat and skeletal muscle mass--the Triple Iron Triathlon Austria 2006. Res. Sports Med. (Print) 2008, 16, 97–110. [Google Scholar] [CrossRef]
- Knechtle, B.; Salas Fraire, O.; Andonie, J.L.; Kohler, G. Effect of a multistage ultra-endurance triathlon on body composition: World Challenge Deca Iron Triathlon 2006. Br. J. Sports Med. 2008, 42, 121–125, discussion 125. [Google Scholar] [CrossRef] [Green Version]
- Knechtle, B.; Schwanke, M.; Knechtle, P.; Kohler, G. Decrease in body fat during an ultra-endurance triathlon is associated with race intensity. Br. J. Sports Med. 2008, 42, 609–613. [Google Scholar] [CrossRef] [PubMed] [Green Version]
- Knechtle, B.; Morales, N.P.; Gonzalez, E.R.; Gutierrez, A.A.; Sevilla, J.N.; Gomez, R.A.; Robledo, A.R.; Rodriguez, A.L.; Fraire, O.S.; Andonie, J.L.; et al. Effect of a multistage ultraendurance triathlon on aldosterone, vasopressin, extracellular water and urine electrolytes. Scott. Med. J. 2012, 57, 26–32. [Google Scholar] [CrossRef] [PubMed] [Green Version]
- Knechtle, B.; Knechtle, P.; Andonie, J.L.; Kohler, G. Body composition, energy, and fluid turnover in a five-day multistage ultratriathlon: A case study. Res. Sports Med. (Print) 2009, 17, 104–120. [Google Scholar] [CrossRef] [PubMed] [Green Version]
- Sousa, C.V.; Aguiar, S.D.S.; Olher, R.D.R.; Sales, M.M.; de Moraes, M.R.; Nikolaidis, P.T.; Rosemann, T.; Knechtle, B.; Simoes, H.G. Hydration Status After an Ironman Triathlon: A Meta-Analysis. J. Hum. Kinet. 2019, 70, 93–102. [Google Scholar] [CrossRef] [Green Version]
- Rust, C.A.; Knechtle, B.; Knechtle, P.; Rosemann, T.; Lepers, R. Personal best times in an Olympic distance triathlon and in a marathon predict Ironman race time in recreational male triathletes. Open Access J. Sports Med. 2011, 2, 121–129. [Google Scholar] [CrossRef] [Green Version]
- Knechtle, B.; Knechtle, P.; Wirth, A.; Alexander Rust, C.; Rosemann, T. A faster running speed is associated with a greater body weight loss in 100-km ultra-marathoners. J. Sports Sci. 2012, 30, 1131–1140. [Google Scholar] [CrossRef] [Green Version]
- Barandun, U.; Knechtle, B.; Knechtle, P.; Klipstein, A.; Rust, C.A.; Rosemann, T.; Lepers, R. Running speed during training and percent body fat predict race time in recreational male marathoners. Open Access J. Sports Med. 2012, 3, 51–58. [Google Scholar] [CrossRef] [Green Version]
- Melin, B.; Savourey, G. [Sports and extreme conditions. Cardiovascular incidence in long term exertion and extreme temperatures (heat, cold)]. La Rev. Du Prat. 2001, 51, S28–S30. [Google Scholar]
- Knechtle, B.; Bragazzi, N.L.; Rosemann, T.; Rust, C.A. Pacing in a self-paced world record attempt in 24-h road cycling. SpringerPlus 2015, 4, 650. [Google Scholar] [CrossRef] [Green Version]
- Hermand, E.; Chabert, C.; Hue, O. Ultra-endurance events in tropical environments and countermeasures to optimize performances and health. Int. J. Hyperth. Off. J. Eur. Soc. Hyperthermic Oncol. North. Am. Hyperth. Group 2019, 36, 753–760. [Google Scholar] [CrossRef] [Green Version]
- Olcina, G.; Crespo, C.; Timon, R.; Mjaanes, J.M.; Calleja-Gonzalez, J. Core Temperature Response During the Marathon Portion of the Ironman World Championship (Kona-Hawaii). Front. Physiol. 2019, 10, 1469. [Google Scholar] [CrossRef] [PubMed] [Green Version]
- VanHelder, T.; Radomski, M.W. Sleep deprivation and the effect on exercise performance. Sports Med. (Auckl. N. Z.) 1989, 7, 235–247. [Google Scholar] [CrossRef] [PubMed]
- Hew-Butler, T.; Holexa, B.T.; Fogard, K.; Stuempfle, K.J.; Hoffman, M.D. Comparison of body composition techniques before and after a 161-km ultramarathon using DXA, BIS and BIA. Int. J. Sports Med. 2015, 36, 169–174. [Google Scholar] [CrossRef] [PubMed]
- Fisher, M.A.; Penn, R.D. Evidence for changes in segmental motoneurone pools by chronic cerebellar stimulation and its clinical significance. J. Neurol. Neurosurg. Psychiatry 1978, 41, 630–635. [Google Scholar] [CrossRef] [PubMed] [Green Version]
- Schutz, U.H.; Billich, C.; Konig, K.; Wurslin, C.; Wiedelbach, H.; Brambs, H.J.; Machann, J. Characteristics, changes and influence of body composition during a 4486 km transcontinental ultramarathon: Results from the TransEurope FootRace mobile whole body MRI-project. Bmc Med. 2013, 11, 122. [Google Scholar] [CrossRef] [PubMed] [Green Version]
- Boynton, J.R.; Danner, F.; Menaspa, P.; Peiffer, J.J.; Abbiss, C.R. Effect of Environmental Temperature on High-Intensity Intervals in Well-Trained Cyclists. Int. J. Sports Physiol. Perform. 2019, 1–7. [Google Scholar] [CrossRef]
- Abbiss, C.R.; Quod, M.J.; Martin, D.T.; Netto, K.J.; Nosaka, K.; Lee, H.; Surriano, R.; Bishop, D.; Laursen, P.B. Dynamic pacing strategies during the cycle phase of an Ironman triathlon. Med. Sci. Sports Exerc. 2006, 38, 726–734. [Google Scholar] [CrossRef] [Green Version]
- Costa, R.J.S.; Hoffman, M.D.; Stellingwerff, T. Considerations for ultra-endurance activities: Part 1- nutrition. Res. Sports Med. (Print) 2019, 27, 166–181. [Google Scholar] [CrossRef]


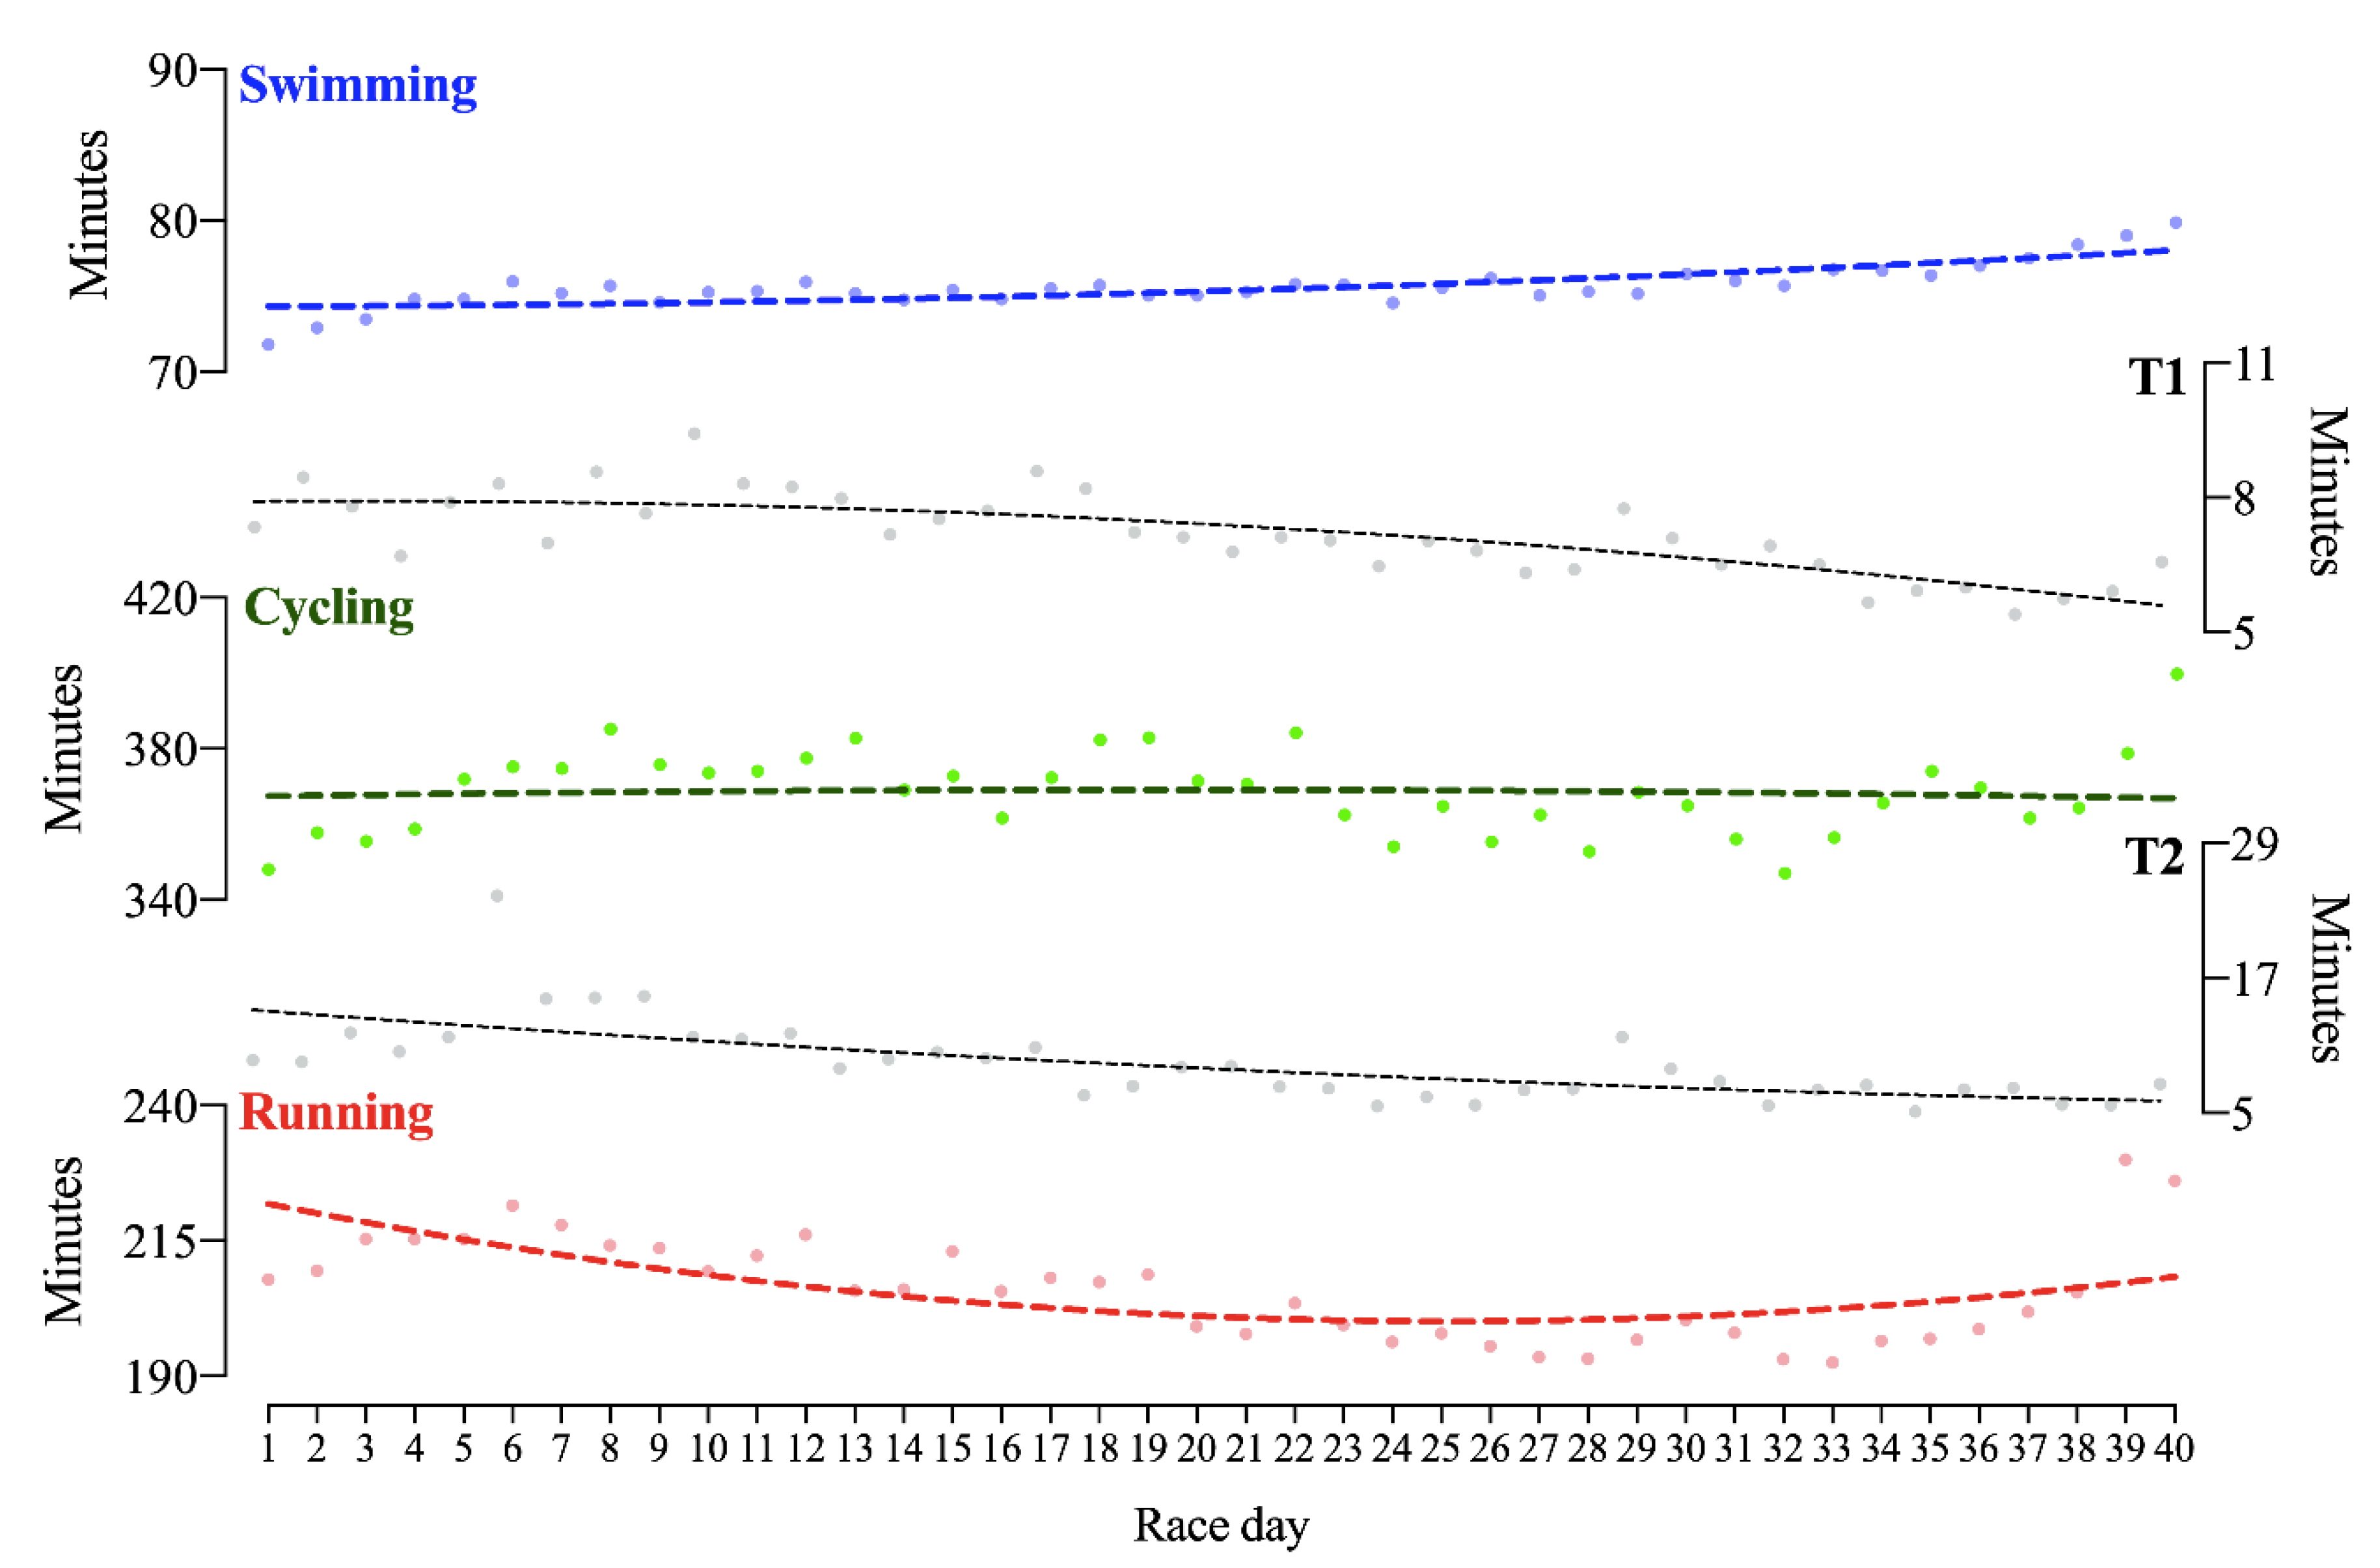
| Times | Mean (±SD) | Min–Max | CV | R2 |
|---|---|---|---|---|
| Swimming split time | 75.6 (1.4) | 71.8–79.9 | 1.9 | 0.63 |
| Cycling split time | 368.4 (11.3) | 347.0–399.8 | 3.1 | 0.00 |
| Running split time | 205.9 (9.5) | 192.6–230.0 | 4.6 | 0.41 |
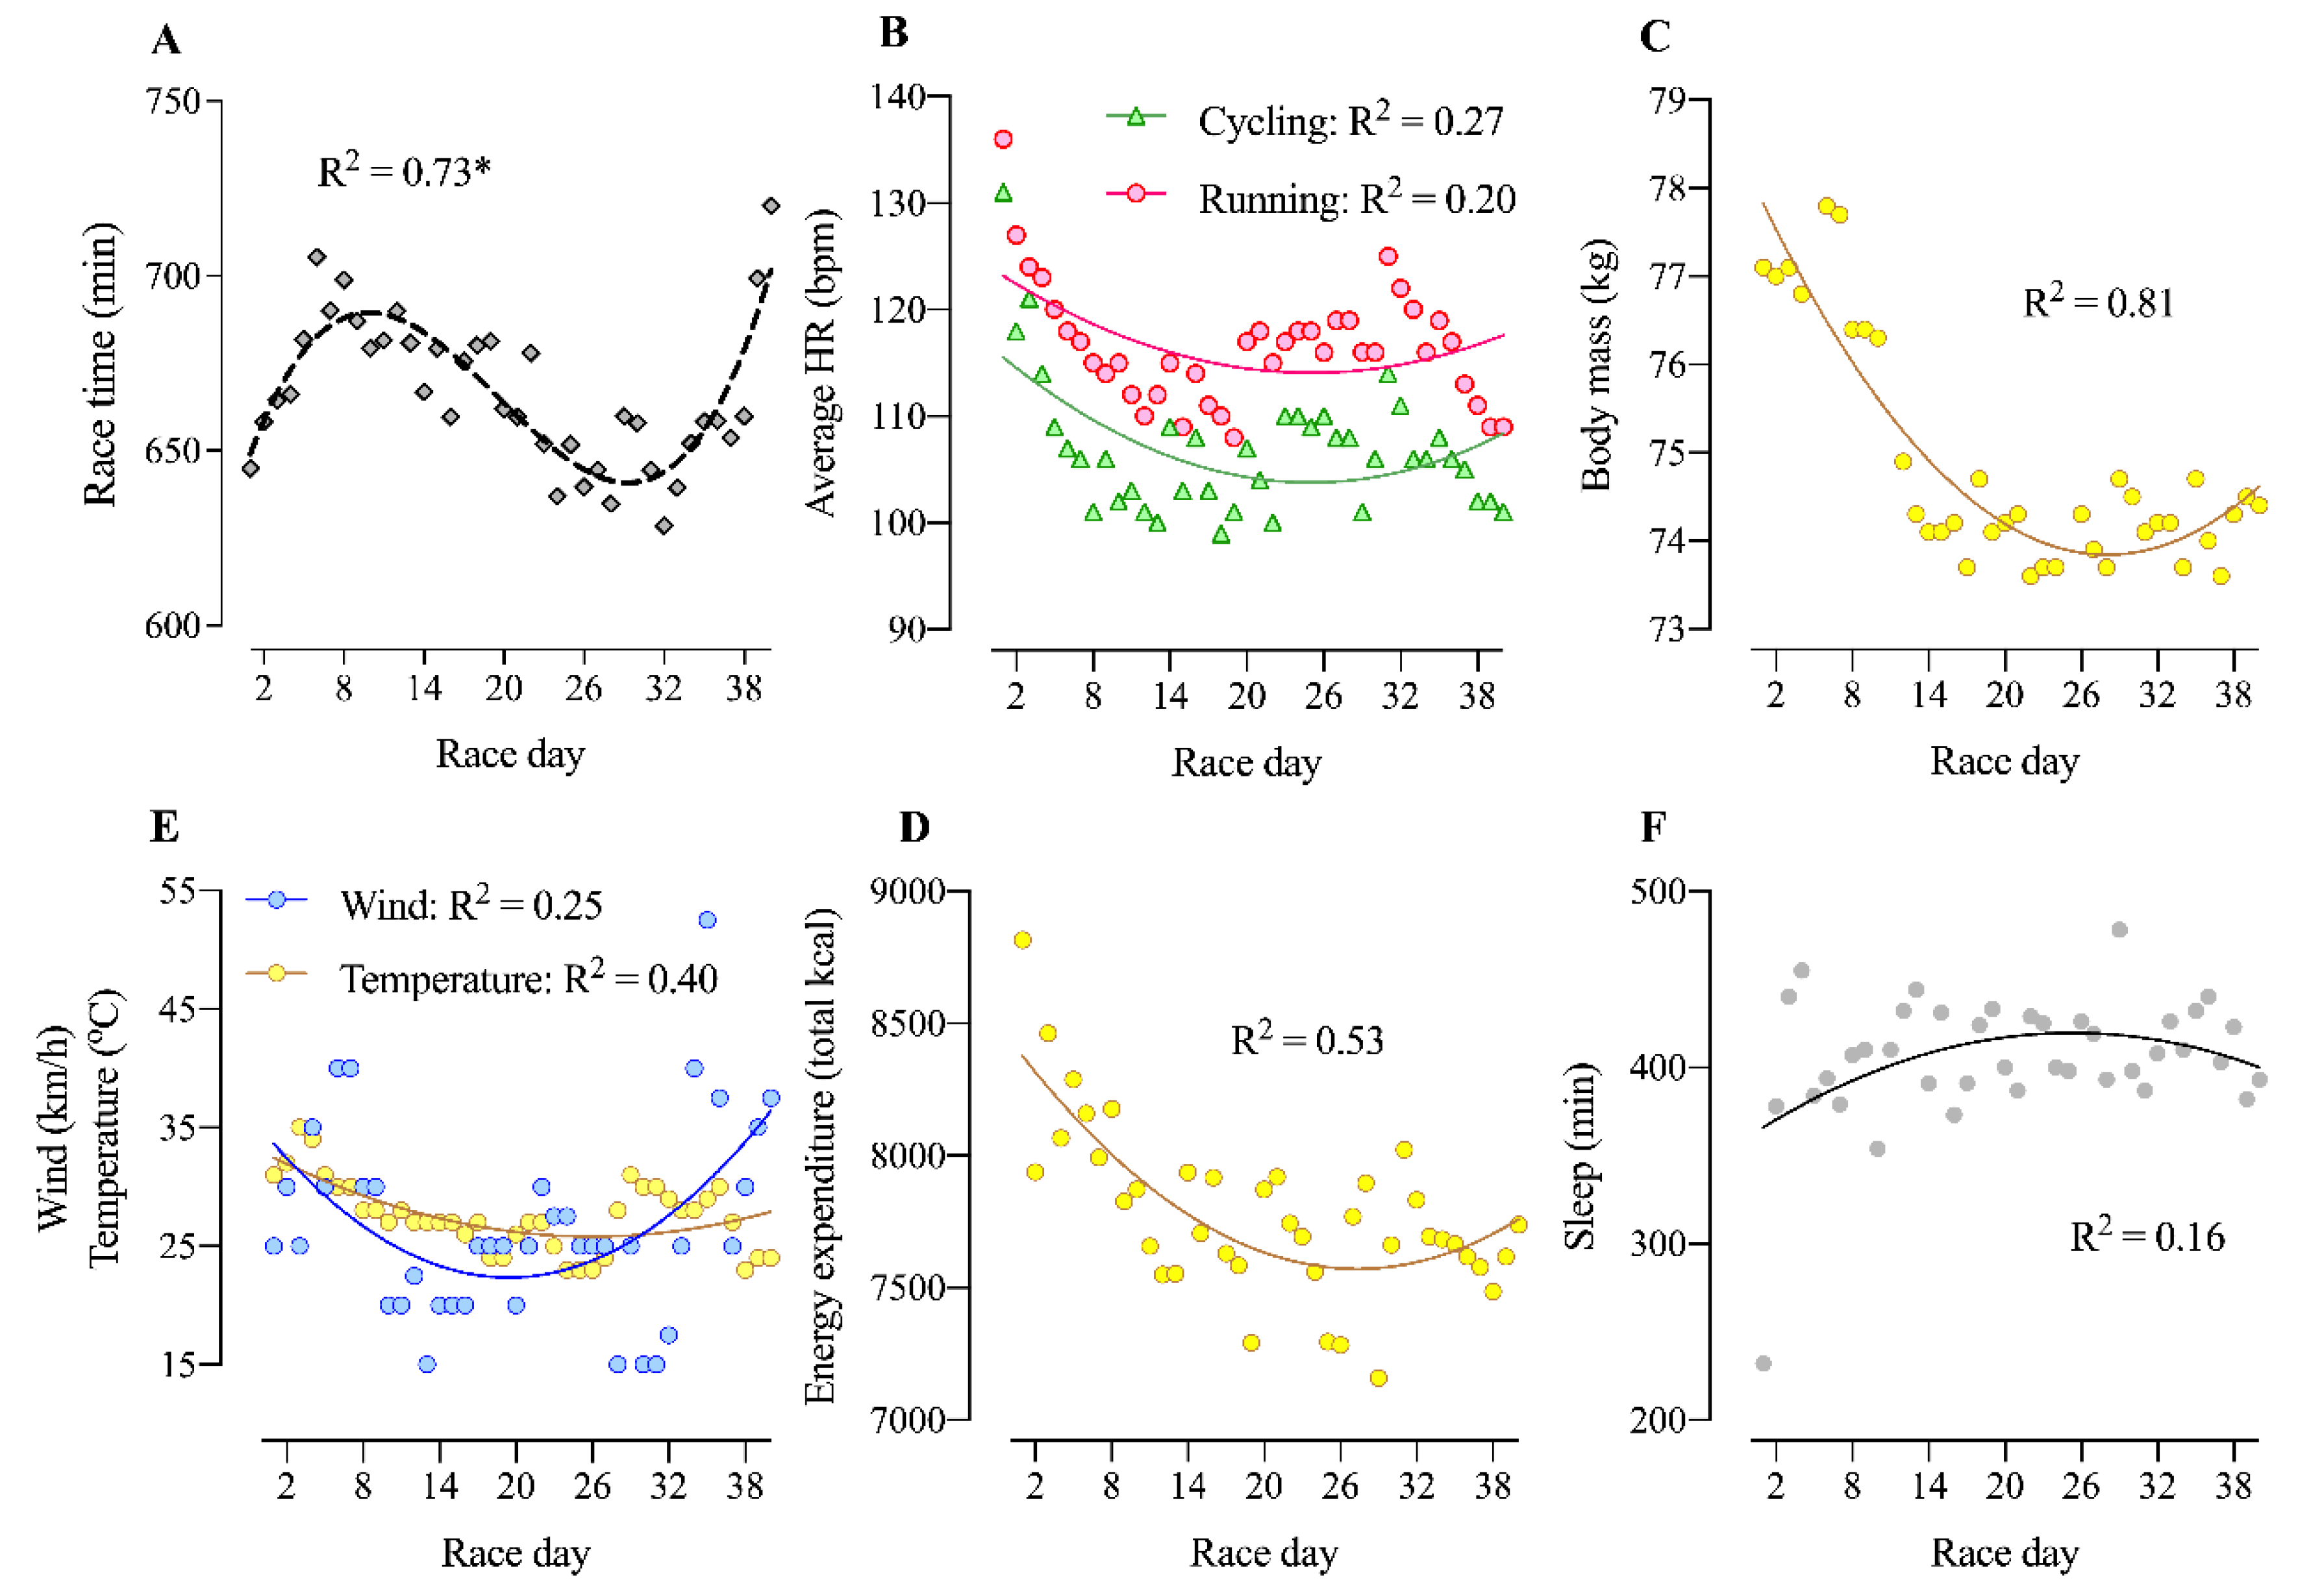
| Overall time | 666.5 (21.0) | 628.5–720.0 | 3.1 | 0.13 |
| Measured Variables | Mean (±SD) | Min–Max |
|---|---|---|
| Energy expenditure (total kcal) | 7780.2 (319.5) | 7159.0–8815.0 |
| Average heart rate in cycling (bpm) | 106.9 (6.3) | 99.0–131.0 |
| Average heart rate in running (bpm) | 116.5 (5.6) | 108.0–136.0 |
| Sleep duration (min) | 405.5 (37.6) | 232.0–478.0 |
| Morning body weight (kg) | 74.8 (1.3) | 73.6–77.8 |
| Independent Variables | Standardized β | p-Value | |
|---|---|---|---|
| Model 1 Swimming | Sleep time | −0.09 | 0.59 |
| Body weight | −0.46 | 0.06 | |
| Wind speed | 0.47 | 0.01 | |
| Overall time previous day | 0.10 | 0.57 | |
| Temperature | −0.18 | 0.40 | |
| Model 2 Cycling | Swimming time | −0.01 | 0.96 |
| Sleep time | 0.04 | 0.68 | |
| Body weight | −0.08 | 0.57 | |
| Wind speed | 0.29 | 0.01 | |
| Overall time previous day | 0.51 | <0.01 | |
| Temperature | 0.12 | 0.33 | |
| Average heart rate | −0.61 | <0.01 | |
| Model 3 Running | Swimming time | 0.221 | 0.12 |
| Cycling time | 0.11 | 0.53 | |
| Sleep time | −0.13 | 0.25 | |
| Body weight | 0.64 | <0.01 | |
| Wind speed | −0.01 | 0.97 | |
| Overall time previous day | 0.08 | 0.61 | |
| Temperature | 0.19 | 0.25 | |
| Average heart rate | −0.50 | 0.02 | |
| Model 4 Overall | Swimming time | 0.04 | 0.29 |
| Cycling time | 0.60 | <0.01 | |
| Running time | 0.45 | <0.01 | |
| Sleep time | −0.01 | 0.71 | |
| Body weight | 0.14 | 0.01 | |
| Wind speed | −0.05 | 0.14 | |
| Overall time previous day | 0.02 | 0.69 | |
| Energy expenditure | 0.00 | 0.99 | |
| Temperature | 0.02 | 0.59 |
© 2020 by the authors. Licensee MDPI, Basel, Switzerland. This article is an open access article distributed under the terms and conditions of the Creative Commons Attribution (CC BY) license (http://creativecommons.org/licenses/by/4.0/).
Share and Cite
Sousa, C.V.; Pereira, R.W.; Rosemann, T.; Nikolaidis, P.T.; Knechtle, B. Self-Selected Pacing During a World Record Attempt in 40 Ironman-Distance Triathlons in 40 Days. Int. J. Environ. Res. Public Health 2020, 17, 2390. https://0-doi-org.brum.beds.ac.uk/10.3390/ijerph17072390
Sousa CV, Pereira RW, Rosemann T, Nikolaidis PT, Knechtle B. Self-Selected Pacing During a World Record Attempt in 40 Ironman-Distance Triathlons in 40 Days. International Journal of Environmental Research and Public Health. 2020; 17(7):2390. https://0-doi-org.brum.beds.ac.uk/10.3390/ijerph17072390
Chicago/Turabian StyleSousa, Caio Victor, Rinaldo Wellerson Pereira, Thomas Rosemann, Pantelis T. Nikolaidis, and Beat Knechtle. 2020. "Self-Selected Pacing During a World Record Attempt in 40 Ironman-Distance Triathlons in 40 Days" International Journal of Environmental Research and Public Health 17, no. 7: 2390. https://0-doi-org.brum.beds.ac.uk/10.3390/ijerph17072390